
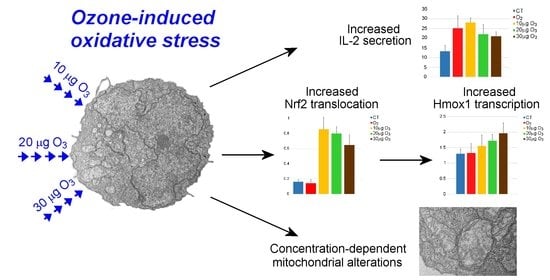
Low Ozone Concentrations Affect the Structural and Functional Features of Jurkat T Cells


 ,
, 
Abstract
1. Introduction
2. Materials and Methods
2.1. Cell Culture and Treatment
2.2. Cell Viability
2.3. Cell Growth
2.4. Transmission Electron Microscopy
2.5. Quantitative Real-Time Polymerase Chain Reaction
2.6. IL-2 and IFN-γ Secretion
2.7. Statistical Analyses
3. Results
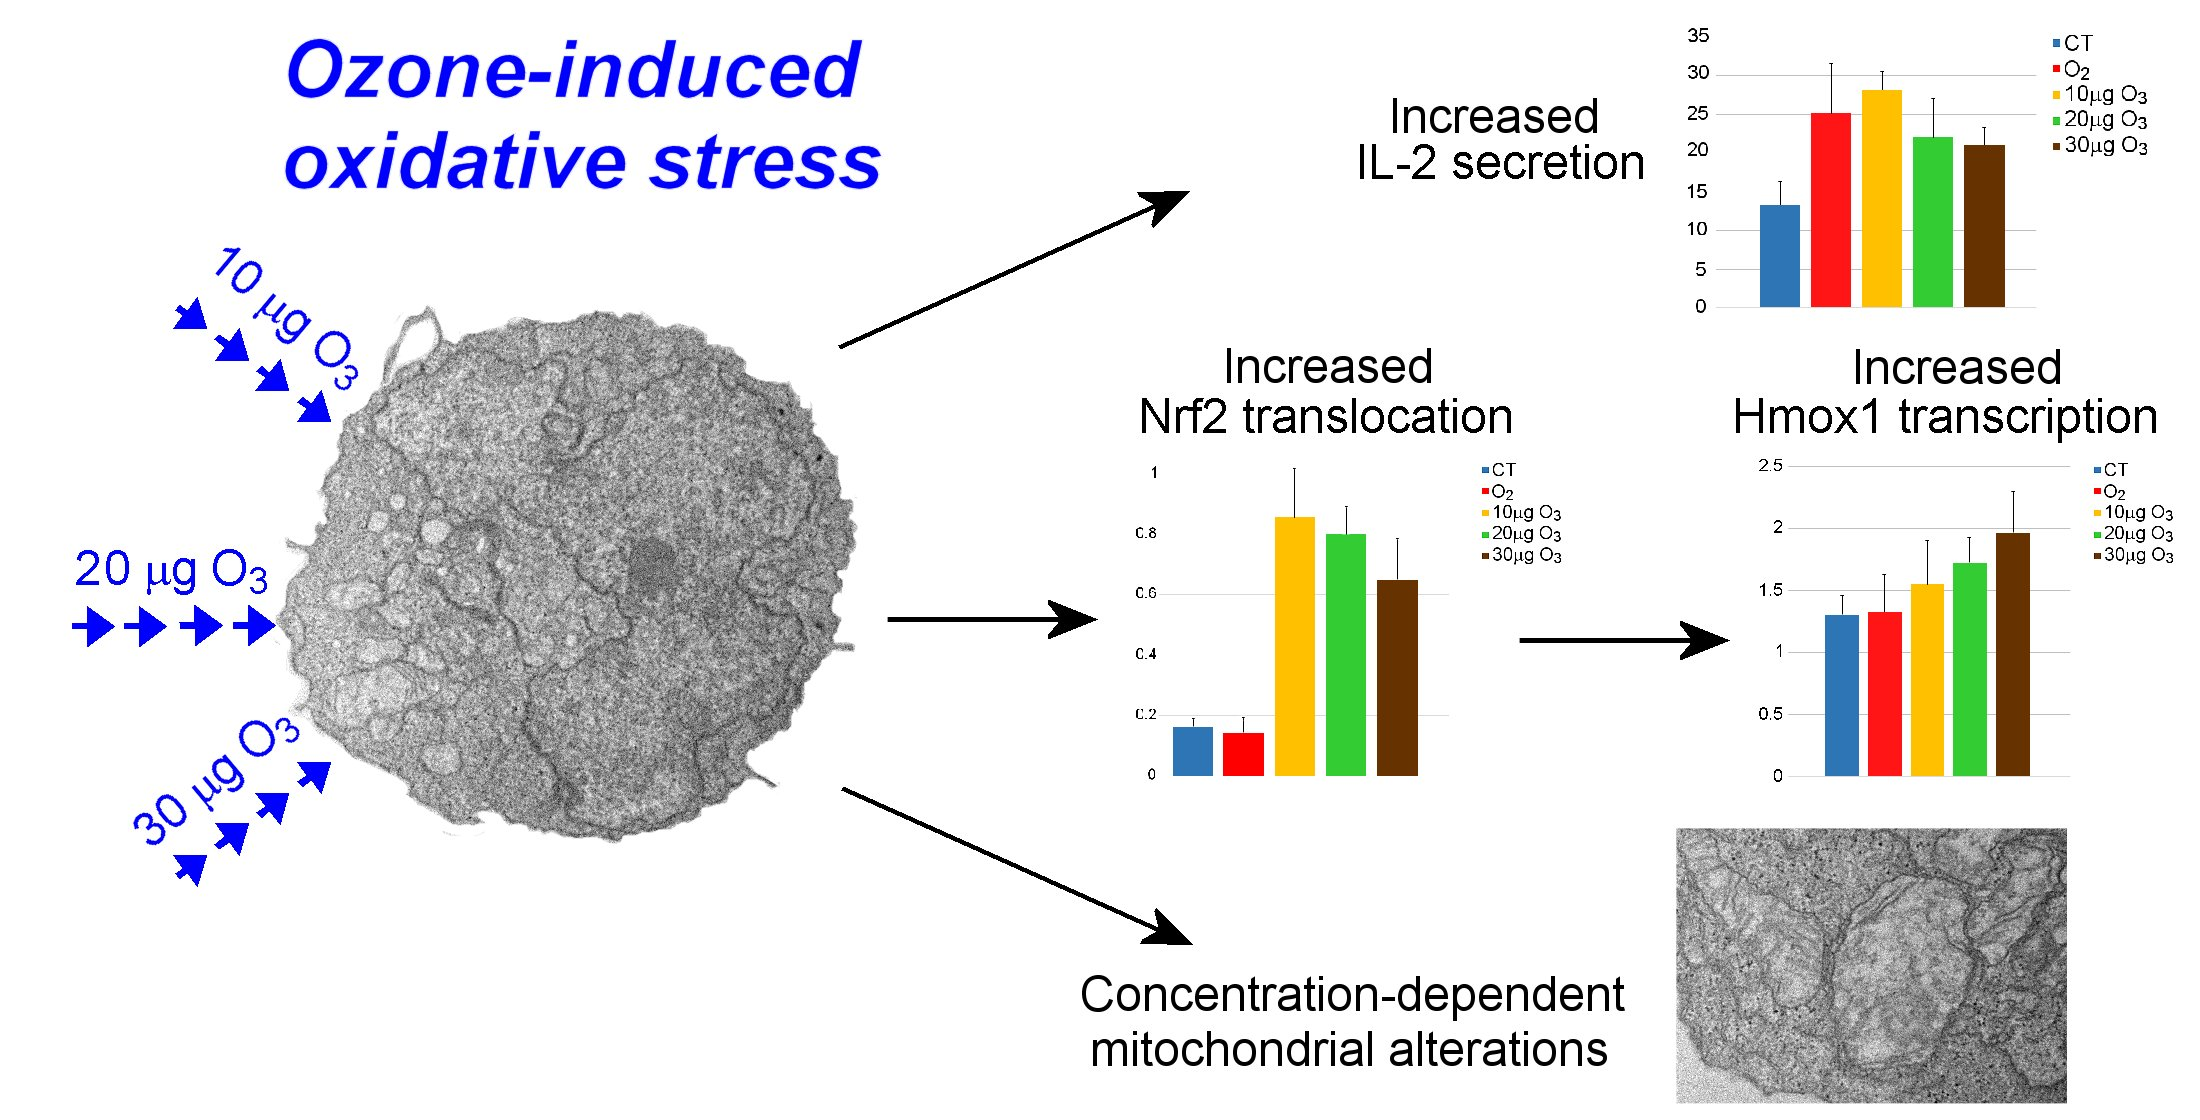
3.1. Cell Viability
3.2. Cell Growth
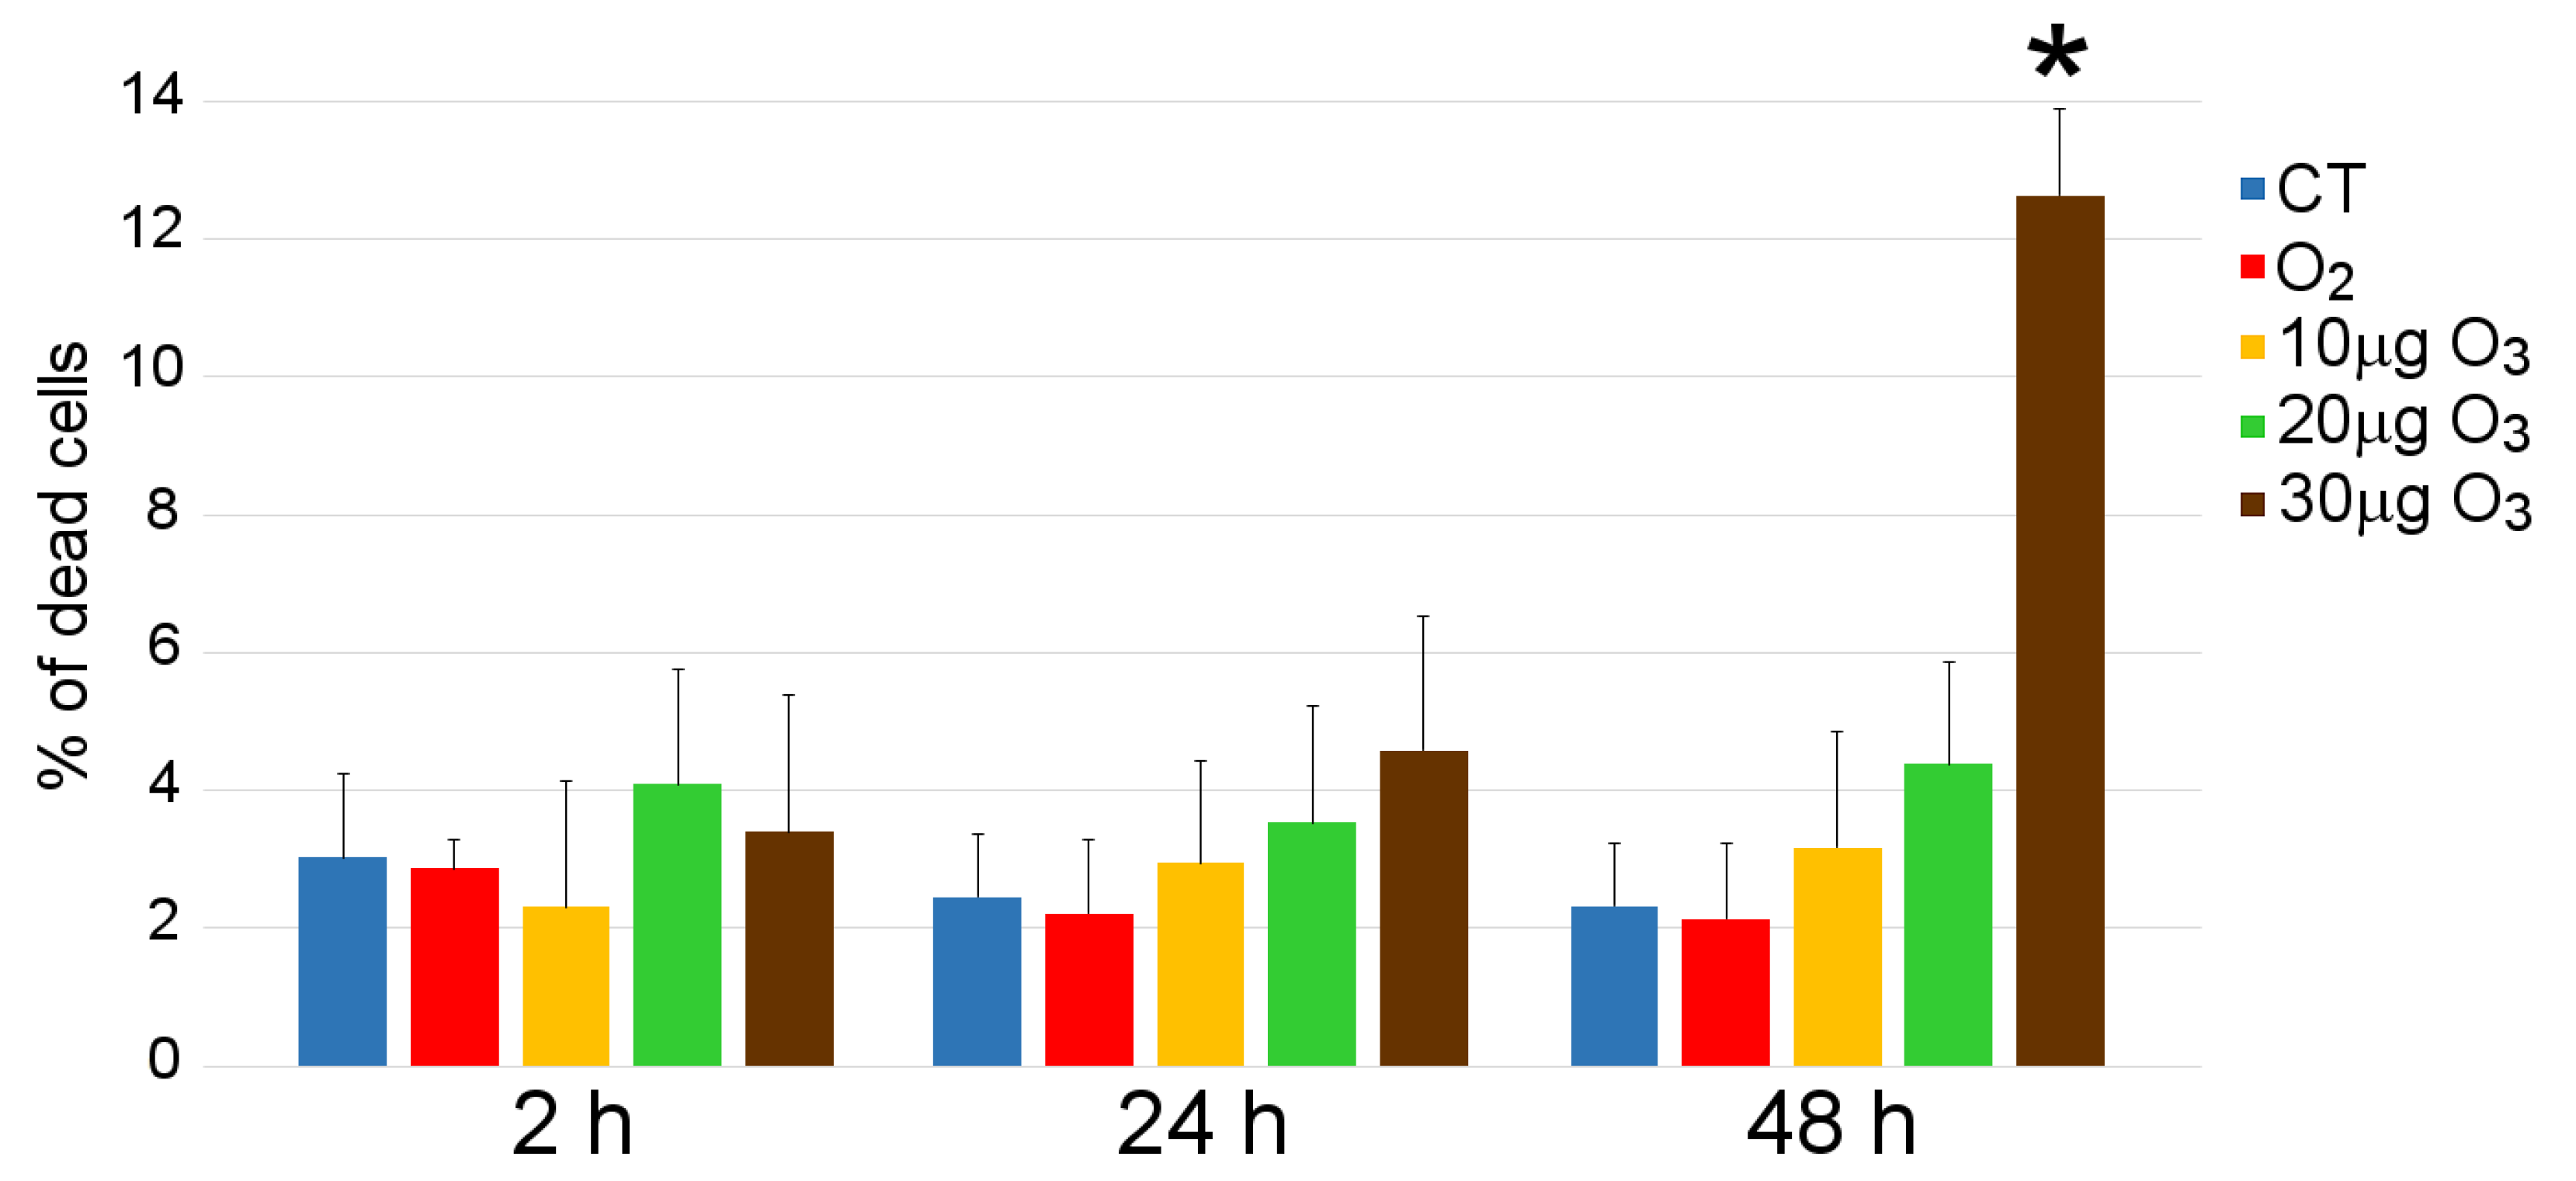
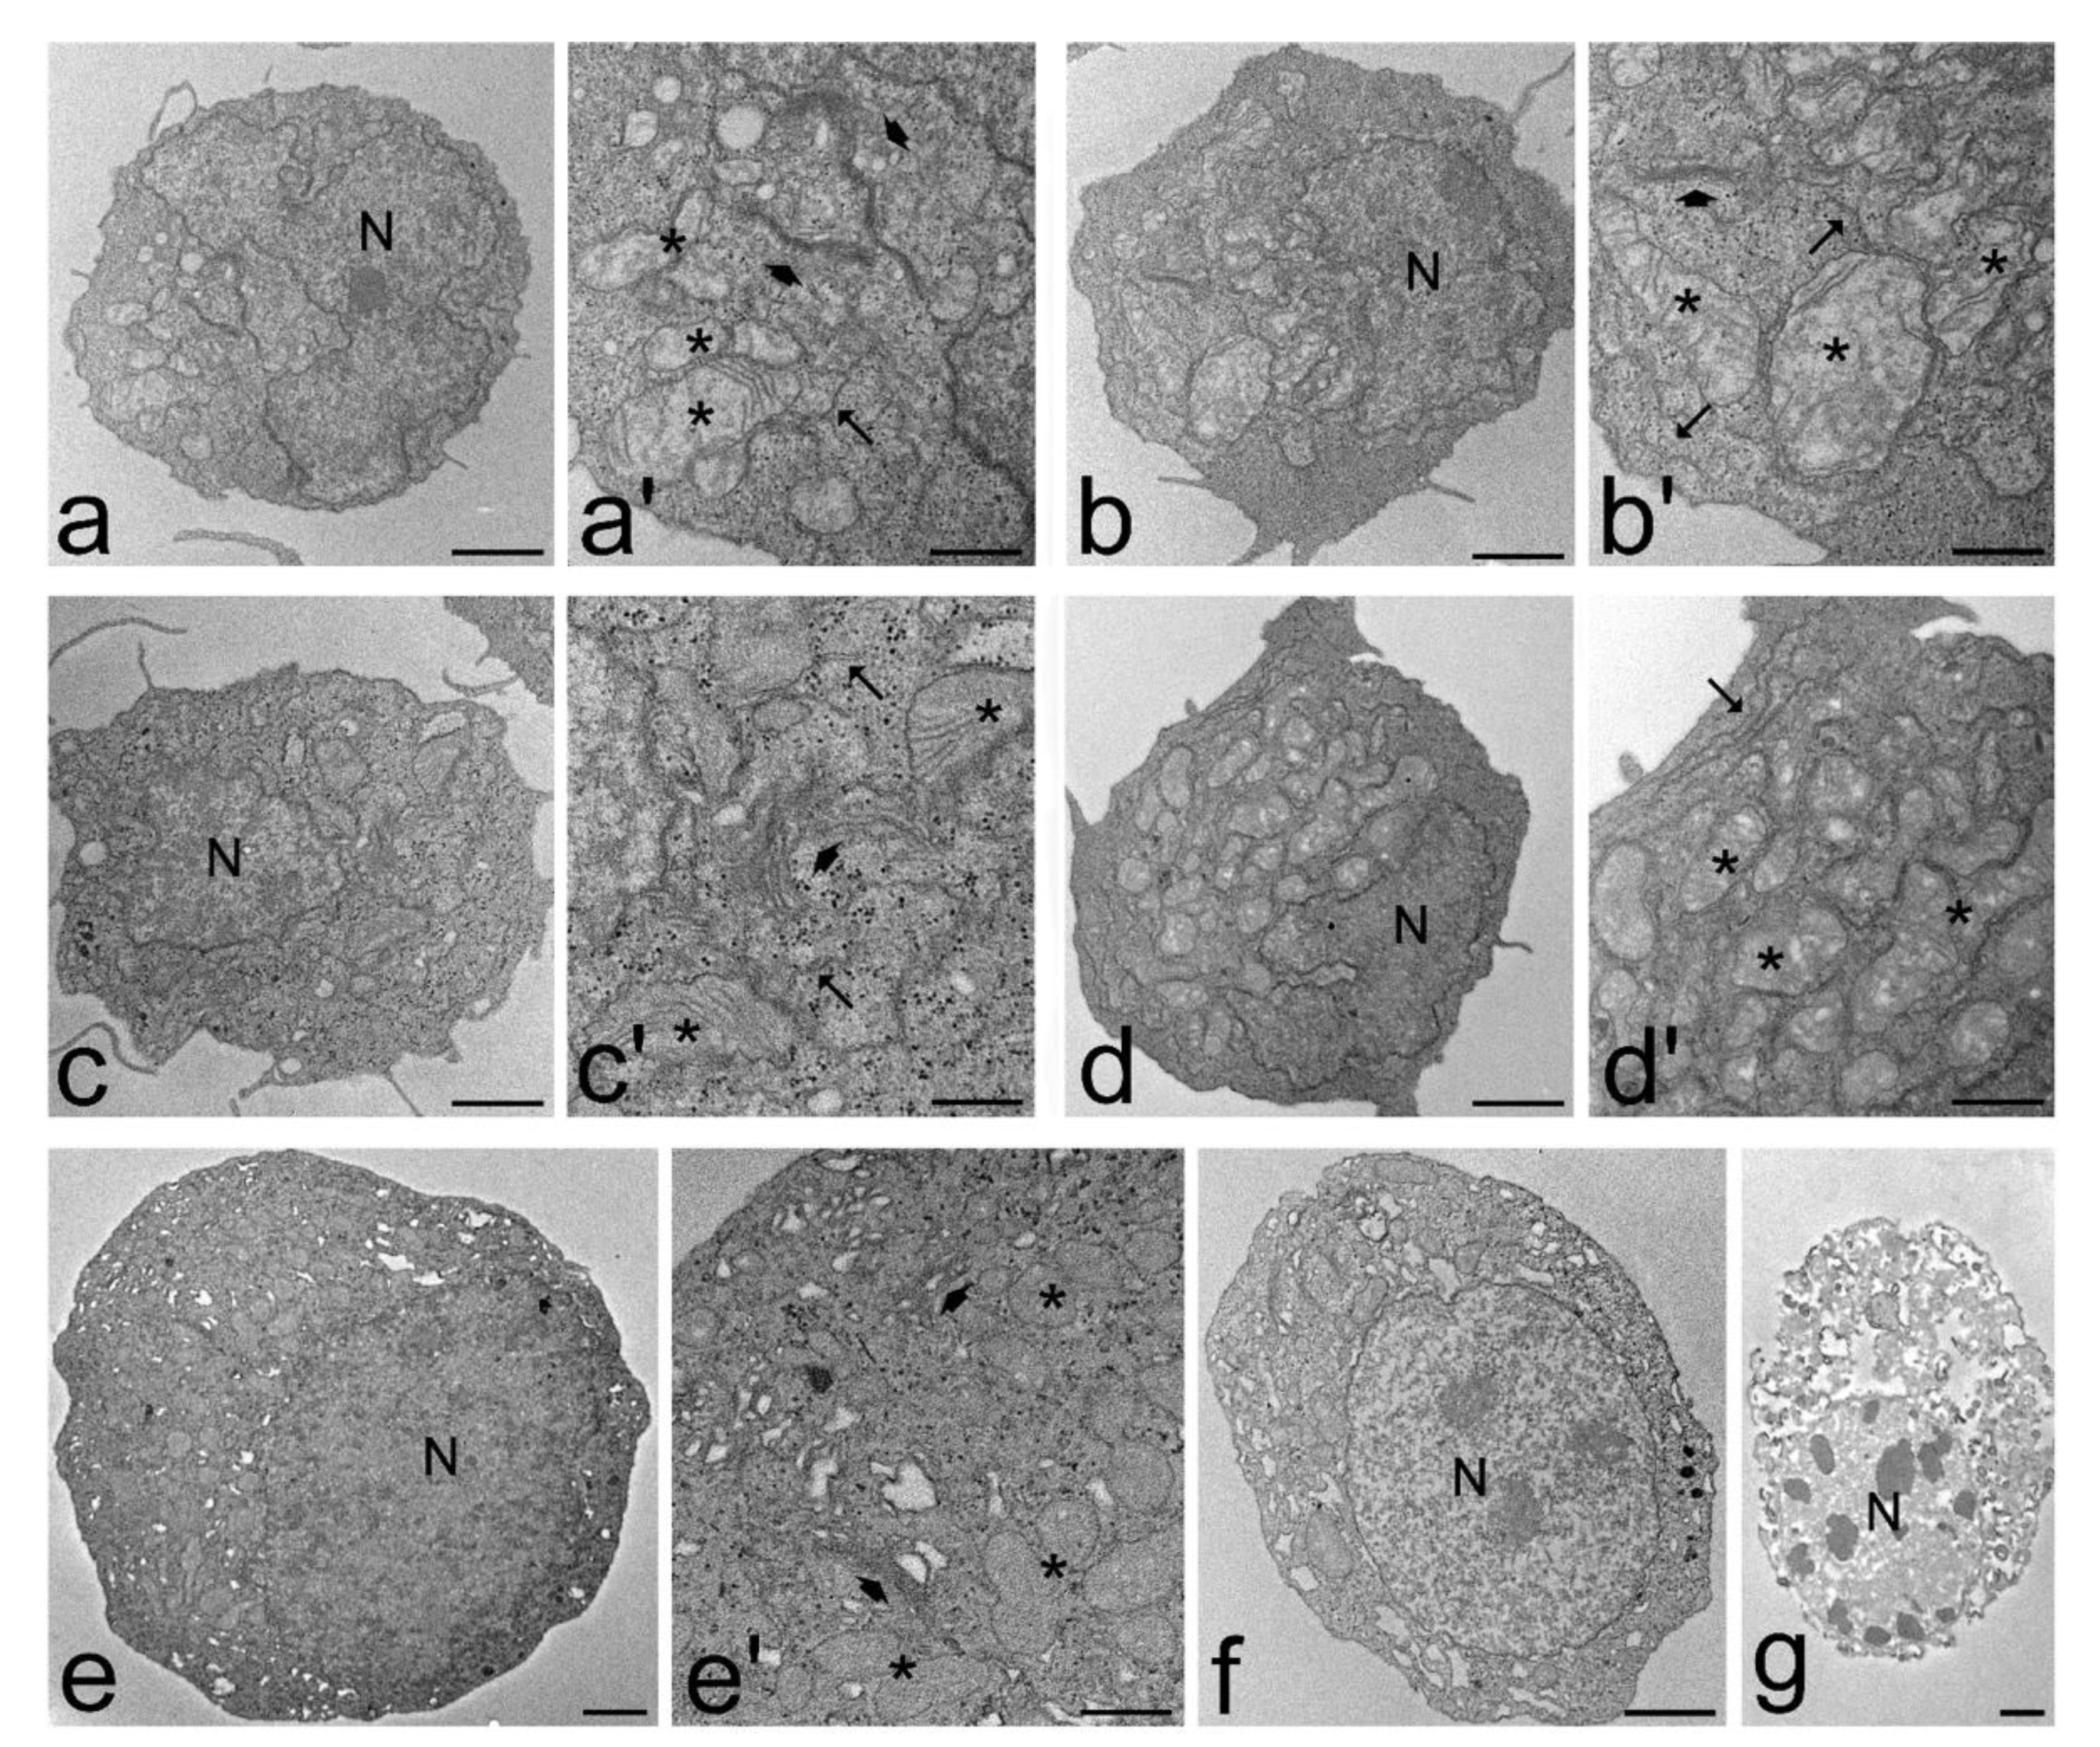
3.3. Transmission Electron Microscopy
3.4. Quantitative Real-Time Polymerase Chain Reaction
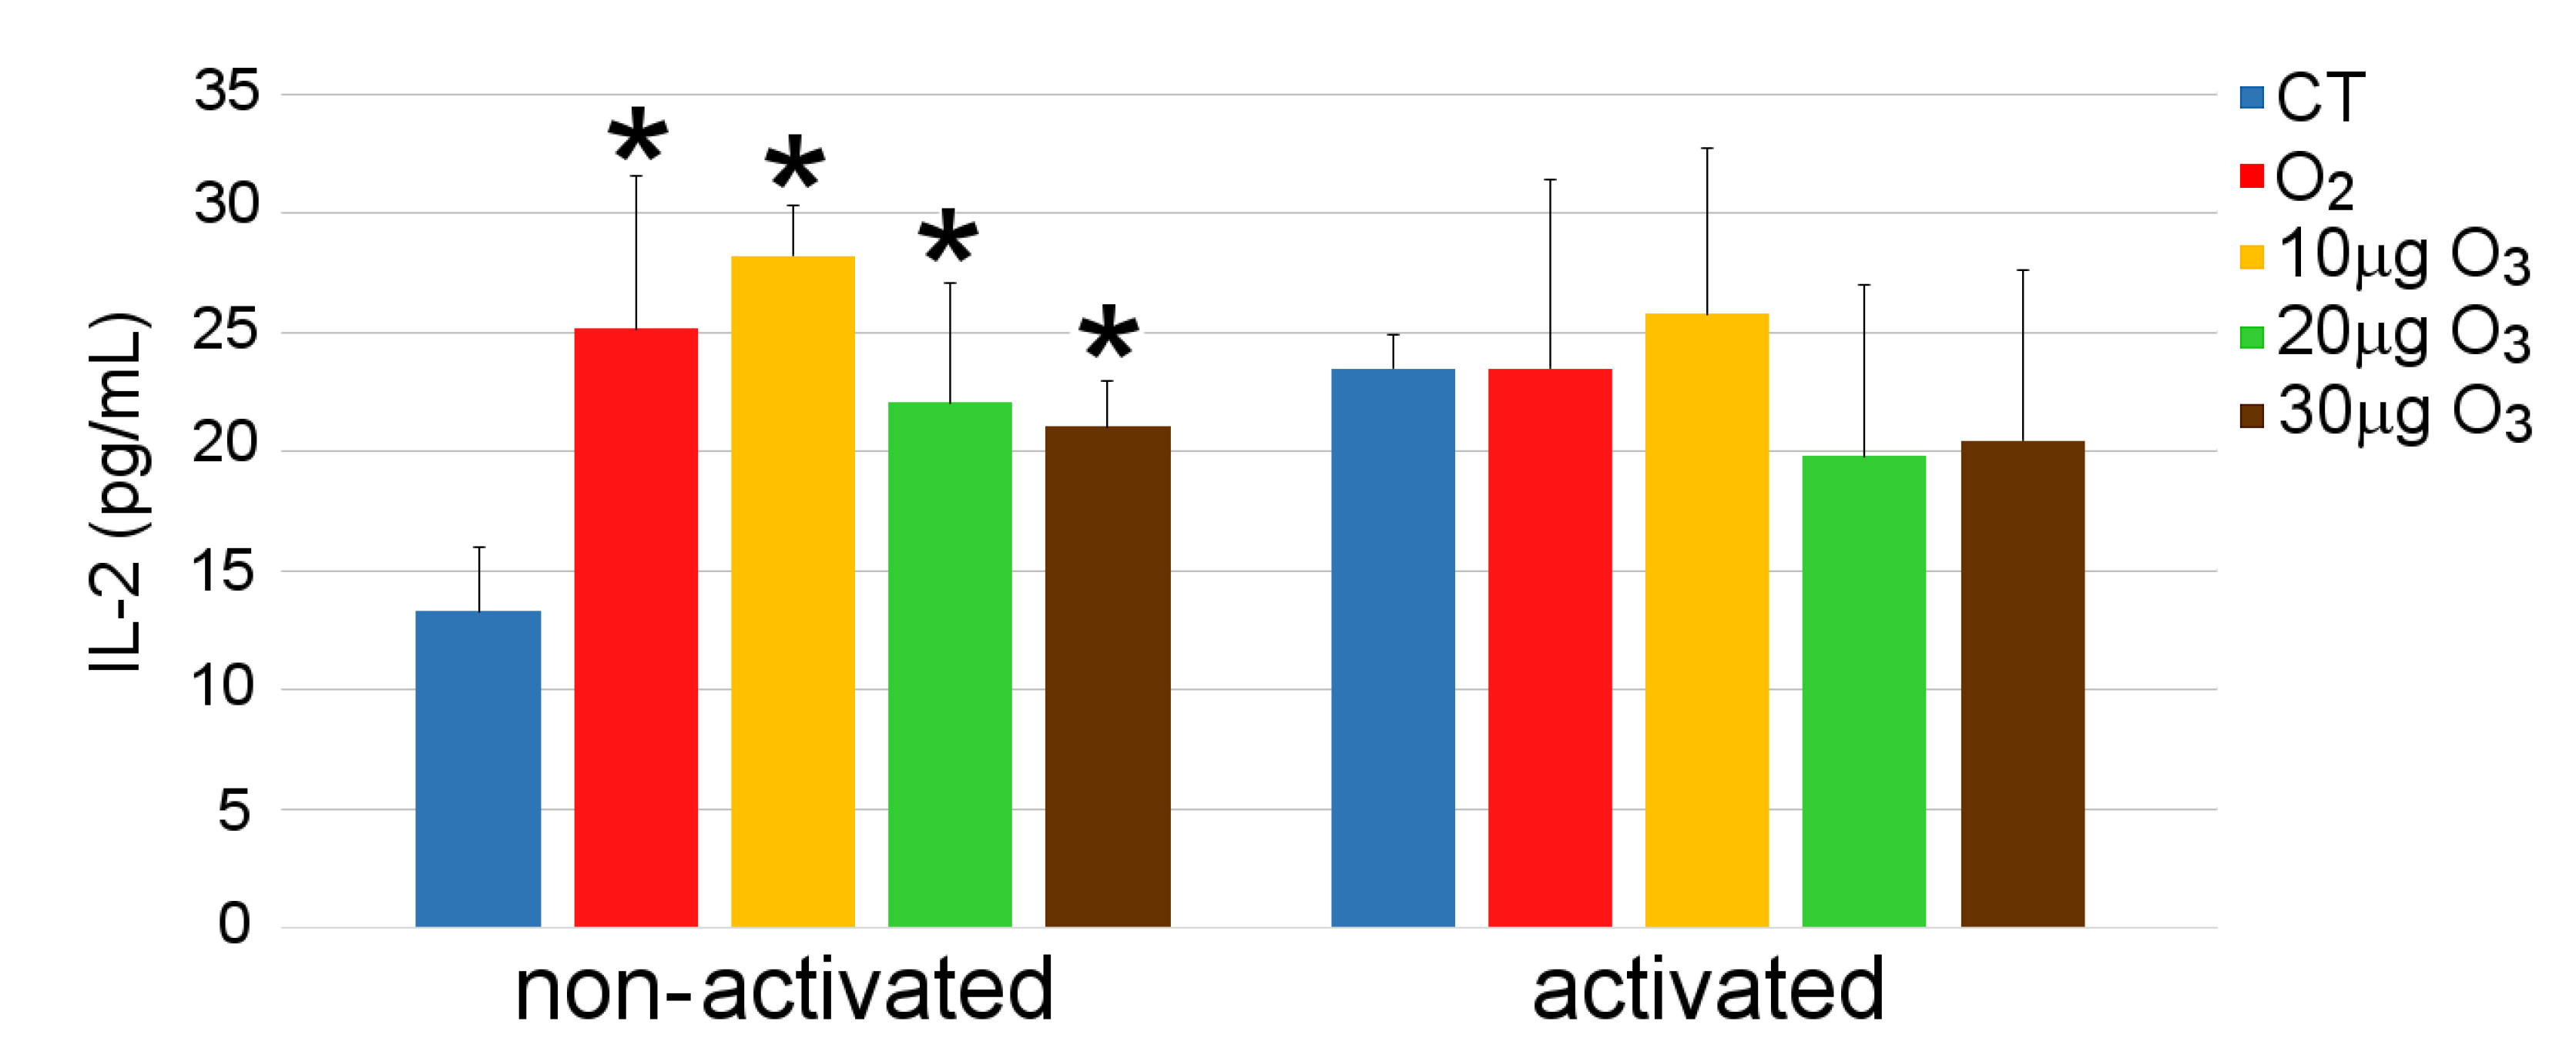
3.5. IL-2 and IFN-γ Secretion
4. Discussion
5. Conclusions
Author Contributions
Funding
Institutional Review Board Statement
Informed Consent Statement
Data Availability Statement
Conflicts of Interest
References
- Re, L.; Mawsouf, M.N.; Menéndez, S.; León, O.S.; Sánchez, G.M.; Hernández, F. Ozone therapy: Clinical and basic evidence of its therapeutic potential. Arch. Med. Res. 2008, 39, 17–26. [Google Scholar] [CrossRef] [PubMed]
- Elvis, A.M.; Ekta, J.S. Ozone therapy: A clinical review. J. Nat. Sc. Biol. Med. 2011, 2, 66–70. [Google Scholar] [CrossRef] [PubMed]
- Bocci, V. How a calculated oxidative stress can yield multiple therapeutic effects. Free Radic. Res. 2012, 46, 1068–1075. [Google Scholar] [CrossRef] [PubMed]
- Galiè, M.; Covi, V.; Tabaracci, G.; Malatesta, M. The Role of Nrf2 in the Antioxidant Cellular Response to Medical Ozone Exposure. Int. J. Mol. Sci. 2019, 20, 4009. [Google Scholar] [CrossRef] [PubMed]
- Sagai, M.; Bocci, V. Mechanisms of action involved in ozone therapy: Is healing induced via a mild oxidative stress? Med. Gas. Res. 2011, 1, 29. [Google Scholar] [CrossRef]
- Viebahn-Hansler, R.; Leon Fernandez, O.S.; Fahmy, Z. Ozone in medicine: The low dose ozone concept—Guidelines and treatment strategies. Ozone Sci. Eng. 2012, 34, 408–424. [Google Scholar] [CrossRef]
- Goldman, M. Cancer risk of low-level exposure. Science 1996, 271, 1821–1822. [Google Scholar] [CrossRef]
- Bocci, V.A.; Zanardi, I.; Travagli, V. Ozone acting on human blood yields a hormetic dose-response relationship. J. Transl. Med. 2011, 9, 66. [Google Scholar] [CrossRef]
- Menegon, S.; Columbano, A.; Giordano, S. The Dual Roles of NRF2 in Cancer. Trends Mol. Med. 2016, 22, 578–593. [Google Scholar] [CrossRef]
- Hojo, T.; Maishi, N.; Towfik, A.M.; Akiyama, K.; Ohga, N.; Shindoh, M.; Hida, Y.; Minowa, K.; Fujisawa, T.; Hida, K. ROS enhance angiogenic properties via regulation of NRF2 in tumor endothelial cells. Oncotarget 2017, 8, 45484–45495. [Google Scholar] [CrossRef][Green Version]
- Kang, K.A.; Hyun, J.W. Oxidative Stress, Nrf2, and Epigenetic Modification Contribute to Anticancer Drug Resistance. Toxicol. Res. 2017, 33, 1–5. [Google Scholar] [CrossRef]
- Rojo de la Vega, M.; Chapman, E.; Zhang, D.D. NRF2 and the Hallmarks of Cancer. Cancer Cell 2018, 34, 21–43. [Google Scholar] [CrossRef]
- Costanzo, M.; Romeo, A.; Cisterna, B.; Calderan, L.; Bernardi, P.; Covi, V.; Tabaracci, G.; Malatesta, M. Ozone at low concentrations does not affect motility and proliferation of cancer cells in vitro. Eur. J. Histochem. 2020, 64, 3119. [Google Scholar] [CrossRef]
- Schneider, U.; Schwenk, H.U.; Bornkamm, G. Characterization of EBV-Genome Negative “Null” and “T” Cell Lines Derived from Children with Acute Lymphoblastic Leukemia and Leukemic Transformed Non-Hodgkin Lymphoma. Int. J. Cancer 1977, 19, 621–626. [Google Scholar] [CrossRef] [PubMed]
- Levine, B.L.; May, W.S.; Tyler, P.G.; Hesse, A.D. Response of Jurkat T Cells to Phorbol Ester and Bryostatin. Development of Sublines with Distinct Functional Responses and Changes in Protein Kinase C Activity. J. Immunol. 1991, 147, 3474–3481. [Google Scholar] [PubMed]
- Abraham, R.T.; Weiss, A. Jurkat T Cells and Development of the T-Cell Receptor Signalling Paradigm. Nat. Rev. Immunol. 2004, 4, 301–308. [Google Scholar] [CrossRef] [PubMed]
- Costanzo, M.; Cisterna, B.; Vella, A.; Cestari, T.; Covi, V.; Tabaracci, G.; Malatesta, M. Low ozone concentrations stimulate cytoskeletal organization, mitochondrial activity and nuclear transcription. Eur. J. Histochem. 2015, 59, 2515. [Google Scholar] [CrossRef] [PubMed]
- Scassellati, C.; Costanzo, M.; Cisterna, B.; Nodari, A.; Galiè, M.; Cattaneo, A.; Covi, V.; Tabaracci, G.; Bonvicini, C.; Malatesta, M. Effects of mild ozonisation on gene expression and nuclear domains organization in vitro. Toxicol. In Vitro 2017, 44, 100–110. [Google Scholar] [CrossRef]
- Galiè, M.; Costanzo, M.; Nodari, A.; Boschi, F.; Calderan, L.; Mannucci, S.; Covi, V.; Tabaracci, G.; Malatesta, M. Mild ozonisation activates antioxidant cell response by the Keap1/Nrf2 dependent pathway. Free Radic. Biol. Med. 2018, 124, 114–121. [Google Scholar] [CrossRef]
- Cisterna, B.; Costanzo, M.; Nodari, A.; Galiè, M.; Zanzoni, S.; Bernardi, P.; Covi, V.; Tabaracci, G.; Malatesta, M. Ozone Activates the Nrf2 Pathway and Improves Preservation of Explanted Adipose Tissue In Vitro. Antioxidants (Basel) 2020, 9, 989. [Google Scholar] [CrossRef]
- Larini, A.; Bianchi, L.; Bocci, V. The ozone tolerance: I) Enhancement of antioxidant enzymes is ozone dose-dependent in Jurkat cells. Free Radical Res. 2003, 37, 1163–1168. [Google Scholar] [CrossRef] [PubMed]
- Weiss, A.; Wiskocil, R.L.; Stobo, J.D. The role of T3 surface molecules in the activation of human T cells: A two-stimulus requirement for IL 2 production reflects events occurring at a pre-translational level. J. Immunol. 1984, 133, 123–128. [Google Scholar] [CrossRef] [PubMed]
- Wiskocil, R.; Weiss, A.; Imboden, J.; Kamin-Lewis, R.; Stobo, J. Activation of a human T cell line: A two-stimulus requirement in the pretranslational events involved in the coordinate expression of interleukin 2 and gamma-interferon genes. J. Immunol. 1985, 134, 1599–1603. [Google Scholar] [PubMed]
- Manger, B.; Hardy, K.J.; Weiss, A.; Stobo, J.D. Differential effect of cyclosporin A on activation signaling in human T cell lines. J. Clin. Investig. 1986, 77, 1501–1506. [Google Scholar] [CrossRef]
- Strober, W. Trypan Blue Exclusion Test of Cell Viability. Curr. Protoc. Immunol. 2015, 111, A3.B.1–A3.B.3. [Google Scholar] [CrossRef]
- Bendayan, M.; Zollinger, M. Ultrastructural localization of antigenic sites on osmium-fixed tissues applying the protein A-gold technique. J. Histochem. Cytochem. 1983, 31, 101–109. [Google Scholar] [CrossRef]
- Malatesta, M.; Furlan, S.; Mariotti, R.; Zancanaro, C.; Nobile, C. Distribution of the epilepsy-related Lgi1 protein in rat cortical neurons. Histochem. Cell Biol. 2009, 132, 505–513. [Google Scholar] [CrossRef] [PubMed]
- Hanlon, P.R.; Robbins, M.G.; Scholl, C.; Barnes, D.M. Aqueous extracts from dietary supplements influence the production of inflammatory cytokines in immortalized and primary T lymphocytes. BMC Complement. Altern. Med. 2009, 9, 51. [Google Scholar] [CrossRef]
- Liu, M.; Yasmeen, R.; Fukagawa, N.K.; Yu, L.; Kim, Y.S.; Wang, T.T.Y. Dose-Dependent Responses of I3C and DIM on T-Cell Activation in the Human T Lymphocyte Jurkat Cell Line. Int. J. Mol. Sci. 2017, 18, 1409. [Google Scholar] [CrossRef]
- Erba, D.; Riso, P.; Criscuoli, F.; Testolin, G. Malondialdehyde production in Jurkat T cells subjected to oxidative stress. Nutrition 2003, 19, 545–548. [Google Scholar] [CrossRef]
- Chkhikvishvili, I.; Sanikidze, T.; Gogia, N.; Mchedlishvili, T.; Enukidze, M.; Machavariani, M.; Vinokur, Y.; Rodov, V. Rosmarinic acid-rich extracts of summer savory (Satureja hortensis L.) protect Jurkat T cells against oxidative stress. Oxid. Med. Cell. Longev. 2013, 2013, 456253. [Google Scholar] [CrossRef]
- Kucinska, M.; Piotrowska, H.; Luczak, M.W.; Mikula-Pietrasik, J.; Ksiazek, K.; Wozniak, M.; Wierzchowski, M.; Dudka, J.; Jäger, W.; Murias, M. Effects of hydroxylated resveratrol analogs on oxidative stress and cancer cells death in human acute T cell leukemia cell line: Prooxidative potential of hydroxylated resveratrol analogs. Chem. Biol. Interact. 2014, 209, 96–110. [Google Scholar] [CrossRef]
- Chkhikvishvili, I.; Sanikidze, T.; Gogia, N.; Enukidze, M.; Machavariani, M.; Kipiani, N.; Vinokur, Y.; Rodov, V. Constituents of French Marigold (Tagetes patula L.) Flowers Protect Jurkat T-Cells against Oxidative Stress. Oxid. Med. Cell. Longev. 2016, 2016, 4216285. [Google Scholar] [CrossRef] [PubMed]
- Xie, H.; Tuo, X.; Zhang, F.; Bowen, L.; Zhao, W.; Xu, Y. Dietary cucurbitacin E reduces high-strength altitude training induced oxidative stress, inflammation and immunosuppression. An. Acad. Bras. Cienc. 2020, 92, e20200012. [Google Scholar] [CrossRef] [PubMed]
- Costanzo, M.; Boschi, F.; Carton, F.; Conti, G.; Covi, V.; Tabaracci, G.; Sbarbati, A.; Malatesta, M. Low ozone concentrations promote adipogenesis in human adipose-derived adult stem cells. Eur. J. Histochem. 2018, 62, 2969. [Google Scholar] [CrossRef]
- Larini, A.; Bocci, V. Effects of ozone on isolated peripheral blood mononuclear cells. Toxicol. In Vitro 2005, 19, 55–61. [Google Scholar] [CrossRef]
- Leveille, C.F.; Mikhaeil, J.S.; Turner, K.D.; Silvera, S.; Wilkinson, J.; Fajardo, V.A. Mitochondrial cristae density: A dynamic entity that is critical for energy production and metabolic power in skeletal muscle. J. Physiol. 2017, 595, 2779–2780. [Google Scholar] [CrossRef] [PubMed]
- Mailloux, R.J.; Jin, X.; Willmore, W.G. Redox regulation of mitochondrial function with emphasis on cysteine oxidation reactions. Redox Biol. 2014, 2, 123–139. [Google Scholar] [CrossRef]
- Madej, P.; Plewka, A.; Madej, J.A.; Plewka, D.; Mroczka, W.; Wilk, K.; Dobrosz, Z. Ozone therapy in induced endotoxemic shock. II. The effect of ozone therapy upon selected histochemical reactions in organs of rats in endotoxemic shock. Inflammation 2007, 30, 69–86. [Google Scholar] [CrossRef]
- Lintas, G.; Molinari, F.; Simonetti, V.; Franzini, M.; Liboni, W. Time and time-frequency analysis of near-infrared signals for the assessment of ozone autohemotherapy long-term effects in multiple sclerosis. Conf. Proc. IEEE Eng. Med. Biol. Soc. 2013, 2013, 6171–6174. [Google Scholar] [CrossRef]
- Cmarko, D.; Verschure, P.J.; Martin, T.E.; Dahmus, M.E.; Krause, S.; Fu, X.D.; van Driel, R.; Fakan, S. Ultrastructural analysis of transcription and splicing in the cell nucleus after bromo-UTP microinjection. Mol. Biol. Cell. 1999, 10, 211–223. [Google Scholar] [CrossRef]
- Fakan, S. Ultrastructural cytochemical analyses of nuclear functional architecture. Eur. J. Histochem. 2004, 48, 5–14. [Google Scholar]
- Cardinale, S.; Cisterna, B.; Bonetti, P.; Aringhieri, C.; Biggiogera, M.; Barabino, S.M.L. Subnuclear localization and dynamics of the pre-mRNA 3′ end processing factor CFIm68. Mol. Biol. Cell. 2007, 18, 1282–1292. [Google Scholar] [CrossRef] [PubMed]
- Itoh, K.; Wakabayashi, N.; Katoh, Y.; Ishii, T.; O’Connor, T.; Yamamoto, M. Keap1 regulates both cytoplasmic-nuclear shuttling and degradation of Nrf2 in response to electrophiles. Genes Cells 2003, 8, 379–391. [Google Scholar] [CrossRef] [PubMed]
- Loboda, A.; Damulewicz, M.; Pyza, E.; Jozkowicz, A.; Dulak, J. Role of Nrf2/HO-1 system in development, oxidative stress response and diseases: An evolutionarily conserved mechanism. Cell. Mol. Life Sci. 2016, 73, 3221–3247. [Google Scholar] [CrossRef]
- Morgan, D.A.; Ruscetti, F.W.; Gallo, R. Selective in vitro growth of T lymphocytes from normal human bone marrows. Science 1976, 193, 1007–1008. [Google Scholar] [CrossRef] [PubMed]
- Liao, W.; Lin, J.X.; Leonard, W.J. Interleukin-2 at the crossroads of effector responses, tolerance, and immunotherapy. Immunity 2013, 38, 13–25. [Google Scholar] [CrossRef]
- Asehnoune, K.; Strassheim, D.; Mitra, S.; Kim, J.Y.; Abraham, E. Involvement of reactive oxygen species in Toll-like receptor 4-dependent activation of NF-kappa B. J. Immunol. 2004, 172, 2522–2529. [Google Scholar] [CrossRef] [PubMed]
- Thimmulappa, R.K.; Lee, H.; Rangasamy, T.; Reddy, S.P.; Yamamoto, M.; Kensler, T.W.; Biswal, S. Nrf2 is a critical regulator of the innate immune response and survival during experimental sepsis. J. Clin. Investig. 2006, 116, 984–995. [Google Scholar] [CrossRef]
- Ahmed, S.M.; Luo, L.; Namani, A.; Wang, X.J.; Tang, X. Nrf2 signaling pathway: Pivotal roles in inflammation. Biochim. Biophys. Acta Mol. Basis Dis. 2017, 1863, 585–597. [Google Scholar] [CrossRef]
- Karatieieva, S.Y.; Semenenko, S.B.; Bakun, O.V.; Yurkiv, O.I.; Slobodian, K.V. Application of ozone therapy in surgical practice. Wiad. Lek. 2018, 71, 1076–1079. [Google Scholar] [PubMed]
- Manoto, S.L.; Maepa, M.J.; Motaung, S.K. Medical ozone therapy as a potential treatment modality for regeneration of damaged articular cartilage in osteoarthritis. Saudi.J. Biol. Sci. 2018, 25, 672–679. [Google Scholar] [CrossRef] [PubMed]
- Zeng, J.; Lu, J. Mechanisms of action involved in ozone-therapy in skin diseases. Int. Immunopharmacol. 2018, 56, 235–241. [Google Scholar] [CrossRef]
- Rowen, R.J.; Robins, H. Ozone Therapy for Complex Regional Pain Syndrome: Review and Case Report. Curr. Pain Headache Rep. 2019, 23, 41. [Google Scholar] [CrossRef]
- Martínez-Sánchez, G.; Schwartz, A.; Donna, V.D. Potential Cytoprotective Activity of Ozone Therapy in SARS-CoV-2/COVID-19. Antioxidants (Basel) 2020, 9, 389. [Google Scholar] [CrossRef] [PubMed]
- Scassellati, C.; Ciani, M.; Galoforo, A.C.; Zanardini, R.; Bonvicini, C.; Geroldi, C. Molecular mechanisms in cognitive frailty: Potential therapeutic targets for oxygen-ozone treatment. Mech. Ageing Dev. 2020, 186, 111210. [Google Scholar] [CrossRef] [PubMed]
- Wen, Q.; Chen, Q. An Overview of Ozone Therapy for Treating Foot Ulcers in Patients With Diabetes. Am. J. Med. Sci. 2020, 360, 112–119. [Google Scholar] [CrossRef]
- Doersch, K.M.; DelloStritto, D.J.; Newell-Rogers, M.K. The contribution of interleukin-2 to effective wound healing. Exp. Biol. Med. (Maywood) 2017, 242, 384–396. [Google Scholar] [CrossRef]
- Bocci, V. The case for oxygen-ozonetherapy. Br. J. Biomed. Sci. 2007, 64, 44–49. [Google Scholar] [CrossRef]
- Kushmakov, R.; Gandhi, J.; Seyam, O.; Jiang, W.; Joshi, G.; Smith, N.L.; Khan, S.A. Ozone therapy for diabetic foot. Med. Gas. Res. 2018, 8, 111–115. [Google Scholar] [CrossRef]
- Suh, Y.; Patel, S.; Kaitlyn, R.; Gandhi, J.; Joshi, G.; Smith, N.L.; Khan, S.A. Clinical utility of ozone therapy in dental and oral medicine. Med. Gas. Res. 2019, 9, 163–167. [Google Scholar] [CrossRef] [PubMed]
- Juchniewicz, H.; Lubkowska, A. Oxygen-Ozone (O(2)-O(3)) Therapy in Peripheral Arterial Disease (PAD): A Review Study. Ther. Clin. Risk Manag. 2020, 16, 579–594. [Google Scholar] [CrossRef] [PubMed]
- Voos, P.; Fuck, S.; Weipert, F.; Babel, L.; Tandl, D.; Meckel, T.; Hehlgans, S.; Fournier, C.; Moroni, A.; Rödel, F.; et al. Ionizing Radiation Induces Morphological Changes and Immunological Modulation of Jurkat Cells. Front. Immunol. 2018, 9, 922. [Google Scholar] [CrossRef] [PubMed]


Publisher’s Note: MDPI stays neutral with regard to jurisdictional claims in published maps and institutional affiliations. |
© 2021 by the authors. Licensee MDPI, Basel, Switzerland. This article is an open access article distributed under the terms and conditions of the Creative Commons Attribution (CC BY) license (https://creativecommons.org/licenses/by/4.0/).
Share and Cite
Cappellozza, E.; Costanzo, M.; Calderan, L.; Galiè, M.; Angelini, O.; Tabaracci, G.; Malatesta, M. Low Ozone Concentrations Affect the Structural and Functional Features of Jurkat T Cells. Processes 2021, 9, 1030. https://doi.org/10.3390/pr9061030
Cappellozza E, Costanzo M, Calderan L, Galiè M, Angelini O, Tabaracci G, Malatesta M. Low Ozone Concentrations Affect the Structural and Functional Features of Jurkat T Cells. Processes. 2021; 9(6):1030. https://doi.org/10.3390/pr9061030
Chicago/Turabian StyleCappellozza, Enrica, Manuela Costanzo, Laura Calderan, Mirco Galiè, Osvaldo Angelini, Gabriele Tabaracci, and Manuela Malatesta. 2021. "Low Ozone Concentrations Affect the Structural and Functional Features of Jurkat T Cells" Processes 9, no. 6: 1030. https://doi.org/10.3390/pr9061030
APA StyleCappellozza, E., Costanzo, M., Calderan, L., Galiè, M., Angelini, O., Tabaracci, G., & Malatesta, M. (2021). Low Ozone Concentrations Affect the Structural and Functional Features of Jurkat T Cells. Processes, 9(6), 1030. https://doi.org/10.3390/pr9061030