Article

Numerical Research of Pump-as-Turbine Performance with Synergy Analysis

1
School of Chemical Engineering and Technology, Xi’an Jiaotong University, Xi’an 710049, China
2
Shaanxi Key Laboratory of Energy Chemical Process Intensification, Xi’an 710049, China
3
Department of Building Services Engineering, The Hong Kong Polytechnic University, Hong Kong 999077, China
*
Author to whom correspondence should be addressed.
Processes 2021, 9(6), 1031; https://doi.org/10.3390/pr9061031
Submission received: 30 April 2021 / Revised: 5 June 2021 / Accepted: 9 June 2021 / Published: 11 June 2021

Abstract

:
The wide use of pumps and turbines has significant value in energy conservation and utilization. In this work, a three-dimensional Computational Fluid Dynamics (CFD) model and a one-dimensional theoretical model of a Pump as Turbine (PAT) were established. On this basis, the correlation between pressure and velocity was quantitatively investigated by a proposed sensitivity index (SPV). A synergy field analysis was then applied to evaluate the flow characteristics of a pump and PAT, providing a perspective from the mechanism of the energy transfer enhancement for hydraulic devices. Moreover, the hydraulic and synergy performances of PAT were studied under various operating conditions. The results show that the minimum SPV is obtained in the impeller. With increasing flow rate, the SPV of the PAT generally increases, and the synergy angle of the impeller surface increases as well. A strong disordered synergy field is observed in regions of the blade leading edge, trailing edge, and volute tongue. The variations in efficiency and head with flow rate showed similar trends, respectively, with the synergy angle of the outlet and the mid-plane. This study provides an analytical method for quantitative evaluation of flow synergy characteristics, and it supplies a basis for further design improvement of the pump and PAT.

1. Introduction

In various process industries, there is a considerable amount of pressure energy carried by liquid streams. A large amount of fluid energy dissipates after processing with pressure relief valves or other throttling devices. In recent decades, the wide use of turbines has had significant value in energy recovery and utilization. The reverse operation of the pump, namely, the Pump as Turbine (PAT), has significant advantages of convenience, flexibility, and economic practicability. Therefore, it has attracted much attention in both theoretical research and industrial applications.
At the initial stage of hydraulic turbine research, the main focus is selecting the appropriate pump to work as the hydraulic turbine according to the specific flow rate, pressure, fluid properties, and operational considerations such as the desired operating speed, operating temperature, and mechanical reliability. Much research has been carried out on the relationship between the external characteristics of the pump and PAT. Williams [1] proposed a standard ellipse formula for estimating the hydraulic performance of turbines, which can be used to build the conversion relation between pump and turbine performances. Kaunda et al. [2] carried out substantial work on the selection of pumps for turbines, proposed the flow–head curve of pumps, and carried out the selection design based on the turbine specific speed and hydraulic performance. However, for a hydraulic turbine design in an actual scene, even for a pump with the same specific revolution, the conversion relation of the pump turbine obtained from tests is quite different [3]. It is not enough to obtain the hydraulic performance of a PAT only at the best efficiency point by an empirical conversion. Moreover, it is still difficult to accurately obtain the performance and flow field details of hydraulic turbines through theoretical calculations.
The application of Computational Fluid Dynamics (CFD) technology has been successfully demonstrated not only for conventional pump design but also for analyzing complicated flow phenomena inside the pump. For example, the unsteady flow characteristics termed pressure fluctuation and distribution were investigated for a centrifugal pump with different blade numbers [4]. Besides this, the effect of operating conditions on the cavitation characteristics of a centrifugal blood pump can also be analyzed using the CFD method [5]. In view of the compatibility of turbo-machinery, reverse operation of the pump also follows a similar design and analytical method [6]. Therefore, a simulation of the hydrodynamic flow in a PAT can be performed based on CFD models as well.
Miao et al. [7] studied the energy conversion characteristics of a PAT at different flow rates using the CFD method. They found that the power capability of the turbine impeller reduced when the water inflow was outside the range of 80% to 120% of the designed flow rate. Perezsanchez et al. [8] studied the PAT performance in a pipeline system, and a whole-flow-field numerical simulation was carried out to investigate the pressure distribution characteristics of system components under different working conditions. Yang et al. [9] conducted a numerical simulation of the flow field in the entire channel of a hydraulic turbine. The numerical results were compared with experimental results when the flow rate deviated from the design point. Štefan et al. [10] presented a CFD simulation and velocity vector analysis on a PAT, and they found that the flow rate and head at the Best Efficiency Point (BEP) were 27% and 41% higher, respectively, than those in pump mode. In addition to the investigation regarding the hydraulic characteristics, Barrio et al. [11] estimated the steady load on the impeller in both pump and reverse modes. The pressure and velocity distributions were also investigated numerically for a wide operating range between 20% and 160% of the designed flow rate.
Pump hydraulic predictions based on CFD results can be used for quantitative comparisons under different flow conditions and structural configurations [12]. Likewise, Binama et al. [13] paid attention to the pressure pulsation performance under the unsteady condition of a PAT. They believed that a PAT operated at a low specific speed was prone to producing pressure pulsation phenomena. Balacco [14] considered that there was still no universal method for predicting reversed operational performance based on the performance of the forward rotation of the pump. He used an artificial neural network and polynomial regression to establish the conversion relationship between turbine performance and pump performance, but the turbine head and flow performance could not be predicted effectively. Xue et al. [15] analyzed the energy loss of a pump-turbine by utilizing PIV (Particle Image Velocimetry) technology. They found that off-design operations may lead to great dissipation-induced loss with the rotating stall. Wang et al. [16] applied the Pareto-based genetic algorithm to optimize the blade geometric parameters based on a theoretical model. The optimized PAT efficiency was improved by 16.3% at the design point.
Apart from the necessity to investigate the performance in off-design conditions, it is important to identify the potential for improving device performance based on flow details. In research on heat transfer enhancement, Guo et al. [17] proposed the concept of the field synergy principle for enhancing heat transfer. They found that better field synergy between velocity and heat flux will improve heat transfer intensity under the same boundary conditions. Since then, much attention has been given to improving the overall heat exchanger performance, and the synergetic effect on heat transfer enhancement was found to be strongly related to the flow resistance [18].
In turbo-machinery devices, the exchange of momentum associated with energy loss is highly affected by the uniformity of the pressure and velocity distribution. This inspired the authors to evaluate the flow field characteristics and performance improvement potential of a pump and PAT from the perspective of synergy analysis in such devices. Taking advantage of CFD application such that the pressure and velocity in the whole flow domain are easily accessible, the aim of this study to investigate the influence of pressure and velocity synergy distributions on the hydraulic performance of a pump and PAT could be fulfilled. Firstly, a three-dimensional (3-D) CFD study of the PAT was carried out. The accuracy of the 3-D numerical results was verified by comparison with the theoretical model considering hydraulic losses. On this basis, 1-D sensitivity analysis and 3-D synergy field analysis were applied to evaluate the flow characteristics of the PAT, providing a synergetic perspective on the flow field analysis of such a hydraulic device. After hydraulic and synergy performances were assessed in various operating conditions for the pump and PAT, the variation in device performance with the flow rate was evaluated.

2. Model Description

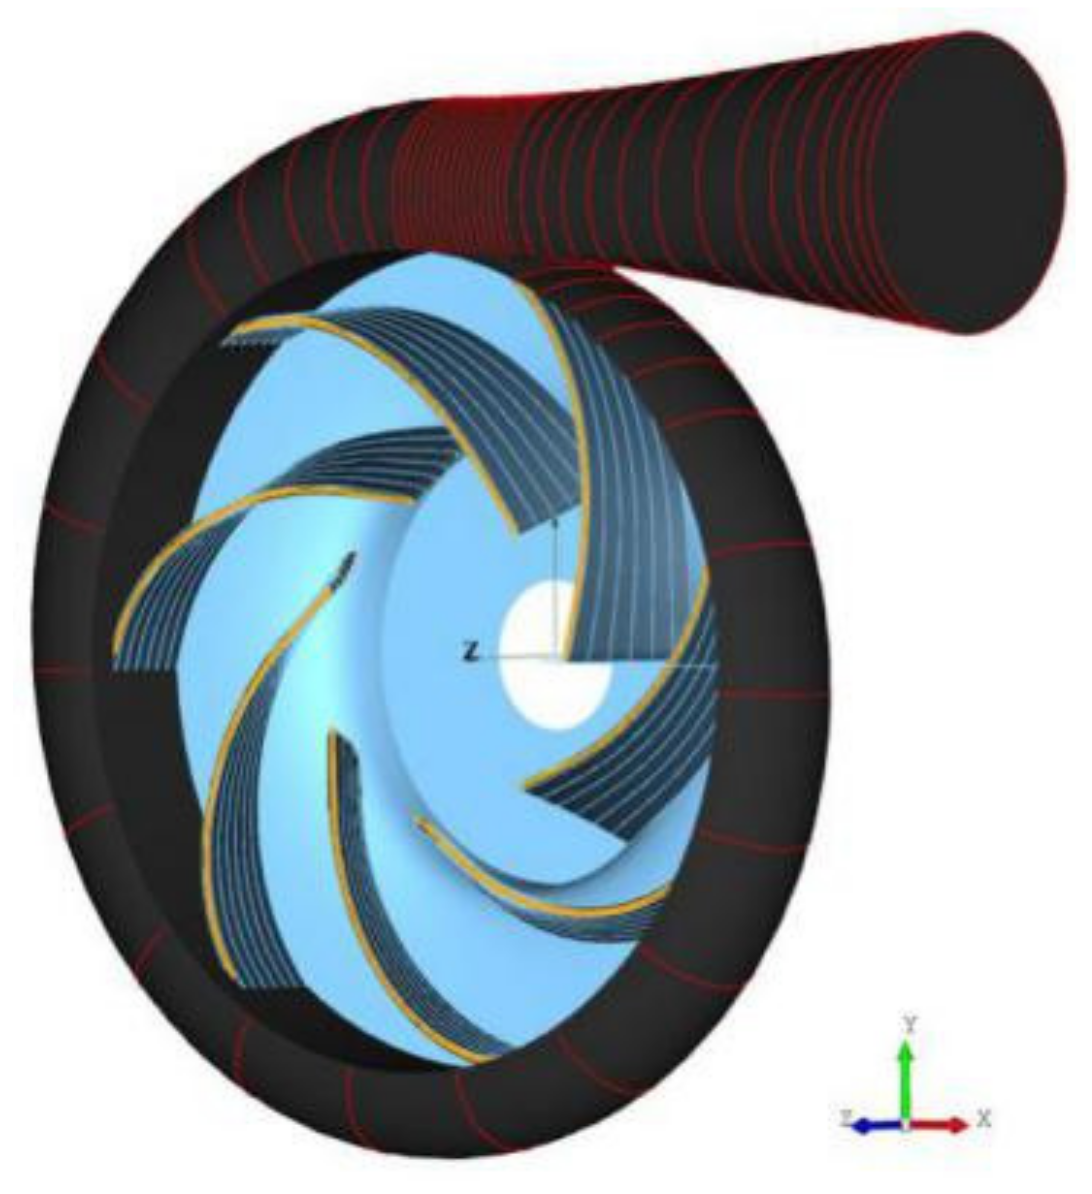
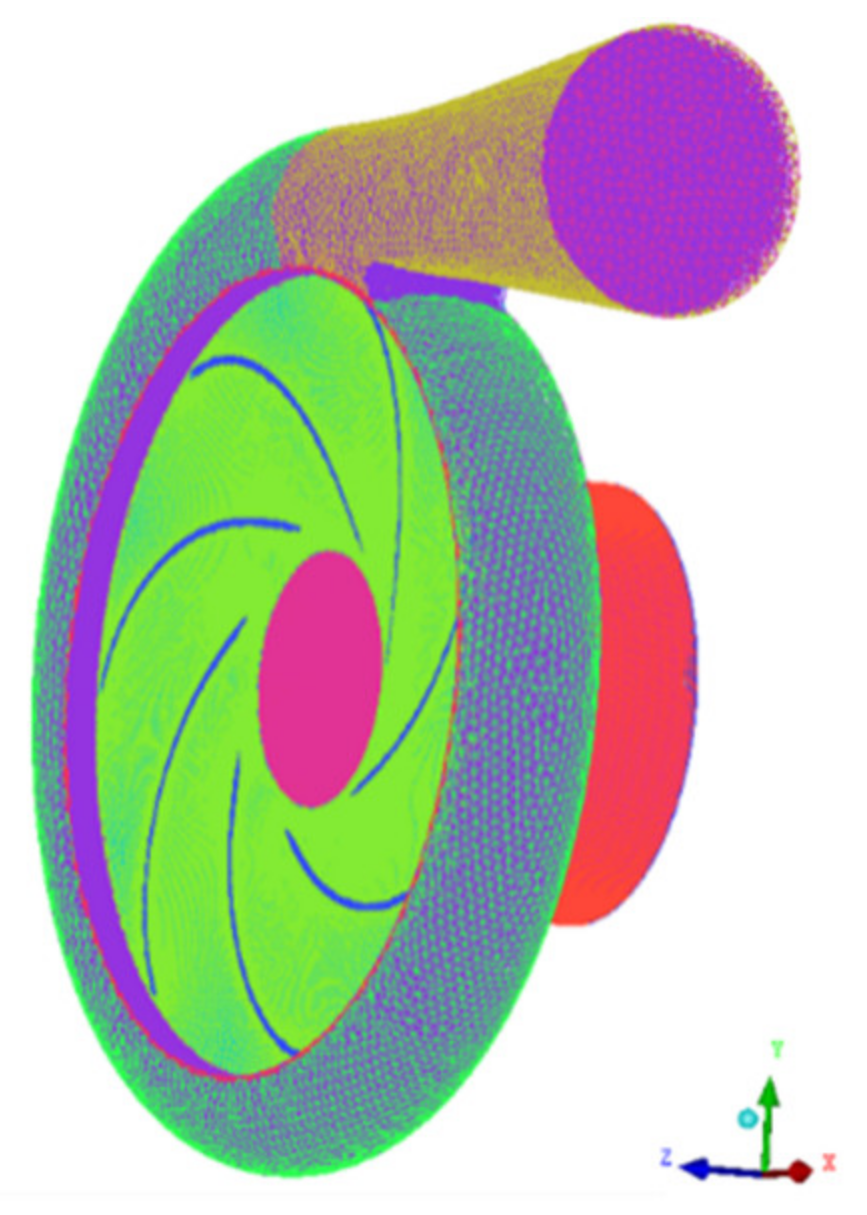
2.1. Geometry and Mesh Model

A single-stage centrifugal pump was selected as the research object, and the geometric model with an open volute is as shown in Figure 1. It can be seen that the model components mainly include the impeller, suction chamber, and volute. The design flow rate of the pump is 13.86 kg/s, the design head is 35 m, and the rotational speed is 2900 r/min. The pump can be characterized as a low-specific-speed pump with a specific speed of 23.75. The inlet diameter of the suction chamber is 0.092 m, the number of impeller blades is 7, and the diameter of the impeller is 0.165 m. In consideration of the full development of the inflow, the inlet end of the suction chamber is extended. The main design parameters of the model are summarized in Table 1.
As shown in Figure 2, the commercial software GAMBIT was used to generate a heterogeneous mesh of the flow domain. In the mesh domain, the number of unstructured elements is 1961,957. The mesh quality can be estimated by three factors: the orthogonal quality, aspect ratio, and skewness value. It is recommended that the orthogonal quality should be no less than 0.01. The aspect ratio is a measure of the stretching of a cell and may affect solution accuracy if the value is too large near the meshing wall. Meanwhile, the skewness of the mesh element should be no larger than 0.95, as recommended by Fluent [19]. In this work, the minimum orthogonal quality and the maximum aspect ratio were 0.178 and 74.57, respectively. The skewness was kept below 0.86 in the whole region. Therefore, the mesh is of sufficient quality for computational standards.
The simulation domain in this study consists of a rotating impeller, stationary suction chamber, and stationary volute parts. Each stationary part was assigned an interface connecting with the inlet interface or the outlet interface of the rotating impeller. In the impeller, the blade rotation was simulated by the moving mesh method. The blade wall and fluid domain in the impeller were set with a constant rotating speed, while the other domains in the volute and pump inlet were set as the stationary region. In addition, the pressure outlet and mass flow inlet conditions were applied as boundary conditions for both the pump mode and PAT mode correspondingly.
The computation conditions for the standard case were given as follows: The mass flow inlet condition was assigned with a flow rate of 13.8 kg/s, the pressure outlet condition was assigned with an operating pressure of 0.34 MPa. A transient simulation with a time step of 0.001 s was performed, and a maximum of 220 iterative steps was set to guarantee the convergence of the first calculation step after the default initialization. On this basis, the flow field and device performance could be investigated after iterations reached a stable state.

2.2. Governing Equation

The Reynolds-Averaged Navier–Stokes (RANS) equations were used for describing the three-dimensional incompressible flow in the simulation domain, and these equations were closed by a turbulence model.
The general form of Navier–Stokes equations includes equations of conservation of mass and momentum, which are represented as follows:
u i t + x j ( ρ u i ) = 0
t ( ρ u i ) + x j ( ρ u i u j ) = p x i + τ i , j x j + f i
In the above equations, ρ is the density; t is the time; u is the velocity; f is the volume force that includes the coriolis force and the centrifugal force; P is the static pressure; and τ is the stress tensor.
Numerical simulation performed using the k–ε model has been extensively validated for a wide range of flows for turbo-machinery devices [9]. The standard k–ε model has been evaluated as the most accurate one when compared with real data among other turbulent models [20]. Therefore, the standard k–ε model was employed as the transport equations for turbulent flows in our study:
t ρ k + x i ρ k u i = x j μ + μ t σ k k x j + G k + G b ρ ε Y M + S k
t ρ ε + x i ρ ε u i = x j μ + μ t σ ε ε x j + C 1 ε ε k ( G k + C 3 ε G b ) C 2 ε ρ ε 2 k + S ε
where ui is the time-mean velocity, σk and σε are Prandtl numbers, Gk and Gb are the turbulent kinetic energies due to the mean velocity gradients and buoyancy, and Ym is the contribution of the fluctuating dilatation in turbulence. Sk and Sε are the source terms, and the model constants C1ε, C, and C were set to 1.44, 1.92, and 1.0, respectively.
Based on the commercial CFD software ANSYS Fluent 14.5, the above basic equations were discretized by the finite volume method, the convective terms were discretized in the second-order solution format, the turbulent terms were discretized in the default first-order numerical format, and the other terms were discretized in the default solution format.

2.3. Synergy Degree and Hydraulic Performance

The total pressures Ptot,in and Ptot,out are used to represent the fluid energy at the pump inlet and outlet. Therefore, the head of the pump can be calculated as
H = P t o t , i n P t o t ,   o u t ρ g
where g is the acceleration of gravity.
Since the mechanical and volumetric losses are ignored in the numerical model, the hydraulic efficiency is close to the total efficiency and is thus used to represent pump efficiency in CFD analysis [21]:
η =   N e o u t N e i n = M ϖ ρ g Q H
In the equation above, Ne represents the power, M represents the torque, and ϖ represents the angular velocity. The impeller torque can be obtained as the blade surface moment in the rotation axis by Fluent solver. Also, it is noted that these evaluation indexes are also applicable for PAT when the inlet and outlet, input, and output are reversed.
Based on the conservation equation for mechanical energy, the dot product of the pressure gradient and velocity vector represents the rate at which work is done by the gradient of fluid pressure drop [22], which can be expressed by
N p = u · p = u   p   cos θ
In analogy to synergy in heat transfer, the synergy angle of the momentum transfer process is therefore calculated as
θ = arccos u · p u   p
From the equation above, it can be expected that an increase in θ means a decrease in the fluid flow resistance and an increased work capacity of the pressure gradient. Thus, increasing the synergy angle is beneficial to enhancing the momentum exchange between fluid and impeller blades in a PAT for the energy transfer process.

2.4. One-Dimensional Hydraulic Loss Model

Despite the difficulty in obtaining detailed flow fields inside a pump and PAT by theoretical prediction based on a one-dimensional energy loss model, such a model can still be used as an efficient tool to determine the energy performance by calculating hydraulic loss. Effective predictions of the pressure head of a pump and PAT in various flow conditions were obtained compared with real operating data [16,23,24]. For this reason, the theoretical model is developed herein to verify the simulation result.
Based on the conservation of angular momentum, Euler’s equation can represent the pump head without considering the energy loss condition. The theoretical head Hth,P, also known as the Euler head, can be calculated as
H th , p = u 2 , p C u 2 , p u 1 , p C u 1 , p g
In the equation above, C is the absolute velocity, u is the circumferential velocity, the subscript u is the circumferential component, and subscripts 1, 2, and p denote the impeller inlet, impeller outlet, and pump mode, respectively.
The circumferential component of the absolute velocity at the impeller outlet can be calculated as
C u 2 , p = C u 2 , p Δ C u 2 , p
where C u 2 , p is only applicable under the assumption of an infinitely thin blade.
Under the assumed condition, the flow is congruent with the blade shape, and the flow angle equals the blade angle. In practice, the flow angle is smaller than the blade angle because of the deviated flow distribution on the blade pressure and suction surfaces. Taking this into consideration, the difference in velocity can be characterized by taking into account the slip effect as
Δ C u 2 , p = 1 σ p u 2 , p
The slip coefficient σ p can be obtained via the Stodola equation, which is
σ p = 1 π sin β 2 , p Z
Due to the complexity of the internal flow of turbo-machinery, it is difficult to precisely calculate the energy loss associated with each section. The hydraulic loss is analyzed as it is one major factor affecting hydraulic performance.
The hydraulic friction of the pump inlet, Δ h inf , p , can be estimated based on the Fanning equation:
Δ h inf , p = λ · l i n , p D i n , p · c i n , p 2 2 g
where λ is the friction coefficient and can be calculated from the Reynolds number [23]; l and D are the length and hydraulic diameter of the pump inlet.
When the flow enters the blade channel, the incidence loss caused by the inflow deviation can be calculated as
Δ h inc , p = f i n c 2 g u 1 , p Q Q d , p Q d , p 2
The surface friction loss can be derived from the standard pipe friction model:
Δ h sf , p = Z · λ l e d h , L a w a v 2 2 g
where Z is the blade number, le is the blade length, dh,La is the diameter of the impeller passage, and wav is the average relative velocity [25].
When the liquid flows through a diffuser or contraction part in the impeller channel, diffusion or contraction loss occurs, and it can be estimated by the local resistance loss estimation formula as
Δ h di , p = ξ w 1 , p 2 2 g
where ξ is the drag loss coefficient depending on the equivalent diffusion angle [26].
In some cases, flow separation may occur near the impeller surface due to blade incongruent flow. The separation loss needs to be taken into account as follows:
Δ h s e p , P = f s e q , P w 1 t , P w 2 , P 1.4 2 w 2 , P 2 g , w 1 t , P w 2 , P > 1.4 0 , w 1 t , P w 2 , P     1.4
where the flow separation loss coefficient fseq,p is set to 0.4.
The wake mixing loss is associated with the jet wake at the trailing edge of the impeller outlet, which can be calculated as
Δ h mix , P = 1 1 ε w a k e , P b 2 , P b V o l 2 1 1 ε w a k e , P 2 c m 2 , P 2 g
where b is the width, subscript vol denotes the volute, and ε w a k e , P is the wake coefficient [23].
After the work transfer process between the fluid and impeller, the high-energy entrained fluid enters the volute. However, the non-uniformity of the flow direction will cause impact loss in the volute chamber, which can be characterized as
Δ h inc , vol = ( v m 2 u 2 ) 2 1 ψ 2 b 2 b 3   2
where vm2 is the meridional velocity at impeller outlet, ψ is the blade exclusion coefficient, and b3 is the width of the volute inlet.
The friction loss along the volute and inside diffuser can be calculated via Equations (20) and (21):
Δ h vsf , p = λ l v o l D v o l v d s v o l 2 2 g
Δ h vdsf , p = λ 1 8 tan ( θ 2 ) v d s o 2 2 g [ F d s o F d s v o l 2 1 ]
where F is the area, θ is the equivalent diffuser angle, subscript vol is the volute, dsvol is the connected section of the spiral part and diffuser of volute, and dso is the diffuser outlet.
In the diffuser, the flow separation loss caused by divergent structure is also considered as
Δ h vdiff , p = k v d s v o l 2 2 g
where k is the diffuser loss coefficient [9].
Therefore, the theoretical head considering energy loss is obtained as
H p = H th , p Δ h p
It is noted that the theoretical energy loss model ignores secondary flow and a non-uniform velocity distribution in pump devices; such an assumption of idealized one-dimensional flow enables fast energy performance prediction. Similarly, the Euler equation also applies when the impeller runs reversely. Under such turbine mode operation, the flow direction and blade rotation are opposite compared with the pump modes, and the hydraulic energy is recovered into mechanical shaft work. In this process, one major difference is that the volute acts as a fluid distributor for the impeller. Therefore, the inlet flow angle to the turbine impeller is approximately equal to the volute angle, which is no longer the same as the outlet flow angle in pump mode [6].
The circumferential component of the absolute velocity at the impeller inlet under an infinite blade assumption is therefore calculated as
C u 1 , T =   cot α v · C m 1 , T
where α v is the volute angle, and C m 1 , T is the meridional velocity at impeller inlet of the turbine.
Considering that the diffusion part in pump mode turns into the contraction part in reverse mode, the separation losses are neglected. According to the discussion above, to calculate energy loss in turbine mode, we can then refer to Equations (13)–(16) and Equations (20) and (21). Then, the theoretical head of the PAT can be obtained accordingly. It is noted that in the loss analysis, the Sharma correlation was used to obtain the design flow rate of the PAT.

3. Results

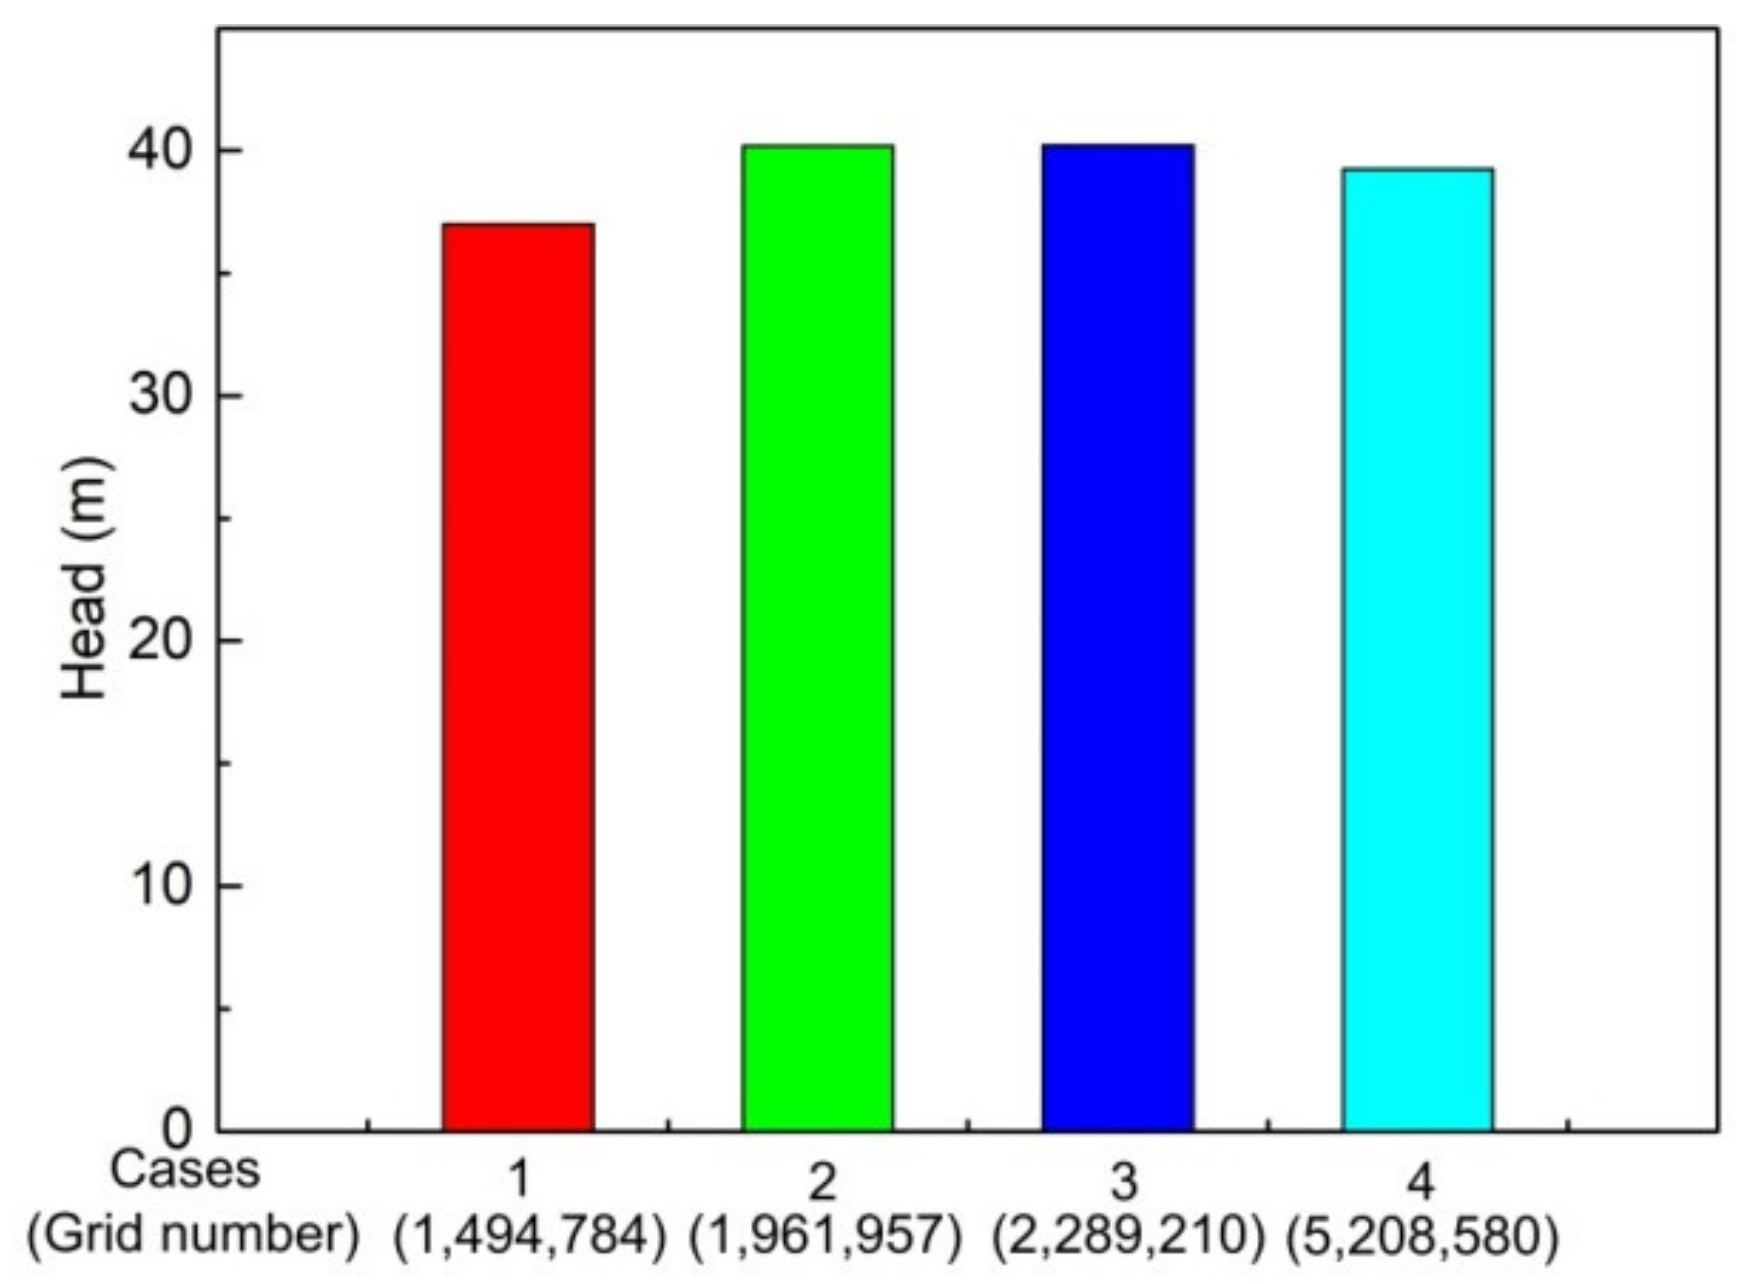
3.1. Grid Dependency Test

The mesh density needs to be selected at a balance between computational accuracy and computational efficiency. For this purpose, the grid dependency test was carried out using different mesh densities of the simulation domain. As shown in Figure 3, the respective mesh numbers of the four simulation cases were 1,494,784, 1,961,957, 2,289,210, and 5,208,580. The calculated heads were 37.01, 40.18, 40.21, and 39.25 for the four cases. As the results show no obvious differences with greater mesh density, the grid number of 1961,957 in Case 2 was selected to save computational power.

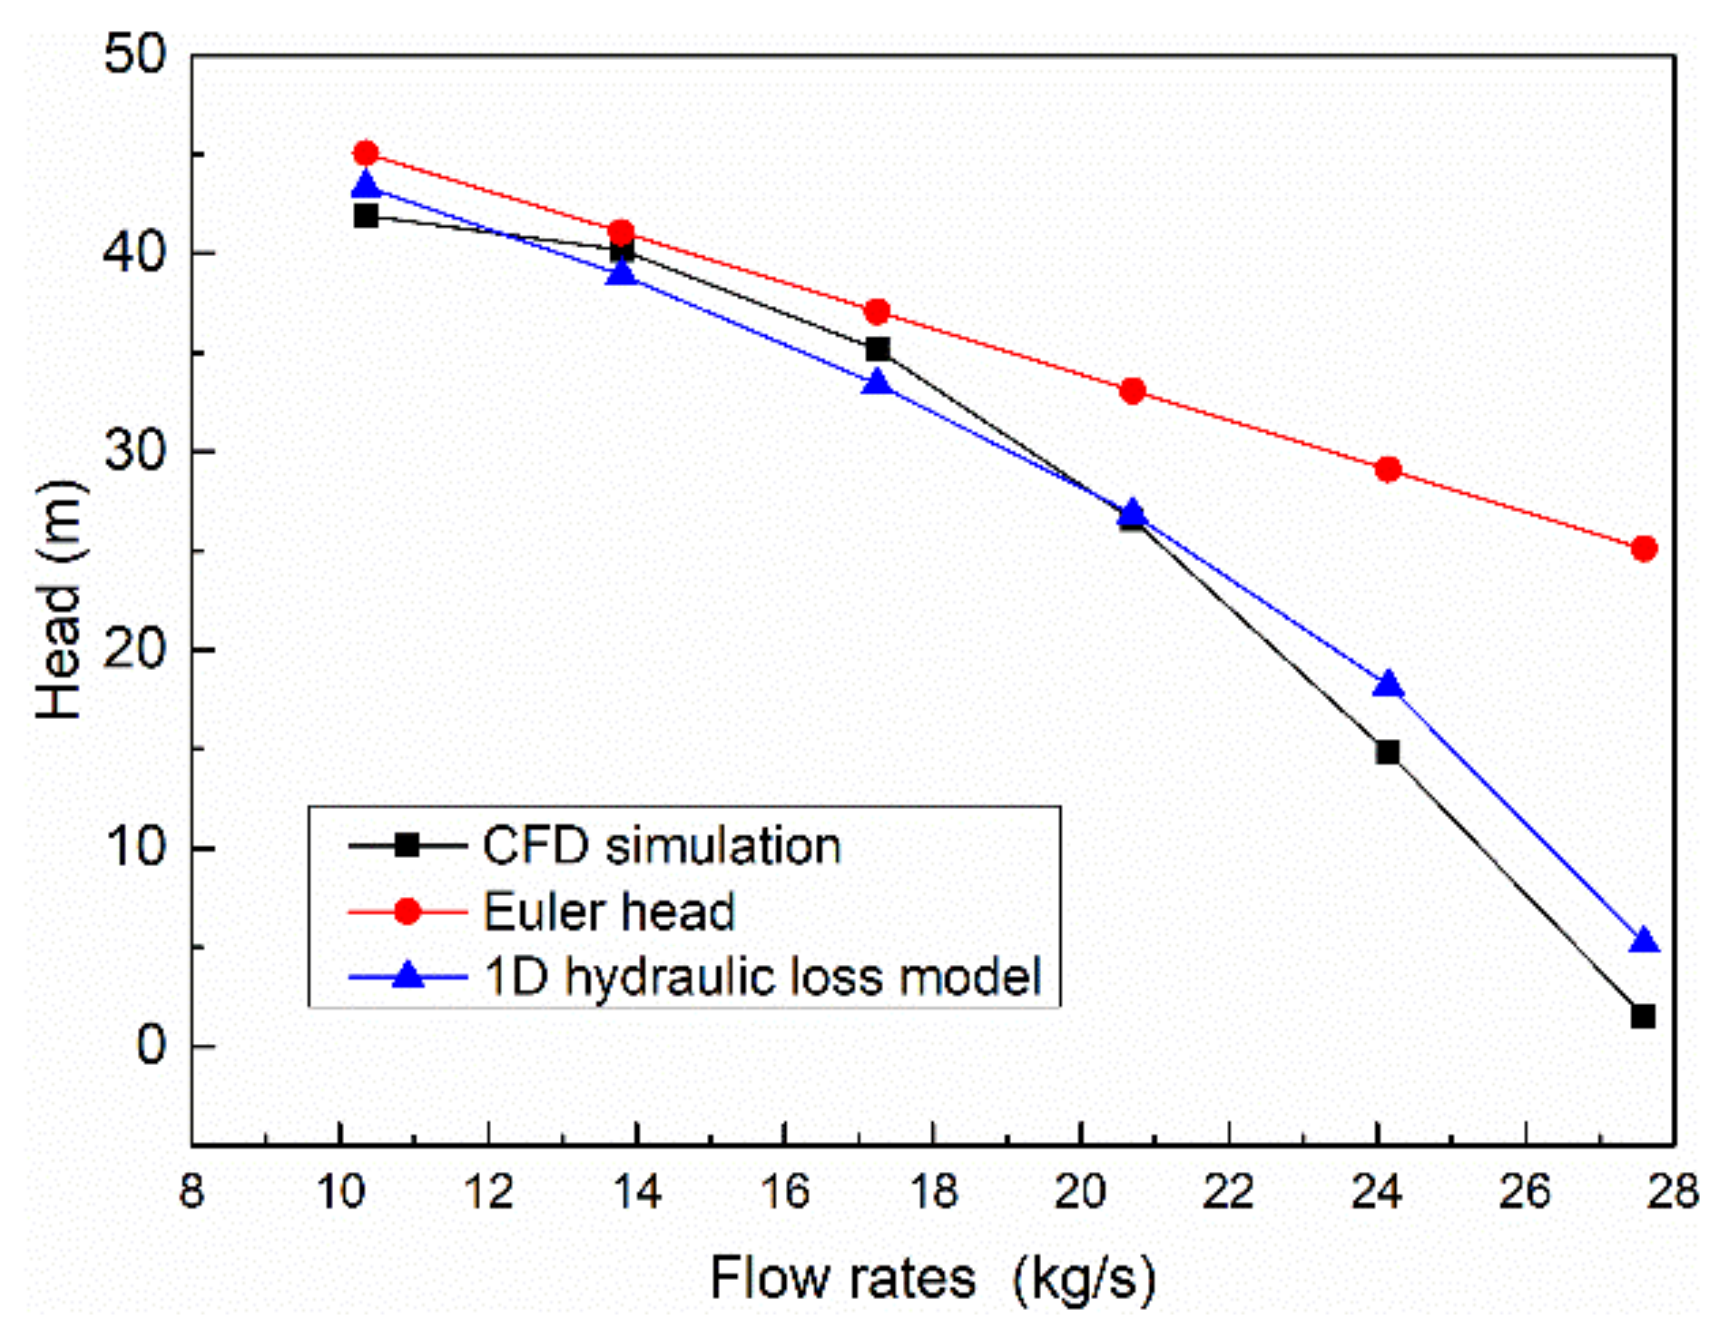
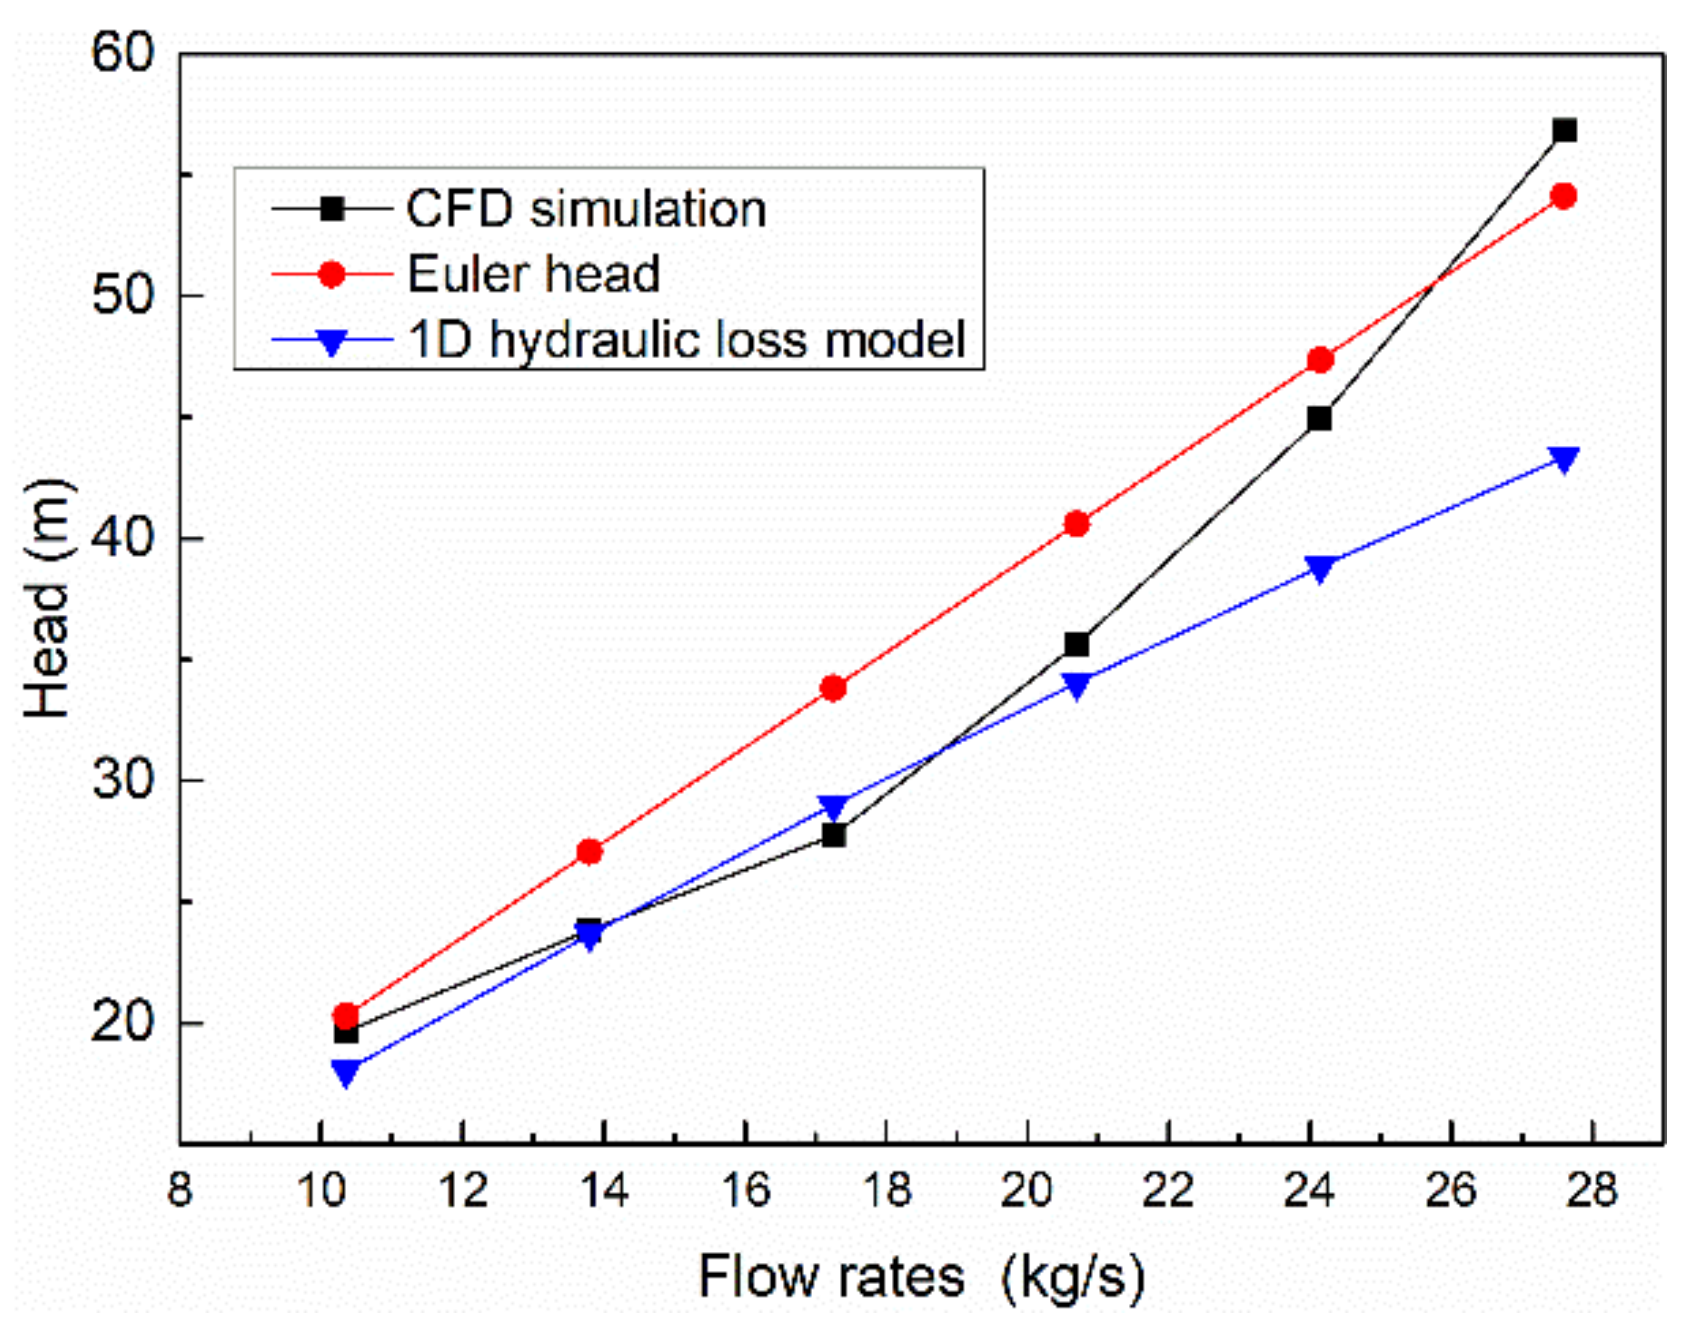
3.2. Model Verification

In general, the calculated y+ value is used as guidance for mesh configuration and the selection of the most suitable turbulence model when experimental data are not available to validate CFD models [27]. For the pump simulation using the standard kε turbulence model, the impeller mesh y+ should be around 200 to meet the requirement [28]. In this study, the calculated y+ values of the impeller mesh were all below 120, and 95% of them were smaller than 40. For the purpose of further verifying the CFD numerical method, the 1-D theoretical model was used to solve the pressure head of the pump and PAT.
Both experimental and 1-D theoretical results are available to examine the accuracy and reliability of simulation results, and experimental validations are primarily considered to obtain a direct contrast against measured data [29,30]. However, due to some limitations when experimental facilities are not satisfactory, the analytical method can be used to minimize experimental work to verify the results obtained from other techniques [31]. Such model verification was made by mathematically comparing the simulation result with analytical results, as introduced in the literature [32,33,34], to prove the applicability of the CFD model implementation. As shown in Figure 4 and Figure 5, the CFD results in different operating conditions were compared with the corresponding theoretical data. A good agreement was observed between the CFD simulation result and the theoretical calculations. The head curves of the numerical and theoretical results follow similar trends, and the averaged relative variations for the pump head and turbine head predictions are 17.03% and 8.65%, respectively. Since the pump head is too small at the largest flow rate, which causes a relatively high discrepancy, the averaged relative variation was calculated as 6.31% in smaller flow conditions in pump mode. This indicates that the numerical model used in this work provides acceptable estimates after quantitative verification with the theoretical method using the energy loss model. The CFD result was then used to provide a vision of the flow field and synergy distribution, since the reliability of the simulation was considered to be successfully demonstrated.

3.3. Sensitivity of Parameter Correlation

Although it is common sense that the velocity simultaneously changes with the pressure of the fluid flow, it is difficult to quantitatively evaluate the correlation of each interactive variable. In order to investigate the coordinated variation in pressure and velocity during pump and PAT operations, the sensitivity index of the pressure–velocity correlation (SPV) is introduced as follows:
S P V i k = min i min k C k * C k i +   ξ min i min k C k * C k i C k * C k i +   ξ min i min k C k * C k i
where C k * is the reference factor calculated as the head difference between each component, including the diffuser, volute, impeller, and pump inlet; C k i is the evaluation factor of each component calculated as the velocity difference between the inlet and outlet; and ξ is the correlation coefficient, which was set to 0.5.
Based on the one-dimensional theoretical result, the sensitivity of the pressure and velocity correlations was measured by SPV for each section of the pump and PAT. As shown in Figure 6, the effect of flow rate on SPV is different between the pump and PAT operations. For the pump mode, the pressure change is less sensible with velocity change at larger flow rates, while the trend is almost opposite for the PAT mode. This is because the rotation and flow direction both reverse in PAT mode; thus, the fluid in the impeller channel and diffuser displays contraction flow, which reduces the proportion of nonlinear separation loss, while the theoretical Euler head linearly varies with increasing flow rates. Also, it was found that when the device operates near high-efficiency operating conditions, the synchronous amplitude between pressure change and velocity change is relatively high. This is because in such region, the ratio of complex nonlinear energy loss is small, and this results in a more obvious peak for the pump mode considering the separation loss of divergent flow.
Despite the sensitivity behavior under various flow rates, it is beneficial to establish an overall perspective of sensitivity variations in the pressure and velocity changes in different device parts. As shown in Figure 7, the minimum SPV was obtained at the impeller part for both the pump and PAT, while a high synchronous amplitude was observed at the inlet and diffuser. This can be explained by the fact that the flow complexity increases due to the rotation of the impeller, causing the pressure change to not strictly follow a proportional relationship with velocity change; such a characteristic is reflected by the empirical energy loss model of the impeller. Moreover, it can be seen that for the design of the device inlet, volute, and diffuser parts, pressure drop can be largely eliminated by reducing the velocity drop, since the SPV of each part is relatively higher than that of the impeller.

3.4. Internal Flow Field Analysis

In order to obtain the internal flow field distribution characteristics of the PAT, numerical calculations were carried out under the inflow conditions of 17.25 kg/s and 27.6 kg/s. In order to ensure a stable state for the calculated results, the flow field at a typical time of 1.0 s after about 48 circles of rotation was selected. The results are shown in Figure 8, Figure 9 and Figure 10.
As can be seen from Figure 8, there is an obvious pressure gradient indicated by dense contour lines on the impeller surface, and the pressure on the leading edge of the blade is higher than that on the edge of the blade outlet. Comparing Figure 8a,b, the pressure on the blade surface is increased overall at a high flow rate in the PAT. This indicates that a larger driven force is added to the impeller blade when the inflow rate is increased.
In Figure 9, it can be observed that the static pressure decreases along the radial flow direction in the impeller. For example, for the PAT operated at 17.25 kg/s, the fluid pressure decreases from 0.51 MPa to 0.33 MPa in the channel located 90 degrees above the axis center. This can be explained by the energy recovery process, where the high-pressure fluid impacts the blade and transfers the pressure into the rotating mechanical energy of the impeller, resulting in a pressure drop in the fluid flow. Also, the lowest static pressure appears on the suction side of the blade leading edge, making this area prone to cavitation when operated under the lower back pressure of the PAT. Moreover, the pressure distribution is not symmetrical about the center, and the uniform pressure distribution is close to the volute tongue area, indicating that the tongue has a great influence on the pressure field of the PAT. In comparison, the pressure head is higher and the pressure distribution in the volute is more uniform at a large flow rate, which indicates that the energy conversion efficiency is relatively high under such conditions.
Figure 10 shows the respective synergy angle distributions of the PAT mid-plane under flow rates of 17.25 kg/s and 27.6 kg/s. It can be seen that at the flow rate of 27.6 kg/s, the cosine of the synergy angle is generally smaller compared to that for the operation at the flow rate of 17.25 kg/s. In Figure 10a, large cosine values are observed in the volute and near the pressure side of the impeller blade, indicating that the work done by the fluid is relatively small. In comparison, the synergy field in the volute and impeller channel in Figure 10b is significantly improved. This indicates that the momentum transfer of the turbine impeller can be enhanced under the high flow rate condition. In addition, it can be seen that the cosine of the synergy angle shows an alternating positive and negative distribution in regions of the blade leading edge, trailing edge, and volute tongue, which may be affected by rotor–stator interaction. This also suggests that design improvement in these regions should be considered to benefit PAT performance.

3.5. Performance Prediction

CFD simulations were carried out under different working conditions for both the pump mode and the turbine mode operations. Several key hydraulic performances were calculated, such as the head, power, torque, and efficiency. Moreover, the synergy index was analyzed.
Figure 11 shows the head–flow rate (H–Q) and power–flow rate (P–Q) curves of the centrifugal pump. It can be seen that both the power output and pump head are low under low flow rate conditions. The pump head decreases with increasing flow rate, and the highest head is about 41.91 m at a low flow rate. Meanwhile, with increasing flow rate, the lowest power of the pump is obtained at a flow rate of 27.6 kg/s.
The H–Q and P–Q curves of the PAT are shown in Figure 12. During the reverse operation mode, the high power area of the PAT deviates to the high flow rate condition. It can be seen that both the power output and pressure head are low under low flow rate conditions. The pressure head increases with increasing flow rate, and the highest head is about 56.81 m at a low flow rate. Meanwhile, with increasing flow rate of the PAT, the highest power of 15.37 kW is obtained at 27.6 kg/s.
Figure 13 shows the torque and efficiency performance of the pump, which are represented by T–Q and η–Q curves. It can be seen that the pump hydraulic efficiency increases first and then decreases rapidly with increasing flow rate, and the highest hydraulic efficiency reaches 56% at a flow rate of 17.25 kg/s. This variation trend is similar to that of the power output, indicating that an optimum flow rate exists for the most energy-efficient operation of a pump. It can also be seen that, with increasing flow rate, the shaft torque also increases. This implies that the driving force increases when the pump operates at a high flow rate at a fixed rotational speed.
As shown in Figure 14, the torque and efficiency increase with increasing flow rate in turbine mode. It is noted that when the flow rate is less than 17 kg/s, the torque remains small and even becomes negative. This means that the torque direction changes, and the fluid no longer applies work on the impeller. In such circumstances of low flow rate operation, the efficiency of the turbine decreases to zero and it becomes a power-consuming device, which shows different hydraulic characteristics in comparison with pump operation. In addition, the high efficiency zone of the PAT corresponds to a sharply decreasing efficiency zone of the pump. This indicates that the direct use of a PAT may lead to very limited hydraulic efficiency for the energy recovery process, and it is necessary to modify the design of the pump for use as a turbine.
Figure 15 shows the synergy angles of different pump sections under various operating conditions. A larger value of synergy angle indicates a better-synergized flow field. It can be seen that as the flow rate of the pump increases, the synergy angle of the pump impeller increases. This suggests that the flow field on the blade surface in the impeller improves at a large flow rate, which ultimately helps to enhance the pump torque. Moreover, the synergy angle of the pump outlet increases first and then decreases with increasing flow rate; the highest value is obtained at the optimized operating condition with the highest efficiency. It can also be seen that the synergy angle of the mid-plane decreases with increasing flow rate. This is caused by the high energy dissipation of pump expanding flow in the volute and impeller passage under a large flow rate. Such a dis-synergized flow field leads to a high pressure drop that ultimately affects the output of the pump head.
The synergy angle of the PAT is shown in Figure 16. The synergy angle of the PAT impeller also increases with increasing flow rate, as the enhanced momentum transfer between the fluid and impeller blade increases the torque of the PAT. Meanwhile, the synergy angles of the outlet and mid-plane generally increase in PAT mode, which corresponds to the increasing turbine efficiency and turbine head as well. This indicates that under the effective operating conditions in our study, the flow field synergy can be improved by increasing the flow rate, which is beneficial for energy transfer enhancement of the PAT performance.

4. Conclusions

This paper studied the hydraulic performance and flow behavior of a centrifugal pump running as a turbine. Through the established 1-D theoretical model and 3-D CFD model, both the inherent correlation degree between pressure and velocity and the field synergy degree were investigated. The main conclusions can be summarized as follows.
(1)
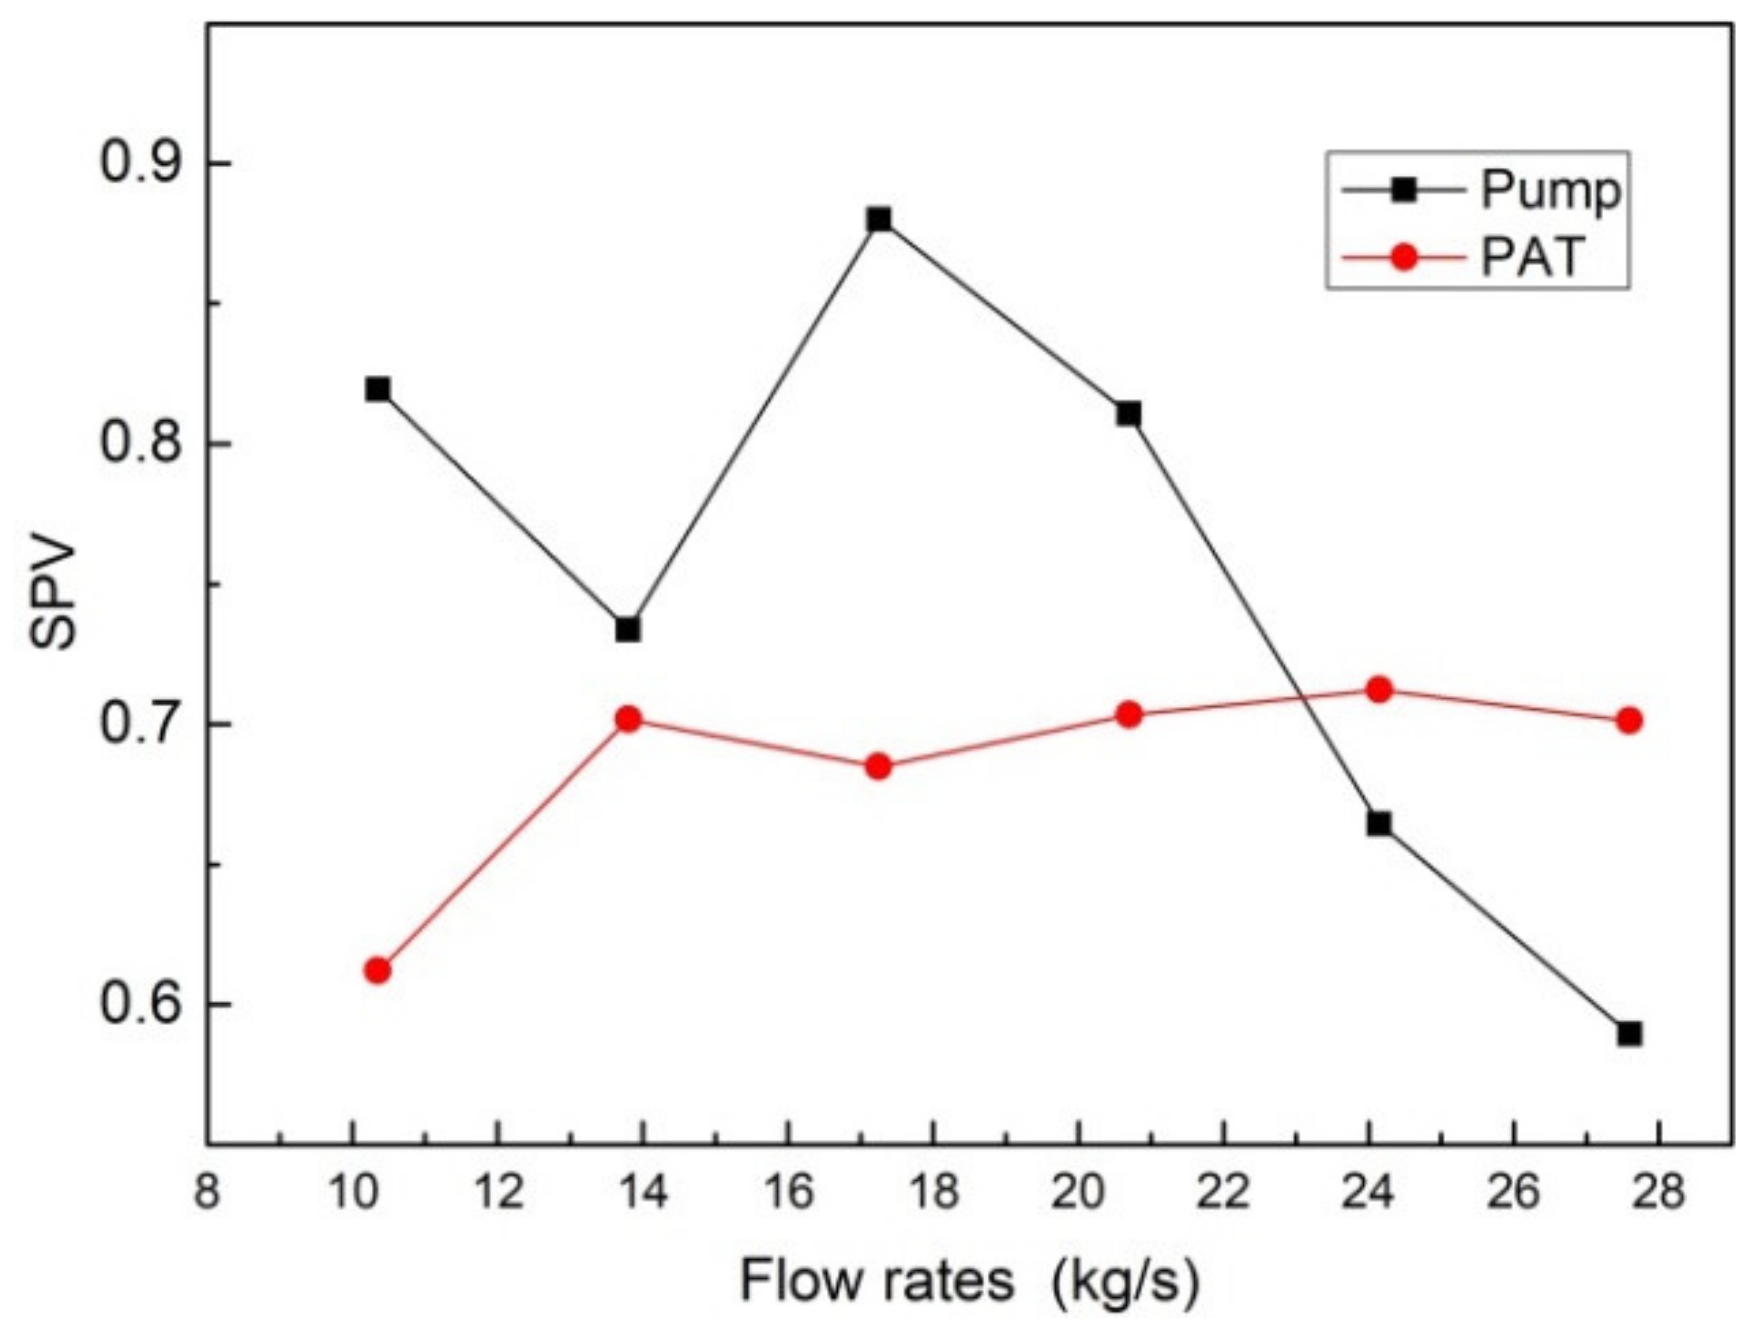
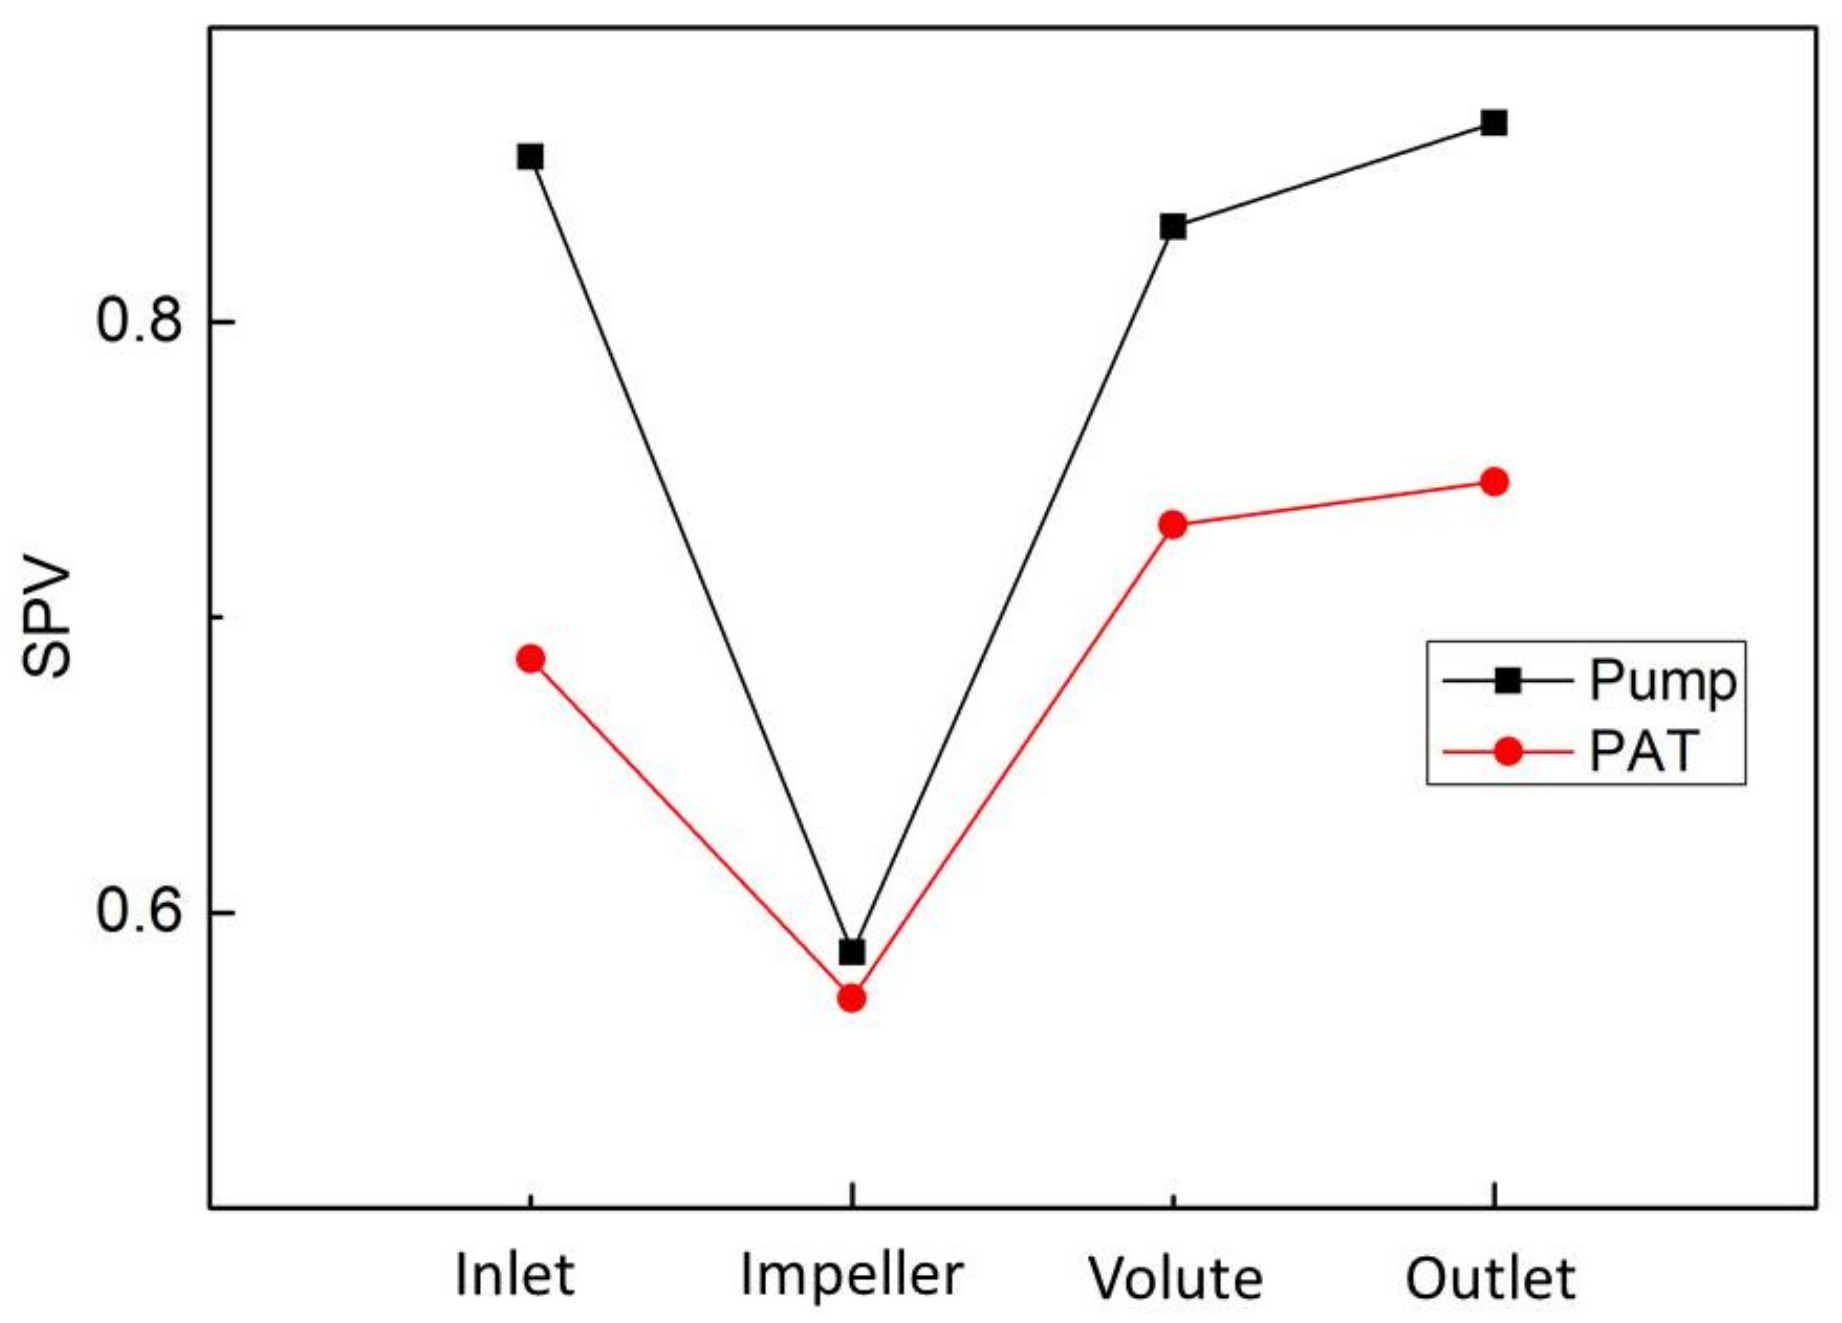
The sensitivity index of the pressure–velocity correlation (SPV) can be used to measure the coordinated variation in pressure and velocity in the pump and PAT. The pressure change is less sensible with velocity change at higher pump rates, while the trend is generally the opposite for the PAT. Compared to the minimum SPV at the impeller, high synchronous amplitudes are obtained at the inlet and diffuser, suggesting that pressure drop can be largely eliminated by avoiding large velocity drop in these areas.
(2)
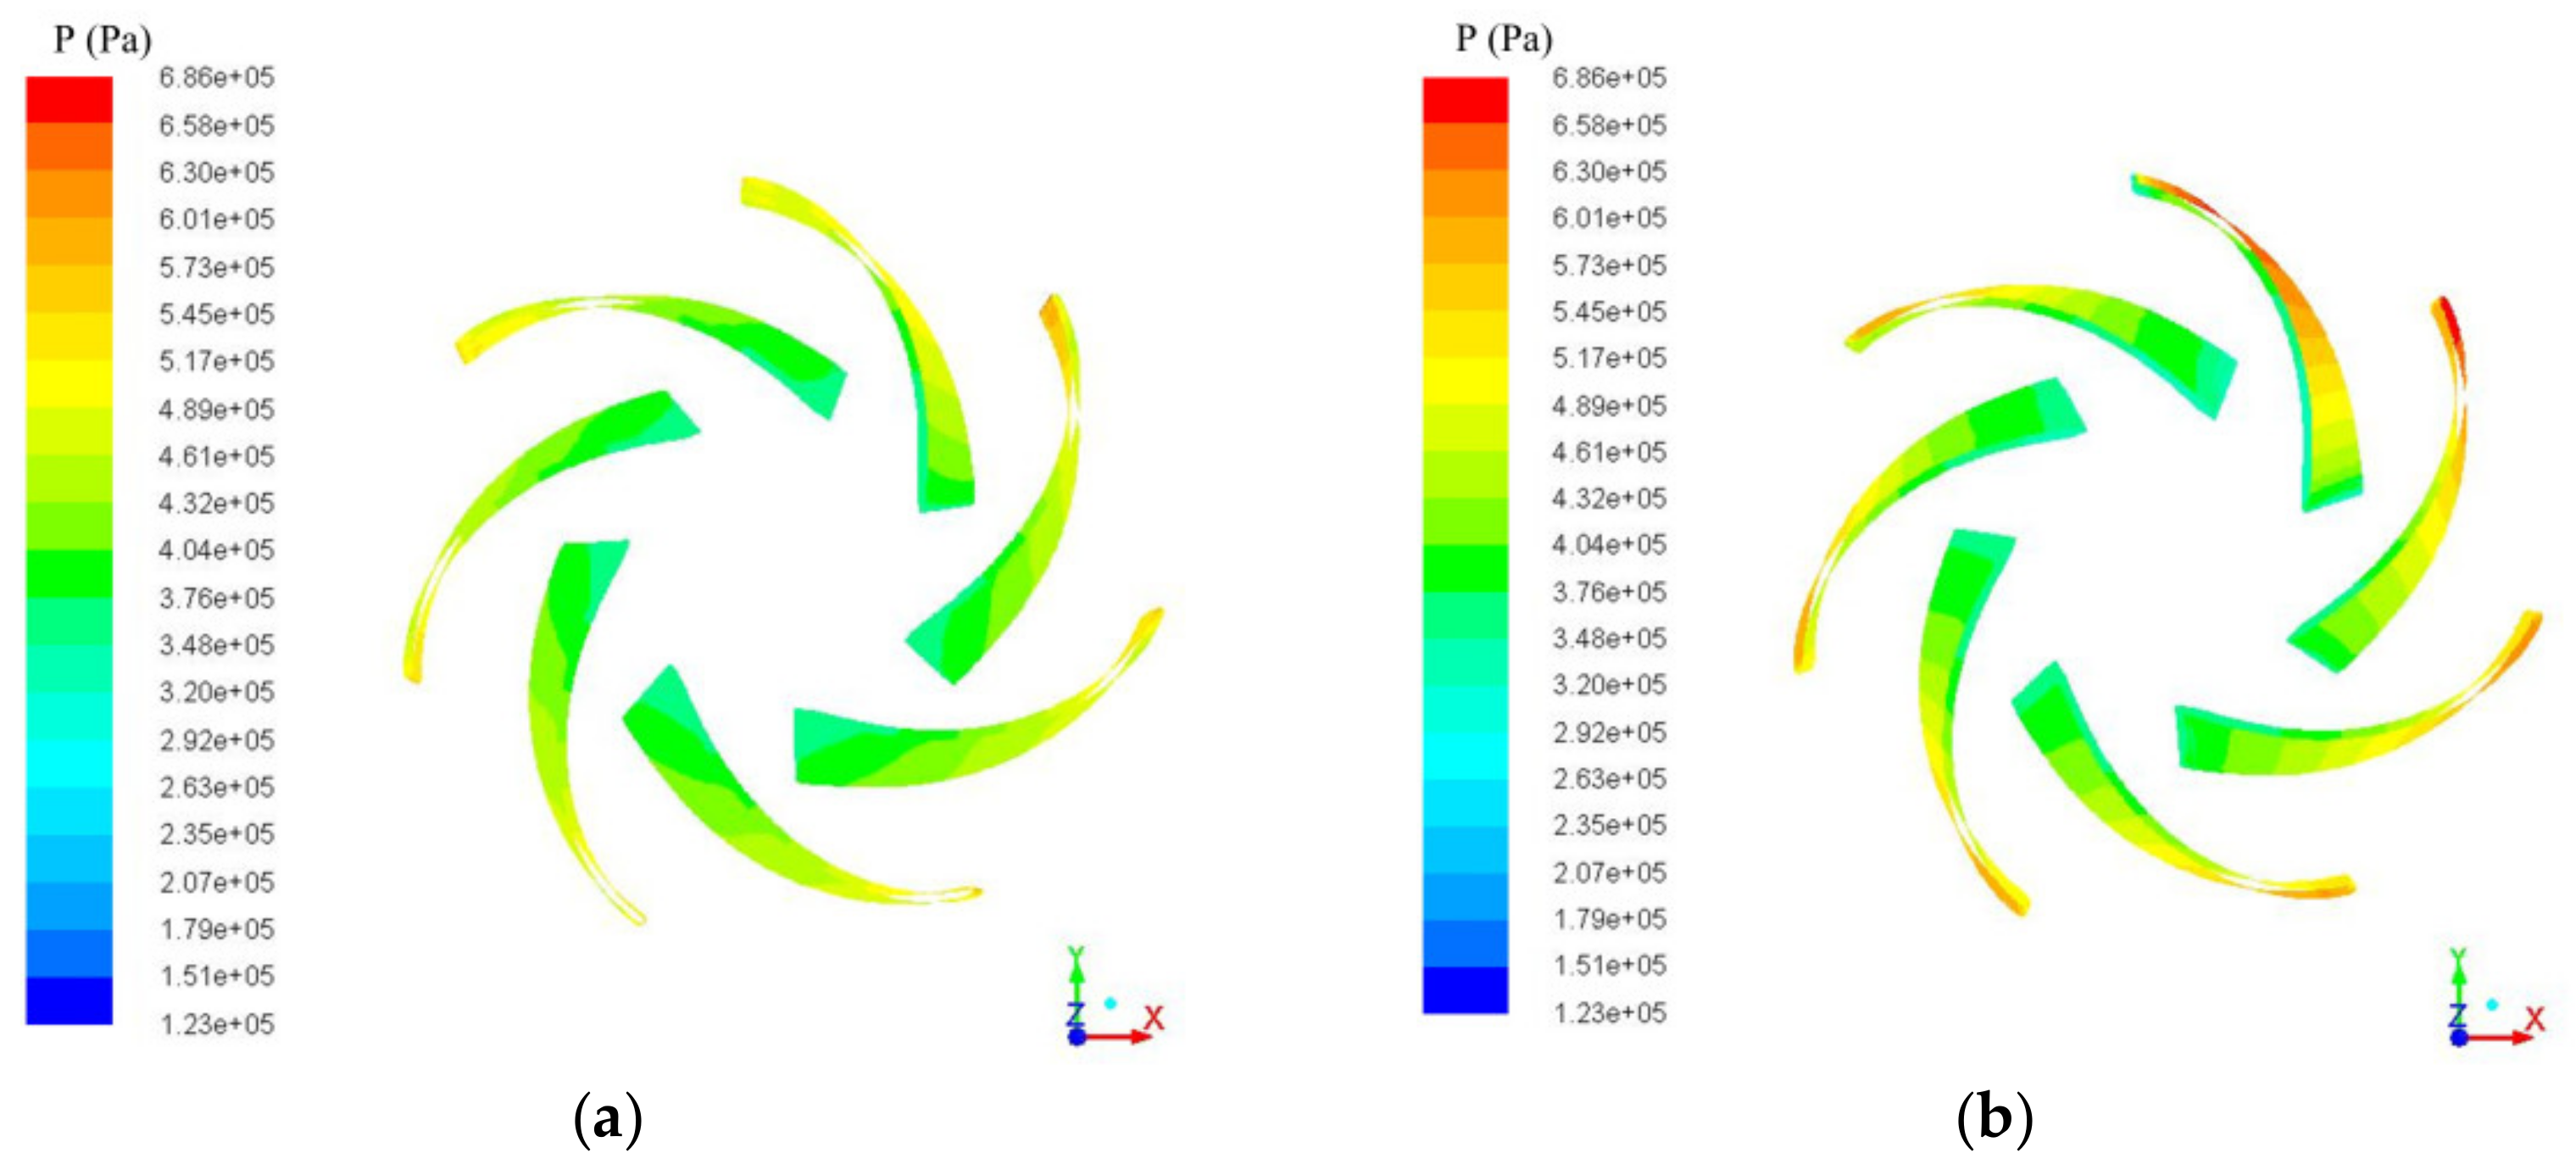
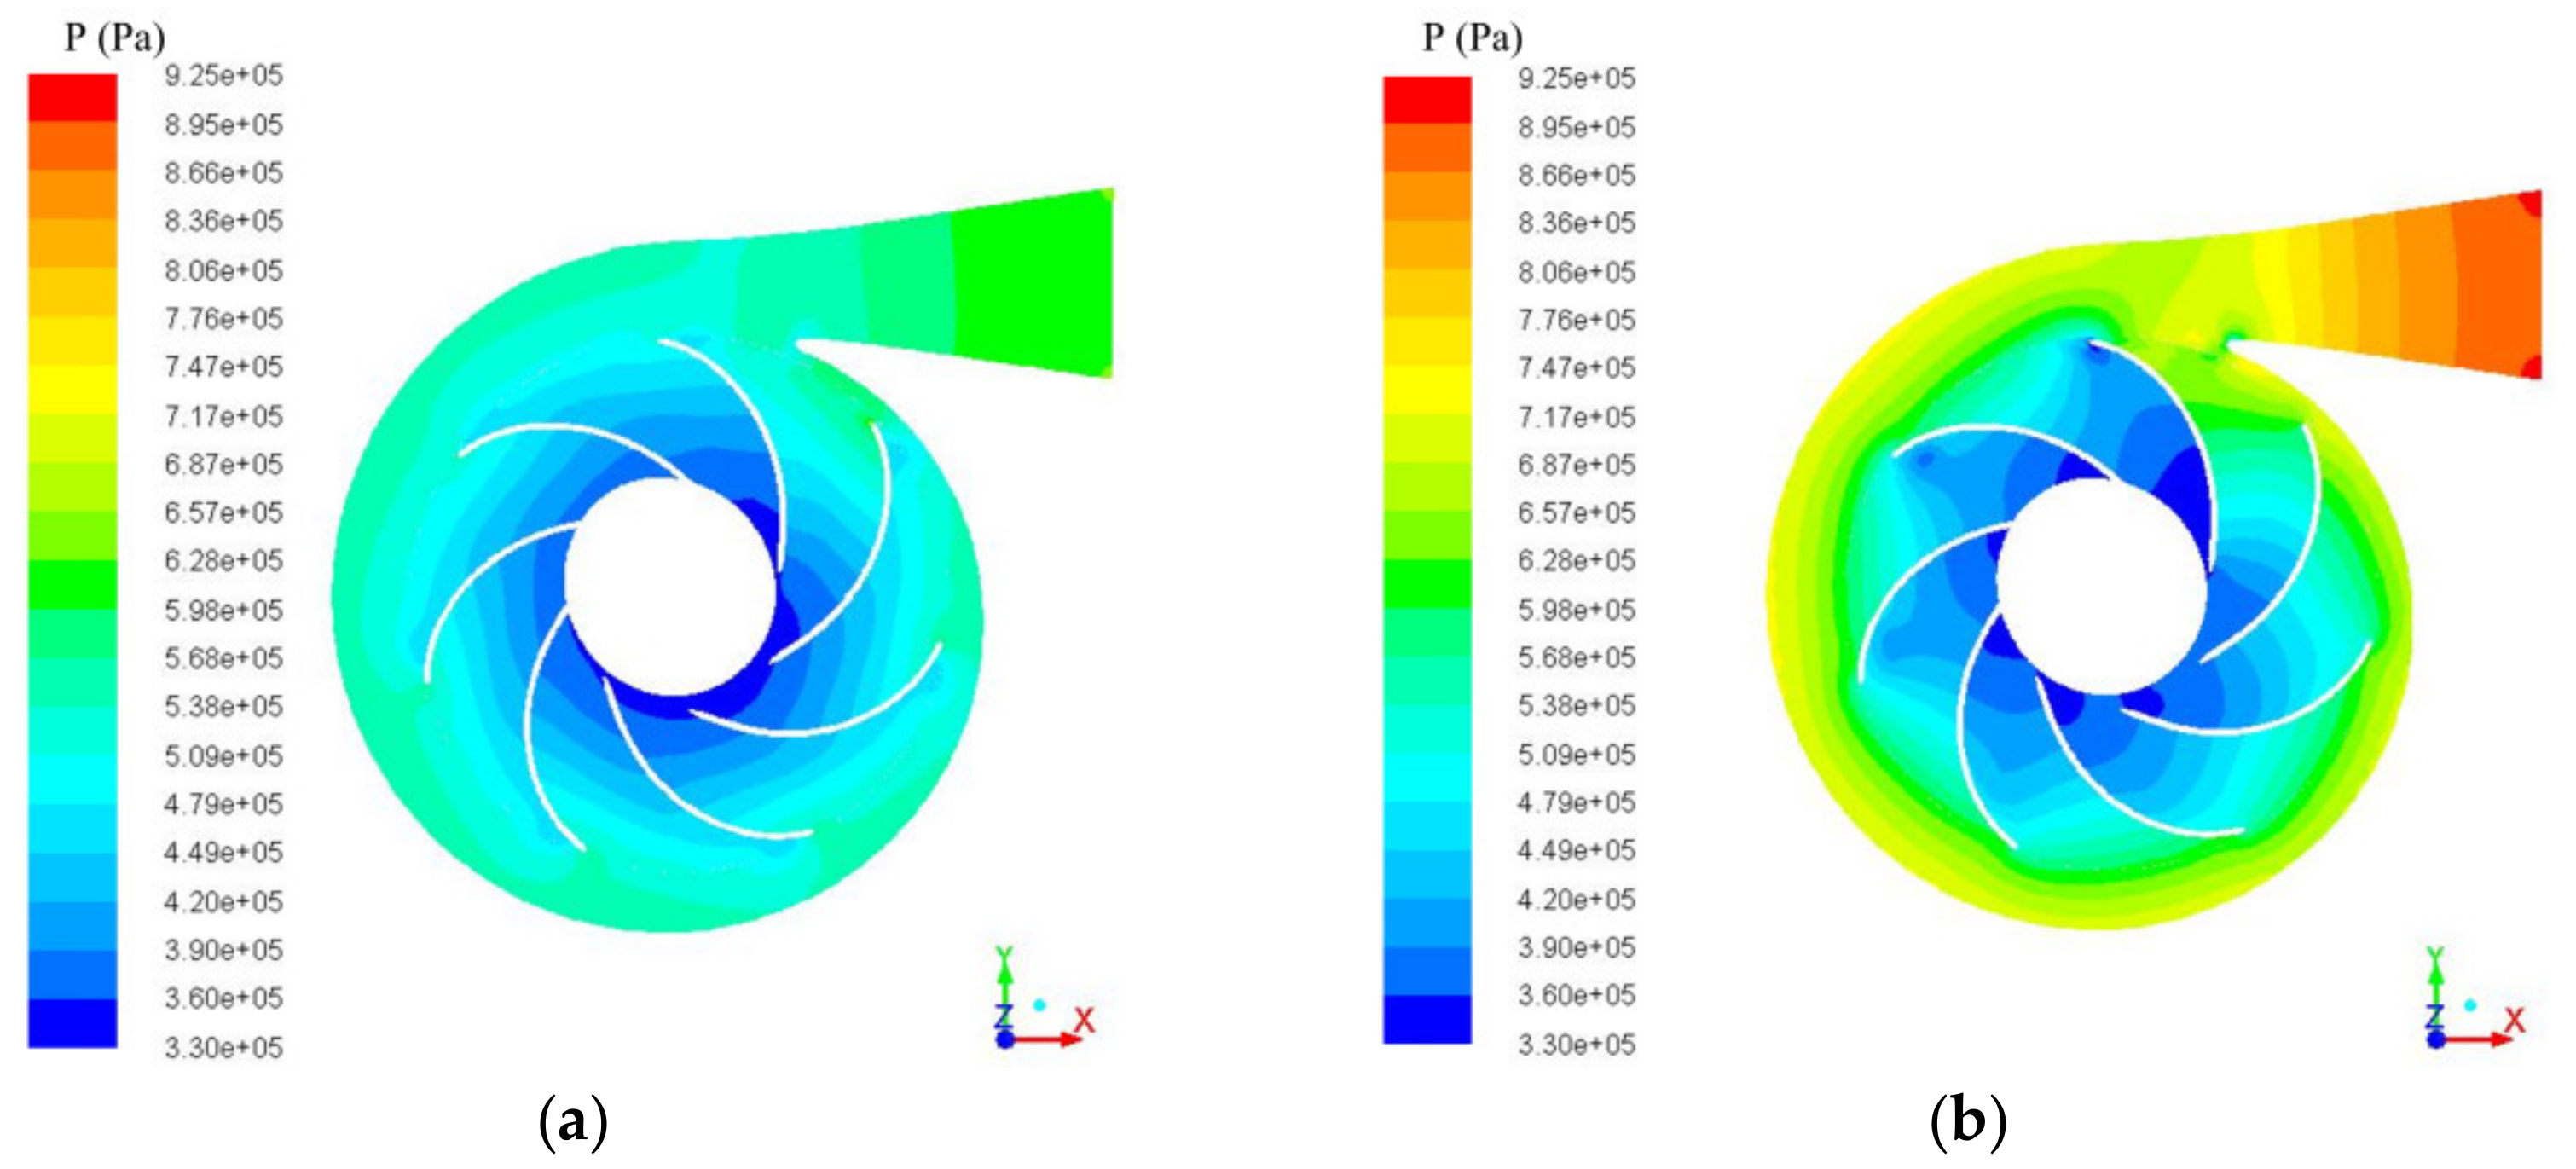
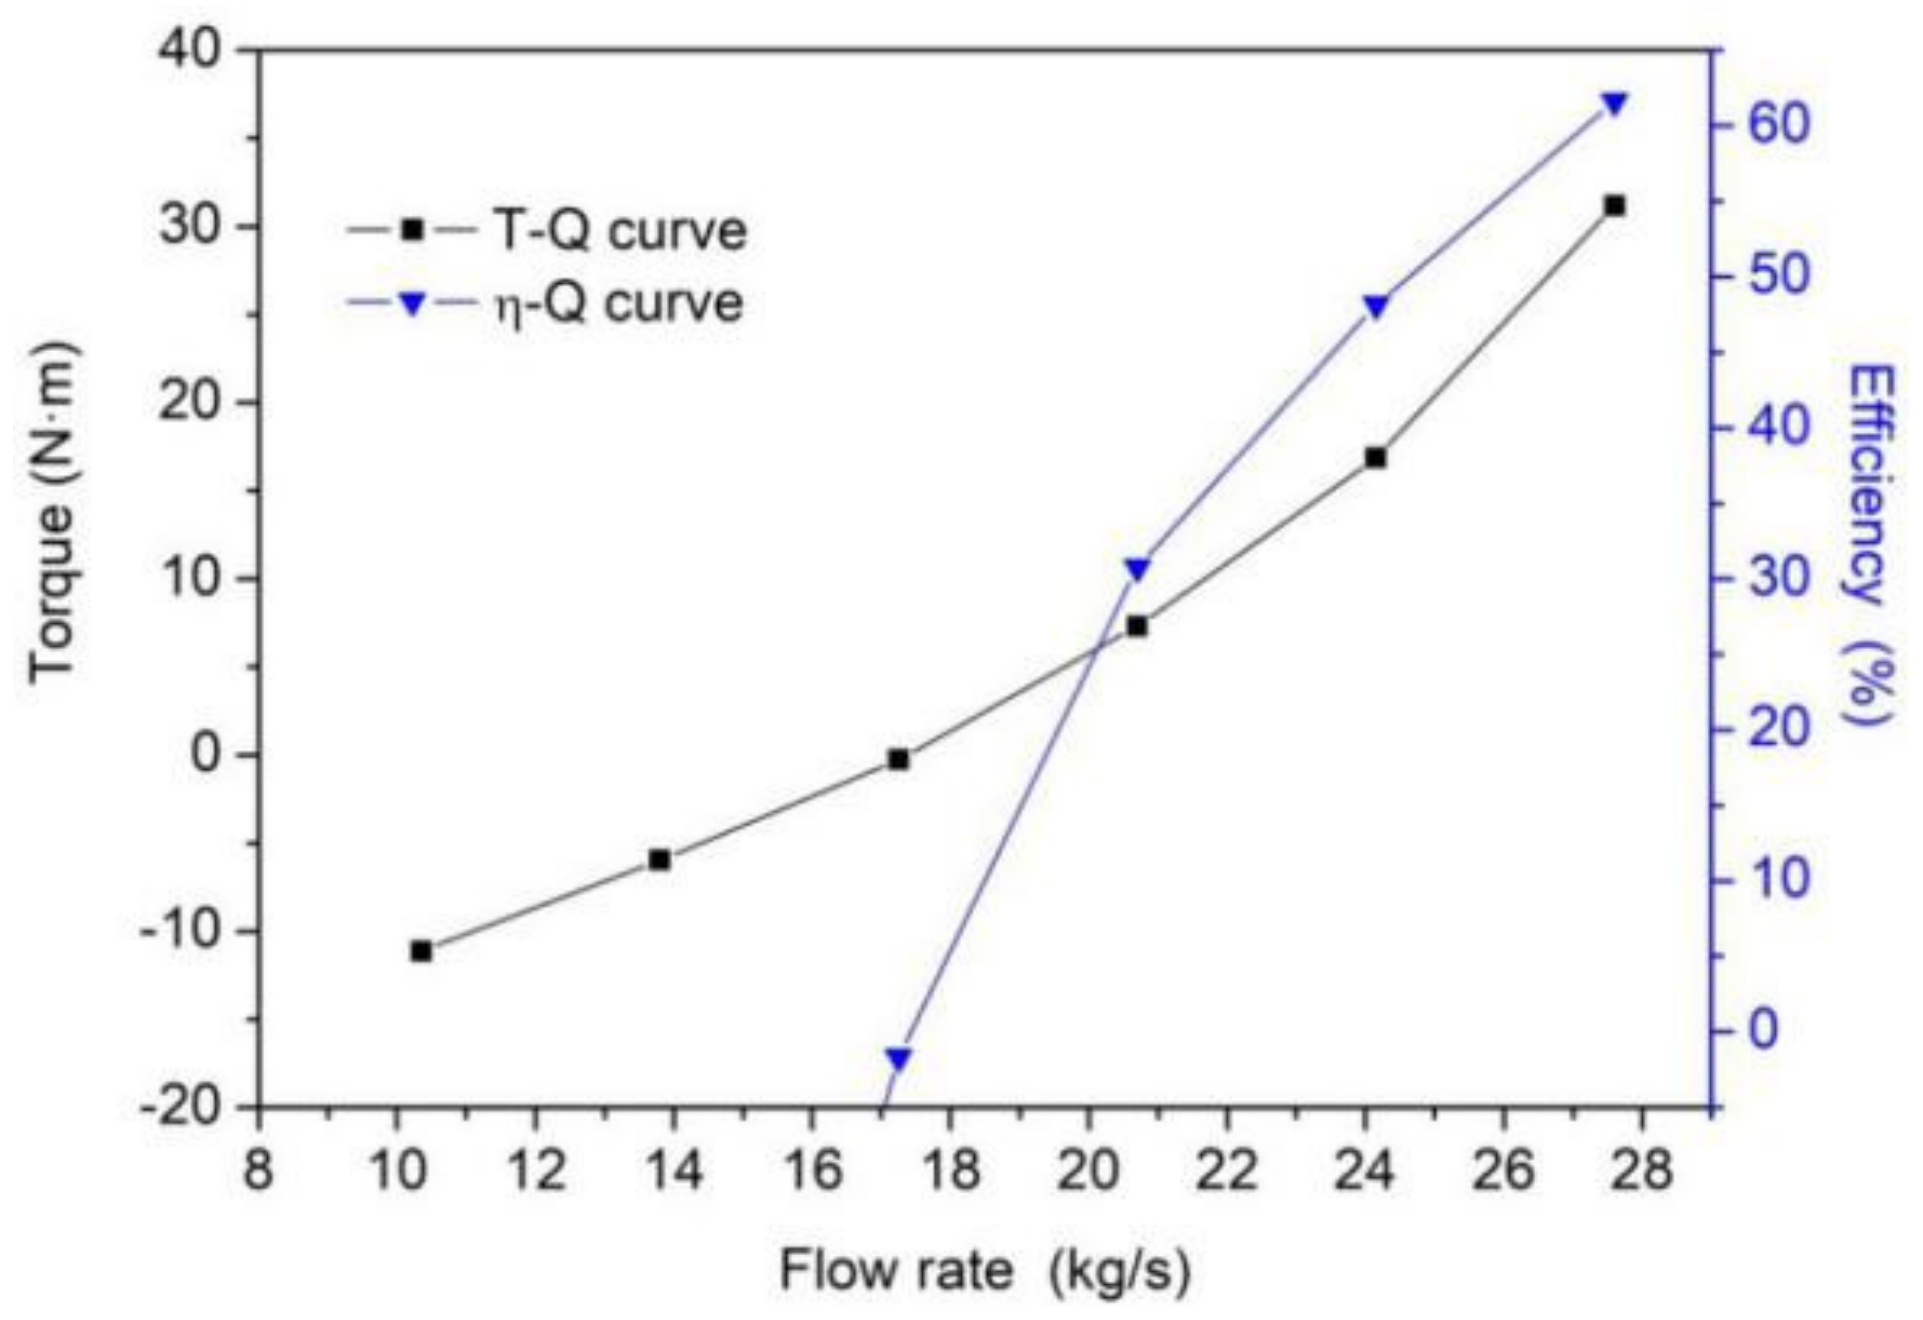
According to the numerical results, the best working zone of the PAT shifts to a larger flow rate compared to that of the pump mode. With increasing flow rate, the head and torque are enhanced, and the pressure distribution in both the blade surface and volute shows a more obvious gradient. In addition, the lowest static pressure appears on the suction side of the blade leading edge, making this area cavitation-prone when operated under lower back pressure of the PAT.
(3)
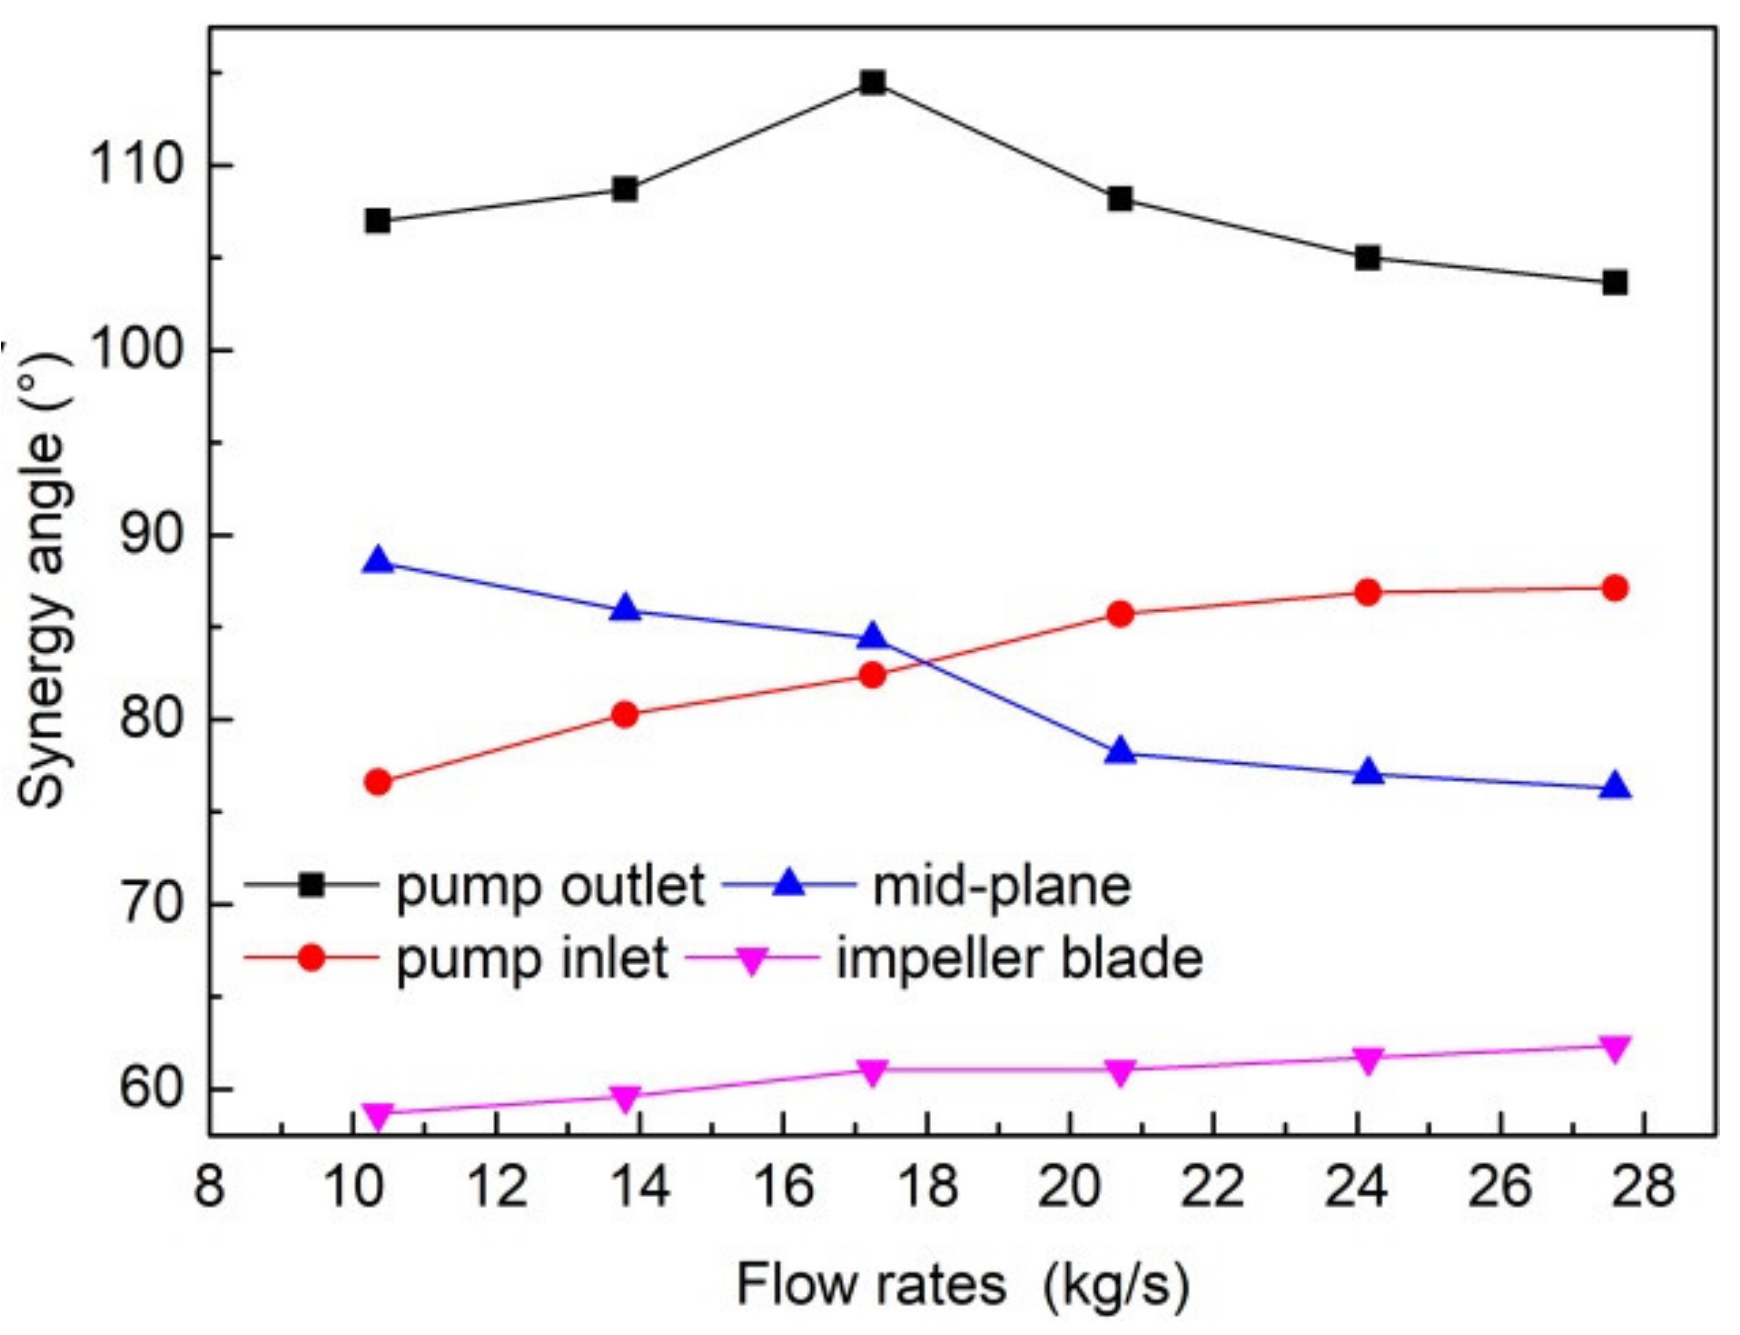
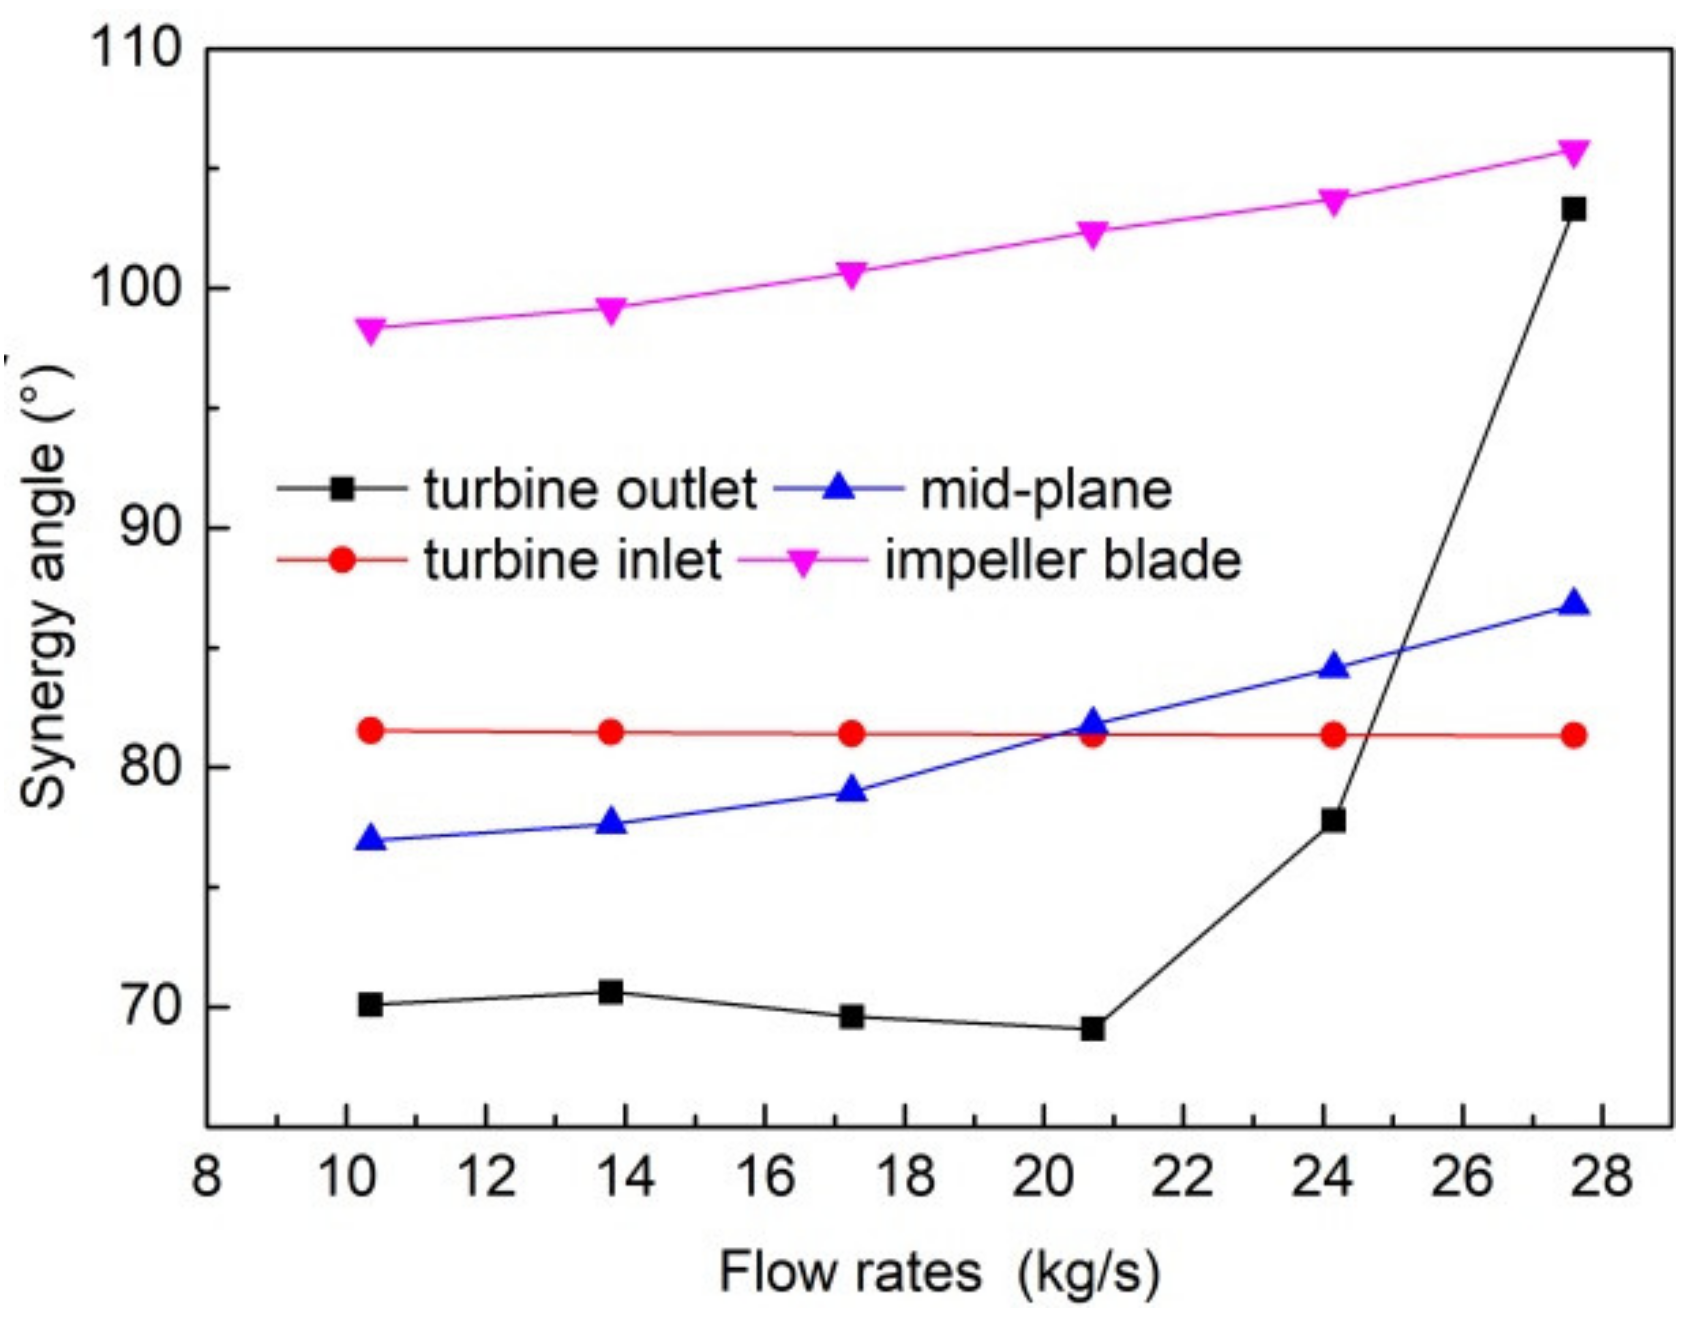
The synergy angle of the impeller surface of the pump and PAT increases with increasing flow rate. The maximum synergy angle of the outlet is obtained at the flow rate with the highest efficiency. Also, the synergy angle of the mid-plane shows a similar trend to the head variation with flow rate. For the synergy field of the PAT, a strong disordered distribution exists in regions of the blade leading edge, trailing edge, and volute tongue, indicating that proper design of these areas could be beneficial for performance improvement of the energy recovery process.
(4)
The synergy analysis and the sensitivity correlation analysis can be applied to quantitatively evaluate the energy transfer performance and the inherent correlation between pressure and velocity. It is also expected to provide a basis for further design improvement and selection guidance for the operating conditions of the pump and PAT.

Author Contributions

Conceptualization, Z.C. and J.D.; methodology, Z.C.; software, Z.C. and L.Z.; writing—original draft preparation, Z.C.; writing—review and editing, Z.C., L.Z., J.D. and L.L.; supervision, J.D. All authors have read and agreed to the published version of the manuscript.

Funding

This research was funded by the Fundamental Research Funds for the Central Universities (Grant No. xjh012019022), the Natural Science Basic Research Program of Shaanxi Province (Grant No. 2021JQ052), and the National Natural Science Foundation of China (Grant No. 21978227).

Institutional Review Board Statement

Not applicable.

Informed Consent Statement

Not applicable.

Data Availability Statement

Not applicable.

Conflicts of Interest

The authors declare no conflict of interest.

References

  1. Williams, A.A. The turbine performance of centrifugal pumps: A comparison of prediction methods. Proc. Inst. Mech. Eng. A J. Power Energy 1994, 208, 59–66. [Google Scholar] [CrossRef]
  2. Kaunda, C.S.; Kimambo, C.Z.; Nielsen, T.K. A technical discussion on micro-hydropower technology and its turbines. Renew. Sustain. Energy Rev. 2014, 35, 445–459. [Google Scholar] [CrossRef]
  3. Binama, M.; Su, W.T.; Li, X.B.; Li, F.C.; Wei, X.Z.; An, S. Investigation on pump as turbine (PAT) technical aspects for micro hydropower schemes: A state-of-the-art review. Renew. Sustain. Energy. Rev. 2017, 79, 148–179. [Google Scholar] [CrossRef]
  4. Bai, L.; Zhou, L.; Han, C.; Zhu, Y.; Shi, W. Numerical study of pressure fluctuation and unsteady flow in a centrifugal pump. Processes 2019, 7, 354. [Google Scholar] [CrossRef] [Green Version]
  5. Jing, T.; Cheng, Y.; Wang, F.; Bao, W.; Zhou, L. Numerical Investigation of Centrifugal Blood Pump Cavitation Characteristics with Variable Speed. Processes 2020, 8, 293. [Google Scholar] [CrossRef] [Green Version]
  6. Carravetta, A.; Houreh, S.D.; Ramos, H.M. Pumps as Turbines, Fundamentals and Applications; Springer: Cham, Switzerland, 2018. [Google Scholar]
  7. Miao, S.; Yang, J.; Shi, F.; Wang, X.; Shi, G. Research on energy conversion characteristic of pump as turbine. Adv. Mech. Eng. 2018, 10, 1–10. [Google Scholar] [CrossRef] [Green Version]
  8. Pérez-Sánchez, M.; Simão, M.; López-Jiménez, P.; Ramos, H. CFD analyses and experiments in a PAT modeling: Pressure variation and system efficiency. Fluids 2017, 2, 51. [Google Scholar] [CrossRef] [Green Version]
  9. Yang, S.; Shahram, D.; Kong, F. Theoretical, numerical and experimental prediction of pump as turbine performance. Renew. Energy 2012, 48, 507–513. [Google Scholar] [CrossRef]
  10. Štefan, D.; Rossi, M.; Hudec, M.; Rudolf, P.; Nigro, A.; Renzi, M. Study of the internal flow field in a pump-as-turbine (PaT): Numerical investigation, overall performance prediction model and velocity vector analysis. Renew. Energy 2020, 156, 158–172. [Google Scholar] [CrossRef]
  11. Barrio, R.; Fernandez, J.; Blanco, E.; Parrondo, J.; Marcos, A. Performance characteristics and internal flow patterns in a reverse-running pump–turbine. Proc. Inst. Mech. Eng. C J. Mech. Eng. Sci. 2012, 226, 695–708. [Google Scholar] [CrossRef]
  12. Lin, P.; Li, Y.; Xu, W.; Chen, H.; Zhu, Z. Numerical Study on the Influence of Inlet Guide Vanes on the Internal Flow Characteristics of Centrifugal Pump. Processes 2020, 8, 122. [Google Scholar] [CrossRef] [Green Version]
  13. Binama, M.; Su, W.; Cai, W.; Li, X.; Muhirwa, A.; Li, B.; Bisengimana, E. Blade trailing edge position influencing pump as turbine (PAT) pressure field under part-load conditions. Renew. Energy 2019, 136, 33–47. [Google Scholar] [CrossRef]
  14. Balacco, G. Performance Prediction of a Pump as Turbine: Sensitivity Analysis Based on Artificial Neural Networks and Evolutionary Polynomial Regression. Energies 2018, 11, 3497. [Google Scholar] [CrossRef] [Green Version]
  15. Xue, P.; Liu, Z.; Lu, L.; Gao, Z.; Meng, X. Experimental Research on the Rotating Stall of a Pump Turbine in Pump Mode. Water 2019, 11, 2426. [Google Scholar] [CrossRef] [Green Version]
  16. Wang, L.; Asomani, S.N.; Yuan, J.; Appiah, D. Geometrical Optimization of Pump-As-Turbine (PAT) Impellers for Enhancing Energy Efficiency with 1-D Theory. Energies 2020, 13, 4120. [Google Scholar] [CrossRef]
  17. Guo, Z.; Li, D.; Wang, B. A novel concept for convective heat transfer enhancement. Int. J. Heat Mass Transf. 1998, 41, 2221–2225. [Google Scholar] [CrossRef]
  18. Xiao, H.; Dong, Z.; Long, R.; Yang, K.; Yuan, F. A study on the mechanism of convective heat transfer enhancement based on heat convection velocity analysis. Energies 2019, 12, 4175. [Google Scholar] [CrossRef] [Green Version]
  19. Kallin, D.; Nordenskjöld, K. Fluid-Structure Interaction Analysis of a Centrifugal Fan; Chalmers University of Technology: Gothenburg, Sweden, 2017. [Google Scholar]
  20. Tiwari, G.; Kumar, J.; Prasad, V.; Patel, V.K. Utility of CFD in the design and performance analysis of hydraulic turbines-A review. Energy Rep. 2020, 6, 2410–2429. [Google Scholar] [CrossRef]
  21. Qian, Z.; Wang, F.; Guo, Z.; Lu, J. Performance evaluation of an axial-flow pump with adjustable guide vanes in turbine mode. Renew. Energy 2016, 99, 1146–1152. [Google Scholar] [CrossRef]
  22. He, Y.; Lei, Y.; Tian, L.; Chu, P.; Liu, Z. An analysis of three field synergy on heat transfer augmentation with low penalty of pressure drop. J. Eng. Thermophys. 2009, 30, 1904–1906. [Google Scholar]
  23. Liu, M.; Tan, L.; Cao, S. Theoretical model of energy performance prediction and BEP determination for centrifugal pump as turbine. Energy 2019, 172, 712–732. [Google Scholar] [CrossRef]
  24. Kara Omar, A.; Khaldi, A.; Ladouani, A. Prediction of centrifugal pump performance using energy loss analysis. Aust. J. Mech. Eng. 2017, 15, 210–221. [Google Scholar] [CrossRef]
  25. Gülich, J.F. Centrifugal Pumps, 4th ed.; Springer Nature: Cham, Switzerland, 2020. [Google Scholar]
  26. Yang, J.; Ji, Y.; Lin, B.; Ma, Q.; Luo, Y.; Li, Z. Energy performance prediction of single-stage single-suction centrifugal pump under multiple operating conditions. J. Lanzhou Univ. Technol. 2020, 46, 48. [Google Scholar]
  27. Davidson, A.A.; Salim, S.M. CFD Modelling of Rotating Annular Flow Using Wall y+. In Transactions on Engineering Technologies; IMECS 2018; Springer: Singapore, 2019; pp. 318–330. [Google Scholar]
  28. Li, X.; Yuan, S.; Pan, Z.; Li, Y.; Yang, J. Numerical simulation of whole flow field for centrifugal pump with structured grid. Trans. Chin. Soc. Agric. Mach. 2012, 28, 67–72. [Google Scholar]
  29. Dass, A.; Gedupudi, S. 1-D semi-analytical modeling and parametric study of a single phase rectangular Coupled Natural Circulation Loop. Chem. Eng. Sci. 2019, 207, 105–129. [Google Scholar] [CrossRef] [Green Version]
  30. Computational Fluid Dynamics Committee (Ed.) Guide: Guide for the Verification and Validation of Computational Fluid Dynamics Simulations (AIAA G-077-1998(2002)); American Institute of Aeronautics and Astronautics: Reston, VA, USA, 1998. [Google Scholar]
  31. Al-Suhaibani, Z.A. Flow Analysis and Modeling of Centrifugal Compressor Impellers, ProQuest Dissertations. Ph.D. Thesis, Michigan State University, East Lansing, MI, USA, 2005. [Google Scholar]
  32. Duarte, J.; Valencia, G.; Obregón, L. Development of a CFD model to predict the thermal performance of solar collectors. Contemp. Eng. Sci. 2018, 11, 3647–3654. [Google Scholar] [CrossRef]
  33. Sun, X.; Ma, Y.; Liu, X.; Sun, D. Flow stability model of centrifugal compressors based on eigenvalue approach. AIAA J. 2016, 54, 2361–2376. [Google Scholar] [CrossRef]
  34. Matteo, L.; Dazin, A.; Tauveron, N. Modelling of a centrifugal pump using the CATHARE-3 one-dimensional transient rotodynamic pump model. Int. J. Fluid Mach. Syst. 2019, 12, 147–158. [Google Scholar] [CrossRef]
Figure 1. Geometric model of the centrifugal pump with an open volute.
Processes 09 01031 g001
Figure 2. Simulation domain of the mesh model.
Processes 09 01031 g002
Figure 3. Assessment of mesh dependence.
Processes 09 01031 g003
Figure 4. Comparison between numerical and theoretical results of the pump.
Processes 09 01031 g004
Figure 5. Comparison between numerical and theoretical results of the PAT.
Processes 09 01031 g005
Figure 6. SPV variation at different flow rates of the pump and PAT.
Processes 09 01031 g006
Figure 7. SPV variation in different parts of the pump and PAT.
Processes 09 01031 g007
Figure 8. The static pressure distribution at the PAT blade surface under different flow rates: (a) Q = 17.25 kg/s; (b) Q = 27.6 kg/s.
Processes 09 01031 g008
Figure 9. The static pressure distribution of the PAT mid-plane under different flow rates: (a) Q = 17.25 kg/s; (b) Q = 27.6 kg/s.
Processes 09 01031 g009
Figure 10. The synergy degree of the PAT mid-plane under different flow rates: (a) Q = 17.25 kg/s; (b) Q = 27.6 kg/s.
Processes 09 01031 g010
Figure 11. Pump hydraulic performance in terms of head and power.
Processes 09 01031 g011
Figure 12. PAT hydraulic performance in terms of head and power.
Processes 09 01031 g012
Figure 13. Pump hydraulic performance in terms of torque and efficiency.
Processes 09 01031 g013
Figure 14. PAT performance in terms of torque and efficiency.
Processes 09 01031 g014
Figure 15. Pump synergy performance at various flow rates.
Processes 09 01031 g015
Figure 16. PAT synergy performance at various flow rates.
Processes 09 01031 g016
Table 1. Main design parameters of the model.
Parameters (Unit)Value
Impeller outlet diameter (m)0.165
Impeller inlet diameter (m)0.092
Blade thickness (m)0.02
Hub diameter (m)0.03
Number of blades (-)7
Inlet blade angle (°)19.8
Outlet blade angle (°)24.8
Volute discharge area (mm2)996.4
Volute width (m)0.033
Publisher’s Note: MDPI stays neutral with regard to jurisdictional claims in published maps and institutional affiliations.

