Abstract
As one of the typical negative factors affecting the vortex structure and flow characteristics of hydraulic machinery, the TLV has a non-negligible impact on the energy performance. In order to improve the utilization efficiency of hydraulic machinery in marine energy, the parallel grooves structure is proposed and applied to the NACA0009 hydrofoil. Subsequently, an exhaustive numerical analysis is carried out adopting the SST k-ω turbulence model, and the effects of the position and spacing on the suppression effect and flow characteristics are investigated. The presence of the parallel grooves leads to a decrease in the lift-to-drag ratio of the hydrofoil within 5%, but it can effectively suppress the development of TLV and reduce the area of TLV. The parallel grooves destroy the structure of PTLV and STLV, and the spacing and position have a greater influence on the flow characteristics of the hydrofoil. In order to take the TLV suppression effect and the energy performance of the hydrofoil into account, the L3T1 structure is recommended.
1. Introduction
Marine energy is an important source of energy for human development in the future, and the efficiency of utilization in marine energy affects the development of the energy industry, of which hydraulic machinery plays an important role in the exploitation and utilization of marine energy [1,2]. As a significant component of hydraulic machinery, the hydrofoil is not only one of the main topics in hydrodynamic engineering and research [3,4], but also gradually represents great impact in the development of marine energy. In the field of renewable energy, tidal energy relies on turbines to achieve the conversion from gravitational potential energy of the current to electrical energy, so the hydrofoil is widely adopted in the design of mechanical equipment such as turbines [5,6] and oil-gas multiphase pump [7]. Different structures and design schemes of hydrofoil will affect the hydrodynamic performance of hydraulic machinery due to the factors such as the interaction between ocean currents and marine equipment, which can produce uneven stress distribution [8,9], noise [10,11], and tip leakage vortex [12]. In order to improve the energy characteristics of hydraulic machinery and enhance the efficiency of marine energy utilization, it is necessary to explore how to eliminate the negative effects of hydraulic machinery.
For the purpose of investigating the impacts on energy characteristics caused by structure and operating conditions of hydrofoil, scholars have carried out studies around the effects brought by the shape of the hydrofoil [13], different attack angles and inlet flow velocity [14], and found that the tip clearance had an important impact on the energy characteristics of hydraulic machinery [15,16]. TLV is generated and developed in the blades of hydraulic machinery. In order to improve the energy performance of hydraulic machinery, many scholars have conducted in-depth research on the mechanism of the tip leakage vortex (TLV) generated from the tip clearance. It had been shown that the size of the tip clearance would affect the TLV generation [17], and a smaller tip clearance made less flow rate and generated a smaller TLV, resulting in less energy loss. In terms of numerical solutions, scholars have conducted calculation using RANS and LES methods [18], which meticulously demonstrated the flow structure from the gap between the tip of the NACA0009 hydrofoil and the wall, analyzed the moving trajectory of the TLV and the effect of gap widths on the generation of TLV. The unsteady RANS equation was also employed to study the TLV under unsteady incoming flow conditions [19], and it was found that the time-averaged entropy generation in the unsteady case was reduced by 18% compared with the steady incoming flow conditions, indicating that the flow stability also affected the energy characteristics of the hydrofoil. Wavelet analysis had also been applied to the analysis of TLV [20], and by analyzing the instabilities and the corresponding frequencies, it was possible to understand whether there existed irregularities in the flow field and explored the relevant factors affecting the flow pattern of hydrofoil. TLV leads to a reduction in efficiency [21], indicating that the tip clearance of hydrofoil and the TLV are issues worth focusing on.
Since TLV has a significant impact on the energy performance and efficiency of hydrofoil and hydraulic machinery, methods to suppress TLV need to be explored. In terms of experimental research, scholars have mainly adopted high-speed camera and instantaneous pressure measurement techniques to analyze the performance of hydraulic machinery [22], and the effect of TLV on the flow field had been systematically studied through the pressure pulsation. In recent years, scholars have found that a certain groove design for the hydrofoil can effectively improve its lift-to-drag ratio [23,24], and the intrinsic mechanism was that the groove changed the flow structure of the fluid and integrally improved the energy performance of the hydrofoil [25]. On this basis, special curves such as the bimodal Gaussian function curve were used to design and optimize the groove of the hydrofoil [26] in order to explore the solutions to improve the flow pattern and energy performance.
The Lagrangian method [27] can also be employed to evaluate the calculation method based on Helmholtz’s concept of strong vortex dynamics. Similarly, Pereira et al. [28] established the pure Lagrangian model to simulate convection and proposed a method to simulate the diffusion of vorticity on the surface of research objects, in order to reveal the unsteady aerodynamic characteristics of a horizontal axis wind turbine. The establishment and verification of a time-accurate Lagrangian vortex wake model [29], and the Lagrangian numerical simulation method [30] can be employed to analyze the flow around a circular cylinder. Furthermore, a meshless three-dimensional flow simulation method [31] based on boundary integral and vortex method of Lagrangian differential equation was constructed. The propose of a new large eddy simulation method [32] can directly distinguish the sub grid motion of concentrated vortices.
In this paper, a kind of new parallel groove design scheme based on NACA0009 hydrofoil is proposed, numerical simulations are performed using the SST k-ω model, and the accuracy of the numerical method is validated. On this basis, the vortex structure and flow field of various groove configurations are compared, the mechanism of suppression on hydrofoil TLV by parallel groove is explored, and the analysis of energy characteristics and flow characteristics in hydrofoil is carried out to obtain the best optimized structure.
2. Computational Fluid Domain and Groove Design
2.1. Computational Fluid Domain
In this paper, the NACA0009 hydrofoil is selected for numerical simulation based on the previous experimental basis [33], and a three-dimensional model is established according to the experimental conditions, of which the model structure is shown in Figure 1. The basic parameters of the geometric model are as follows: the total length of the water tank l is 750 mm, the distance from the inlet to the leading edge of the hydrofoil is 200 mm, the distance from the outlet to the trailing edge of the hydrofoil is 450 mm, the width of the water tank w is 150 mm, the height of the water tank h is 50 mm, the chord length of the hydrofoil c is 100 mm, the span of the hydrofoil b is 146 mm, and the maximum thickness of the hydrofoil is 9.9 mm. The attack angle of the hydrofoil α is 10°, the incoming flow velocity W∞ is 10 m/s, and the tip clearance δ is 0.4 mm.
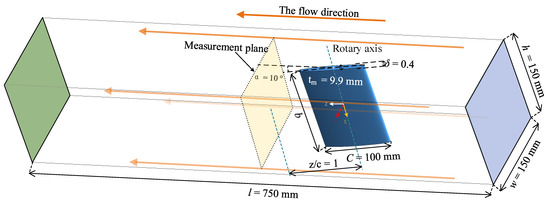
Figure 1.
Computational fluid domain.
2.2. Design Scheme of Parallel Groove
Regarding the research on the optimal design of hydraulic machinery, previous authors adopted relevant methods such as multi-objective and multi-parameter design to optimize the flow pattern and enhance the energy characteristics [34]. As regard to the study of flow control in hydrofoil, Huang et al. [35] proposed a C-groove design, a structure that can reduce quadrupole noise as well as suppressing TLV. On this basis, the role of C-groove for hydrofoil energy performance enhancement was also investigated [36]. A new type of groove suspended at the tip of the hydrofoil was also proposed [37], which was composed of a transverse groove along the direction of the chord and multiple sets of oblique grooves, and the suppression effect on TLV of the grooves was validated by experiments and numerical simulations.
Due to the different locations of the primary tip leakage vortex (PTLV) and secondary tip leakage vortex (STLV) [38], a single groove can block only one kind of the TLV, while too many grooves can drastically affect the performance of the hydrofoil. Therefore, a parallel grooves structure is proposed in this paper, and the location of the groove is mainly concentrated at 5–30% of the chord length, the location where the tip leakage vortex is mainly generated. The shape of the single groove is a linear groove, the inclination angle of the groove is 45°, the depth of the groove δ1 is half of the tip clearance, the vertical length of the groove d1 is 3 mm, and the maximum length of the groove boundary d2 is d1, which is 1/23c. The distance between the center of the first groove and the leading edge is x1, and the distance between the center of the second groove and the leading edge is x2.
In contrast, the structure of the parallel grooves proposed in this paper as shown in Figure 2 chose a double groove configuration, which can destruct the flow pattern of STLV while suppressing the development of PTLV, thus playing a significant role in suppressing the tip leakage vortex of the tip clearance. At the same time, the parallel grooves structure does not change the overall structure of the hydrofoil to a large extent, thus has relatively little negative effect on its hydrodynamic performance.
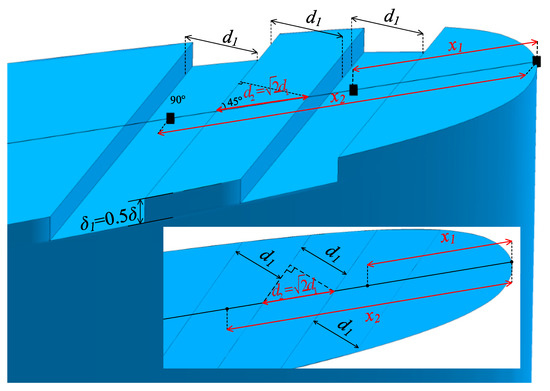
Figure 2.
Structure parameter illustration of parallel groove.
In order to concentrate on the effect of parallel grooves on vortex suppression and flow characteristics, the qualitative and quantitative study is conducted on the location and spacing of parallel grooves. The distance between the center of the first groove and the leading edge x1 is defined as the position, and three schemes are designed for the positions of the groove, which are located at 2/23, 3/23 and 4/23 of chord length, corresponding to L2, L3 and L4. Since the TLV is mainly located at the 0–30% chord length, to ensure the suppression effect of the grooves and also consider the interaction between the parallel grooves, the design of spacing is extremely important. The spacing of parallel grooves in this paper are mainly chosen as 1/23, 2/23, and 3/23 of chord length, corresponding to T1, T2, and T3. Overall, it is necessary to ensure that the parallel grooves have a suppressing effect on both PTLV and SPLV, and the vortex structures of the two grooves will not be sucked by each other to produce a larger vortex structure. The specific configurations are shown in Table 1.

Table 1.
Design scheme of parallel grooves.
3. Mesh Generation and Numerical Method
3.1. Mesh Arrangement
The commercial software ANSYS ICEM 18.0 has been employed to generate structured meshes, and meanwhile, in order to ensure the calculation accuracy and reduce the calculation error, the mesh number irrelevance verification is carried out in this paper. Three sets of meshes are established, which are Mesh1, Mesh2 and Mesh3 with the mesh number 4.2 × 10⁶, 5.2 × 10⁶ and 6.2 × 10⁶, respectively. The lift-to-drag force of the NACA0009 hydrofoil with different mesh number is shown in Table 2. The calculation results reveal that the value of lift-to-drag force remains stable when the mesh number reaches 5.2 × 10⁶, which can be assumed that the mesh above 5.2 × 10⁶ has reached the accuracy requirement. In order to capture the TLV in the tip clearance with as much detail as possible, Mesh3 has been chosen for subsequent calculations.
Table 2.
Lift-to-drag under different mesh number.
The details of node distribution of Mesh3 are represented in Figure 3. To improve the quality of the mesh, the surrounding grid of hydrofoil is treated with an O-block topology [39], and the mesh layer on the hydrofoil surface is 73, with y+ values between 1–10 on the hydrofoil. Since the study in this paper focuses on the TLV and to capture the TLV structure as accurately as possible, the mesh of tip clearance is refined with 58 layers. The presence of the groove structure leads to the emergence of a nascent groove leakage vortex (GLV) inside the groove. In order to observe the development of the GLV, the interior mesh of the groove is refined with 20 layers. Furthermore, 138 layers are arranged along the chord length of the hydrofoil, and 78 layers are sped along the span of the hydrofoil.
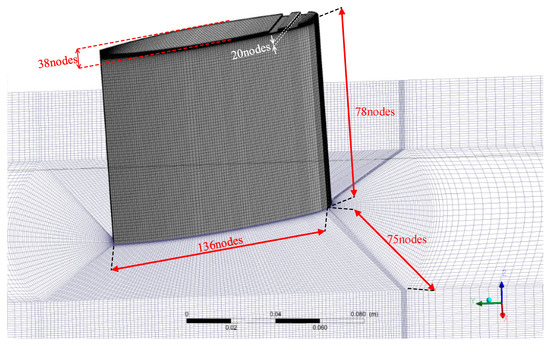
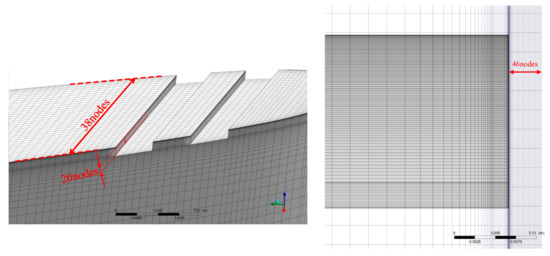
Figure 3.
Mesh arrangement of hydrofoil.
3.2. Numerical Setting
The commercial software ANSYS CFX18.0 is adopted for numerical simulation, and the SST k-ω turbulence model is selected. In this case, Reynolds number is computed by Re = ρcv/μ, where v is the inlet velocity, ρ is the fluid density, μ is the viscosity, and c is the chord length of the hydrofoil, and the value of Re is 1 × 10⁶. According to the experimental results, the boundary conditions of the numerical simulation are set as velocity inlet and static pressure outlet. In addition, a combination of high-resolution convective discretization and high-resolution turbulence numerical simulation is used in the calculation process. The convergence criterion is defined as the root mean square residual, which is less than 1 × 10⁻⁵.
4. Results and Discussion
4.1. Numerical Method Validation
In order to verify the accuracy of the numerical method, the calculated results are compared and analyzed with the experimental results in this paper, as displayed in Figure 4 and Figure 5. The relevant parameters and working conditions for the comparison condition are as follows: 4 mm for tip clearance, 10 m/s for inlet velocity, and 10° for attack angle of the hydrofoil. The vortex defined by the Q criterion (Q = 2 × 10⁷ s−2) and the TLV trajectory portrayed in the experimental measurement can be seen in Figure 4. As the vortex in numerical simulation basically match with the experimentally obtained PTLV and SPLV trajectories, the numerical method is effective in predicting the location of the tip leakage vortex.
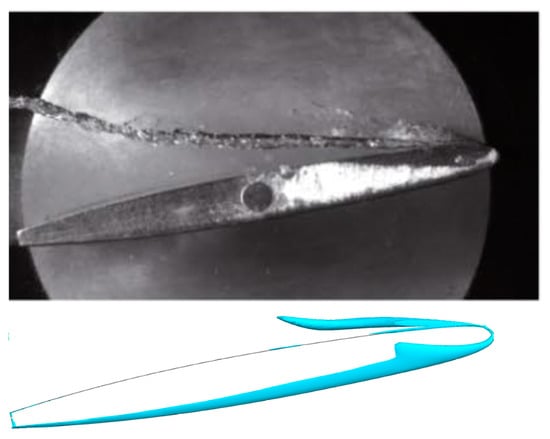
Figure 4.
Comparison of vortex in experimental and numerical results.
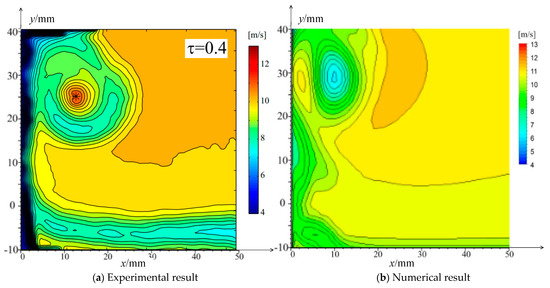
Figure 5.
Comparison of velocity field in experimental and numerical results.
Meanwhile, in order to intuitively compare the error range in more detail, the velocity contour of the cross-section z/c = 1 are selected in this paper. As can be seen in Figure 5a,b, the numerical simulation is relatively successful in predicting the basic positions of the high-speed region and the low-velocity region. Although there is a certain error between the numerical simulation and the experimental results, which may be caused by the fact that the surface of the hydrofoil in the experiments is not absolutely smooth, but the error range is not large, therefore it is convinced that the accuracy of the SST k-ω turbulence model is verified.
4.2. Comparison of Groove Location and Spacing
In this paper, the effect of parallel grooves on the TLV is investigated from two aspects, the location and the spacing of the parallel grooves. Based on NACA0009 (M0), nine sets of different optimization schemes are designed, and Figure 6 represents the vortex structure for each set of optimization schemes under the definition of Q criterion (Q = 2 × 10⁷ s−2).
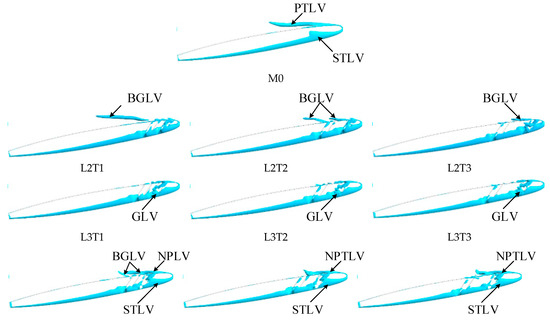
Figure 6.
The vortex structure shown by Q criterion.
As revealed in the figure, there exists two main vortex structures generated by the hydrofoil in M0, the PTLV (primary tip leakage vortex) and the STLV (secondary tip leakage vortex). When there is a groove at the top of the tip clearance, the structure of PTLV is destructed and the vortex is cut off largely in the groove. Besides, the presence of the groove induces a GLV (groove leakage vortex), the GLV and the TLV are induced together to form BGLV (back groove leakage vortex). The interaction between GLV and PTLV also induces NPTLV (new primary tip leakage vortex). However, it is obvious from the figure that the GLV and BGLV are relatively small in diameter and length, while the area of NPTLV is reduced by half compared with PTLV due to the truncation effect of the grooves. Therefore, it can be concluded that the parallel groove structure has a good suppression effect on the tip leakage vortex.
As shown in configuration of L2T1, L2T2 and L2T3, the GLV and PTLV coil with each other and induce the generation of BGLV. When spacing between grooves increases, the diameter and length of BGLV gradually decreases and the vortex intensity becomes smaller. At the same time, as represented in cases L4T1, L4T2 and L4T3, the delayed grooves provide some space for the PTLV development, and entrainment with GLV to induce the generation of NPTLV. Furthermore, the BGLV can be generated only when the groove spacing is small. As revealed in configuration of L3T1, L3T2, and L3T3, the generation of PTLV is obviously suppressed, and its main vortex structure is produced within the co-development of GLV and STLV.
The vortex area and energy performance of different optimization schemes are listed in Table 3 and Table 4. It can be indicated from Table 3 that the schemes with obvious suppression effect on TLV are L2T2, L2T3, L3T1, L3T2, and L3T3, among which the L3T1 scheme has the best suppression effect on TLV. It can be seen from Table 4 that although the configurations with the parallel grooves show a slightly decreasing trend in the lift-drag ratio, the reduction ranges are all within 5%. Moreover, the lift shows an increasing trend, and the lift-drag ratio decreases by only 2.35% in the L2T3, which has the best lift-drag ratio performance among various optimized schemes. Considering the effect of parallel grooves on the suppressing effect of the TLV and the energy performance of hydrofoil, the schemes with better performance are L2T2, L2T3, L3T1 and L3T3. This is because the parallel grooves structure can reduce the effect of TLV and improve the pressure gradient distribution in the pressure and suction sides of the hydrofoil, thus improving the flow pattern while causing less impact on the energy characteristics.
Table 3.
Area of vortex for different schemes.
Table 4.
Energy performance for different schemes.
4.3. Analysis on Flow Characteristics and Vortex
Although four schemes represent better suppression effect on TLV, they also significantly affect the flow pattern around the hydrofoil. An undesirable structural design may induce unstable flow field, which reduces the energy performance of the hydrofoil. Therefore, it is necessary to investigate the flow characteristics of hydrofoils. As indicated in Figure 7, the three-dimensional streamline is released from the edge of the pressure surface of the hydrofoil. It can be seen from the figure that the starting position of PTLV is about 10–20%c in the original structure M0, while STLV is formed near the pressure side at 15%c, and the vortex intensity gradually decreases with the development of the TLV. Comparing to the configurations of L2T2, L2T3, L3T1 and L3T3, the starting position of the TLV tends to move forward significantly when the parallel grooves exist, the vortex intensity in the high-speed area decreases significantly, and the high-speed area becomes larger. For configurations of L2T3 and L3T3, when the spacing between the parallel grooves is certain, the tendency of the TLV position to move backward decreases when the groove positions move backward. The effect of increasing the area of the high-speed region is more obvious when the spacing increases. At the same time, the flow in the low-speed region is entangled with the PTLV in the high-speed region because of the stronger entrainment effect, which reduces the flow velocity.
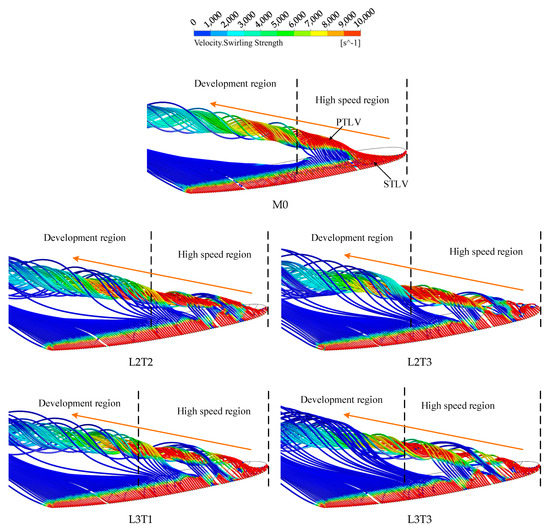
Figure 7.
Three dimensional streamlines of different schemes.
Comparing the configurations of L2T2, L2T3 and L3T1, L3T3, increasing the spacing between the grooves affects the overall flow direction of the fluid at the tip clearance, with a relatively small effect on the entanglement strength of the PTLV, and the location where the fluid entangled into the PTLV is delayed. As for the M0 condition, the velocity of the fluid being entangled into the PTLV increases rapidly and then decreases gradually as the flow develops. The presence of the groove allows the fluid being entangled from the groove remains at low velocity.
In order to analyze the flow field inside the tip clearance and groove with more details, six cross-sections are selected at 10%c, 15%c, 20%c, 25%c, 30%c, and 40%c, respectively, and Figure 8 reveals the swirling strength of the cross sections. The swirling strength is defined as , where the imaginary part of eigenvalues of the velocity gradient tensor will be calculated. It can be clearly seen from the figure that the presence of parallel grooves enhances the developments of GLV compared with M0, but the swirling strength of the GLV is smaller, and the influence range of the vortex is concentrated inside the grooves. Moreover, the intensity of GLV is gradually weakened with the backward movement of the groove position when the groove spacing is certain comparing with L2T3 and L3T3.
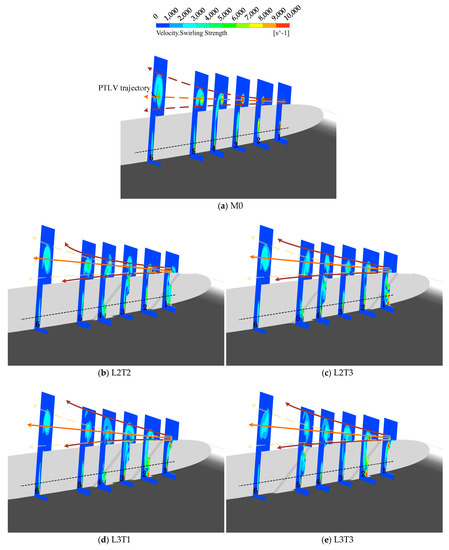
Figure 8.
Distribution of velocity swirling strength on different sections.
Additionally, the vortex intensity of PTLV and STLV with parallel grooves is remarkably reduced both around the hydrofoil and tip clearance. The trajectory of the PTLV in M0 is marked by the orange dashed line in the figure, and it can be seen from L2T2, L2T3, L3T1, and L3T3 that the position of the vortex core in each cross-section is not significantly shifted, and the presence of the parallel grooves does not change the trajectory of the PTLV, but expands the vortex range. It can be assumed that the presence of parallel grooves makes the structures of PTLV and STLV diverge, thus suppressing the TLV.
Comparing M0 with the optimally designed configurations, the presence of the parallel grooves helps the development of the GLV, as shown in plane 4 of L2T2 and L2T3, and the swirling strength of the GLV is enhanced to some extent. With the backward movement of the groove, as shown in plane 5 of L2T3, the swirling strength of GLV is enhanced. Comparing M0 with L3T1 and L3T3, the flow patterns shown in plane 1 are almost the same, indicating that the groove does not affect the fluid that is about to flow into the groove. Meanwhile, the presence of the groove makes the vortex intensity become lower, and the vortex intensity is significantly reduced after plane 3.
Figure 9 shows the swirling strength comparison of the vortex core in the six cross-sections within (b), (c), (d) and (e). It is obvious from the figure that the presence of the parallel grooves reduces the swirling strength of vortex core in each section compared with the M0. The scope of this effect is mainly focused on the front position of 30%c of the hydrofoil, among which the effect on Section 1 of L3T1 and L3T3 is the most prominent. The effect of the groove on the swirling strength is the smallest when the cross section is at 40%c position. Among the four configurations, the best comprehensive effect of vortex core swirling strength reduction is L3T1.
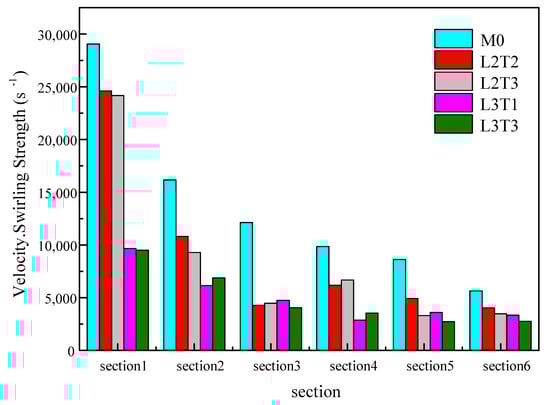
Figure 9.
Swirling strength of vortex core comparison for different schemes.
In order to analyze the influence of parallel groove on the TLV in-depth, the central cross-section of the parallel groove is selected for further analysis. Figure 10 reveals the velocity distribution of the cross-section from (a) to (e), from which can be seen that an obvious high-speed zone at 0–30%c of the leading edge appears in M0, which is also the main distribution area of the TLV. The flow velocity of the TLV is high, and the velocity reaches peak value from the leading edge to the front part of the hydrofoil, and then gradually decreases but the existence of the parallel groove makes the area of high-velocity region reduced, the high-speed zone only exists at 10%c of the leading edge, and the flow velocity increases slowly after passing through the groove. A local low-velocity region appears inside the groove, and the flow velocity inside the second groove is lower compared with the first groove, therefore, the velocity of flowing through the grooves is significantly affected, which has a more prominent effect on the flow field around the hydrofoil.
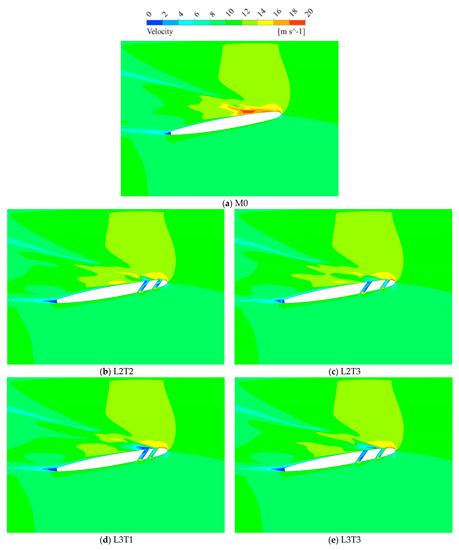
Figure 10.
Velocity distribution for different schemes.
Comparing the L2T3 and L3T3, the area of the high-speed region shows a small increase to the end of the first groove when the groove moves backward. The influence of the low-speed region in the groove increases further, and a local low-speed region appears in the suction side. Compared with the L2T2 and L2T3, the grooves in the L3T1 and L3T3 are farther away from the leading edge of the hydrofoil, and the velocity in the grooves is smaller, so it is indicated that the local area with smaller velocity can be produced by appropriately moving the position of the first groove backward. The grooves change the velocity distribution around the hydrofoil, resulting in a change in the pressure difference between the suction side and pressure side, which affects the flow field around the hydrofoil.
Figure 11 represents the static pressure distribution in the center cross-section of the grooves, from which it can be seen that the parallel grooves have less influence on the pressure surface from (a) to (e). Only a small high-pressure area exists on the pressure side in the leading edge of the hydrofoil for M0. When the parallel grooves exist, a low-pressure area appears inside the groove, while a small high-pressure area appears below the grooves. As the spacing between grooves increases, the value in the low-pressure region inside the grooves increases slightly. The influence of the grooves on the suction side is greater, making the range and amplitude of the local low-pressure area at the leading edge decrease.
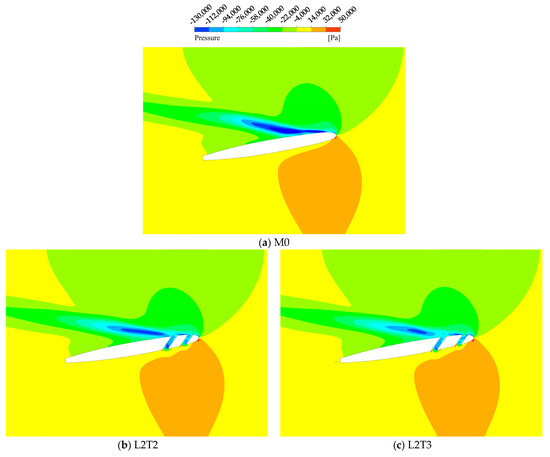
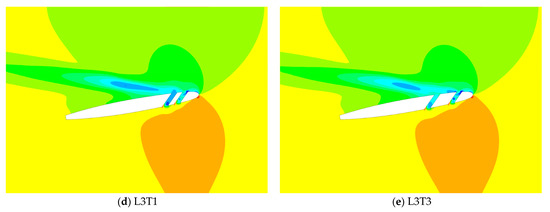
Figure 11.
Pressure distribution for different schemes.
The presence of the parallel grooves reduces the fluid velocity at the suction side, decreases the dynamic pressure in this region, and thus reduces the pressure difference between the pressure side and the suction side. The grooves decrease both the low-pressure region at the suction side and the high-pressure region at the pressure side, which reduces the static pressure difference between the two sides. Therefore, the existence of the parallel grooves reduces the total pressure difference to a certain extent, thus affecting the energy characteristics of the hydrofoil.
5. Expectation
In future research, the mechanism about the impact of the parallel grooves on the tip leaking vortex can be more systematically studied and analyzed, so as to provide a scientific basis for a more accurate understanding of the depth and position of the parallel groove. Secondly, a more detailed parametric study of the groove spacing can be carried out to explore the mechanism of groove–groove interaction in parallel grooves.
6. Conclusions
In response to the problem of performance degradation in hydraulic machinery due to the existence of tip clearance, a parallel grooves structure is proposed in this paper and applied to the NACA0009 hydrofoil. Subsequently, an exhaustive numerical analysis of parallel grooves is carried out using the SST k-ω turbulence model, and the impact of the position and spacing of the parallel grooves on the suppression effect and flow characteristics are investigated. The main conclusions are obtained as follows.
- (1)
- Compared with the structure without parallel grooves, the presence of the grooves will lead to a decrease in the lift-to-drag ratio of the hydrofoil within 5%, but it can effectively suppress the development TLV and reduce the area of TLV. This is of great significance for improving the flow stability and studying the optimal design of hydraulic machinery.
- (2)
- The location and spacing of the parallel grooves have a greater effect on the flow characteristics of the hydrofoil. With the backward movement of the groove location, the tendency of TLV to move backward slows down, and the vortex intensity of the GLV gradually decreases, which can produce a local area with smaller velocity. With the increase of the spacing, the effect of increasing the high-speed region is more obvious, and the flow in the low-speed region is mixed with the PTLV in the high-speed region.
- (3)
- The parallel grooves destroy the structure of PTLV and STLV, and inhibits the development of TLV. In order to balance the TLV suppression effect and the energy performance of the hydrofoil, the L3T1 structure is recommended.
- (4)
- The presence of parallel grooves leads to a local low-pressure area, which affects the pressure difference between the pressure side and the suction side, which in turn affects the work done by the hydrofoil and slightly reduces the lift-to-drag ratio.
Author Contributions
Conceptualization, Y.C. and W.Z.; methodology, D.S.; software, Y.C.; validation, D.F., M.S. and J.L.; formal analysis, Y.C., W.Z.; investigation, D.F.; resources, X.Z.; data curation, J.L.; writing—original draft preparation, Y.C., W.Z.; writing—review and editing, D.S., X.Z. All authors have read and agreed to the published version of the manuscript.
Funding
This work has been supported by the National Natural Science Foundation of China [52077218].
Conflicts of Interest
The authors declare no conflict of interest.
References
- Zhang, W.; Xie, X.; Zhu, B.; Ma, Z. Analysis of phase interaction and gas holdup in a multistage multiphase rotodynamic pump based on a modified Euler two-fluid model. Renew. Energy 2021, 164, 1496–1507. [Google Scholar] [CrossRef]
- Zhang, W.; Zhu, B.; Yu, Z. Characteristics of bubble motion and distribution in a multiphase rotodynamic pump. J. Pet. Sci. Eng. 2020, 193, 107435. [Google Scholar] [CrossRef]
- Yan, H.; Su, X.; Zhang, H.; Huang, J.; Zhou, L.; Liu, Z.; Wang, Z. Design approach and hydrodynamic characteristics of a novel bionic airfoil. Ocean Eng. 2020, 216, 108076. [Google Scholar] [CrossRef]
- Bai, X.; Cheng, H.; Ji, B.; Long, X. Spatial and spectral investigation of turbulent kinetic energy in cavitating flow generated by Clark-Y hydrofoil. J. Hydrodyn. 2020, 32, 175–178. [Google Scholar] [CrossRef]
- Kinsey, T.; Dumas, G.; Lalande, G.; Ruel, J.; Mehut, A.; Viarouge, P.; Lemay, J.; Jean, Y. Prototype testing of a hydrokinetic turbine based on oscillating hydrofoils. Renew. Energy 2011, 36, 1710–1718. [Google Scholar] [CrossRef]
- Kinsey, T.; Dumas, G. Computational fluid dynamics analysis of a hydrokinetic turbine based on oscillating hydrofoils. J. Fluids Eng. 2012, 134, 021104. [Google Scholar] [CrossRef]
- Zhang, W.; Chen, Z.; Zhu, B.; Zhang, F. Pressure fluctuation and flow instability in S-shaped region of a reversible pump-turbine. Renew. Energy 2020, 154, 826–840. [Google Scholar] [CrossRef]
- Zhang, P.; Duan, M.; Ma, J. A precise mathematical model for geometric modeling of wire rope strands structure. Appl. Math. Model. 2019, 76, 151–171. [Google Scholar] [CrossRef]
- Zhang, P.; Ma, J.; Duan, M.; Yuan, Y.; Wang, J. A high-precision curvature constrained Bernoulli–Euler planar beam element for geometrically nonlinear analysis. Appl. Math. Comput. 2021, 397, 125986. [Google Scholar]
- Dang, Z.; Mao, Z.; Tian, W. Reduction of hydrodynamic noise of 3d hydrofoil with spanwise microgrooved surfaces inspired by sharkskin. J. Mar. Sci. Eng. 2019, 7, 136. [Google Scholar] [CrossRef]
- Zhang, L.; Duan, J.; Da, L.; Xu, G.; Sun, X. Vibroacoustic radiation and propagation properties of slender cylindrical shell in uniform shallow sea. Ocean Eng. 2020, 195, 106659. [Google Scholar] [CrossRef]
- Bai, X.; Cheng, H.; Ji, B.; Long, X.; Qian, Z.; Peng, X. Comparative Study of different vortex identification methods in a tip-leakage cavitating flow. Ocean Eng. 2020, 207, 107373. [Google Scholar] [CrossRef]
- Chen, F.; Zhang, L.; Huai, X.; Li, J.; Zhang, H.; Liu, Z. Comprehensive performance comparison of airfoil fin PCHEs with NACA 00XX series airfoil. Nucl. Eng. Des. 2017, 315, 42–50. [Google Scholar] [CrossRef]
- Hoseinzadeh, S.; Bahrami, A.; Mirhosseini, S.M.; Sohani, A.; Heyns, S. A detailed experimental airfoil performance investigation using an equipped wind tunnel. Flow Meas. Instrum. 2020, 72, 101717. [Google Scholar] [CrossRef]
- Miorini, R.L.; Wu, H.; Katz, J. The internal structure of the tip leakage vortex within the rotor of an axial waterjet pump. J. Turbomach. 2012, 134, 031018. [Google Scholar] [CrossRef]
- Zhang, J.; Fan, H.; Zhang, W.; Xie, Z. Energy performance and flow characteristics of a multiphase pump with different tip clearance sizes. Adv. Mech. Eng. 2019, 11, 1687814018823356. [Google Scholar] [CrossRef]
- Jung, Y.; Choi, M.; Park, J.Y.; Baek, J.H. Effects of recessed blade tips on the performance and flow field in a centrifugal compressor. Proc. Inst Mech. Eng. Part A J. Power Energy 2013, 227, 157–166. [Google Scholar] [CrossRef]
- Decaix, J.; Balarac, G.; Dreyer, M.; Farhat, M.; Munch, C. RANS and LES computations of the tip-leakage vortex for different gap widths. J. Turbul. 2015, 16, 309–341. [Google Scholar] [CrossRef]
- Zhou, K.; Zhou, C. Unsteady effects of vortex interaction on tip leakage vortex breakdown and its loss mechanism. Aerosp. Sci. Technol. 2018, 82, 363–371. [Google Scholar] [CrossRef]
- Boudet, J.; Jacob M, C.; Caro, J.; Jondeau, E.; Li, B. Wavelet Analysis of a Blade Tip-Leakage Flow. AIAA J. 2018, 56, 3332–3336. [Google Scholar] [CrossRef]
- Wang, L.; Lu, J.; Liao, W.; Zhao, Y.; Wang, W. Numerical simulation of the tip leakage vortex characteristics in a semi-open centrifugal pump. Appl. Sci. 2019, 9, 5244. [Google Scholar] [CrossRef]
- Shen, X.; Zhang, D.; Xu, B.; Shi, W.; BPM, v.E. Experimental and numerical investigation on the effect of tip leakage vortex induced cavitating flow on pressure fluctuation in an axial flow pump. Renew. Energy 2021, 163, 1195–1209. [Google Scholar]
- Seo, S.H.; Hong C, H. Performance improvement of airfoils for wind blade with the groove. Int. J. Green Energy 2016, 13, 34–39. [Google Scholar] [CrossRef]
- Liu, Y.; Li, P.; He, W.; Jiang, K. Numerical study of the effect of surface grooves on the aerodynamic performance of a NACA 4415 airfoil for small wind turbines. J. Wind Eng. Ind. Aerodyn. 2020, 206, 104263. [Google Scholar] [CrossRef]
- Yang, X.; Zhao, Q.; Liu, Z.; Feng, Z.; Simon, T. Controlling Leakage Flows Over a Rotor Blade Tip Using Air-Curtain Injection: Part I—Aero-Thermal Performance of Rotor Tips. In the proceedings of Turbo Expo: Power for Land, Sea, and Air. Am. Soc. Mech. Eng. 2019, 58653, V05BT18A002. [Google Scholar]
- Jiang, S.; Chen, F.; Yu, J.; Chen, S.; Song, Y. Treatment and optimization of casing and blade tip for aerodynamic control of tip leakage flow in a turbine cascade. Aerosp. Sci. Technol. 2019, 86, 704–713. [Google Scholar] [CrossRef]
- Sarpkaya, T. Computational methods with vortices—The 1988 Freeman scholar lecture. J. Fluids Eng. 1989, 111, 5–52. [Google Scholar] [CrossRef]
- Pereira, L.A.A.; Hirata, M.H.; Silveira Neto, A. Vortex method with turbulence sub-grid scale modelling. J. Braz. Soc. Mech. Sci. Eng. 2003, 25, 140–146. [Google Scholar] [CrossRef]
- Gupta, S. Development of a Time-Accurate Viscous Lagrangian Vortex Wake Model for Wind Turbine Applications. Ph.D. Thesis, University of Maryland, College Park, MD, USA, 2006. [Google Scholar]
- Hirata, M.H.; Pereira, L.A.A.; Recicar, J.N.; Moura, W.H. High Reynolds number oscillations of a circular cylinder. J. Braz. Soc. Mech. Sci. Eng. 2008, 30, 304–312. [Google Scholar] [CrossRef][Green Version]
- Khatir, Z.; Lucey, A.D. A combined boundary integral and vortex method for the numerical study of three-dimensional fluid flow systems. Int. J. Comput. Math. 2012, 89, 1504–1524. [Google Scholar] [CrossRef]
- Kornev, N.; Samarbakhsh, S. Large Eddy Simulation with direct resolution of subgrid motion using a grid free vortex particle method. Int. J. Heat Fluid Flow 2019, 75, 86–102. [Google Scholar] [CrossRef]
- Dreyer, M.; Decaix, J.; Münch-Alligné, C.; Farhat, M. Mind the gap: A new insight into the tip leakage vortex using stereo-PIV. Exp. Fluids 2014, 55, 1–13. [Google Scholar] [CrossRef]
- Fan, H.; Zhang, J.; Zhang, W.; Fharhat, M. Multiparameter and multiobjective optimization design based on orthogonal method for mixed flow fan. Energies 2020, 13, 2819. [Google Scholar] [CrossRef]
- Huang, Z.; Huang, Z.; Fan, H. Influence of C groove on energy performance and noise source of a NACA0009 hydrofoil with tip clearance. Renew. Energy 2020, 159, 726–735. [Google Scholar] [CrossRef]
- Hu, Z.; Huang, C.; Huang, Z.; Zhang, J. A Method of Bending Shrinkage Groove on Vortex Suppression and Energy Improvement for a Hydrofoil with Tip Gap. Processes 2020, 8, 1299. [Google Scholar] [CrossRef]
- Cheng, H.; Long, X.; Ji, B.; Peng, X.; Farhat, M. Suppressing tip-leakage vortex cavitation by overhanging grooves. Exp. Fluids 2020, 61, 1–18. [Google Scholar] [CrossRef]
- Legras, G.; Gourdain, N.; Trebinjac, I. Numerical analysis of the tip leakage flow field in a transonic axial compressor with circumferential casing treatment. J. Therm. Sci. 2010, 19, 198–205. [Google Scholar] [CrossRef]
- Zhang, J.; Zhang, Q.; Wang, H.; Ye, P. Study on heat transfer performance of shaft seal in HTR-PM circulator. In Proceedings of the International Conference on Nuclear Engineering (ICONE), Tsukuba, Japan, 19–24 May 2019; p. 1776. [Google Scholar]


Publisher’s Note: MDPI stays neutral with regard to jurisdictional claims in published maps and institutional affiliations. |
© 2021 by the authors. Licensee MDPI, Basel, Switzerland. This article is an open access article distributed under the terms and conditions of the Creative Commons Attribution (CC BY) license (https://creativecommons.org/licenses/by/4.0/).