Article

Experimental Study on the Flexural Behavior of Concrete-Filled Steel Box Slabs

1
School of Civil Engineering, Shandong Jianzhu University, Jinan 250101, China
2
Shandong Jianzhu University Architecture & Urban Planning Design Institute, Jinan 250014, China
*
Authors to whom correspondence should be addressed.
Processes 2021, 9(4), 649; https://doi.org/10.3390/pr9040649
Submission received: 4 March 2021 / Revised: 5 April 2021 / Accepted: 6 April 2021 / Published: 8 April 2021
(This article belongs to the Special Issue Design, Control, and Evaluation of Advanced Engineered Materials)

Abstract

:
Different to conventional reinforced concrete or steel material, a new type of concrete-filled steel box slab has been proposed by effectively integrating the combined benefits of both steel and concrete. By filling concrete, this type of slab could avoid the local bucking of steel plate and then could provide a high moment capacity. Therefore, this study aims to investigate the flexural behavior of concrete-filled steel box slabs through testing seven specimens and characterize their failure characteristics, stress distribution and ultimate moment capacity. A comprehensive parametric study focuses on the influence of the steel plate thickness, the stud and stiffening plate on the slab flexural behavior. The results show that concrete-filled steel box slabs had a high moment capacity and good ductility. The thickness of the steel plate had a significant influence on the moment capacity of the specimen. The stud led to the reduction of the moment capacity of the slab. The stiffening plate effectively improved the flexural behavior of the specimen. Moreover, a calculation method was formulated to describe the moment capacity of the slab and compared with experimental results. The results show that the proposed method for the moment capacity of the slab was conservative and reasonable.

1. Introduction

The concrete-filled steel box slab is a flexural member consisting of a rectangular steel box formed by steel plate welding and in-filled concrete. This type of composite slab has many benefits, including high bearing capacity, large stiffness, convenience of construction, good ductility, and strong impermeability. In recent years, the concrete-filled steel box slab has been increasingly used in assembly-type caisson and foundation pit support projects with the development of urban underground space.
The failure mechanism and flexural performance of the rectangular concrete-filled steel tube beam have been discussed, and a wealth of experimental data and theoretical results have been obtained. Lu et al. [1] conducted comparative flexural tests on 12 square and rectangular concrete-filled steel tube members and five square hollow steel tube members, indicating that internal filled concrete can increase the moment capacity of rectangular steel tubes by 10–30%. Uy [2,3] carried out a flexural test study on eight square steel tube concrete members. They found that the failure modes of such members were mainly manifested in the strength failure of the tensile steel plate and the local buckling failure of the compression steel plate. Al Zand et al. [4] conducted flexural tests on four concrete-filled square steel tube beams with V-shaped groove cross-sections and two ordinary cross-sections. The test results showed that the use of V-shaped groove cross-sections can improve the moment capacity, flexural stiffness and energy absorption capability of beams. Al Zand et al. [5] proposed empirical methods for predicting the moment capacity of a composite section. The empirical methods were established based on the analyses of the finite element (FE) models and the experimental tests reported in previous studies by other researchers. Han [6] conducted flexural tests on 16 rectangular concrete-filled steel tube members for which the ratio of the height to width of the section was not less than 1. They studied the influencing factors of the moment capacity of the member and put forward a simplified calculation formula for the moment capacity of the concrete-filled steel tube beam. Guo et al. [7] conducted flexural tests on six rectangular concrete-filled steel tube members with a height-to-width ratio of not less than 1. The results showed that the moment capacity of this type of member increased significantly with the increase in the section height-to-width ratio. Lu et al. [8] proposed a strut-tie model for the load transfer mechanism of the circular composite member subjected to pure bending. Wang et al. [9] used the reliability analysis method to calibrate the existing design formulae on composite beam in EC4 (2004), AISC (2010) and DBJ/T13-51-2010 (2010). The results showed that all the design formulae achieved an adequate reliability index. Yu et al. [10] carried out flexural test research and numerical simulation analysis on five rectangular concrete-filled steel tube beams that consisted of the steel plates with non-equal wall thickness. The results showed that the moment capacities of rectangular concrete-filled steel tube members with unequal wall thickness were better than those of the members with equal wall thickness under the same conditions. Furthermore, the analytical expression for the flexural bearing capacity of the composite section of concrete-filled rectangular steel tubes with non-equal wall thickness flange was derived, and the optimization of member section was discussed. Ahmed et al. [11] carried out the flexural test on four full-scale beams and established a new empirical formula to predict the moment capacities of the tested concrete-filled fiber-reinforced-polymer tubes (CFFT) beams based on a regression analysis of the test results.
To date, current research on concrete-filled steel tube flexural members has mainly focused on concrete-filled steel tube beams with a section height greater than or equal to their width [12,13,14,15]. The research on the behaviors of slab-type members was few. Due to the difference in the height-to-width ratio of the member section, the collaborative mechanism of the steel plate box with the inner concrete is different from the rectangular concrete-filled steel tube beam-type member. The existing conclusions of rectangular concrete-filled steel tube beam-type members may not be applicable to concrete-filled steel box slabs. There is bound to be a security risk if the slab is blindly designed according to the beam-type member. Therefore, it is necessary to conduct an experimental study on the flexural behavior of the concrete-filled steel box slab.
In this paper, the flexural tests of concrete-filled steel box slabs with different types of inner construction were carried out. The study was conducted to investigate the effect of the steel plate thickness, the setting of studs or stiffening plates on the flexural behavior of concrete-filled steel box slabs. The calculation formula of the moment capacity for the slab was proposed. In order to verify rationality of the formula, the calculated results based on the formula were compared with the test results and data from two current design codes. Some design suggestions were put forward to provide reference for engineering application.

2. Experimental Program
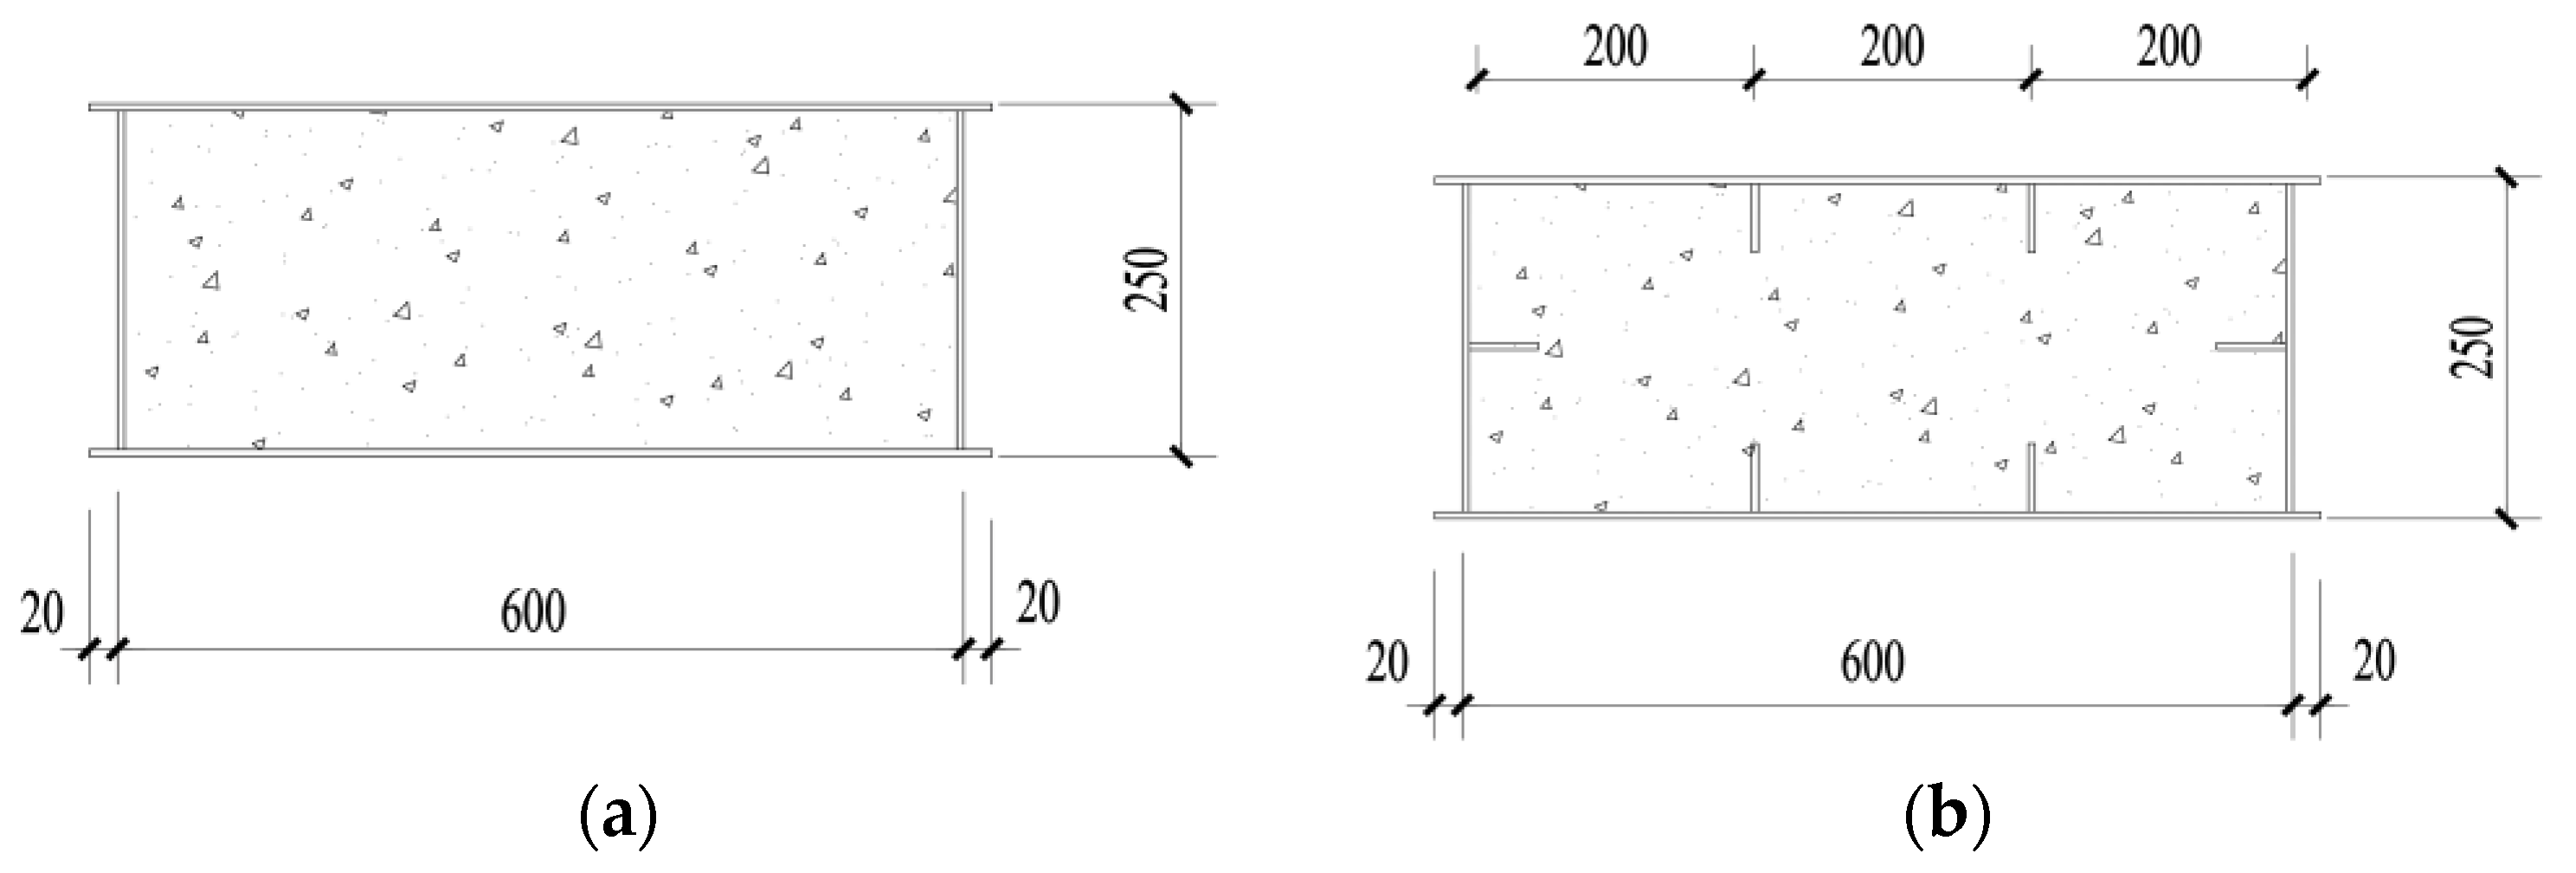
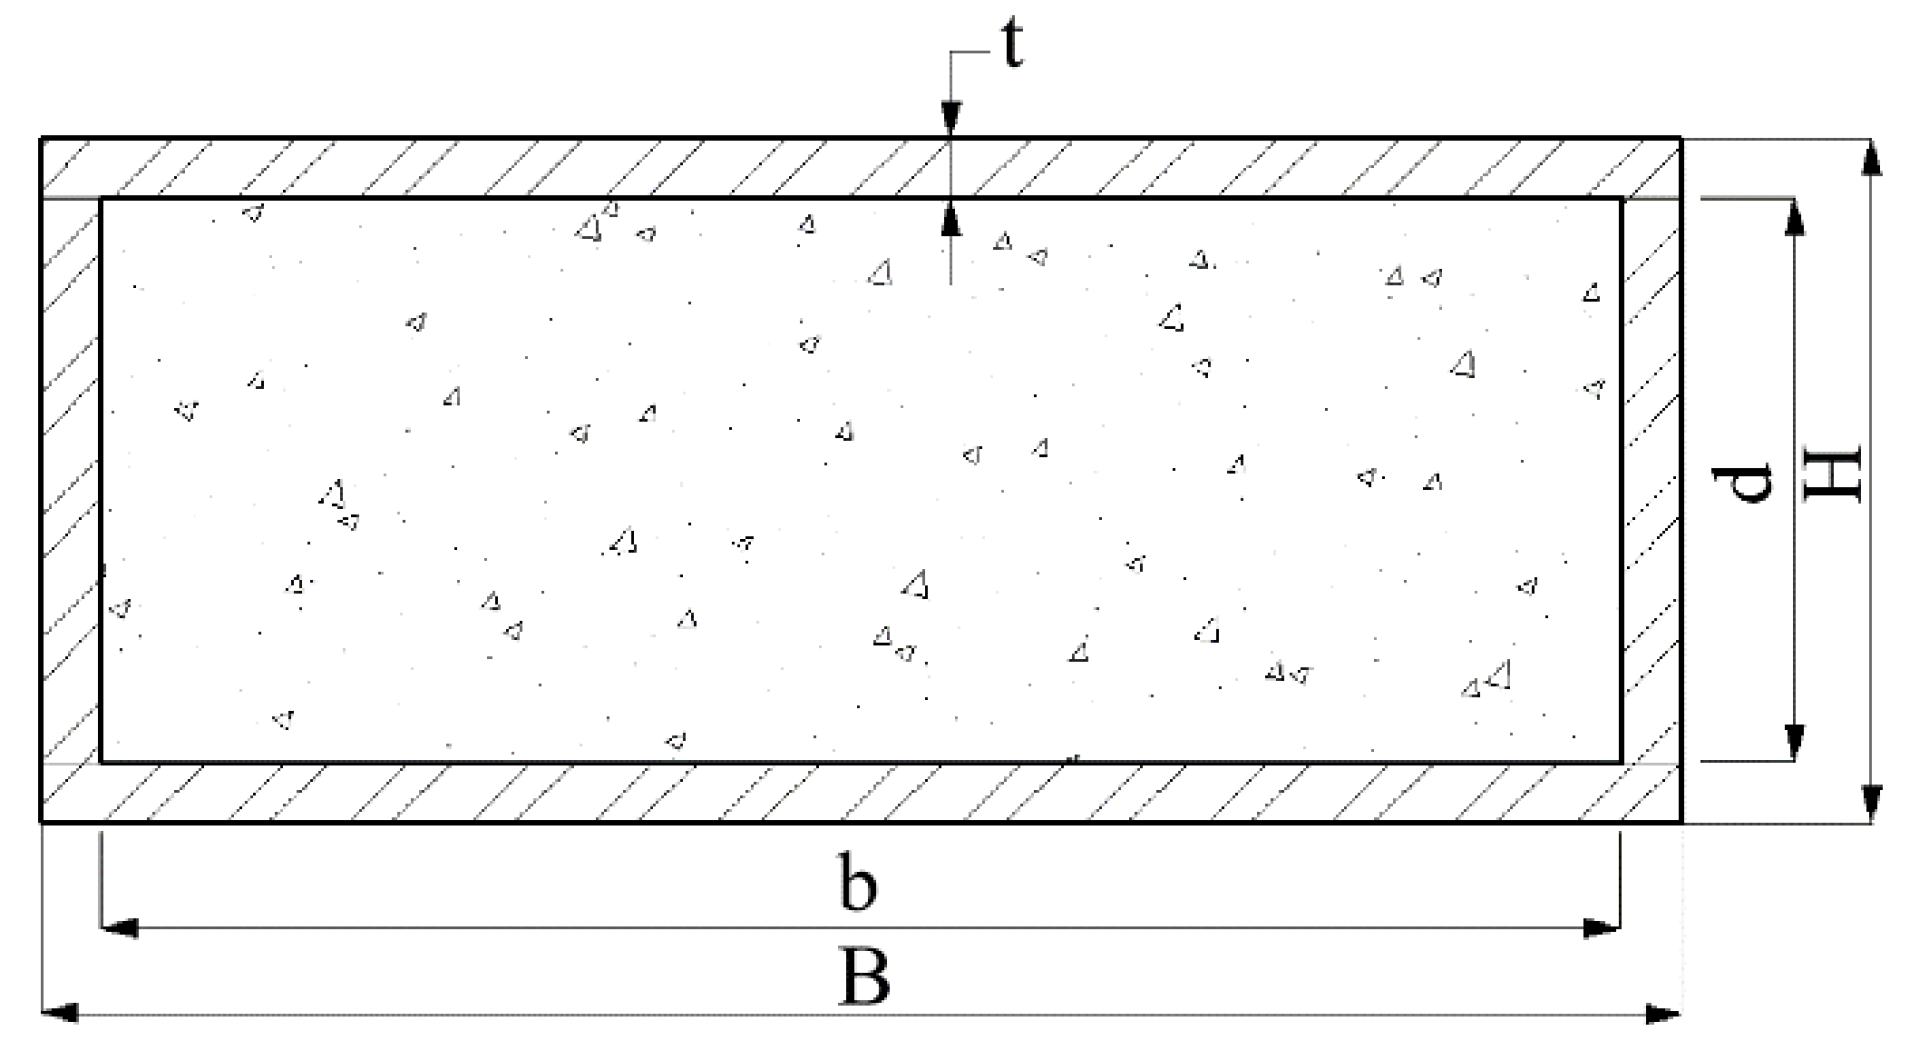
2.1. Test Specimens

Seven specimens of concrete-filled steel box slabs were designed and divided into four groups. The first group was the concrete-filled steel box slab without stud and stiffening plate, numbered S-1, where S referred to the slab. The second group included 4 concrete-filled steel box slabs with studs which numbered S-2, S-3, S-6 and S-7. The variation parameters of the second group were the steel plate thicknesses and the distances between studs. The third group was the concrete-filled steel box slab with stiffening plate, numbered S-4. The fourth group was the concrete-filled steel box slab with studs and stiffening plates, numbered S-5. The main parameters of the specimens are shown in Table 1. The dimensions and cross-section layouts of the specimens are schematically shown in Figure 1 and Figure 2.
In order to obtain the material properties, three standard steel plates with different thicknesses were tested in tension according to the requirements of GB/T 228.1-2010 [16]. The measured steel material parameters are shown in Table 2. In order to evaluate the concrete compressive strength, three 15 cm3 concrete cubes were prepared and cured under the same condition as the concrete of the specimens. After the curing stage, these three concrete cubes were tested based on the requirements of GB/T 50081-2019 [17]. The measured concrete material parameters are shown in Table 3.
During the production processing of the specimens, firstly, five steel plates were welded into a steel box with an open end as shown in Figure 3. Then, the steel box was erected and the concrete was poured inward from the open end. During the concrete pouring process, a vibrating rod was used to vibrate the steel box to ensure the compactness of the concrete. After two weeks of curing, all the concrete surfaces of each slab were flattened with M25 cement mortar and continued curing for 28 days. Then, the reserved end plate was welded at the open end.

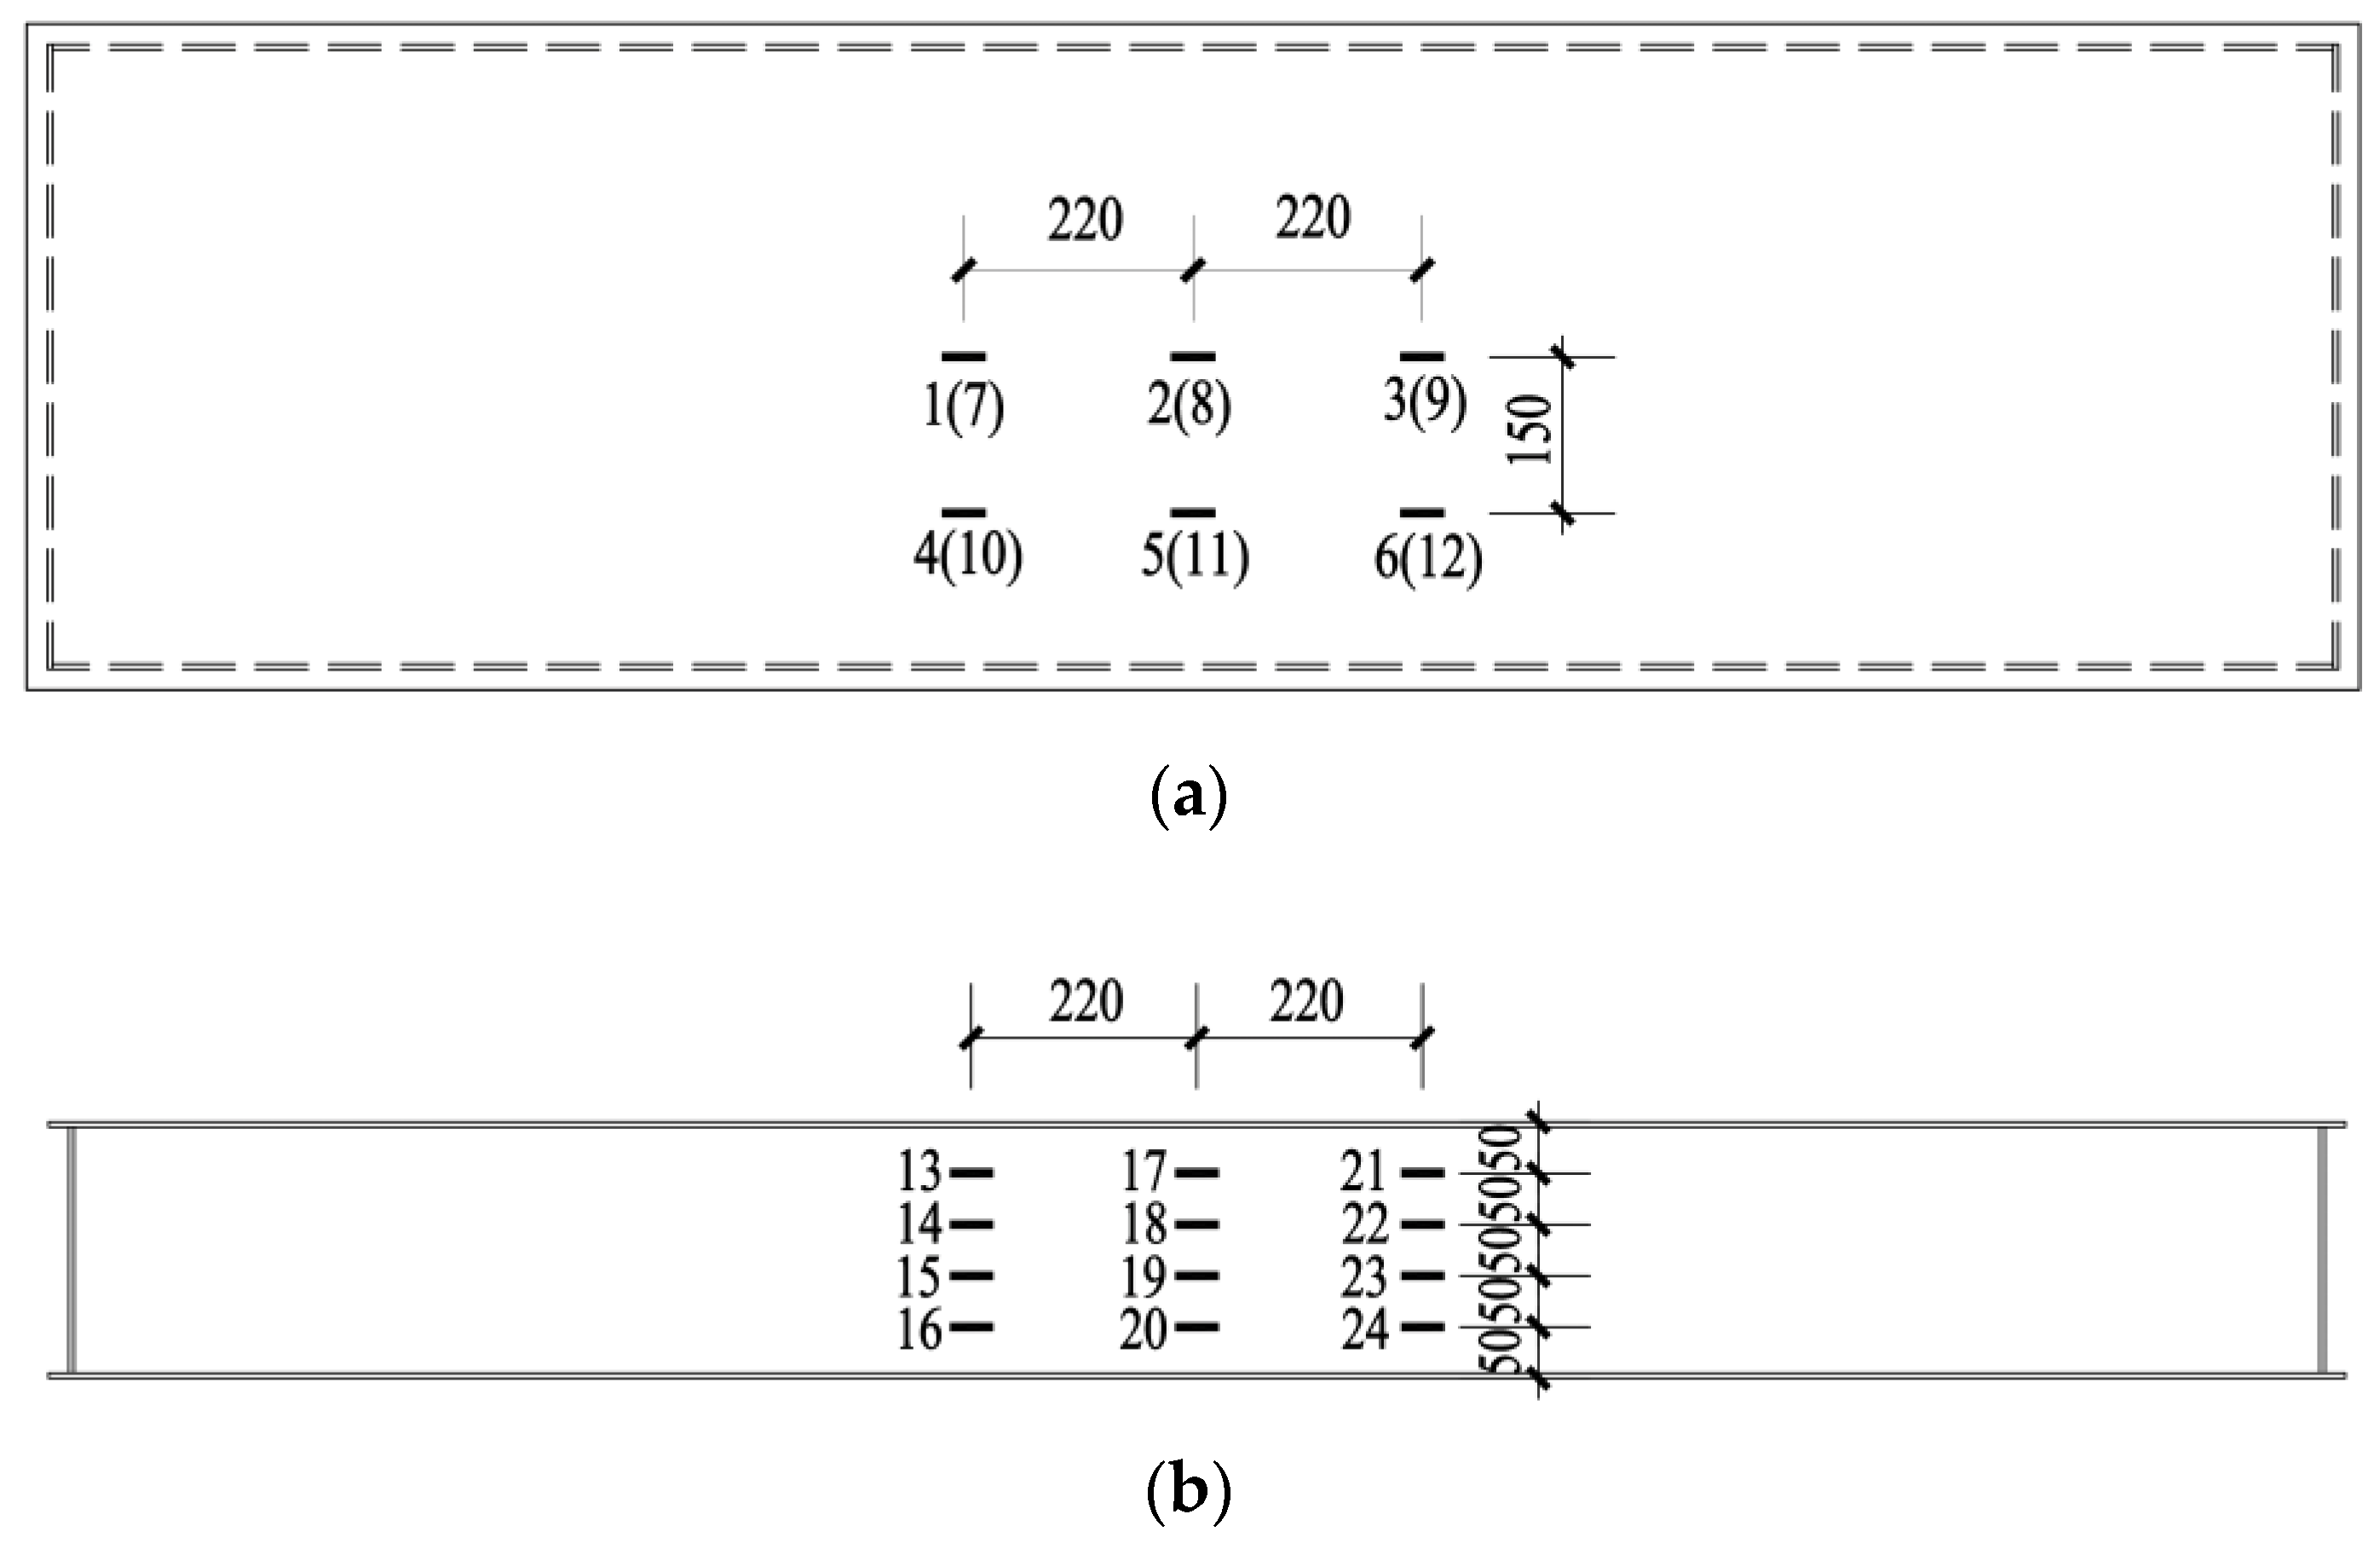
2.2. Loading Device and Measuring Point Arrangement

The tests were conducted under reaction frame as shown in Figure 4. The loads were applied at one-third of the effective span from each end support, which formed a 670 mm long pure bending zone in the middle of the specimen. The loads were applied by two 100-t jacks and measured by a pressure sensor directly connected to the jacks. Two rigid cushion blocks were placed between the jacks and the test specimen along the width direction of the specimen to prevent stress concentration. In order to measure the vertical deflections, 5 Linear Variable Displacement Transducers (LVDTs) were placed at the mid-span and another four specific points (i.e., 0 and 115 mm away from the two loading points), respectively, as shown in Figure 4a. Some strain gauges were bonded on the surfaces in the pure bending zone of the specimen to measure longitudinal strains during the loading process, as shown in Figure 5.

2.3. Loading System

The loading protocol combined load and displacement control procedures. When the maximum strain of the bottom plate of the steel box was less than the yield strain of the steel, the load control procedure was adopted. The load was increased by 10% of the estimated ultimate value at a time, and held for 3 min. After the maximum strain of the bottom plate exceeded the yield strain of steel, the displacement control procedure was adopted. For each 2 mm increase in the vertical displacement at the mid-span of the specimen, the load was suspended and held for 3 min. When the mid-span deflection reached about 2% of the length of the specimen or the obvious local buckling occurred, the tests stopped.

3. Experimental Test Results and Discussions
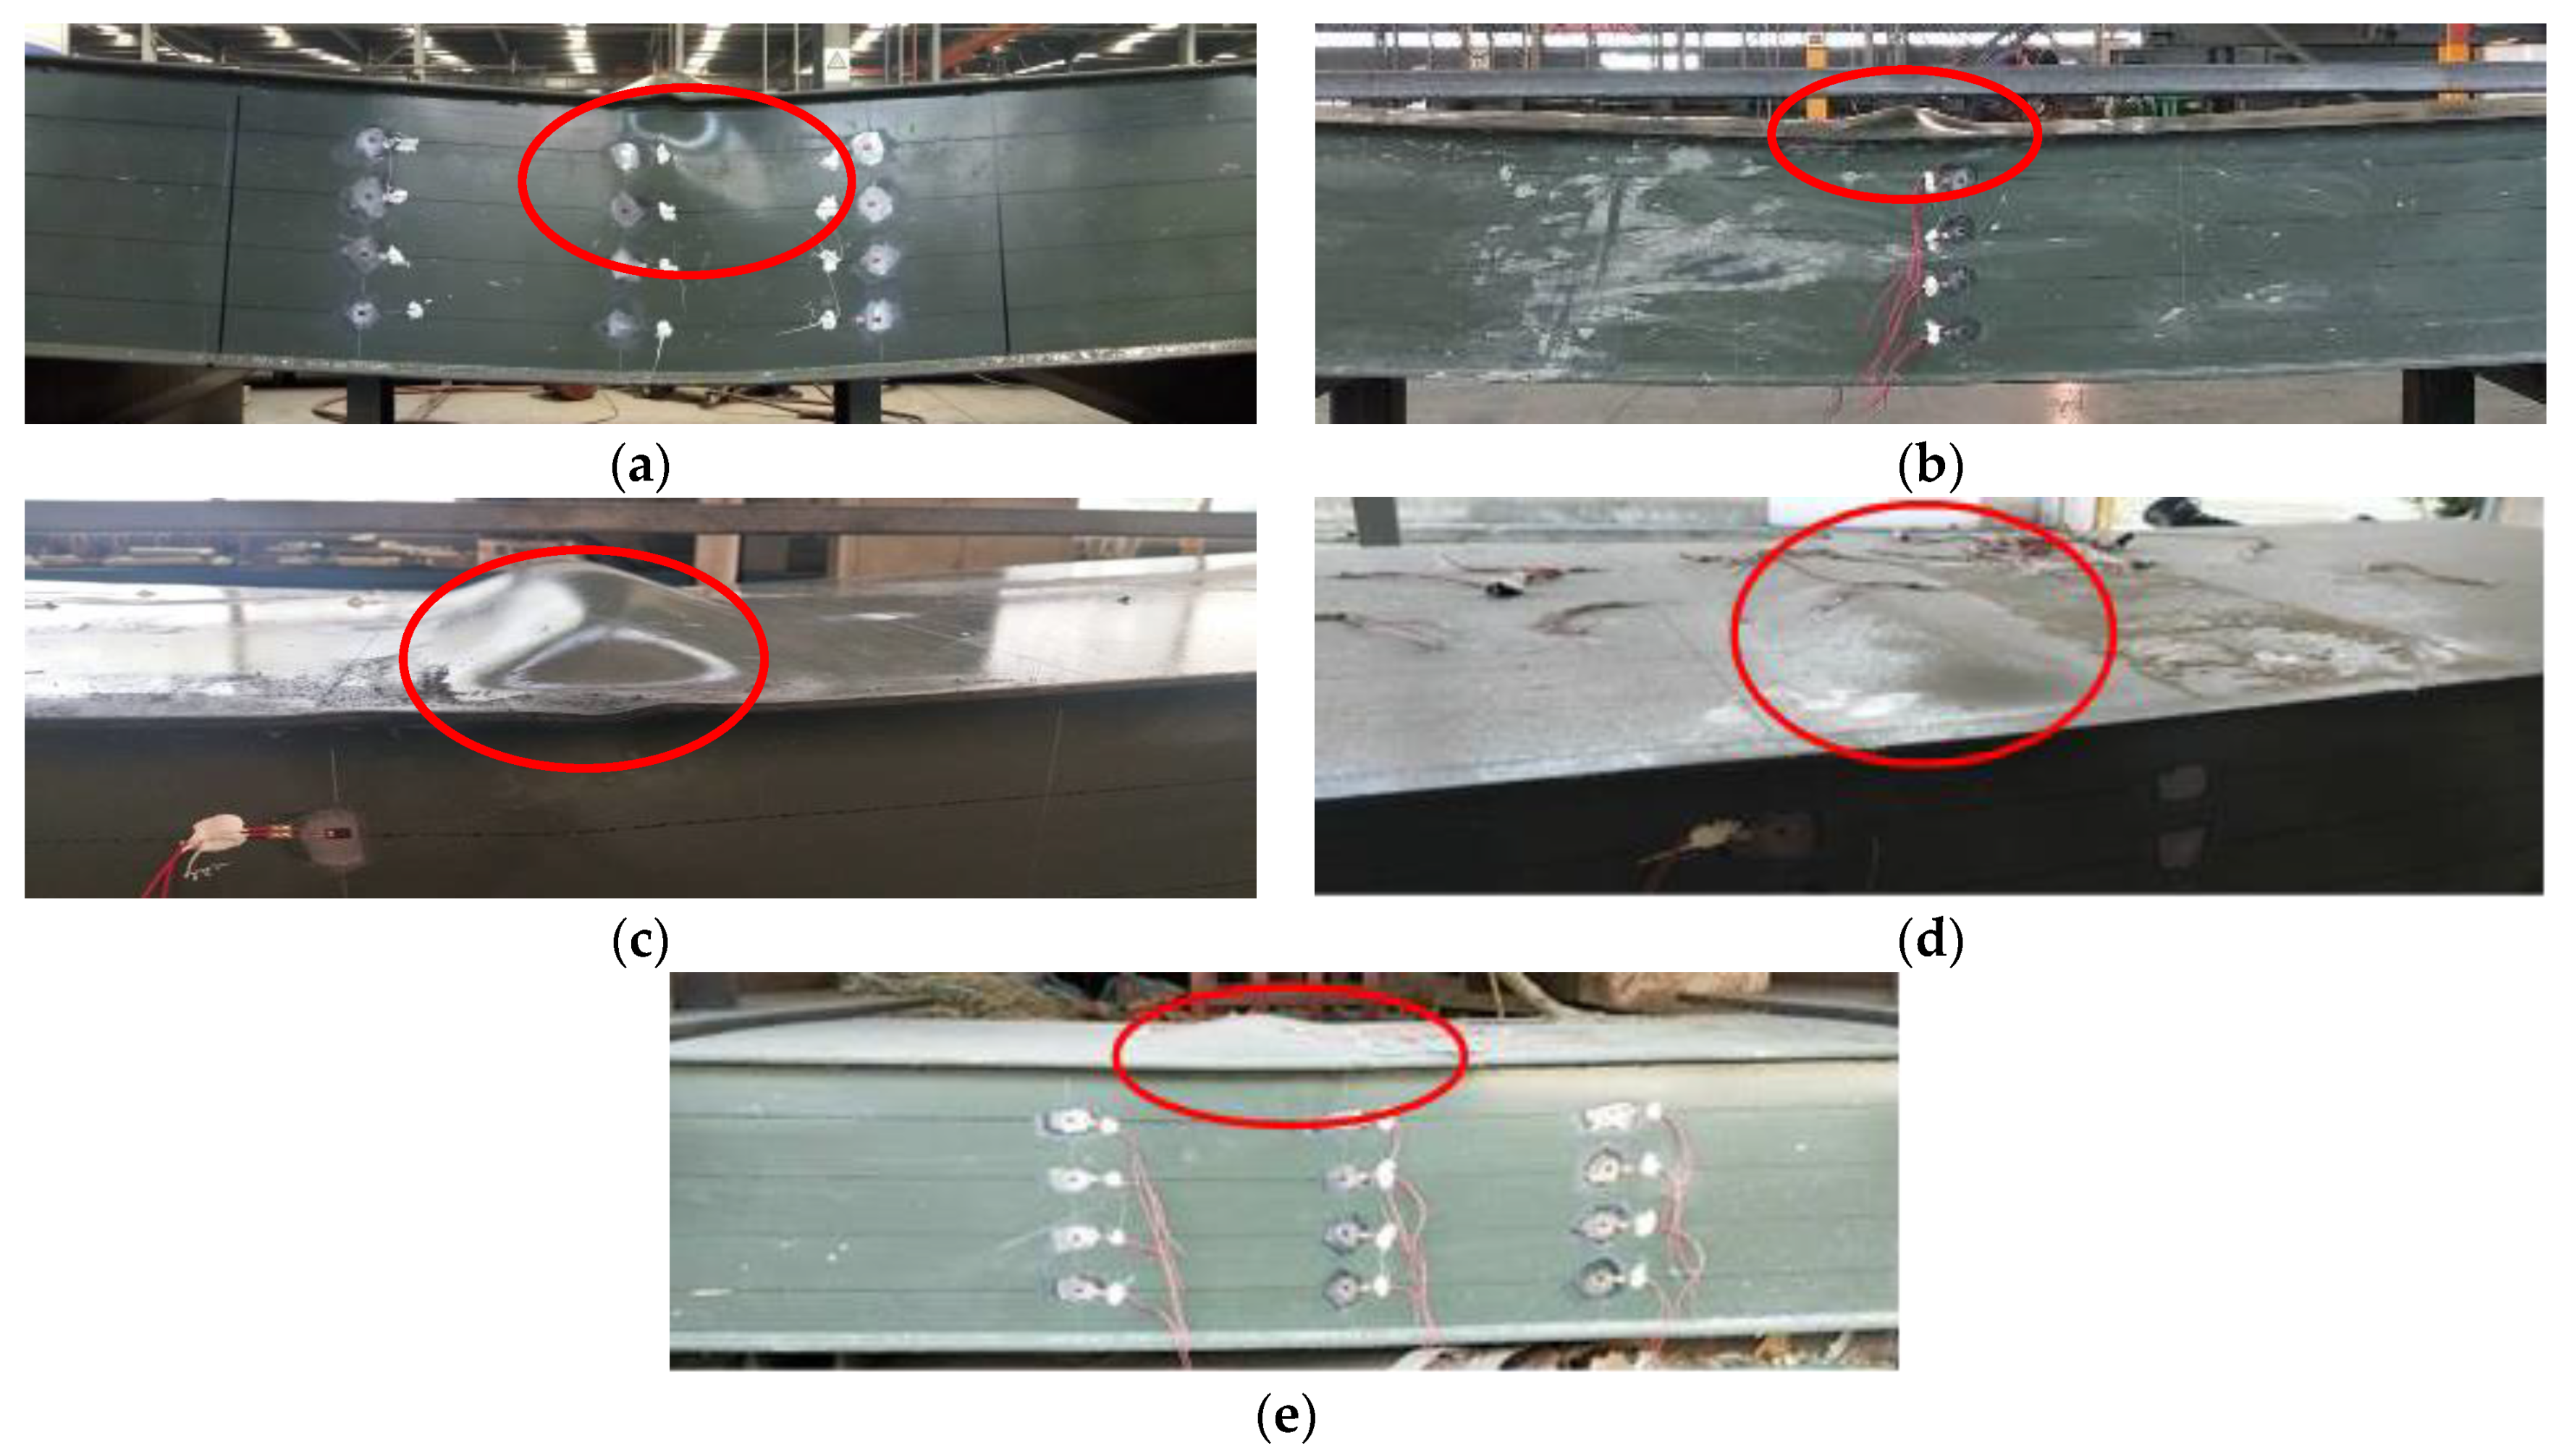
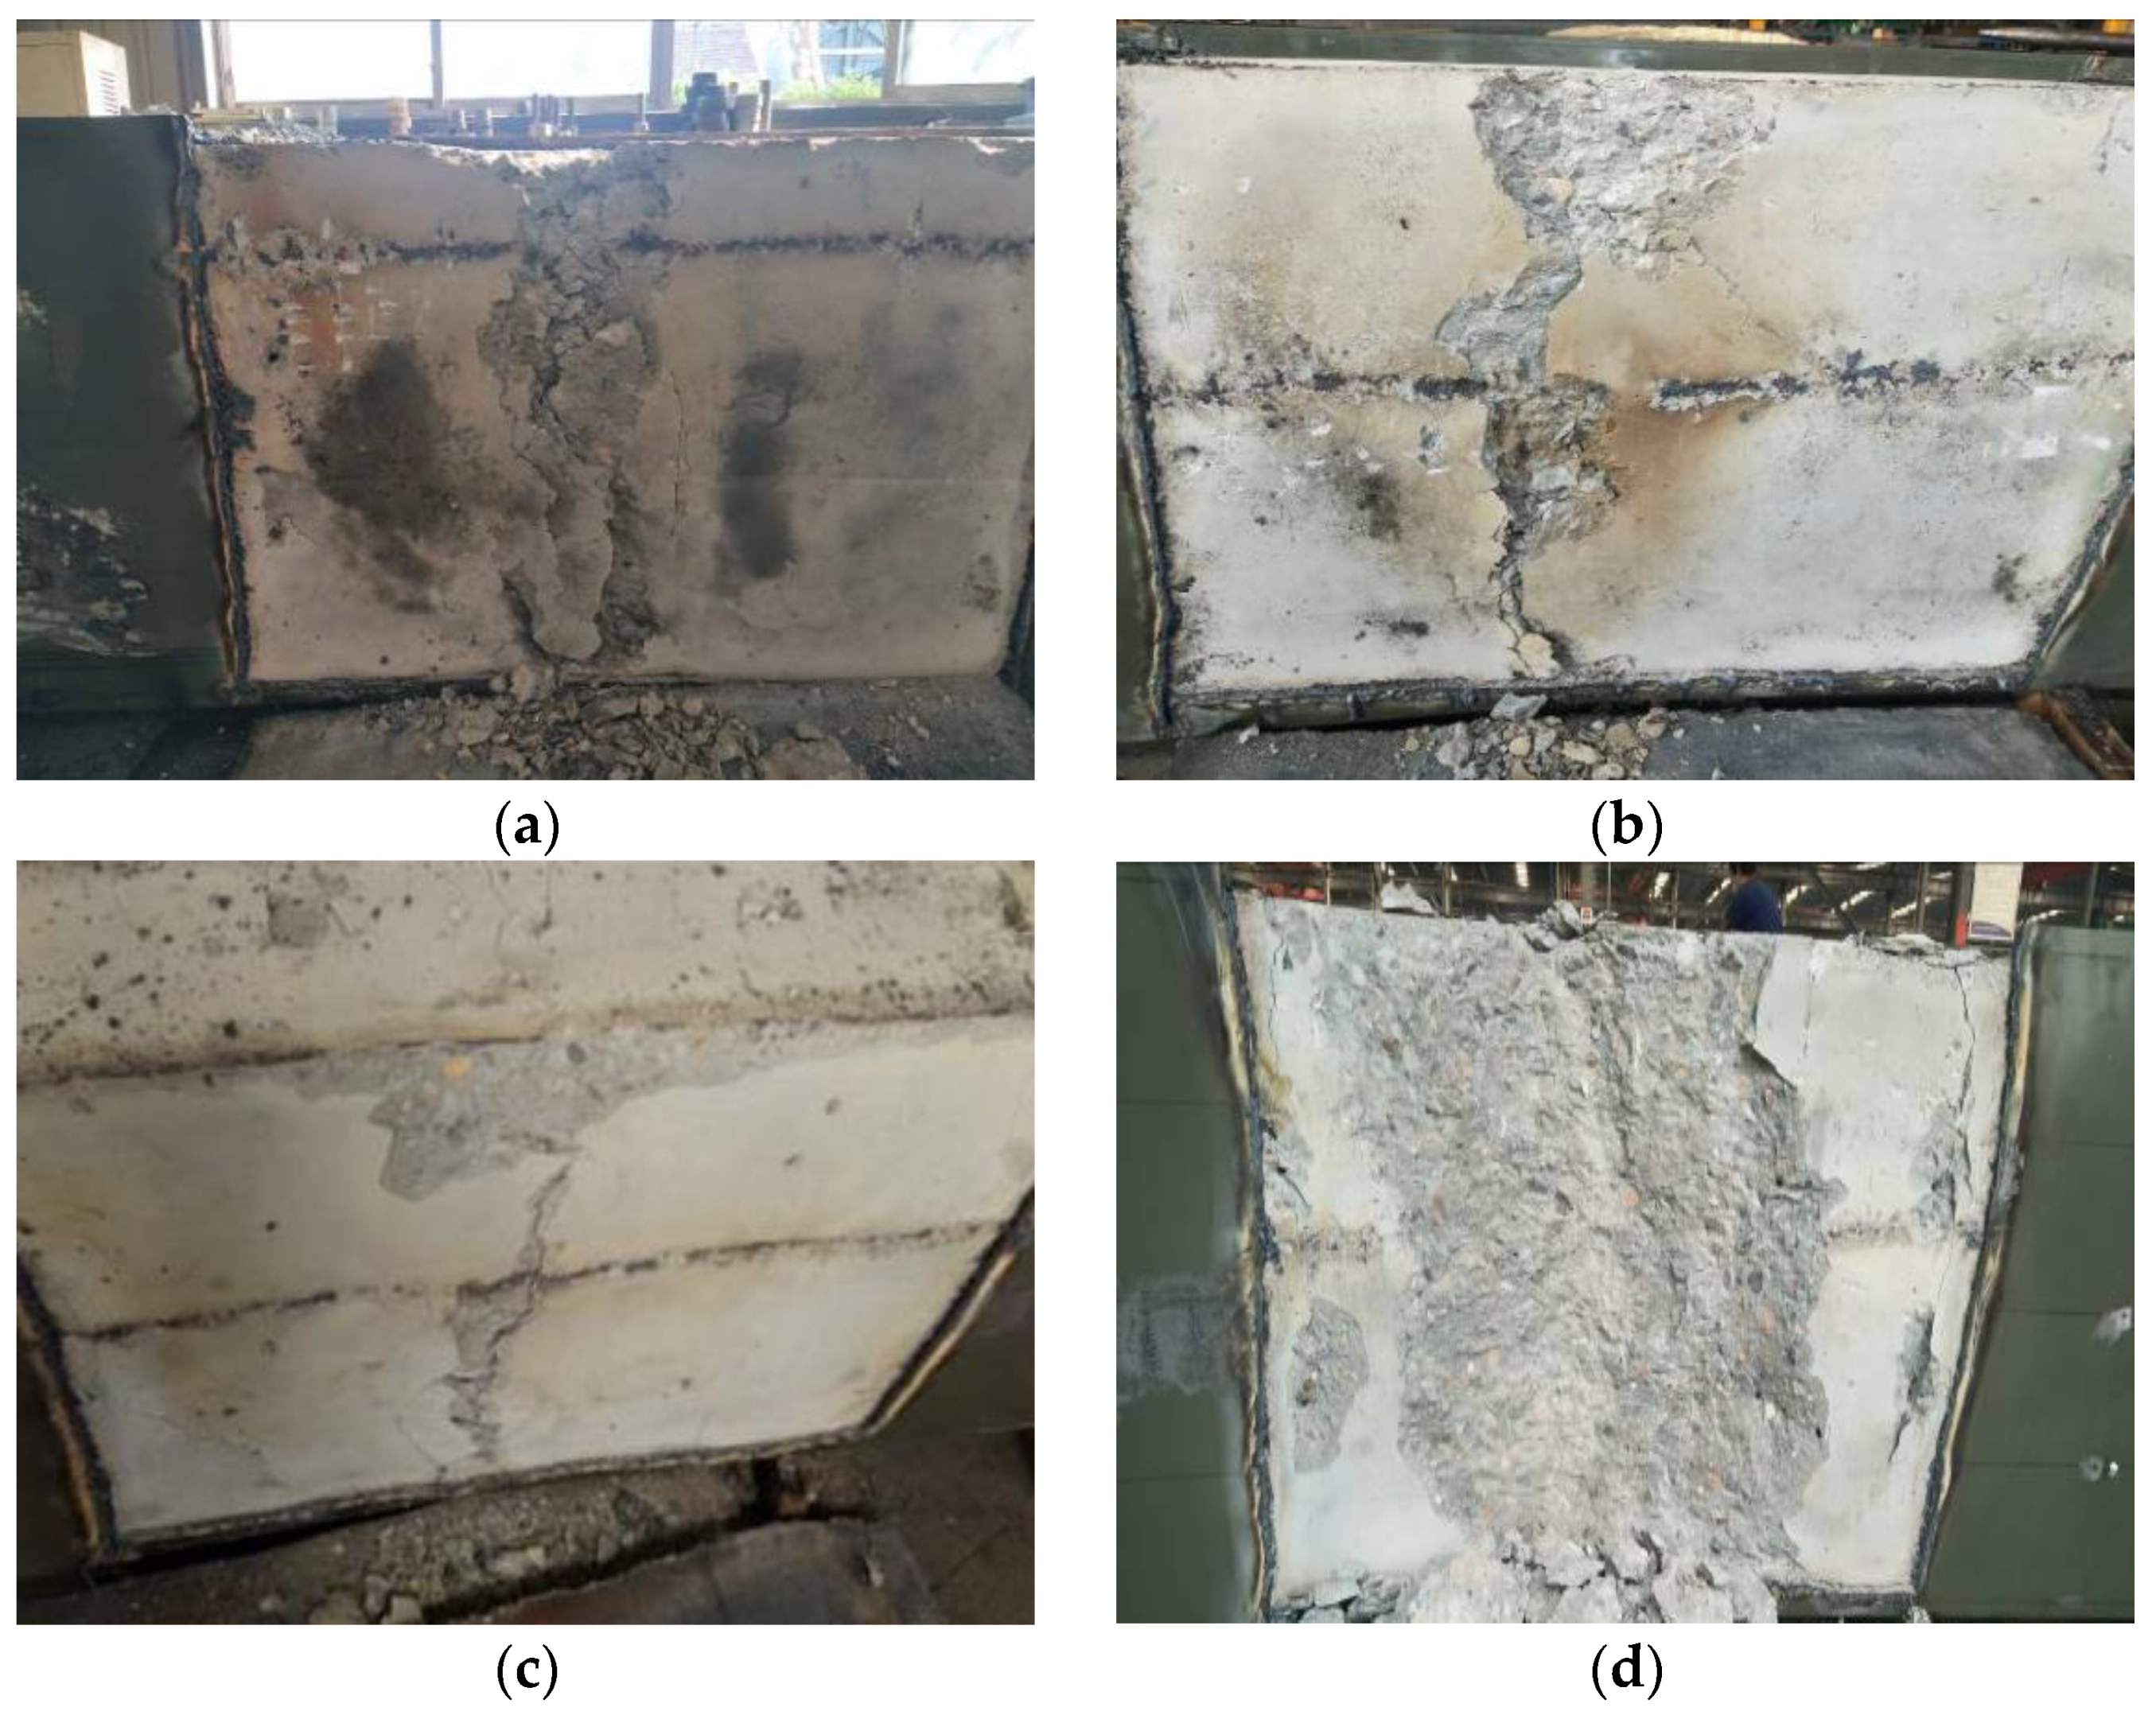
3.1. Failure Modes

All tests were conducted in a smooth and controlled manner. The failure modes of all specimens were similar and all of them were ductile failure. At the final stage of loading, the top steel plates of all the steel boxes exhibited obvious local buckling near the middle of the span. For most of the specimens, the local buckling also occurred at top of the webs, except S-4 and S-5, as shown in Figure 6a. After the load reached 50% of the ultimate load, the local buckling was observed at the top steel plates of the S-6 and S-7. Then, the local buckling became more obvious with the increase in the load, as shown in Figure 6b,c. After the load reached 75% of the ultimate load, the local buckling was observed at the top steel plates of the S-4 and S-5, as shown in Figure 6d,e. This indicated that the stiffening plate provided extra constraints for the steel boxes, which delayed the occurrence of the local buckling of the top steel plates and effectively improved the moment capacities of the specimens.
After the test, in order to investigate the core concrete condition, the steel plates were stripped off in the pure bending zone of the specimens. Figure 7 and Figure 8 show the crushing and cracking of the core concrete of typical specimens.
As can be seen from Figure 7 and Figure 8:
The concrete in compression had various degrees of crushing, and the most serious crushing of the concrete took place next to the top plate of the steel box where the local buckling occurred. This was mainly due to the fact that the steel plate and the concrete were separated after the steel plate buckled. Therefore, the buckled steel plate no longer took any load and the concrete had to share more load, which led to serious damage to the concrete.
The typical crack distributions of S-2, S-3, S-6 and S-7 are exhibited in Figure 8. It can be seen that all the specimens had cracks on the bottom surface of the concrete, and some of the cracks even extended to the side surface of the concrete. It also can be seen that the relatively large cracks were generated near the studs, due to the stress concentration caused by the studs. Compared with the S-3, the S-2 with a smaller stud space had a larger crack width. This indicated that the effect of stress concentration from studs on tensile concrete behavior was more obvious compared with that of the specimens with a smaller stud space, which made the concrete crack easily. In addition, it was observed that all the studs in the specimens were not sheared, indicating that there was no obvious slip between the built-in concrete and the steel box.

3.2. Deflection Curve of a Tested Slab

Figure 9 illustrates a typical set of deflection curves for the specimen S-2, where the x-coordinate d represents the distance between the measuring point and the middle of the span. The deflection curves of the other specimens are similar to S-2.
From Figure 9, it is observed that the deflection curves of S-2 resemble a half-sine curve.

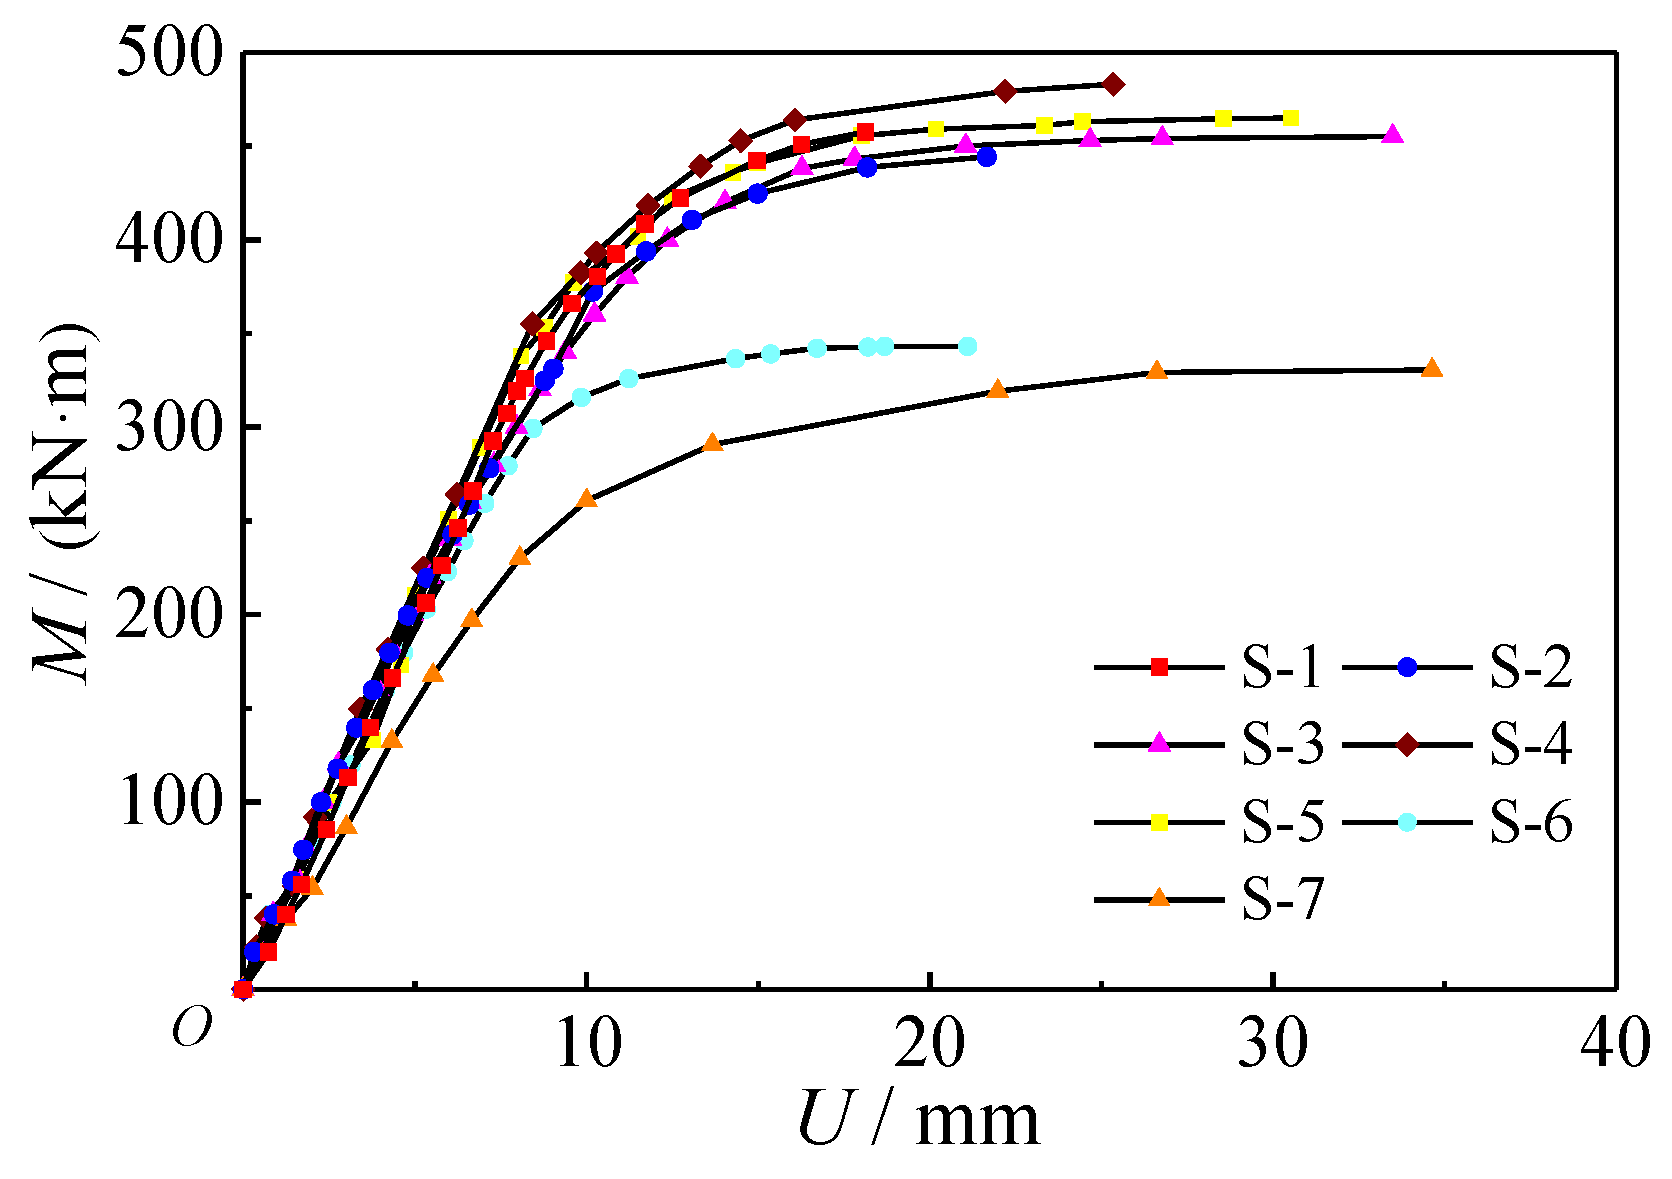
3.3. Mid-Span Moment versus Mid-Span Deflection Relations

Figure 10 shows the curves of the measured moment relative to the mid-span deflection. The moment capacities and their corresponding deflections are given in Table 4, in which Me is the moment corresponding to the yield strain of steel, and Δe is the deflection at this time. Mu is the moment corresponding to the maximum strain of 10,000 με [6], and Δu is the deflection at this time.
The following can be seen from Figure 10 and Table 4:
All the specimens were considered to experience the following three basic phases during the loading process: elastic stage, inelastic stage, and plastic stage. It should be pointed out that the plastic performance of the specimen S-1 was not fully developed due to the failure of the jack. However, all the other specimens behaved in a favorable ductile pattern.
The moment capacity of S-1 was 5% lower than that of S-4, and the moment capacity of S-2 was 6% lower than that of S-5. This can be attributed to the fact that the stiffening plate not only delayed the occurrence of the local buckling of top steel plates, but also divided the internal space of the steel box into two parts, which could improve the constraint effect of the steel box on concrete. As a result, the moment capacity of the concrete-filled steel box slab was improved.
The moment capacity of S-1 was 3% higher than that of S-2, and the moment capacity of S-4 was 2% higher than that of S-5. It indicated that the stud reduced the moment capacity of the specimens. The concrete near the studs was easy to crack, due to the effect of stress concentration. Therefore, the number and width of cracks on the bottom surface of the concrete for the specimens with studs were larger than those without studs. It was observed that some cracks next to the stud extended to the compressive zone of the concrete. This meant that the effective working area of the concrete decreased, which reduced the moment capacity of the specimens. In addition, comparing the moment capacity of S-2 and S-3, it can be seen that the moment capacity increased by about 2% when the spacing of a stud was doubled. Thus, it can be concluded that studs should not be set under the premise of ensuring the overall working performance of the steel box and the concrete.
Comparing the moment capacity of S-2, S-6 and S-7, it can be seen that changing the thickness of the steel plate from 3.47 to 3.64 mm increased the ultimate moment capacity of the specimen by up to 6.1%, while this increase was up to 38.6% by changing the thickness from 3.47 to 4.62 mm. It indicated that increasing the thickness of the steel plate significantly improves the moment capacity of the specimen. It can also be concluded from Figure 10 that the stiffness of the concrete-filled steel box slab increased gradually with the increase in steel plate thickness.

3.4. Mid-Span Moment versus Bottom (Top) Steel Plate Strain of Specimens

Figure 11 shows the relationships of the moment capacity and the strain at the mid-span of the bottom surface. It can be seen that:
The thickness of the steel plate had a significant influence on the strain at the mid-span of the bottom steel plate. In the elastic stage, the slope of the curve decreased with the decrease in the steel plate thickness. The strain of the bottom steel plate of S-7 was significantly greater than that of the other specimens subjected to the same amount of moment. The strain of the bottom steel plate of S-6 was the second largest. This was mainly due to the fact that more and more concrete in tension cracked and stopped working as the load increased, and after cracking, the tensile force was carried by the steel plate instead of both the steel plate and concrete. Therefore, the strain of the bottom steel plate increased with the decrease in the steel plate thickness.
Studs had an obvious influence on the strain at the mid-span of the bottom steel plate. It can be seen from Figure 11 that the strains of the bottom steel plate of the specimens with studs were larger than those without studs under the same amount of moment. This was due to the fact that the places where the studs were set had a larger crack width of concrete, which caused more concrete to stop working, and then more tensile force was carried by the bottom steel plate.
The stiffening plate had an influence on the strain of the bottom steel plate. The strains of the bottom steel plate of the specimens with stiffening plates were smaller than those without stiffening plates under the same amount of moment. It indicated that the stiffening plate can improve the flexural performance of the section.
Figure 12 shows the relationships of the moment capacity and the strain for both the top and the bottom steel plates of the typical specimen S-6, in which the dotted line represents the yield strain of the steel. Obviously, in the elastic stage, the tensile strain was slightly larger than the compressive strain. The increment of tensile strain was obviously larger than that of compressive strain with the increase in the load. Both the compressive force and the tensile force were carried by the concrete and the steel plates before the concrete cracked. Once the concrete cracked and stopped working, it would not be able to carry anymore tensile force, which made the tensile force be mainly carried by the bottom steel plate. Therefore, the tensile strain was larger than that of the compressive strain, as shown in Figure 12.

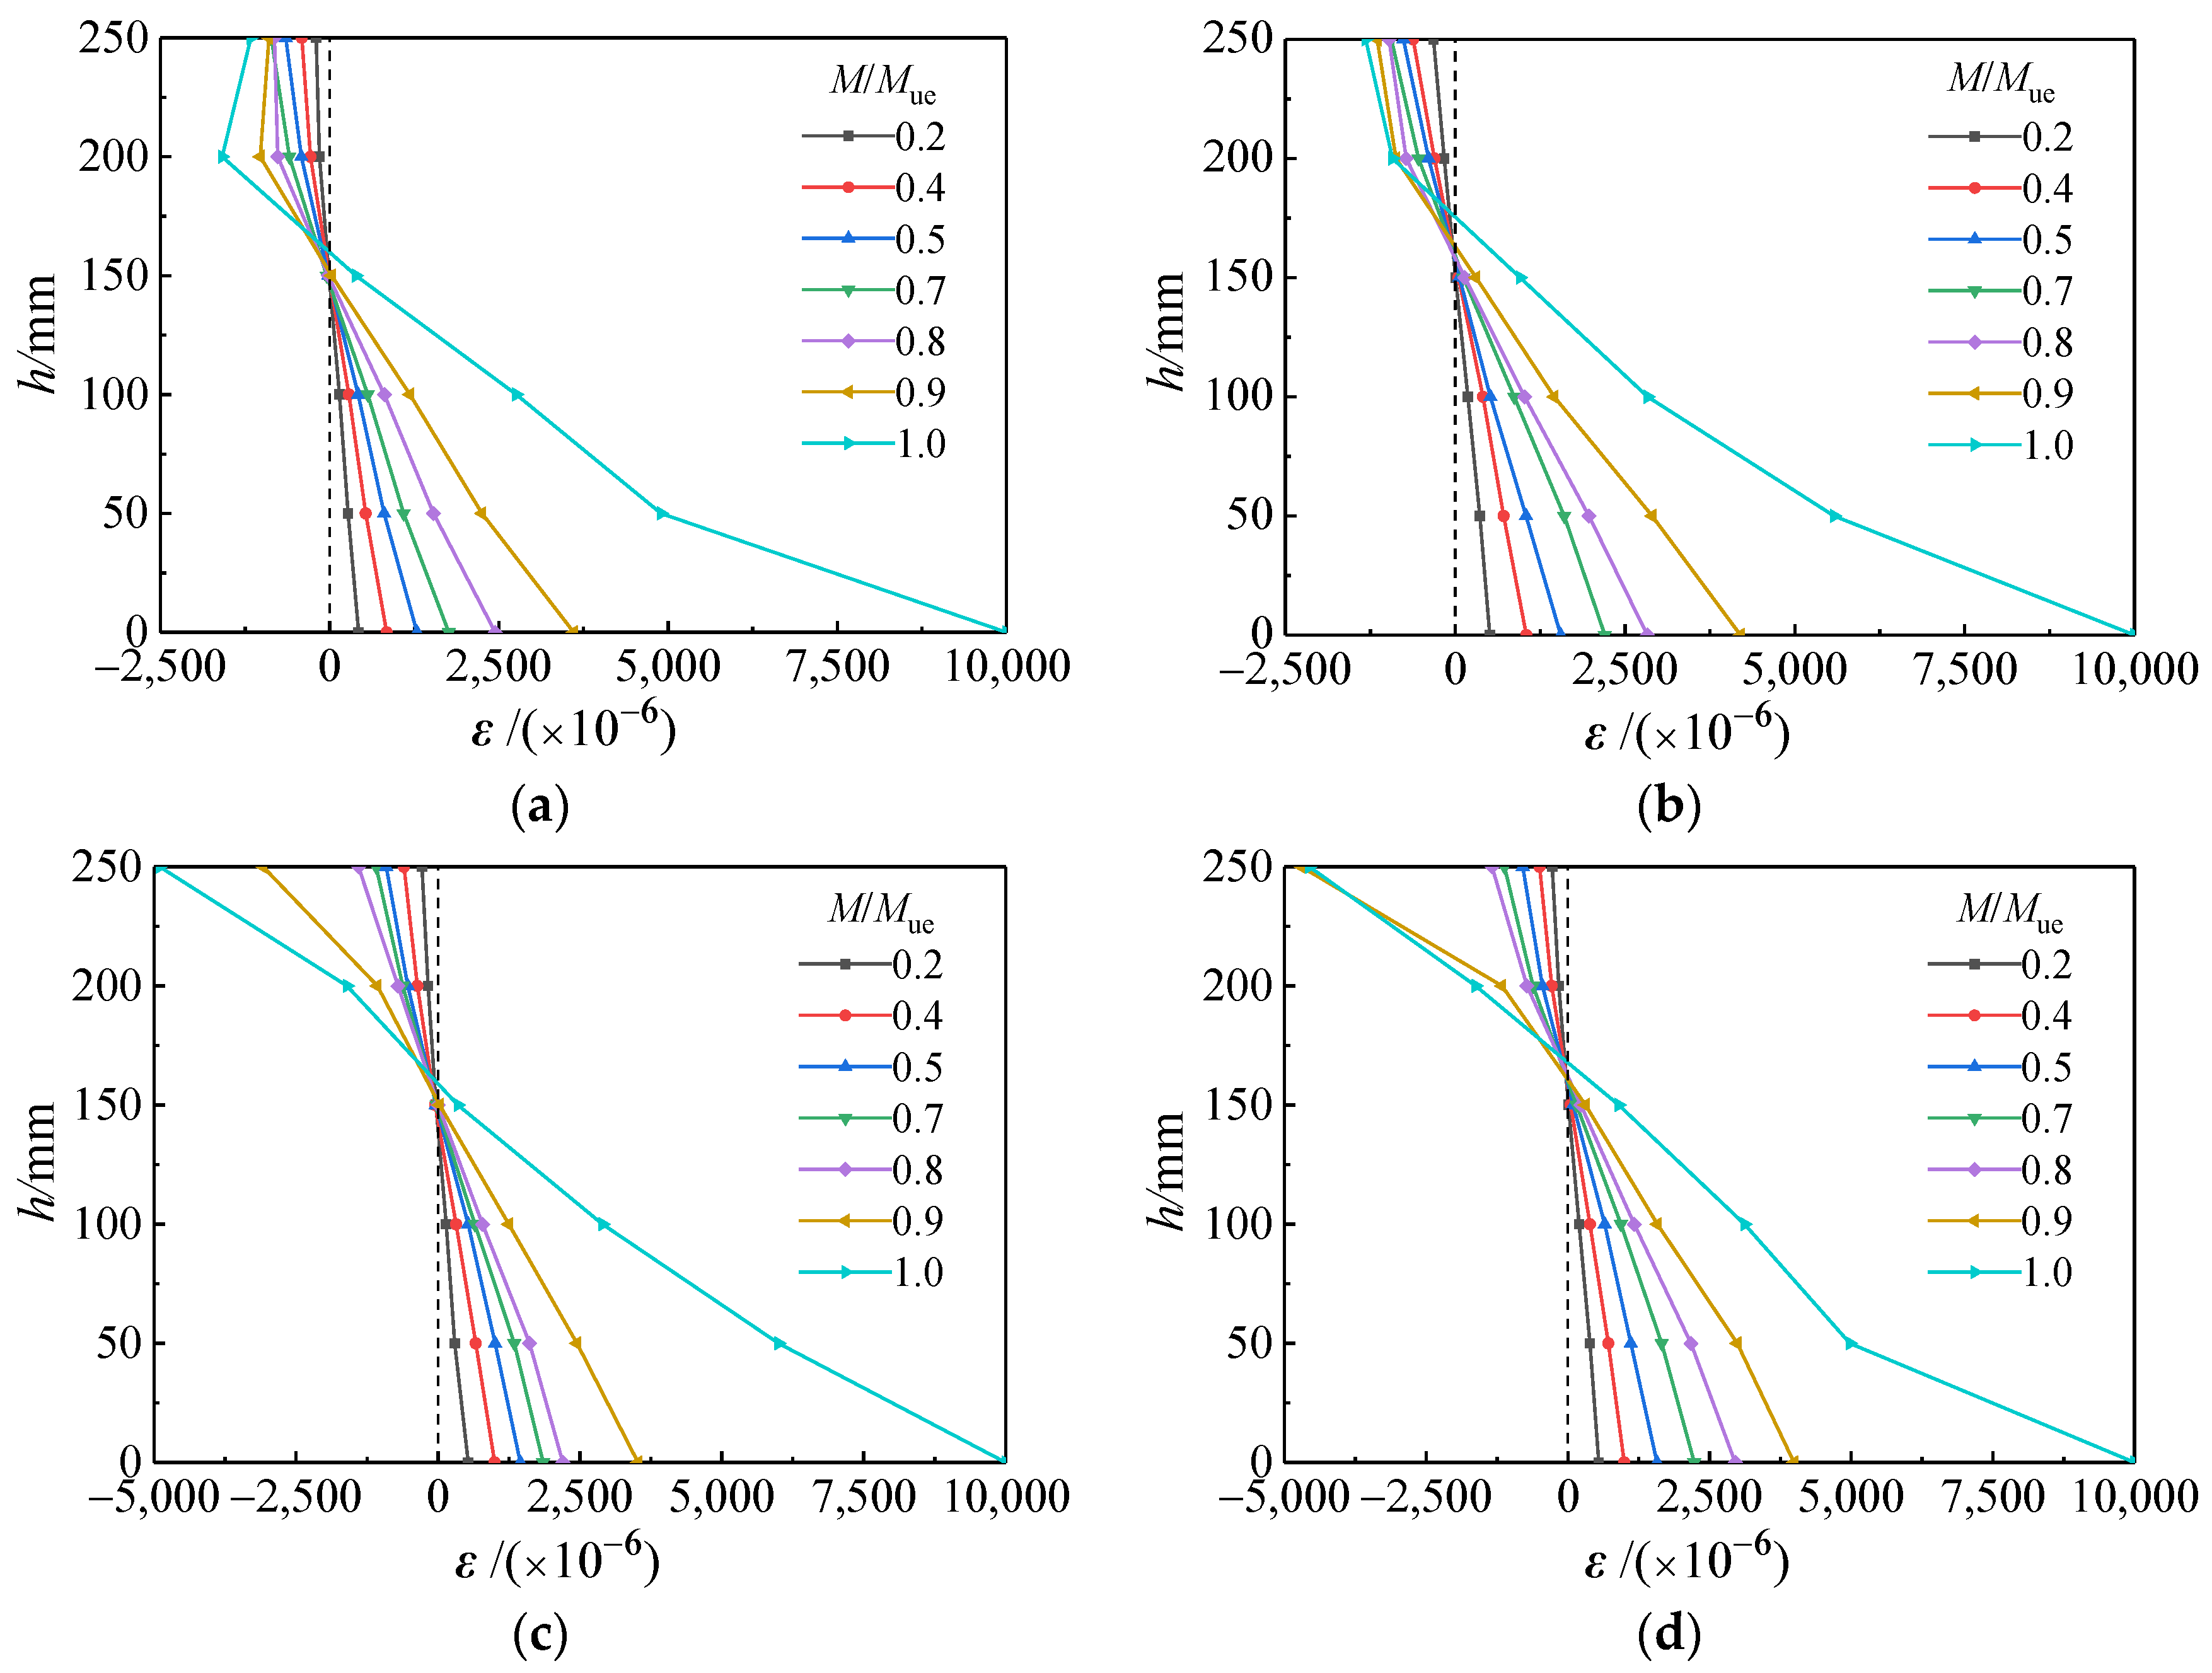
3.5. Longitudinal Strain Distribution along the Height at the Mid-Span of Specimens

Figure 13 illustrates the longitudinal strain distributions along the height direction at the mid-span of four typical specimens (S-1, S-2, S-4 and S-5), in which h represents the distance between each measuring point and the bottom steel plate, h = 0 mm represents the bottom of the slab and h = 250 mm represents the top of the slab, the abscissa represents the longitudinal strain of each measuring point, the tensile strain is positive and the compressive strain is negative. It can be seen that the longitudinal strain was linearly distributed before the load reached 70% of the ultimate load, which indicated that the displacements of these specimens were in accordance with the plane-section assumption. Furthermore, the height of the neutral axis was nearly unchanged at this stage. After the load exceeded 80% of the ultimate load, strains of the bottom steel plates increased sharply. Meanwhile, the neutral axis clearly moved up.

4. Discussions on the Calculation Method of Moment Capacity for the Concrete-Filled Steel Box Slab

4.1. Calculation Formula of Moment Capacity

The calculation formula of the moment capacity of the concrete-filled steel box slab was derived, based on the test results and the following assumptions: (a) the cross-section of the specimen remains plane after deformation, (b) neglecting the contribution of the concrete in tension, (c) neglecting the residual stress of the steel box caused by welding, and (d) the steel and the concrete reach the yield strength fy and the compressive strength fc, respectively, as the moment capacity is reached.
The test results show that the moment capacity of the specimen with studs was about 3% lower than that of the specimen without studs. The moment capacity of the specimen with a stiffening plate was about 5% higher than that of the specimen without a stiffening plate. Studs and stiffening plates had little influence on the moment capacity of the concrete-filled steel box slab relative to the section size of the specimen. Therefore, the formula proposed in this paper does not consider the influence of studs and stiffening plates on the moment capacity of the specimen.
The cross-section of the concrete-filled steel box slab is shown in Figure 14. The stress distribution on the cross-section of the specimen is shown in Figure 15, where α1 = 1.0, β1 = 0.8. The following equation can be obtained from the force equilibrium:
B t f y + 2 t x c f y + b β 1 x c α 1 f c = 2 t ( d x c ) f y + B t f y
where xc is the depth of the compression zone of concrete. Equating Equation (1), the xc can be expressed as:
x c = 2 t d f y α 1 β 1 b f c + 4 t f y
Then, the calculation formula of the moment capacity of the specimen can be expressed as:
M = B t f y ( d + t ) + f y t [ x c 2 + ( d x c 2 ) ] + 3 5 α 1 β 1 b x c 2 f c

4.2. Current Codes

The following two design codes (i.e., GB 50936-2014 [18] and AISC, 360-16 [19]) are adopted in this study to predict the moment capacity of the slab.
  • GB 50936;
M u = γ m W s c f s c
where γ m = 0.483 ξ + 1.926 ξ , W s c = B H 2 / 6 , f s c = ( 1.212 + F ξ + G ξ 2 ) f c , ξ = ( A s f y ) / ( A c f c ) , F = 0.131 f y / 213 + 0.723 , G = 0.07 f c / 14.4 + 0.026 .
2.
AISC, 360-16;
M u = f y Z

4.3. Comparison of the Moment Capacity of the Slab

In this section, the experimental moment capacities (Mue) were compared with the calculated moment capacities (Muc) from Formulas (3)–(5). The comparison results are shown in Table 5.
From Table 5, the following conclusions can be drawn:
The moment capacities of the specimens calculated from Formula (3) were about 11% lower than the test results. The calculated results based on the AISC code were about 20% lower than the test results. The calculated results according to the GB50936 code were about 3% higher than the test results. This was due to the fact that the GB50936 code considers the constraints effect of steel on concrete and the plastic development of the section. For Formula (3) derived in the paper, although the contribution of compression concrete was considered, the composite action between steel and concrete was not considered, which resulted in lower results compared with those of the experiments. The AISC code only considers the contribution of the steel box, ignoring the contribution of concrete; therefore, the calculated results from AISC were the lowest.
The moment capacities of the specimens from the test were mostly smaller than the calculated results based on the GB50936 code, except S-4 and S-5. Moreover, the ratio of calculated results from GB50936 code to test results increased with the decrease in the steel plate thickness. This was mainly due to the fact that the equivalent square section had to be used to calculate the confinement factor (ξ) instead of the original rectangular section for the GB50936 code. It indicated that the constraints effect of the rectangular section with a small height-to-width ratio of the steel box was lower than that of the square section.
Though the calculated moment capacities of the specimens from GB50936 code were the closest to the test results, most of them were larger than the test values. Therefore, GB50936 will overestimate the moment capacity, and it tends to be unsafe to design similar slab-type members. It is instructive for engineering design that the calculated results from the design code should be smaller than the test results. Compared with the Formula (5), the calculated moment capacities of the slab from Formula (3) were closer to the test results, with acceptable dispersion. Therefore, the Formula (3) is more suitable for application in engineering design.

5. Conclusions

The concrete-filled steel box slab behaved with favorable ductile performance. When the ultimate load was reached, the bottom steel plate yielded, local buckling occurred at the top steel plate, and the concrete in compression crushed. The number and width of cracks on the bottom surface of the concrete with studs were larger than those without stud.
The thickness of the steel plate had a significant influence on the flexural performance of the concrete-filled steel box slab. As the thickness of the steel plate changed from 3.47 to 3.64 mm, the ultimate moment capacity of the specimen increased by up to 6.1%, while this increase was up to 38.6% by changing the thickness from 3.47 to 4.62 mm.
The concrete in tension near the studs was easy to crack, because of stress concentration. The moment capacity of the concrete-filled steel box slab with studs was lower than that without studs, and increased by about 2% when the spacing of studs expanded from 200 to 400 mm.
The stiffening plate significantly improved the constraints effect of the steel box on the concrete, and then increased the moment capacity of the concrete-filled steel box slab. The moment capacity of the specimen with a stiffening plate was about 5% higher than that of the specimen without a stiffening plate.
The moment capacity formula proposed in this paper did not consider the influence of studs and stiffening plates on the moment capacity of the specimen. The values calculated from the moment capacity formula were in good agreement with the test results, with a mean value of 0.885 and a standard deviation of 0.0228. Therefore, the calculated values will be able to provide reference for engineering design.

Author Contributions

Conceptualization, methodology, resources and funding acquisition, Y.L.; formal analysis and investigation, C.Z. and J.S.; data curation, C.Z.; writing—original draft preparation, Y.L., C.Z. and J.S.; writing—review and editing, S.Q. All authors have read and agreed to the published version of the manuscript.

Funding

This project was supported by the Science and Technology Project of the Ministry of Housing and Urban-Rural Development (2019-k-073), the Research and Innovation Team Supported by the Ministry of Education (IRT13075), Ph.D. Foundation of Shandong Jianzhu University (2016).

Institutional Review Board Statement

Not applicable.

Informed Consent Statement

Not applicable.

Data Availability Statement

Not applicable.

Acknowledgments

The authors gratefully acknowledge the financial support for the research provided by Weifang Dayang Parking Co., Ltd.

Conflicts of Interest

The authors declare no conflict of interest.

Nomenclature

The following symbols are used in this paper:
Acconcrete cross-sectional area
Assteel cross-sectional area
bwidth of the built-in concrete
Bwidth of rectangular steel box
dheight of the built-in concrete
Hheight of rectangular steel box
Llength of rectangular steel box
Ecelastic modulus of concrete
Eselastic modulus of steel
fcucube compressive strength of concrete
fcaxial compressive strength of concrete(fc = 0.67fcu)
fyyield strength of steel
fscyield strength of the composite section
fuultimate strength of steel
Mbending moment
Meyield moment
Muultimate bending moment of the composite section
Mueexperimental moment capacity
Muccalculated moment capacity
Udeflection
tthickness of steel plate
Wscsection modulus of the composite section
Zplastic section modulus about the axis of bending
Δeyield deflection
εstrain of steel
εyyield strain of steel
ξconfinement factor
γmflexural strength index

References

  1. Lu, Y.Q.; Kennedy, D.J.L. The flexural behaviour of concrete-filled hollow structural sections. Can. J. Civ. Eng. 1994, 21, 111–130. [Google Scholar] [CrossRef]
  2. Uy, B. Strength of concrete filled steel box columns incorporating local buckling. J. Struct. Eng. 2000, 126, 341–352. [Google Scholar] [CrossRef]
  3. Uy, B. Strength of short concrete filled high strength steel box columns. J. Constr. Steel Res. 2001, 57, 113–134. [Google Scholar] [CrossRef]
  4. AI-Zand, A.W.; Badaruzzaman, W.H.W.; Al-Shaikhli, M.S.; Ali, M.M. Flexural performance of square concrete-filled steel tube beams stiffened with V-shaped grooves. J. Constr. Steel Res. 2020, 166, 105930. [Google Scholar] [CrossRef]
  5. Al-Zand, A.W.; Badaruzzaman, W.H.W.; Tawfeeq, W.M. New empirical methods for predicting flexural capacity and stiffness of CFST beam. J. Constr. Steel Res. 2020, 164, 105778. [Google Scholar] [CrossRef]
  6. Han, L.H. Flexural behaviour of concrete-filled steel tubes. J. Constr. Steel Res. 2004, 60, 313–337. [Google Scholar] [CrossRef]
  7. Guo, L.H.; Zhang, S.M.; Wang, Y.Y. Experimental research and theoretical analysis on flexural behavior of high-strength concrete-filled square and rectangular steel tubes. Steel Constr. 2002, 6, 29–33. (In Chinese) [Google Scholar]
  8. Lu, H.; Han, L.H.; Zhao, X.L. Analytical behavior of circular concrete-filled thin-walled steel tubes subjected to bending. Thin Walled Struct. 2009, 47, 346–358. [Google Scholar] [CrossRef]
  9. Wang, R.; Han, L.H.; Nie, J.G.; Zhao, X.L. Flexural performance of rectangular CFST members. Thin Walled Struct. 2014, 79, 154–165. [Google Scholar] [CrossRef]
  10. Yu, C.J.; Zhang, Y.; Fu, G.Y.; Yan, D.; Li, S.P. Flexural behavior of concrete-filled rectangular steel tube beams with non-identical thickness flanges. J. Build. Struct. 2018, 39, 120–129. (In Chinese) [Google Scholar]
  11. Ahmed, A.A.; Hassan, M.; Masmoudi, R. Effect of concrete strength and tube thickness on the flexural behavior of prestressed rectangular concrete-filled FRP tubes beams. Eng. Struct. 2020, 205, 110112. [Google Scholar] [CrossRef]
  12. Han, L.H.; Lu, H.; Yao, G.H.; Liao, F.Y. Further study on the flexural behaviour of concrete-filled steel tubes. J. Constr. Steel Res. 2006, 62, 554–565. [Google Scholar] [CrossRef]
  13. Li, G.C.; Liu, D.; Yang, Z.J.; Zhang, C.Y. Flexural behavior of high strength concrete filled high strength square steel tube. J. Constr. Steel Res. 2017, 128, 732–744. [Google Scholar] [CrossRef]
  14. Masmoudi, R.; Abouzied, A. Flexural performance and deflection prediction of rectangular FRP-tube beams fully or partially filled with reinforced concrete. J. Struct. Eng. 2018, 144, 04018067. [Google Scholar] [CrossRef]
  15. Al-Shaar, A.A.M.; Göğüş, M.T. Flexural behavior of lightweight concrete and self-compacting concrete-filled steel tube beams. J. Constr. Steel Res. 2018, 149, 153–164. [Google Scholar] [CrossRef]
  16. GB/T 228.1-2010. Metallic Materials–Tensile Testing—Part 1: Method of Test at Room Temperature; Standards Press of China: Beijing, China, 2010. [Google Scholar]
  17. GB/T 50081-2019. Standard for Test Methods of Concrete Physical and Mechanical Properties; China Architecture & Building Press: Beijing, China, 2019. [Google Scholar]
  18. GB 50936-2014. Technical Code for Concrete Filled Steel Tubular Structures; China Architecture & Building Press: Beijing, China, 2014. [Google Scholar]
  19. AISC, 360–16. Specification for Structural Steel Buildings; American Institute of Steel Construction: Chicago, IL, USA, 2016. [Google Scholar]
Figure 1. Overall dimensions of concrete-filled steel box slabs: (a) Plan; (b) Elevation.
Processes 09 00649 g001
Figure 2. Cross-section of concrete-filled steel box slabs: (a) S-1; (b) S-2/6/7; (c) S-3; (d) S-4; (e) S-5.
Processes 09 00649 g002aProcesses 09 00649 g002b
Figure 3. An inside view of steel boxes: (a) S-4/7/6; (b) S-1/5/2/3.
Processes 09 00649 g003
Figure 4. Loading device and displacement meter arrangement: (a) Loading schematic; (b) Loading site.
Processes 09 00649 g004aProcesses 09 00649 g004b
Figure 5. Arrangement of the strain gauges: (a) Layout of top (bottom) measuring points; (b) Measuring points layout on the side.
Processes 09 00649 g005
Figure 6. Typical local buckling of specimens: (a) Outward local buckling of web; (b) Outward local buckling on top steel plate of S-6; (c) Outward local buckling on top steel plate of S-7; (d) Outward local buckling on top steel plate of S-4; (e) Outward local buckling on top steel plate of S-5.
Processes 09 00649 g006
Figure 7. The crushing of concrete in the compression zone on the top of the slabs: (a) S-2; (b) S-3; (c) S-6; (d) S-7.
Processes 09 00649 g007
Figure 8. The cracking and stud holes of concrete in the tension zone on the bottom of the slabs: (a) S-2; (b) S-3; (c) S-6; (d) S-7.
Processes 09 00649 g008
Figure 9. Typical deflection curves of the specimen S-2.
Processes 09 00649 g009
Figure 10. Moment versus mid-span deflection relationships.
Processes 09 00649 g010
Figure 11. Moment versus bottom surface strain of specimens.
Processes 09 00649 g011
Figure 12. Moment versus top and bottom surface strain of S-6.
Processes 09 00649 g012
Figure 13. Longitudinal strain distribution along the height at the mid-span of specimens: (a) S-1; (b) S-2; (c) S-4; (d) S-5.
Processes 09 00649 g013
Figure 14. The cross-section of the specimen.
Processes 09 00649 g014
Figure 15. The stress blocks of the specimen: (a) Concrete; (b) Steel.
Processes 09 00649 g015
Table 1. The main parameters of the seven specimens.
Specimen NumberL/mmB/mmH/mmt/mmStudStiffening Plate
S-122006002505NoNo
S-222006002505Φ8@200No
S-322006002505Φ8@400No
S-422006002505No5 mm
S-522006002505Φ8@2005 mm
S-622006002504Φ8@200No
S-722006002503.5Φ8@200No
Note: The stud used in this study is a 50 mm ribbed steel bar. The end of the stud was welded on the steel plate.
Table 2. Material properties of the steel plates.
Steel Plate Thickness t/mmYield Strength fy/MPaTensile Strength fu/MPaYield Strain/μεElastic Modulus/MPa
5 (4.62)453.3585.120412.22 × 105
4 (3.64)431.3565.719962.16 × 105
3.5 (3.47)428.5546.621971.95 × 105
Note: The numbers outside the brackets were the design value of the steel plate thickness, and the numbers in the brackets were the actual measured value of the steel plate thickness.
Table 3. Material properties of the concrete.
NumberFailure Load/kNCube Compressive Strength fcu/MPaAverage Cube Compressive Strength fcu/MPa
1745.533.133.7
2736.532.7
3791.935.2
Table 4. Moment capacities and the corresponding deflection.
SpecimenMe/kN·mΔe/mmMu/kN·mΔu/mm
S-1345.7 8.55 462.517.75
S-2325.28.79448.518.18
S-3320.78.65 456.417.81
S-4355.0 8.43 483.718.97
S-5337.8 8.10 465.418.01
S-6259.4 7.04 343.218.69
S-7196.9 6.66 323.623.99
Table 5. Comparisons of the test value and calculated value of the moment capacity of each specimen.
NumberMue/kN·mFormula (3)GB50936AISC
Muc/kN·mMuc/MueMuc/kN⋅mMuc/MueMuc/kN·mMuc/Mue
S-1462.5406.0 0.878 463.61.002 369.00.794
S-2448.5406.0 0.905 463.61.034 369.00.823
S-3456.4406.0 0.890 463.61.016 369.00.809
S-4483.7406.0 0.839 463.60.958 369.00.763
S-5465.4406.0 0.872 463.60.996 369.00.779
S-6343.2309.6 0.902 372.11.086 278.30.812
S-7323.6294.1 0.909 357.41.104 263.90.816
Mean value 0.885
0.0228
1.028
0.0476
0.802
0.0185
Standard deviation
Note: The average yield strength of steel (fy) and the average axial compressive strength of concrete (fc) were used to get the moment capacity of a selected member by using these formulas.
Publisher’s Note: MDPI stays neutral with regard to jurisdictional claims in published maps and institutional affiliations.

