Article

A Methodology for Industrial Water Footprint Assessment Using Energy-Water-Carbon Nexus

1
Department of Sciences and Engineering, University of Limerick, Castletroy, V94 T9PX Co. Limerick, Ireland
2
Central Solutions, Castletroy, V94 42P1 Co. Limerick, Ireland
*
Author to whom correspondence should be addressed.
Processes 2021, 9(2), 393; https://doi.org/10.3390/pr9020393
Submission received: 14 January 2021 / Revised: 9 February 2021 / Accepted: 10 February 2021 / Published: 22 February 2021
(This article belongs to the Special Issue Sustainable Manufacturing and LCA Tools for Industrial Sectors)

Abstract

:
Recent national government policy in Ireland proposes a radical transformation of the energy sector and a large reduction in CO2 emissions by 2050. Water and energy form the water–energy nexus, with water being an essential component in energy production. However, the connection between the production of energy and water is rarely made. In particular, the end-user processes are generally excluded because they occur outside the water industry. The present study includes two simple approaches for industrial sites to calculate their carbon footprint in the water sector. The assessment of the milk powder manufacturing using both approaches indicates that the combined emission factor of the water supply and treatment is approximately 1.28 kg CO2 m−3 of water. The dairy production among steel, textile, and paper industries appears to be the most carbon-emitting industry. However, the results show that the carbon intensity of the water supply and treatment can be minimized by the integration of renewable energy sources for the onsite heat/steam and electricity generation. The uniqueness of our approaches compared to calculations illustrated by the ecoinvent and other governmental databases is its simplicity and a focus on the main energy consuming manufacturing steps in the entire industrial process. We believe that the management of water and energy resources will be more efficient when “active water citizens” raise environmental awareness through promoting measures regarding data monitoring and collection, observed leaks and damages, dissimilation and exchange of information on sustainable water stewardship to public and various industrial stakeholders.

1. Introduction

Challenges related to global warming and climate change are very often associated with the reduction of car exhaust and power plant emissions. However, the connection between the production of energy and another important resource, water, is rarely drawn. The management of water and energy resources will profoundly affect the economic and environmental future due to the fact of climate change, sustainability, and other stressors. In recent decades, developments in industrial and domestic household water use and significant modifications to water-quality regulations and standards have greatly intensified the treatment and transport of water [1]. The relationship between water and energy, particularly the use of water for energy generation, is receiving greater attention because water-related energy use can account for nearly 5% of total greenhouse gas (GHG) emissions [2,3]. The proportion of GHGs related to water withdrawals and circulation is even higher in the UK, although there it is mostly associated with the end uses of water such as heating [4]. Adapting water management to meet increasing demand, regulatory standards, and the effects of climate change will require greater energy use [5,6]. Thus, finding a balance between energy use and limits for the GHG emissions will be a significant step in water management and planning.
Water and energy form the water–energy nexus that captures all aspects of water and energy interactions, i.e., “water for energy” and “energy for water”. Water is an essential component in energy production (cooling, hydroelectric or nuclear power, fossil fuel extraction and production of biofuel, solar fuel or hydrogen). Concurrently, energy can be also used in numerous processes for supplying, treating, and using water [7]. The energy intensity of water use (also called virtual or embedded/embodied energy) is defined as the total amount of energy, calculated on a whole-system basis, required for the use of a given amount of water in a specific location [8]. This calculation can vary considerably based on a number of factors. Among the most important aspects are the type and quality of the source water, the pumping requirements to deliver water to end users, the efficiency of the water system and the energy embedded by specific consumer end uses [9]. While energy sources other than electricity are occasionally used for water supply and treatment, 93% of water providers and 86% of wastewater treatment plants, respectively, receive 90% and 80% of their operating energy from electricity [10]. Some of the links to energy in the water sector are often overlooked, and confusion about results may arise through differences in the scope, methods of assessment, and the definition of boundaries. In particular, end-use processes are generally excluded because they occur outside the water industry (for example, residential heating of water) and also due to the commercial embargo on the data related to the end-use of water in the industrial sector [11]. The lack of studies assessing energy use and related GHG emissions in the whole water sector may be partly due to the absence of clearly defined boundaries [12].
The energy–carbon–water (ECW) nexus has been previously assessed using process-based, input–output (IO) hybrid, spatially explicit, multiregional hybrid, techno–economic life cycle analysis (LCA) approaches [13]. However, these LCA approaches present challenges in analyzing the ECW nexus due to the fact of its data-intensive characteristics, difficulty in evaluating the linkages among ECW nexus among regions, inability to capturing the dynamic interactions of the ECW nexus, and the high uncertainty of the results assessment using various boundary conditions [14]. The LCA method is a part of nexus relationships which have limitations in addressing normative aspects in resolving environmental goal conflicts [15]. Multicriteria analysis (MCA) runs short in addressing desirability aspects of trade-offs. However, MCA does not provide inter-temporal comparison leading to difficulties in finding a fully satisfactory answer in a carbon footprint assessment [16]. Backcasting scenarios describing normative aspects are used to examine paths to alternative futures taking into consideration desirability goal conflicts [17]. Thus, a comprehensive multi-target backcasting approach, which combines the MCA, nexus approaches and backcasting has the potential to ensure resilience and sustainability in a consistent long-term vision framework [18]. Overall, previous studies have demonstrated that the multi-target backcasting approach is a useful way to set system boundaries and to identify synergies and conflicts for management within these boundaries supporting a transition to zero GHG emissions [19].
The water industry is responsible for various carbon emissions that requires a significant amount of energy. The treatment of carbon-containing waste from the water industry can release a variety of emissions strongly affecting management of water systems, i.e., electricity generation. The water sector is responsible for about 4% of global electricity consumption [20]. Approximately 40% goes to water withdrawal, 25% to wastewater treatment (WWT), and 20% to water distribution [21]. By 2030, the International Energy Agency anticipates a 50% increase in the amount of energy consumed by the water sector due to the increased reliance on desalination, large-scale water transfer via pumping, and increased collection of wastewater [22]. The energy that is primarily used for pumping, transport, storage, etc., could be decarbonized by a careful balancing of energy generation from waste (methane in particular) and renewables sources, i.e., wind, solar, hydropower, etc. The emissions from the water industry may be divided into two-thirds derived from the operational energy use associated with treatment and pumping of water and the remaining one-third associated with the embodied carbon emissions relating to infrastructure maintenance and construction [23]. Emissions are categorized into direct, indirect, and supply chain-centric categories as shown in Table 1.
The indirect emissions (≈90%) associated with purchased electricity and greenhouse gas emissions that occur from the application of sewage sludge to land dominate over the direct emissions [23]. Therefore, the decarbonisation of the electricity supply (i.e., fossil-based or renewable source) has a very significant impact upon the water industry’s emissions profile in the water industry [25]. Greenhouse gas emissions can be calculated from the energy consumption or quantitative properties of gas composition, i.e., in wastewater treatment [26,27,28]. Additional potable water demand and wastewater generated can also contribute to greenhouse gas emissions that are calculated using emission factors for each source of emissions [28].
The carbon footprint of water usage is likely to grow for several reasons. Climate change is predicted to have numerous adverse effects on freshwater resources, reducing many available water supplies [29]. With water demand growing, water providers are increasingly looking to more remote or alternative water sources that often carry a far greater energy and carbon cost than existing supplies. In addition, the adoption of higher water treatment standards will increase the energy and carbon costs of treating the circulated water and wastewater. While the current magnitude of energy required to supply and treat water and wastewater is large, the carbon footprint can be reduced with: the (1) development of new technologies to reduce electricity demand; (2) use of renewable energies to balance energy generation and, concurrently, meet environmental regulations; (3) development of regulatory standards requiring lower levels of drinking water and circulating water in industry with cost and energy efficient wastewater treatment [30].
This work proposes a common assessment strategy for the carbon footprint of water on any industrial site. The analysis includes the validation of the footprint method using data from the literature for milk powder, steel, pulp and paper, pharmaceuticals, and textile production. Another objective of this work was to relate the carbon footprint assessment results with currently available local and EU policies and regulations. Therefore, a common strategy for the carbon footprint assessment of water will be suggested initially for industrial water users and further linked to the “problem-potential solution-future challenge”, referring to the policies and regulations of the Environmental Protection Agency in Ireland.

2. Materials and Methods

2.1. General Methodology

Water is used in just about every industry with notable consumption for manufacturing, processing, cooling, transporting substances, sanitation needs within a facility, incorporating water into a final product, etc. [31]. A sustainable water supply in industry involves limiting water use through efficient appliances and methods adapted to the particular industry. Recycling of water in industrial processes can provide a sustainable water supply for industry without straining municipal water supplies. However, industrial sites can also release organic water pollutants and produce waste during the treatment of water for consumption. This means that industry has a dual responsibility for internal sustainable water supply and the protection of external water supply sources. In the present work, the carbon footprint of water will be assessed using the correlation of water and energy. The industrial site will be graphically shown to indicate the main energy consumption units. Thus, the life cycle assessment will be performed using calculations based on academic literature data for milk powder production.
The carbon footprint can be calculated using the energy intensity and values on CO2 emission factor per 1 kWh as discussed previously [32]. The factors of generated CO2 emissions strongly depend on the energy source. When the carbon footprint for the water supply is calculated, it is important to understand if the energy source comes from fossil or renewable sources. The CO2 emissions using renewable energies are known to reduce the carbon footprint to zero making such water supply carbon neutral and, thus, will be considered as an alternative to fossil fuels in the present life cycle assessment [33,34].
The EU directives and regulations that play a significant role in the water management sector will be assessed to develop a roadmap towards establishing Ireland as a leader in the adoption of water stewardship. Various methods to integrate the European environmental agenda with the sustainable management of water in Ireland will be outlined and visualized using a three-circle model. The advantages of the “active water citizen” culture will be discussed and linked to the roadmap of water management using a planned national program.

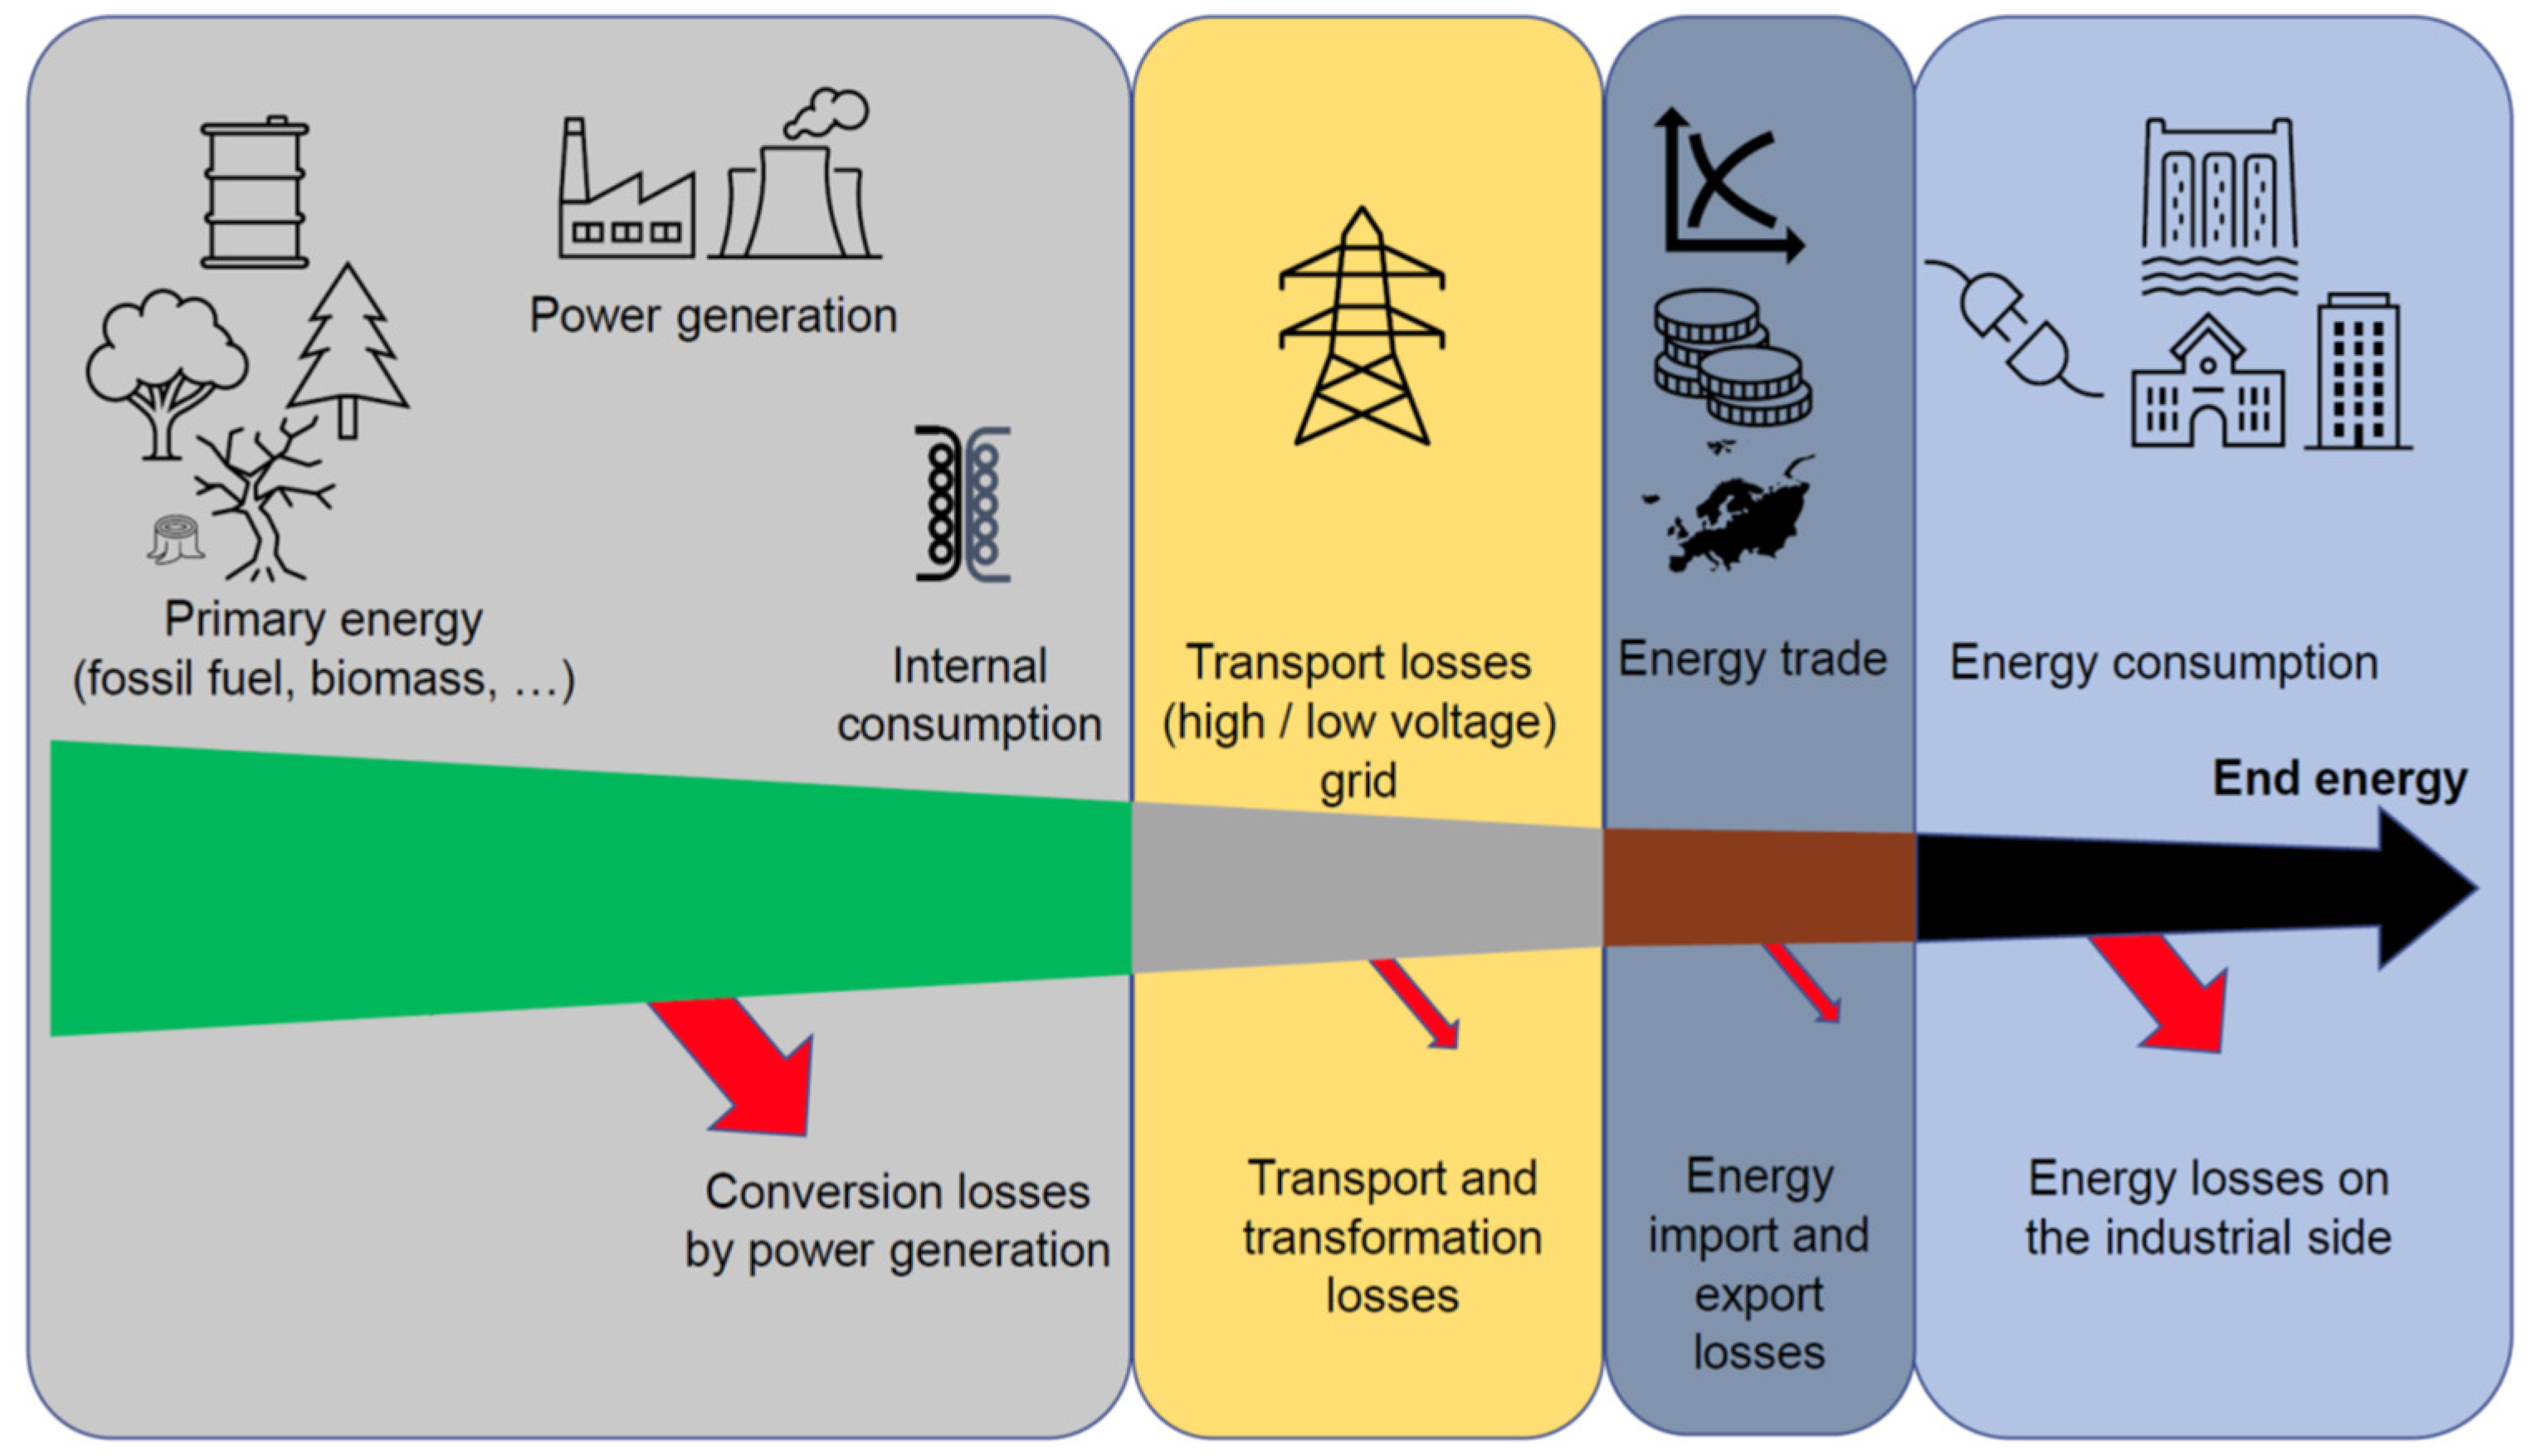
2.2. Energy Input Assessment

Accurate assessment of the energy inputs into the water supply, treatment, and consumption is important for carbon footprint calculations. The energy inputs of a typical water-use cycle can be broken down into five basic stages: abstraction, treatment, distribution, end user, and wastewater treatment. The energy intensity of each component of the water cycle can differ considerably, resulting in a wide variability of embedded energy values among water systems. The ranges of energy intensities for water use cycle segments are shown in Table 2.
Including wastewater treatment but not including end use, the energy intensity of municipal water supplies on a whole system basis can range from a low of 1050 kWh MG−1 to a hypothetical high, upwards of 36,200 kWh MG−1. For most utilities, energy use varies from 1250 to 6500 kWh MG−1 [4].
The water supply and conveyance energy uses carry the highest environmental burden—in most cases, consumed as electricity for pumping during abstraction and distribution [35]. During the water abstraction and conveyance, water utilities are forced to pump groundwater from deeper depths or inter-basin water transfers or desalination. Overall, water pumping represents about 80–85% of the total electricity consumption for surface water supplies and practically all electricity used for groundwater supplies. This suggests that relying on deeper wells, more remote surface supplies, and nontraditional water sources will significantly increase energy demands [36,37]. Moreover, the type, quality, and location of a water supply are the primary factors influencing the energy embedded in a water supply system.
In Ireland, the water supply mostly comes from fresh groundwater (25% of total water consumption) or surface sources such as rivers, lakes, or streams (75% of total water consumption) [38]. Other sources of water supply, which include desalinated seawater, brackish groundwater, and recycled wastewater, are used more in other EU countries and the US [39]. Table 3 provides generic estimates of the energy intensity for water supplies.
For water circulation on industrial sites, energy use can be reduced by the redesign and modification of pumping equipment. Previous studies have shown that the energy intensity for the pumping of groundwater/surface water (51 kWh MG−1) was three times less than that for water distribution (139 kWh MG−1) [40]. The EU countries which use desalination pretreatment for the water supply might account for a higher pumping demand than that for water distribution.
The energy intensity of wastewater treatment also depends on the pumping demands for wastewater collection as well as the level of treatment and size of the facility [41]. For most wastewater treatment plants, energy use ranges between 1000 and 3000 kWh MG−1 [42]. Wastewater treatment plants are often sited in order to utilize gravity fed wastewater collection to decrease pumping costs, because pumping wastewater is inherently more inefficient than pumping freshwater [43]. The energy intensity of treating wastewater (i.e., activated sludge from 2236 to 1028 kWh MG−1) increases with greater levels of treatment and decreases with scale (from 1 to 100 MGD). Water sources require treatment, usually consisting of chemical additions, coagulation and settling, filtration, and disinfection for the surface water disinfection [44]. Urban water suppliers typically use more energy intensive treatment methods of disinfection such as ozonation and ultraviolet radiation for health and safety reasons. In many groundwater systems, disinfection is the only treatment required. Physical–chemical processes are used only in those cases where excessive concentrations of specific constituents can be reduced. Overall, Table 2 shows that pumping during water abstraction, distribution, and wastewater treatment can account for the main fraction of input energy in the entire process. End-user energy demand varies from one industrial sector to another. Overall, the energy intensity for the regional, commercial, industrial, and institutional end use varies from 100 to 67,700 kWh acre foot−1 [45].

2.3. Limitations of Assessment

The present assessment of water supply and consumption is not focused on a specific type of industrial site. The aim of this work was to assess any industrial site using the proposed methodology. However, it is expected that agricultural end users including water use for irrigation has to be considered using other assumptions, which include accounting for the GHG emissions associated with the transportation of water over long distances. Globally, irrigation accounts for approximately 20% of the arable land area, but it can contribute to 40% of the global harvest [46]. Agricultural and dairy end users generally showed high water demand for crop production varying from 1372 to 41,759 MJ ha−1 [7,47]. The highest intensity of water use in irrigated agriculture is mostly allocated to water pumping and transport over long distances [48].

3. Results

3.1. Energy and Water Carbon Footprint Calculations

The electricity distribution from generation to consumption can be separated into steps, as shown in Figure 1. These steps include primary energy production through to power generation from the combustion of fossil or biofuels, further consumption of the energy at the power plant, transport losses, energy trade, and energy consumption by the industrial end user. In the present work, the primary energy sources, power generation, and internal consumption were considered as the first step in the assessment of carbon intensity.
Primary energy source: The used feedstocks and technology for the energy generation had a strong impact on the GHG emissions. The CO2 emissions from electricity generation declined in 2018. This was due to the general reduction of coal- and oil-generated energy and an increase in zero-carbon renewable energy, primarily wind energy generation, that produced 33% of all electricity in 2018 compared to just 7% in 2005 in Ireland. This emphasized the importance of the transition to the use of renewable feedstocks instead of fossil-based fuels.
Power generation: Energy used for transport was the largest emitter of CO2 emissions accounting for 40%, followed by the energy used for heat with a 33% share and electricity generation with a 27% emission share in Ireland. Fossil fuels are used to heat domestic households and industrial facilities. An SEAI report demonstrated that CO2 emissions increased by 8% in 2018, sharing 47% of CO2 emissions for domestic heat consumption and 21% for industrial use [49]. Even though the consumption of renewable energy in Ireland increased in the last decade, Ireland is considered a laggard in decarbonisation of its heating system, with the second lowest share of renewable energy used for heat in the EU. Generating electricity in traditional combined cycle gas power plants using coal, peat, or biomass has low efficiency [49]. The ESB’s Aghada station in Cork is one of the most efficient and cleanest generating plants in Europe with an efficiency of 58.5% [50].
Internal energy consumption: Primary energy generation includes a power plant’s own use of electricity, followed by the transmission and distribution losses at the power generation source. However, the internal consumption of energy in Ireland does not exceed 6% as recently reported [50].
Transport losses: Power losses occurring in the electric grid count the total split between the high, medium, and low voltage sections of the electric network. In Ireland, the electricity consumption emission intensity of 0.375 kg CO2 kWh−1 for 2018 was slightly higher than the electricity production emission factor 0.344 kg CO2 kWh−1 [49]. The difference between electricity emission intensity and electricity production factor can be explained by the transmission and distribution losses. The previous statistic report showed that less than 10% of transport losses are expected along the grid [50].
Energy trade: The carbon intensity of the electricity consumed depends on the carbon intensity and amount of electricity traded with the UK and other EU countries. Ireland was a net electricity importer. However, since 2016 Ireland became a net exporter of electricity and, thus, this aspect of electricity trade must be realistically represented in the life cycle assessment [51].
Energy consumption: The energy consumption encompasses the energy supplied to the industrial site, distributed at the facility and heat/cooling losses during the plant’s operation. Figure 1 illustrates that carbon intensity rises along the pathway, while available electricity decreases along the pathway with the electricity losses. The decreasing thickness of the arrow represents lower amounts of energy available and the darker color illustrates a “dirtier” mix meaning a higher carbon intensity of energy.
Figure 1. Carbon intensity of electricity from primary source production to consumption, based on work in Reference [52].
Processes 09 00393 g001

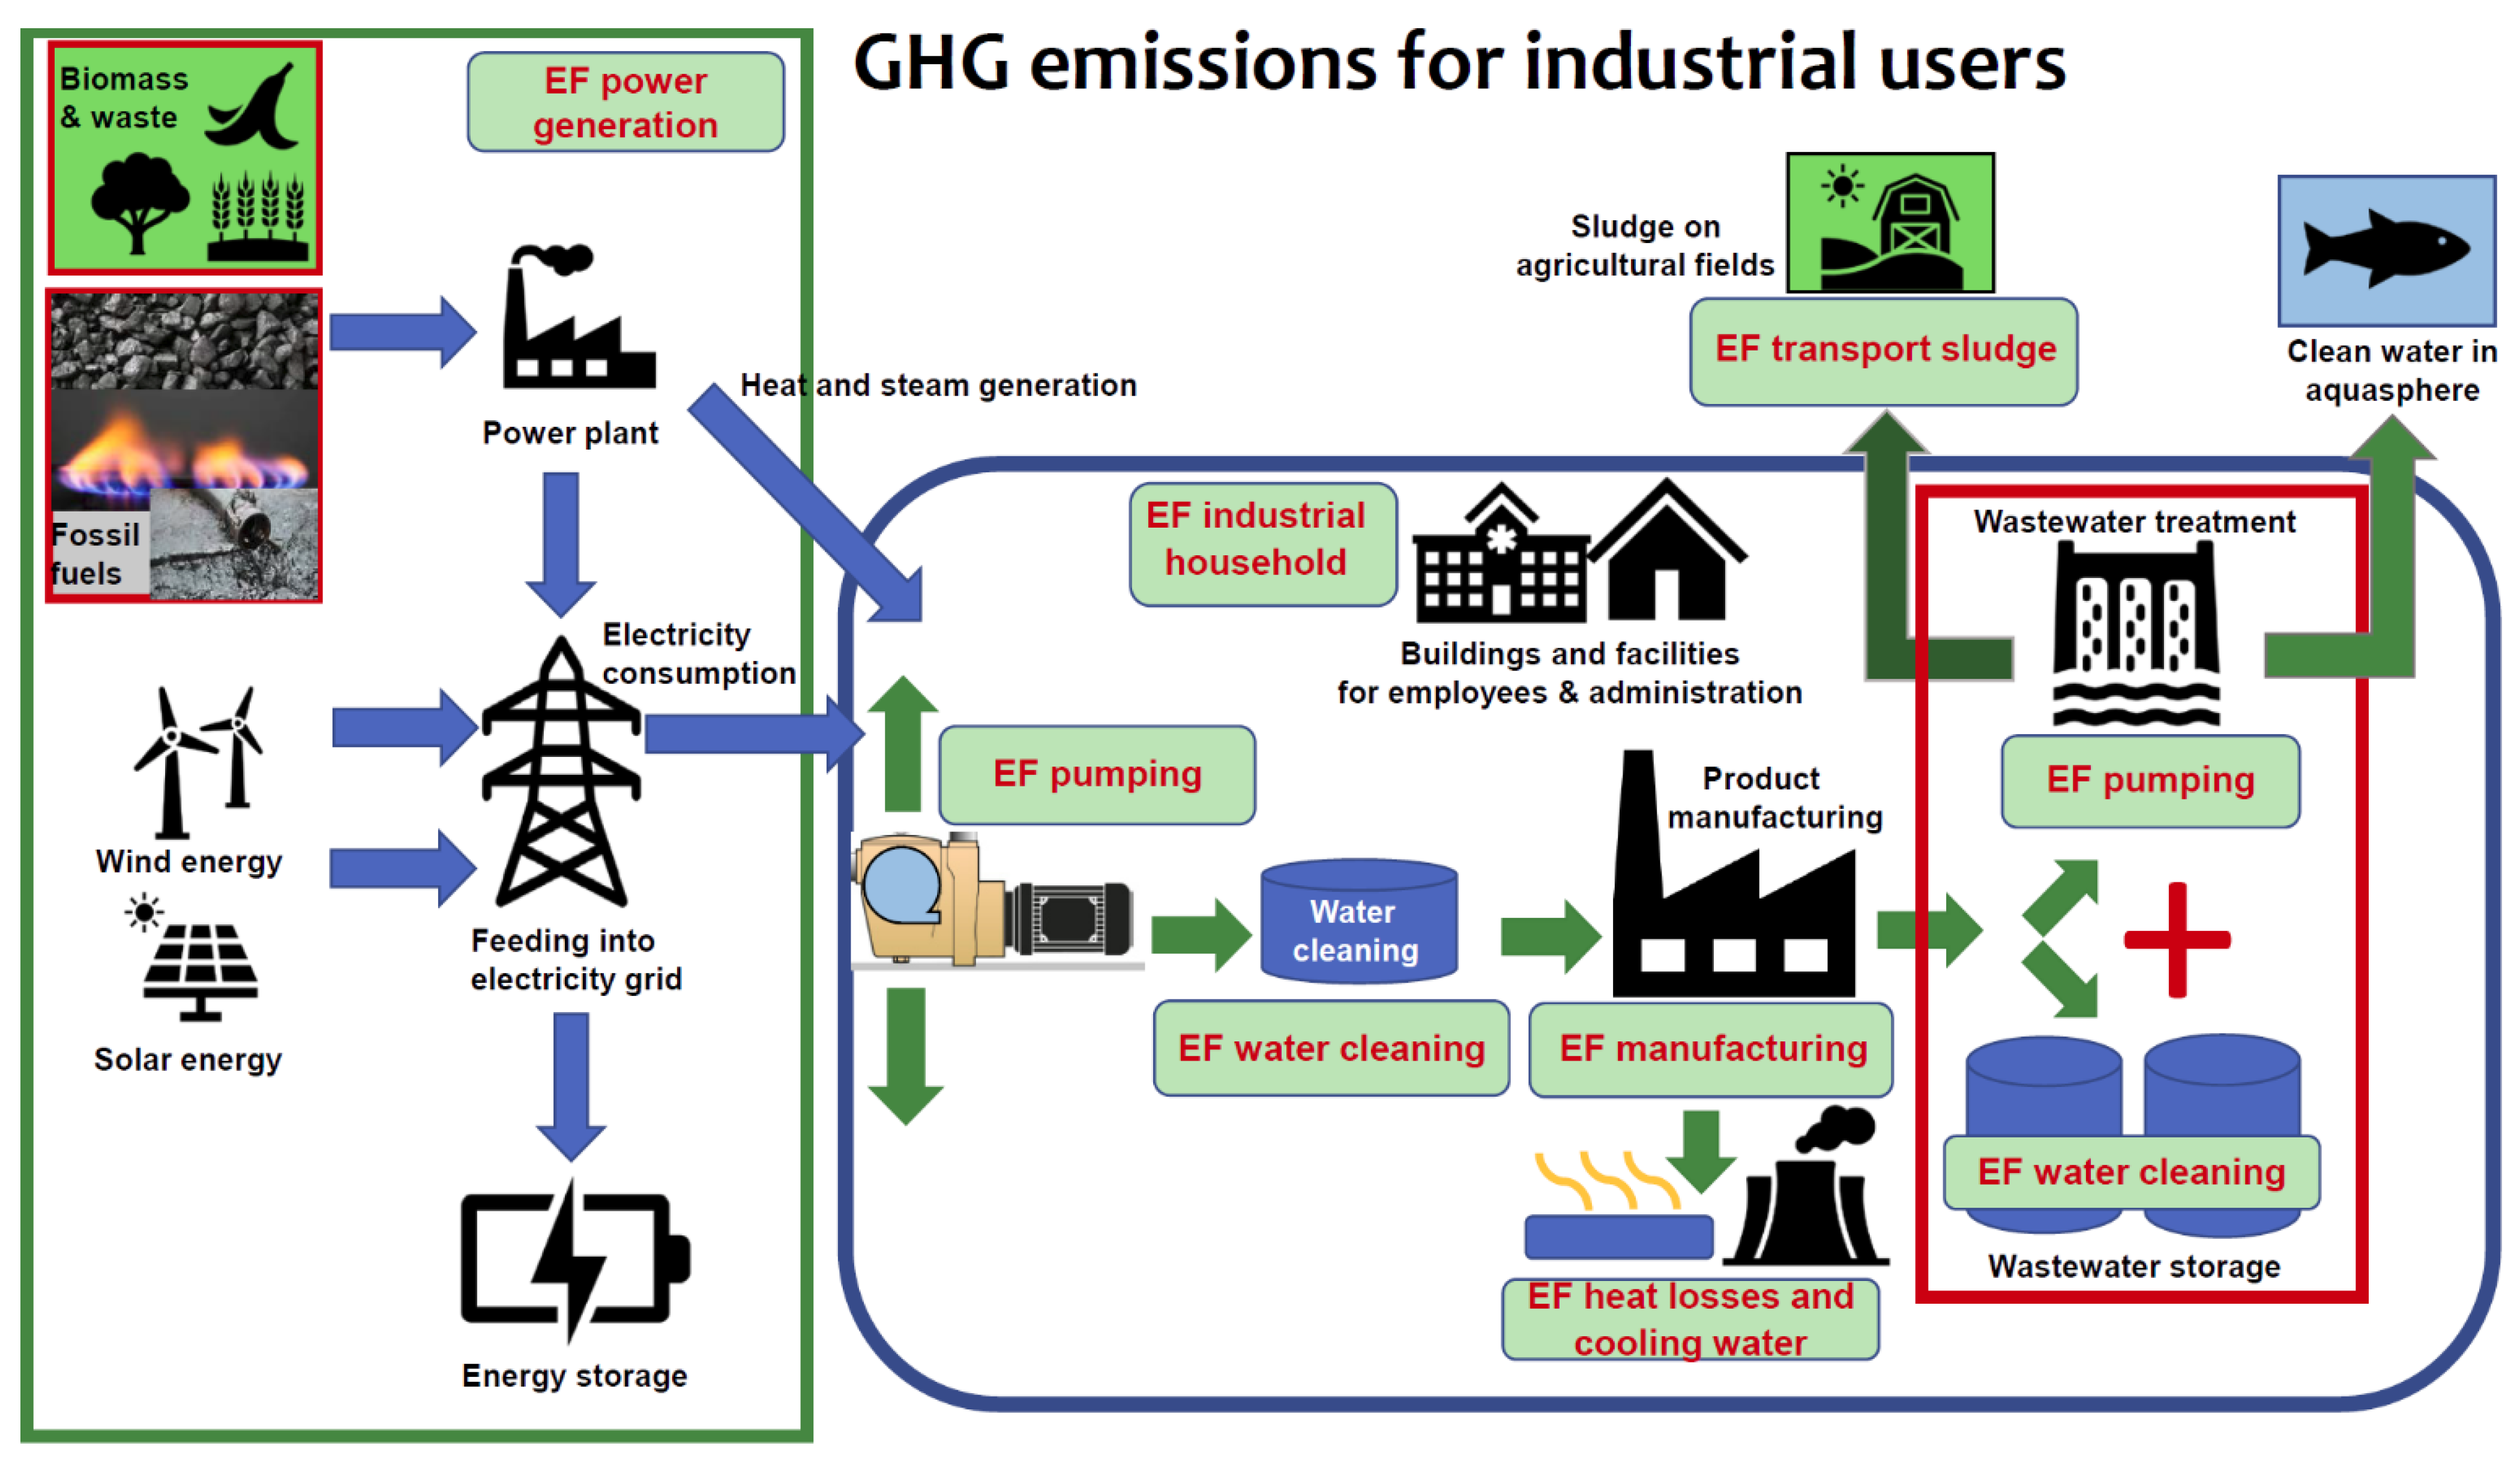
3.2. Energy–Water–Carbon Nexus for Industrial Users

An integrated approach to energy efficiency and GHG evaluation must be developed in order to reduce GHG emissions related to energy consumption during the operation of industrial pilot plants. The long-term aim is to improve the energy efficiency of water pumping systems, improve water efficiency (reusing treated wastewater), and generate energy from renewable resources such as solar energy, wind energy, and bio-related sources with the extension of energy storage facilities. The main operational stages of an industrial unit are shown in Figure 2.
The number of stages can vary from one type of industrial site to another. However, it was assumed that the main stages presented here were representative of many different industries, i.e., pharmaceutical, food, polymer processing. In agricultural product manufacturing, transportation of water from one production unit to another using different conversion factors for fuel should be considered in the GHG calculations. The assessment of GHG emissions was performed using six main sections of the water supply and use at the industrial pilot plant such as pumping, water used for administration/employees, cooling/heat losses, product manufacturing, cleaning of supplied water/wastewater, and transport of sludge to the agricultural field. Pumping and cleaning of water can be separated in two assessments: water supply to the plant including water distribution on the industrial site and wastewater pumping or discharge cleaning. The energy requirements are translated into GHG emissions using a conversion factor based on the electricity mix in Ireland (kg CO2 kWh−1). This allows industrial users to avoid any fluctuation in GHG emissions, attributable to local electricity supplies, and to allow for fair comparison between industrial plants regardless of their location nationally.
In this work, the carbon footprint assessment of water was performed on the industrial site using a product of energy emission factors with the recalculation factors from the 2018 SEAI report [49] and the UK DBEIS report [53] and excel document [54] as shown in Equation (1):
GHG emissions = activity × emission conversion factor
A company reports the emissions from the electricity it uses, which can be found by reading its electricity meters or gathering data from utility bills. The kWh electricity use is multiplied with the EFEnergy generated according to the updated status in the SEAI report [49]. The emissions associated with the energy generation can be converted to kg CO2 when the conversion factor is multiplied with the amount of generated energy. The emissions associated with the transmission and distribution of electricity must be summed with the FEnergy generated factor when the EFconsumed will be calculated.
It is especially important to consider the energy trade aspect when countries have high electricity imports. Companies can calculate the supplied electricity using Equation (2), according to Moro and Lonza [52]:
Esupplied = Enet − Epumping + Eimports − Eexports
The statistical data can be found in International Energy Agency (IEA) reports. The carbon intensity will be determined using Equation (2):
Carbon intensity = GHG/Esupplied
The consumption of energy can be taken from electricity meters at companies and recalculated using conversion factors as shown in Equations (2) and (3). It was shown previously that the carbon footprint in water technologies is dominated by the indirect emissions from purchased electricity [55]. The application of sewage sludge to land as a fertilizer results in indirect carbon emissions that have a significant impact on the water footprint. The emission factors for the post-manufacturing treatment of water/discharge were not calculated in the present work because they were assumed to be lower than emissions from electricity generation. However, when the detailed calculation of emission factors is required, transportation, storage facilities, employee’s meal, water circulation through the industrial buildings, etc., must be considered. In addition, the consumptive carbon intensity per unit of electricity at the industrial plant was not considered in the present work. To estimate the average consumptive water footprint for manufacturing/production, a sum of emission factors for operation, construction, and fuel supply at the industrial plant must be considered [56]. The company multiplies the water used (cubic meters/m3) by the appropriate year’s conversion factor called “water supply” to produce its emissions output. The company multiplies the volume of water disposed of via the drains (cubic meters/m3) by the appropriate year’s conversion factor called “water treatment” to produce its emissions. The conversion factors for water supply and treatment can be found in the excel UK DBEIS documentation [54].
  • EFWater_supply: 0.344 kg CO2e m−3
  • EFWater_treatment: 0.708 kg CO2e m−3
The emission factors should be multiplied by the amount of supplied and treated water at the industrial pilot plant. It is worth noting that these emission factors are reported in carbon dioxide equivalent that includes other GHGs such as methane.
Due to the gaps in data relating to upstream and downstream emissions for water treatment before and after it leaves the industrial site in Ireland, UK emission factors may be utilized due to the similarities in infrastructure and climate. Downstream treatment of wastewater in the UK water network has an emission factor of 0.708 kg CO2e m−3 [54]. Downstream emissions would be zero if the water was treated onsite and went straight into a river or sea. Similarly, the water supply was assumed to emit 0.344 kg CO2e m−3 if the water was sourced from the water mains in the UK, that is, having undergone treatment upstream before entering the industrial site [54]. A different factor would be required for sites that abstract their own water based on abstraction energy requirements. It should be noted that the UK reports its emission factors in CO2e, while Irish emission factors only account for CO2. However, this will have a negligible impact on the final results of this assessment due to the low amount of these additional gases released from fossil fuel combustion. In the present calculation, the conversion factor of 0.375 kg CO2 kWh−1 for generation of electricity in Ireland was used to calculate the emissions [49]. Conversion factors for onsite heat/steam vary in the range from 0 kg CO2 kWh−1 for renewables, e.g., biomass to 0.205 kg CO2 kWh−1 for natural gas and 0.341 kg CO2 kWh−1 for coal. Assuming combustion of fossil fuels onsite at an industrial site accounts for 61.86% of energy use at Irish industrial sites with a breakdown of 30.36% for natural gas, 19.82% for gas oil/diesel, 7.63% for renewables, and 4.05% for coal, the calculated conversion factor for onsite heat/steam in Ireland is 0.207 kg CO2 kWh−1. In addition, 2.1% of non-renewable waste was not included in this calculation [49]. However, there are several EU data libraries that provide data on conversion factors. This indicates that the selection of conversion factors must be based on the region where the emissions are calculated. In addition, no CO2 is emitted from renewable energy sources, i.e., wind and solar power [57]. For example, the national grid electricity emission factor in Ireland is 0.375 kg CO2 kWh−1 [49]. This is derived from the national energy mix of grid electricity in Ireland that includes wind and solar, which are correctly 0 kg CO2 kWh−1 but also includes coal, peat, natural gas, plus distribution, and transmission losses. If electricity was produced from renewable sources on-site, the emissions would be zero, but very little of this takes place in Ireland so it is negligible for our calculations.
The calculation of GHG emissions for the transportation of sludge that was separated from the wastewater is shown in Equation (4):
EFtransport_sludge = n/msludge × ρsludge × s × fuel consumption × fuel conversion factor
In Equation (4), msludge and ρsludge are mass and density of sludge, n and s are number of trucks and sludge transportation distance. For the sludge transportation, conversion factors will be selected based on the type of fuel used to tank a truck that carries sludge from the industrial unit to the agricultural field. The fuel conversion factors might be selected for petrol (2.31 kg CO2e l−1), diesel (2.69 kg CO2e l−1), and for biodiesel (0.17 kg CO2e l−1) [54]. The manufacturing unit at any industry will mostly consume the electricity for pumping [3,4]. However, drying, condensation, pelletizing, molding, and other processes will also require water use.
Thus, it is suggested to calculate the carbon footprint for the manufacturing unit using the sum of the electricity consumed for each production stage that varies from one industry to another as shown in Equation (5)
EFmanufacturing = EF1 + EF2 + EF3
Electricity demand for pumping was separated into two stages: water supply including distribution on the industrial unit and pumping related to waste water treatment. The emission factors are calculated for the assessment of pumping using Equation (6):
EFpumping,i = conversion factor × power consumption/flow rate × number of pumps
The electricity demand for the wastewater processing consists of wastewater cleaning and pumping through all industrial stages of the water discharge recycling. Wastewater processing is related to the addition of chemicals to clean the water and separate the contaminants as a sludge that can be further used on agricultural fields. The cleaning of wastewater is calculated in Equation (7):
EFcleaning,i = chemicals/sludge × power consumption/flow rate × conversion factor
The process heat losses can contribute to GHG emissions in the water sector that can be calculated using the first law of thermodynamics as shown in Equation (8):
EFheat_loss = mwater × ΔT × cp/Vwater × conversion factor
In Equation (8), mwater and Vwater are mass and volume of water, ΔT is the difference between ambient and process temperature. The emissions generated by the number of employees and administration (p) for the personal needs (i.e., hands cleaning, food preparation, sanitation use) are calculated using Equation (9):
EFpersonal = energy consumption/personal water consumption/p × conversion factor
The proposed calculation for the GHG emissions on industrial sites can be easily conducted when the companies know their water and energy consumption and use national databases for the selection of conversion factors. Equations (1)–(9) form a step-by step template to guide calculation of emissions for any industrial site.

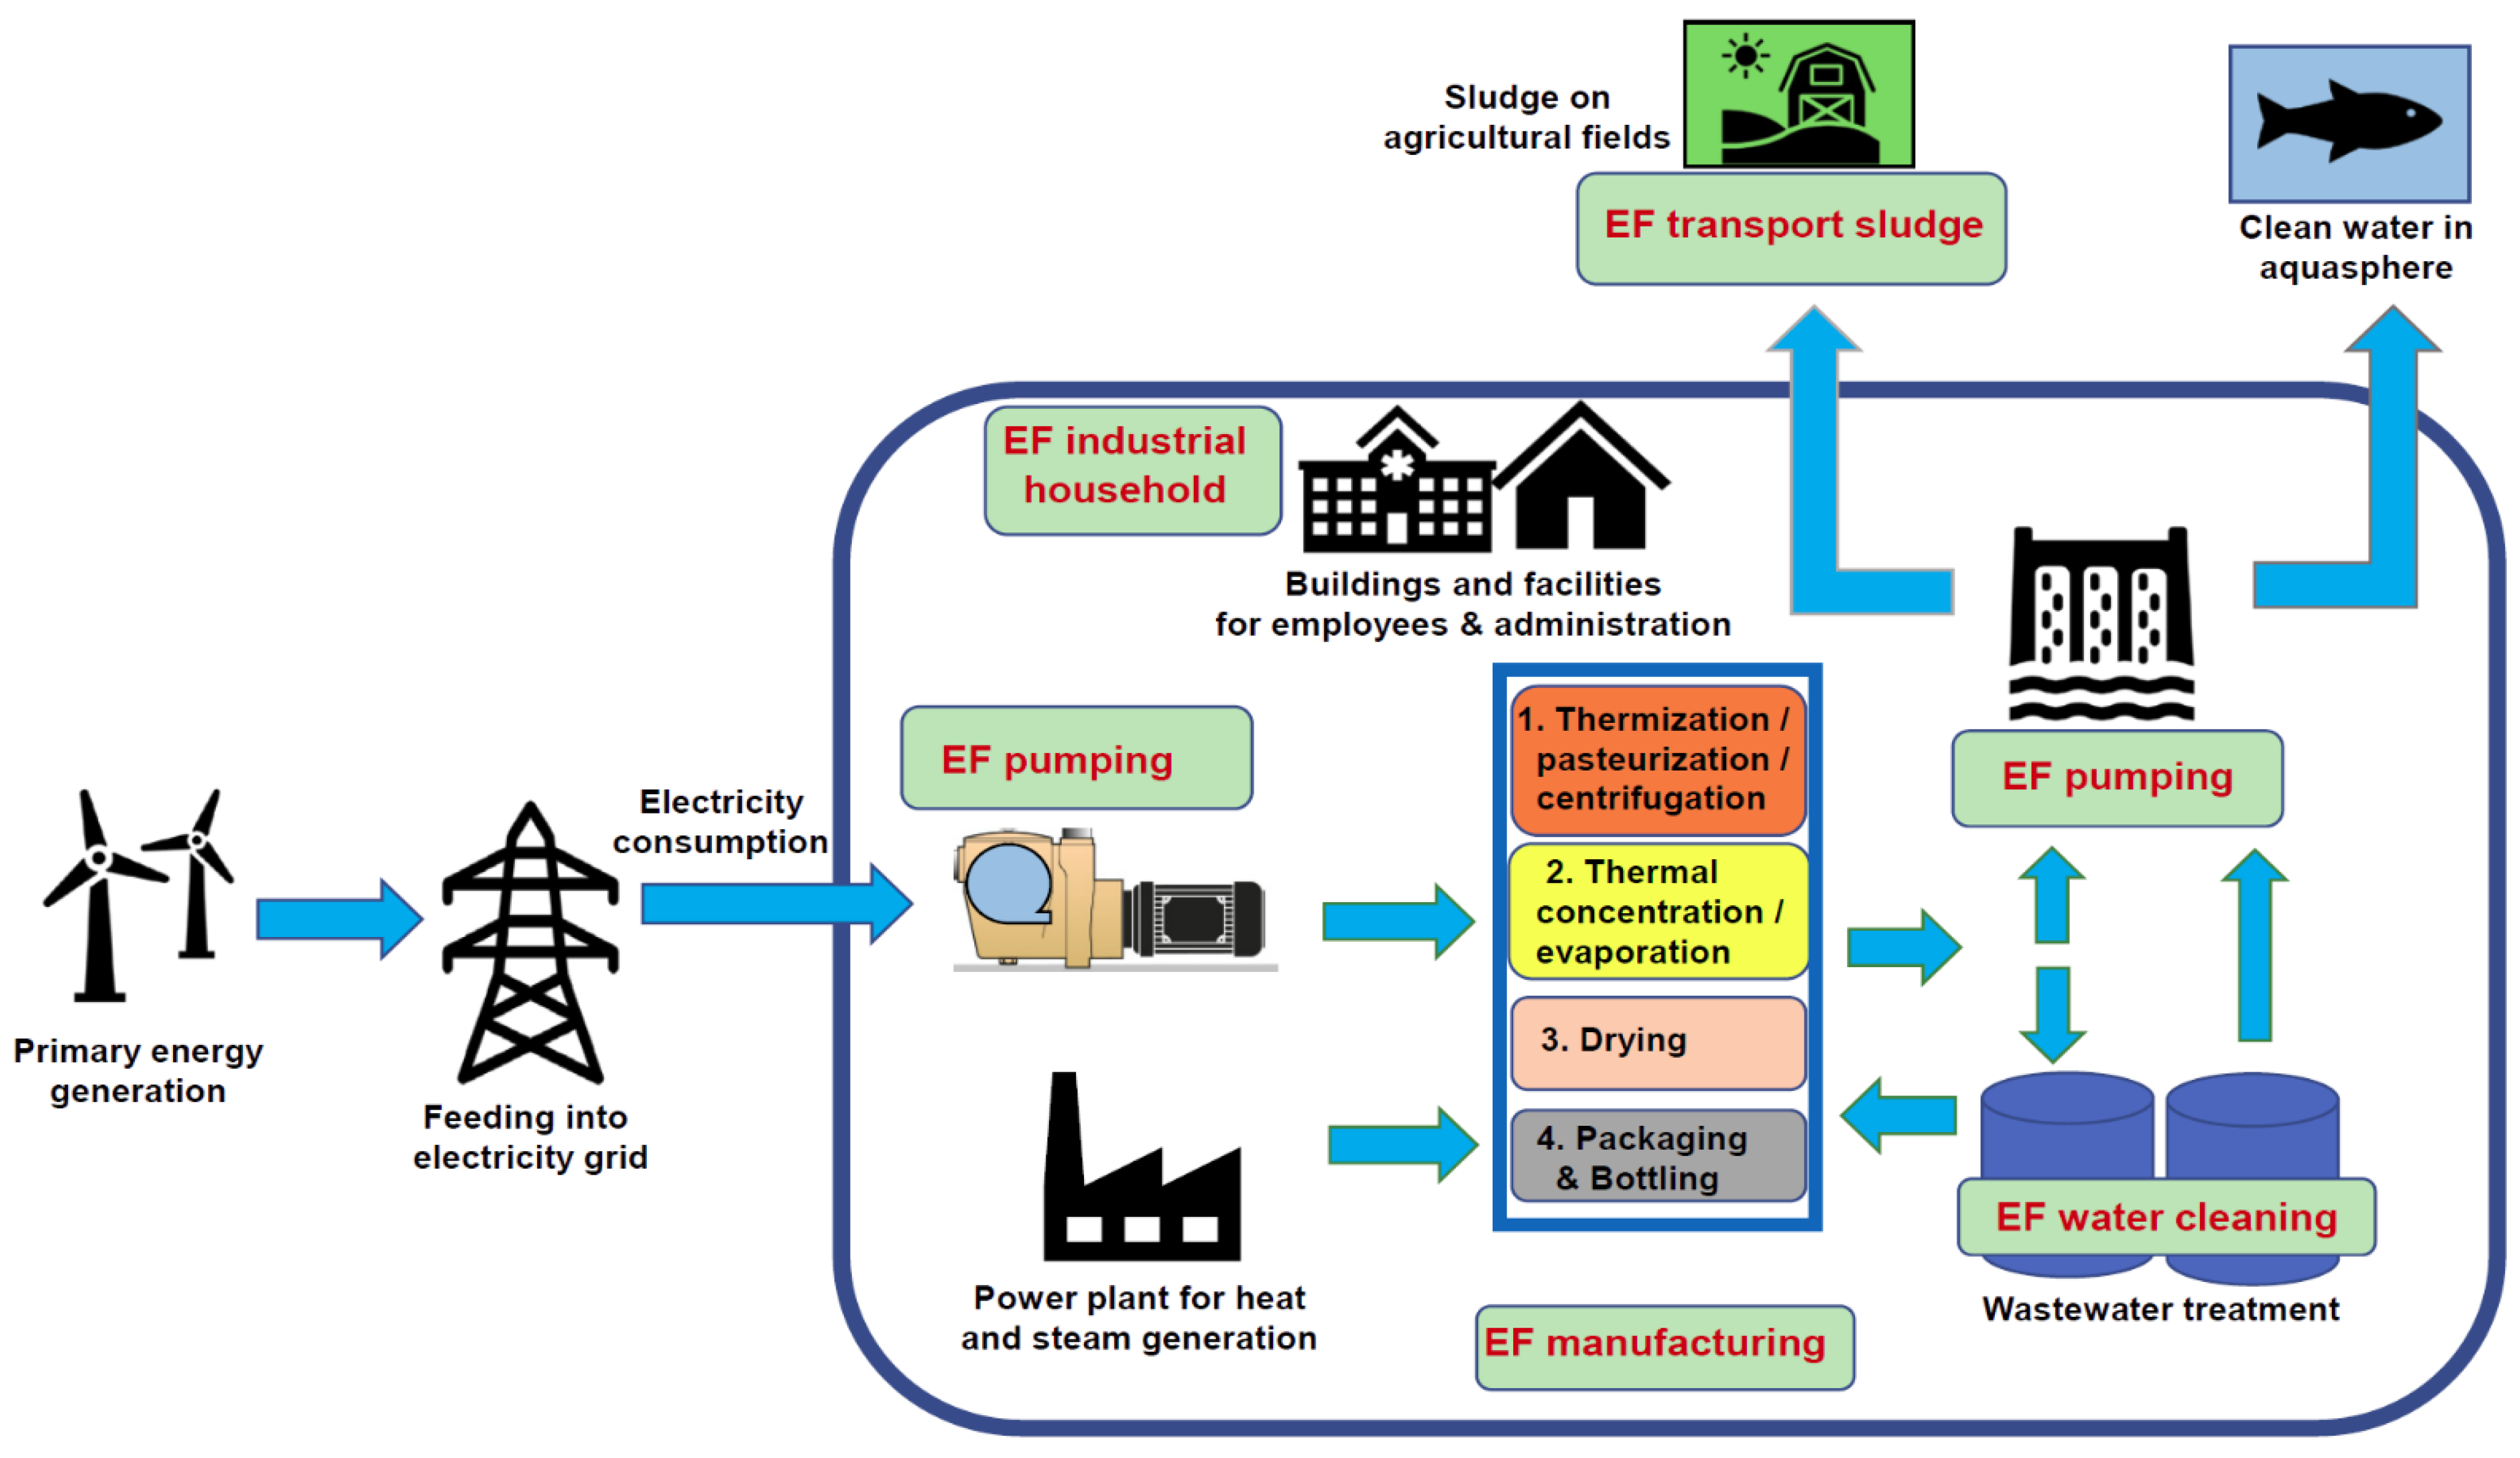
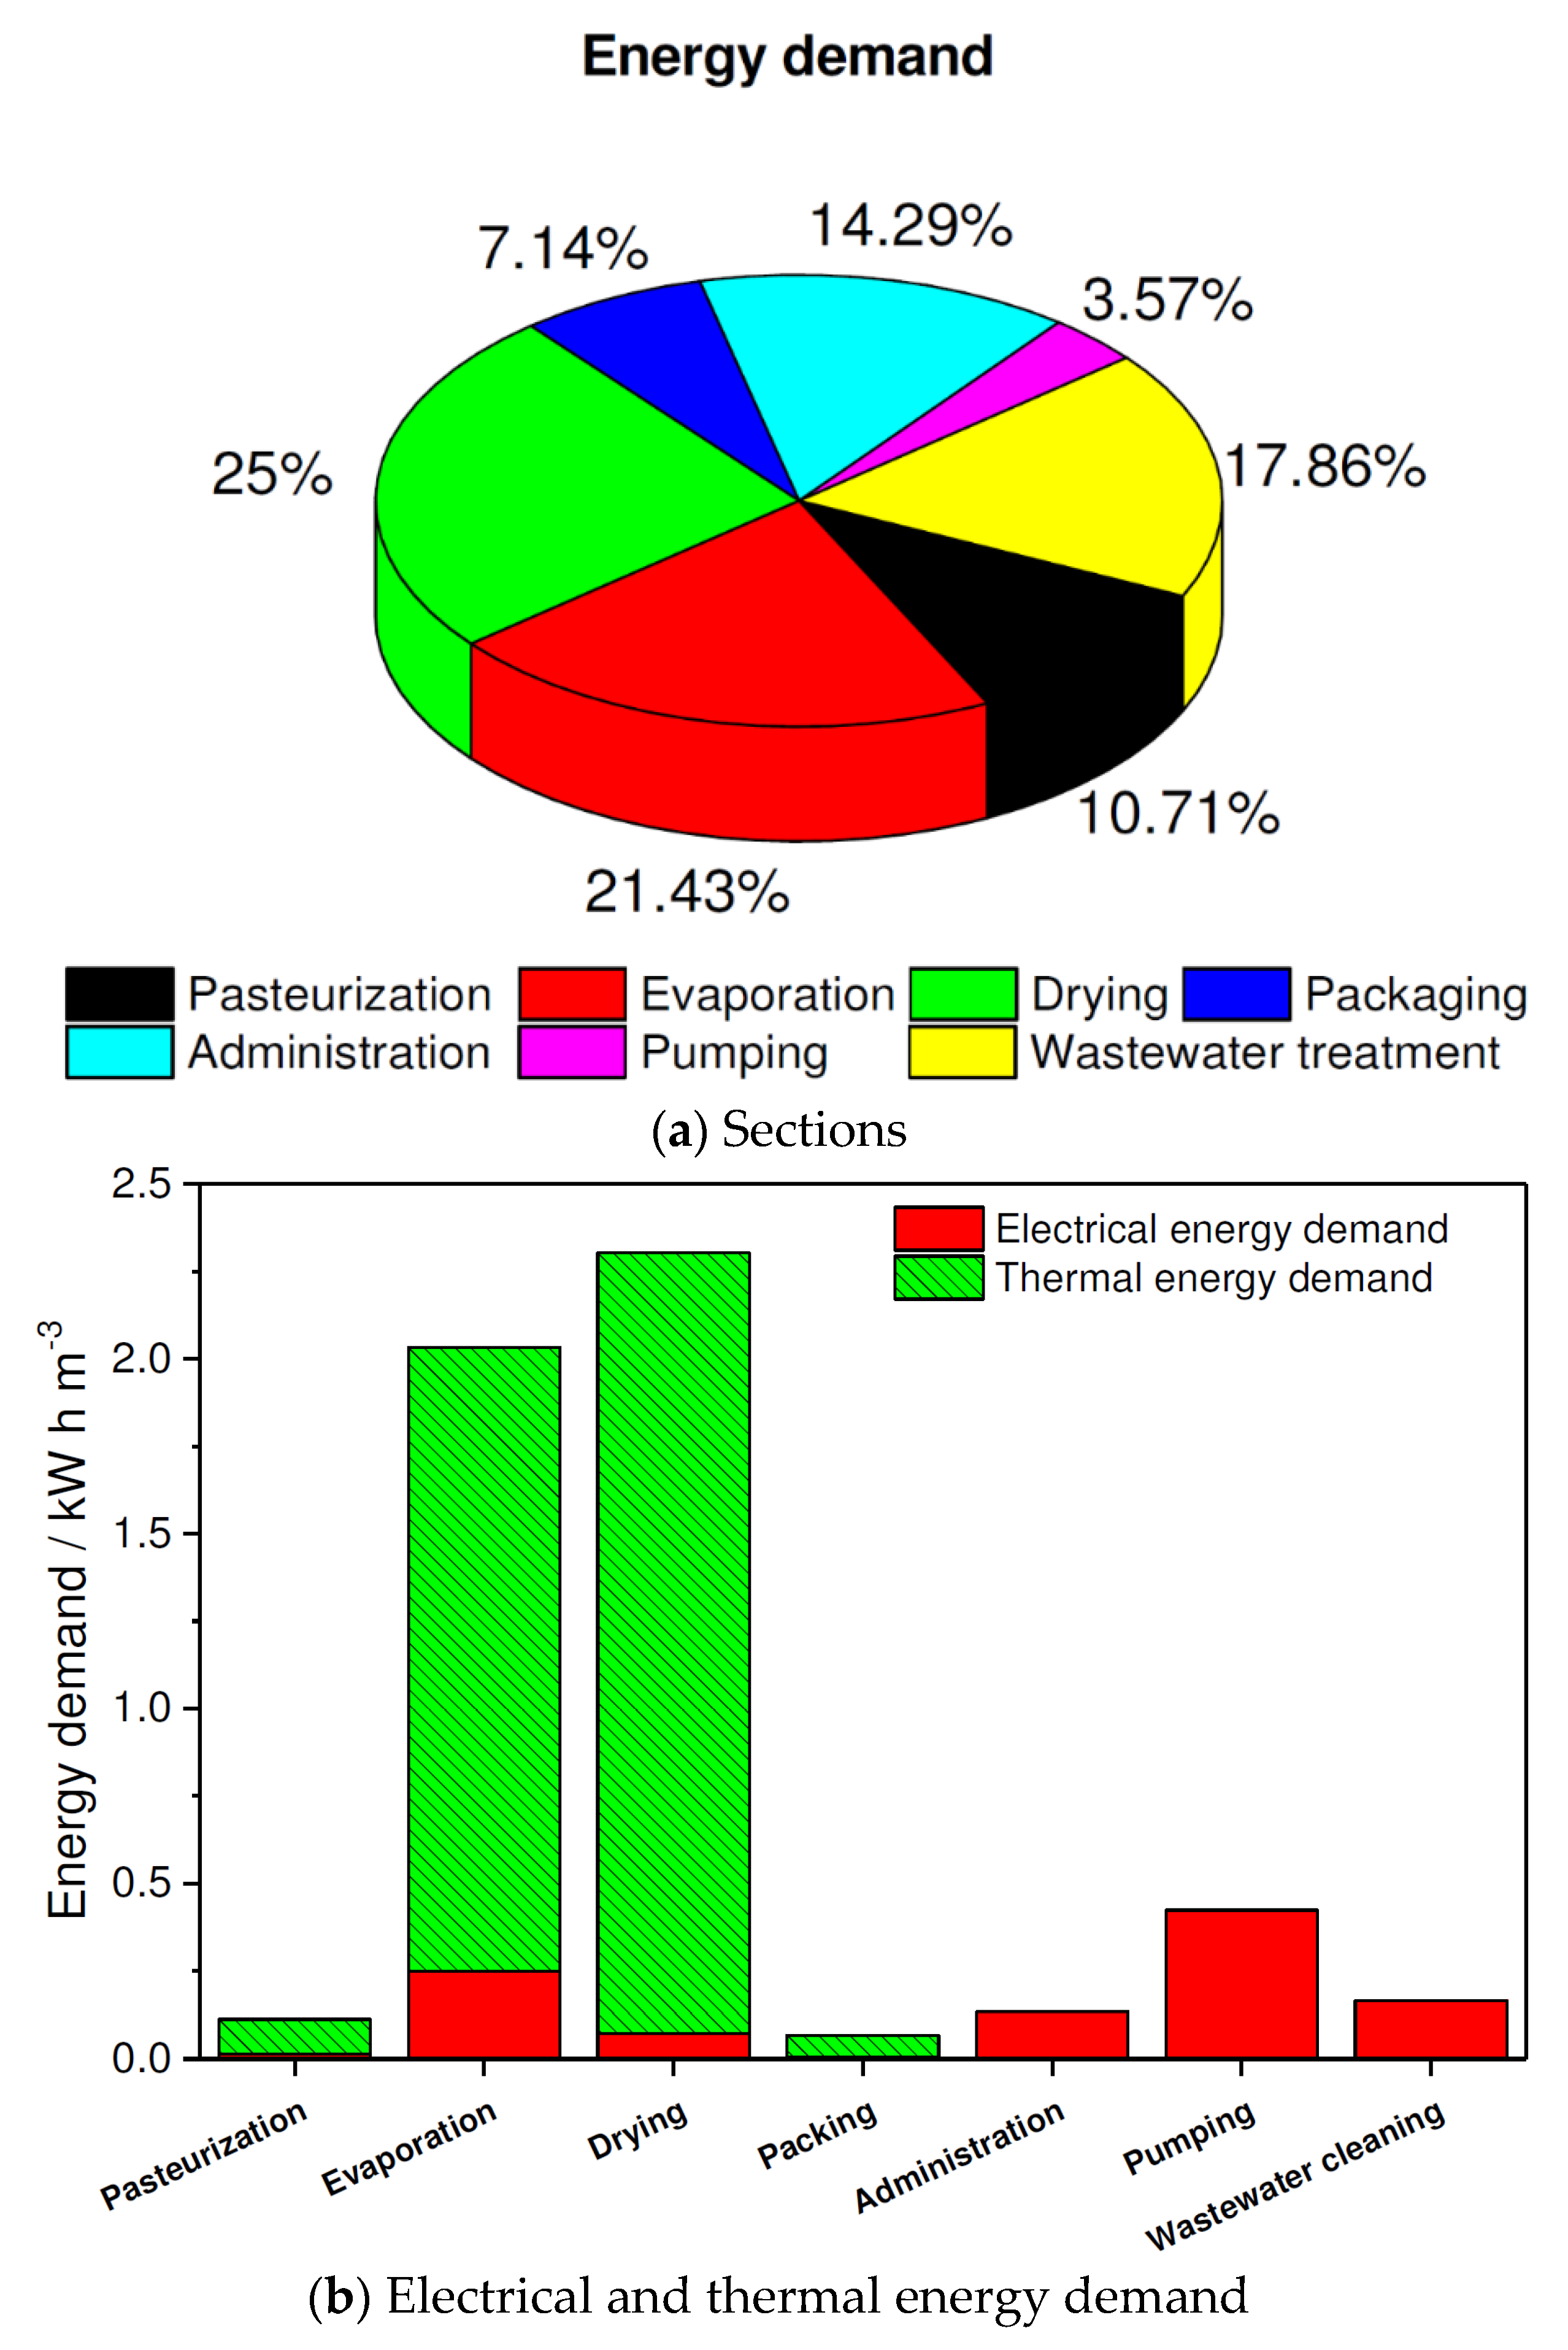
3.3. Carbon Footprint Assessment Using a Case Study

Carbon footprint emissions in the water supply and treatment are calculated for steel, healthcare, textile (cotton) and paper/pulp industries as shown in Table 4. The results show the calculated emissions for the water supply in steel and textile production which were estimated to be below the recommended emissions levels in the UK DBEIS protocol. A simple methodology to estimate the emission factors was introduced using data on consumed water and electricity. The carbon footprint calculated for the healthcare industry (Novartis, Switzerland) and milk powder manufacturing was higher than the carbon footprint determined for all other industries. The emission factor calculated for the wastewater treatment plant in the paper and pulp industry was below the limits reported in UK DBEIS protocol [53]. Similar calculations can be carried out by any industrial site to estimate the carbon footprint of the water supply and water treatment.
Table 4 shows a simple methodology for the emissions assessment of various industrial sites, whereas Table 5 uses a more complex strategy to estimate emissions on the milk dairy plant. The supply chain of the milk dairy system is shown in Figure 3.
This includes all stages involved in the life cycle assessment using Equations (4)–(9).
The dairy sector includes liquid milk, milk powders, cheese, butter, yogurt, and ice cream [63]. Typical dairy production combines the manufacturing of powdered milk, cheese, and whey plant [62]. However, the life cycle assessment of the dairy plant is based on the assumption that only milk powder is produced, whereas the emissions generated at farm facilities for liquid milk production were not considered in the present study. The present milk dairy plant was designed as water-efficient facility with the average water consumption of 0.6 m3 per 1 m3 of liquid milk and total energy demand of 0.89 GJ pro kg of the powdered milk with the energy recovery of up to 94% [67,68]. For the production of 1 kg of powdered milk, 8.5 L of liquid milk is consumed [69]. The heat was provided by the onsite thermal facility and the electricity was externally delivered to the powdered milk manufacturing plant. The system’s boundary includes only activities related to the manufacturing stages where fresh water supply was used. This includes pumping, powdered milk production unit (thermisation/pasteurisation/centrifugation; thermal concentration/evaporation; drying; packing and bottling); administration and wastewater treatment [70].
Figure 4a illustrates the calculation of the energy demand for each manufacturing stage. The energy demand is separated into thermal and electrical energy consumption for all manufacturing steps as shown in Figure 4b. Overall, thermal energy is a major component of the direct energy consumed in the manufacturing of the powdered milk; it is at least four orders of magnitude higher than electricity as discussed previously [71]. The energy requirements for the manufacturing of the powdered milk, packaging, and administration are less than 20%, which is significantly less than the liquid milk production on farm varying from 80% to 86% [72]. The evaporation and drying processes require a higher energy demand than pasteurisation and packaging as reported previously [62,73]. Evaporation and pasteurisation require steam for heating; furthermore, steam is used to generate hot water for cleaning and sterilisation [74]. Spray drying is energy intensive process because of the convective heating but has a better energy efficiency than the drum drying. The water use on the industrial site is considered to remain unchanged from pumping to powdered milk manufacturing. This means that 0.6 m3 of freshwater per 1 m3 of liquid milk is equally used for cleaning and sterilisation in powdered milk manufacturing. The flow rate of wastewater is assumed to be 13.7 m3 per ton of powdered milk which is higher than the flow rate of freshwater. Cooling water, chilled water, and process water used in powdered milk manufacturing is not included in the assessment because it is recirculated in the closed loop without giving any input to the discharge in the wastewater unit. In milk powder production, indirect heating is used, except for cleaning [75]. That means that the condensate is brought back to the boiler, and be reused in a closed-loop system, resulting in very low water loss [74]. The life cycle analysis includes only process stages that have an impact on the quality of freshwater leading to the formation of discharge. It was assumed that the largest fraction of the supplied freshwater is used for the cleaning and sterilisation of the manufacturing stages [70]. Therefore, the energy demand in the water footprint assessment is calculated under the assumption that the freshwater is used for steam generation in cleaning and sterilisation operations. It is important to note that for powdered milk production, water input comes not only from the water supply but also from the wastewater treatment plant. The energy consumption at the wastewater plant is assumed to be only electrical with the average chemical dosage of 90 g per kg of product forming 2.4 kg sludge per m3 of treated wastewater.
The transportation of sludge was not calculated in the present assessment because the powdered milk manufacturing is a low sludge production facility. The water footprint from activities of administration and employees was estimated using the total water and energy demand for the water heating and sanitising purposes [75]. The input parameters were taken from the literature [49,54,62,67,68,69,70,71,72,73,74,75]. The results of the life cycle analysis are summarised in Table 5.
The emission factors for evaporation, drying, and pumping were higher than for administration and wastewater treatment. The lowest emission factor was calculated for the packaging, as significantly lower water quantities are required than decades ago [71]. The highest emission factor was calculated for water pumping, where mostly all water pumped was freshwater. This is because the energy demand in the current water footprint calculation was significantly reduced due to the less energy required for the manufacturing of milk powder than is presented in the literature. In the present work, the process water used in the closed loop process without significant impact on the emissions in the wastewater treatment plant were outside of the studies scope. However, the energy demand for the water pumping remained in range 5% to 14%. The previous work demonstrated that the major processes using only electricity consume 31% for cooling, 23% for water heating, 20% for milking, 5% for water pumping, 3% for lighting, and 18% for miscellaneous processes such as housing systems, air compressors and backing gates [76,77]. Therefore, during normalisation of energy demand using only electricity, the emission factor for the pumping was calculated to be 0.159 kg CO2 per m3 of water. The total emission factor calculated as a sum of the emission factors of various steps in the milk powder manufacturing was lower than the emission factor resulting from a simple calculation in Table 4. This is because the simple calculation assumes that only electrical energy is used in the emission factor estimation, whereas both thermal and electrical energy demands were considered in the complex calculation using Equations (4)–(9). Overall, the total emission factor calculated for milk powder production (1.28 kg CO2 m−3) was over the limits reported in UK DBEIS protocol for the wastewater treatment (0.708 kg CO2 m−3) [54]. The conversion factor for onsite heat/steam and electricity generation had a significant impact on the total emission factor. Combustion of fossil fuels or use of electricity generated from nuclear power plants can lead to the increase in conversion factors. Therefore, the use of renewable energy sources for the onsite heat/steam and electricity generation is an option for decreasing the carbon footprint in the water supply and treatment.
The uniqueness of the presented approach compared to previous studies [62,63,64,65,66] is its simplicity and focus on the main energy consuming manufacturing steps in the industrial process. Both presented calculations indicated a gap in the available research on the water footprint assessment in the industrial sector. The combination of data from powdered milk production indicates that the process of data collection and processing is one of the obstacles for the evaluation of results from ecoinvent databases. The need to establish a database for water footprinting was underlined by the International Organisation for Standardisation [78]. However, no synchronised database has been created that allows to dynamically assess water use within the LCA framework [79]. Considerable differences between the ecoinvent database versions call for the development of novel LCA approaches to assess the water footprinting worldwide [80]. The introduction of new modeling principles and LCA approaches can simultaneously improve the quality and quantity of existing data for the global coverage of activities and their geographically consistent linking. The present results showed that the evaluation of the same powdered milk manufacturing facility can provide scientists with various data. This is due to the different assumptions of individuals and dynamic changes in the industry leading to integration of new cleaning technologies and measurement techniques. Overall, the authors believe that their findings can be used for the improvement of existing ecoinvent databases by proving a new scenario in the operational LCA assessment. This study shows that both approaches can be used in a combination of different strategies for the development of multi-target backcasting scenarios.
Dairy processing uses a significant amount of water for processing and cleaning. Different ways to assess the water footprint indicate that a general approach for industrial sites on how to assess the emissions coming only from water use has not been developed. The water footprint assessment in the industry requires more precise water usage data at each manufacturing step and the energy demand used in the water-related operations which might contribute to the discharge. The precise monitoring of the water and energy demand can decrease the process cost. The optimisation of flow and process control, reduction of leaks, integration of low water usage technology and replacement of fossil-based energy sources with renewable energy are strategies to reduce water and energy demand on the industrial site. However, one of the main components for successful parameter monitoring is the involvement and support of operational staff. The water conservation can be encouraged by forming a water management team to promote awareness of water efficiency using regular discussions with other staff members. Staff awareness and motivation in water conservation can significantly support the data collection and processing. To facilitate industrial sites on their transition toward more efficient water management, there is a need to overcome the common misconception that water saving measures do not offer high monetary value savings.
By showing the interconnections between water and energy, this paper highlighted that the true cost savings resulting from more efficient water use also translates into additional energy savings that could stimulate a more water conservative culture within the organisation. The active engagement of staff in the challenges related to water conservation and concurrent integration of efficient technology will establish a platform of guidelines for a transformation of societal opinion on the sustainable use of water in industry.

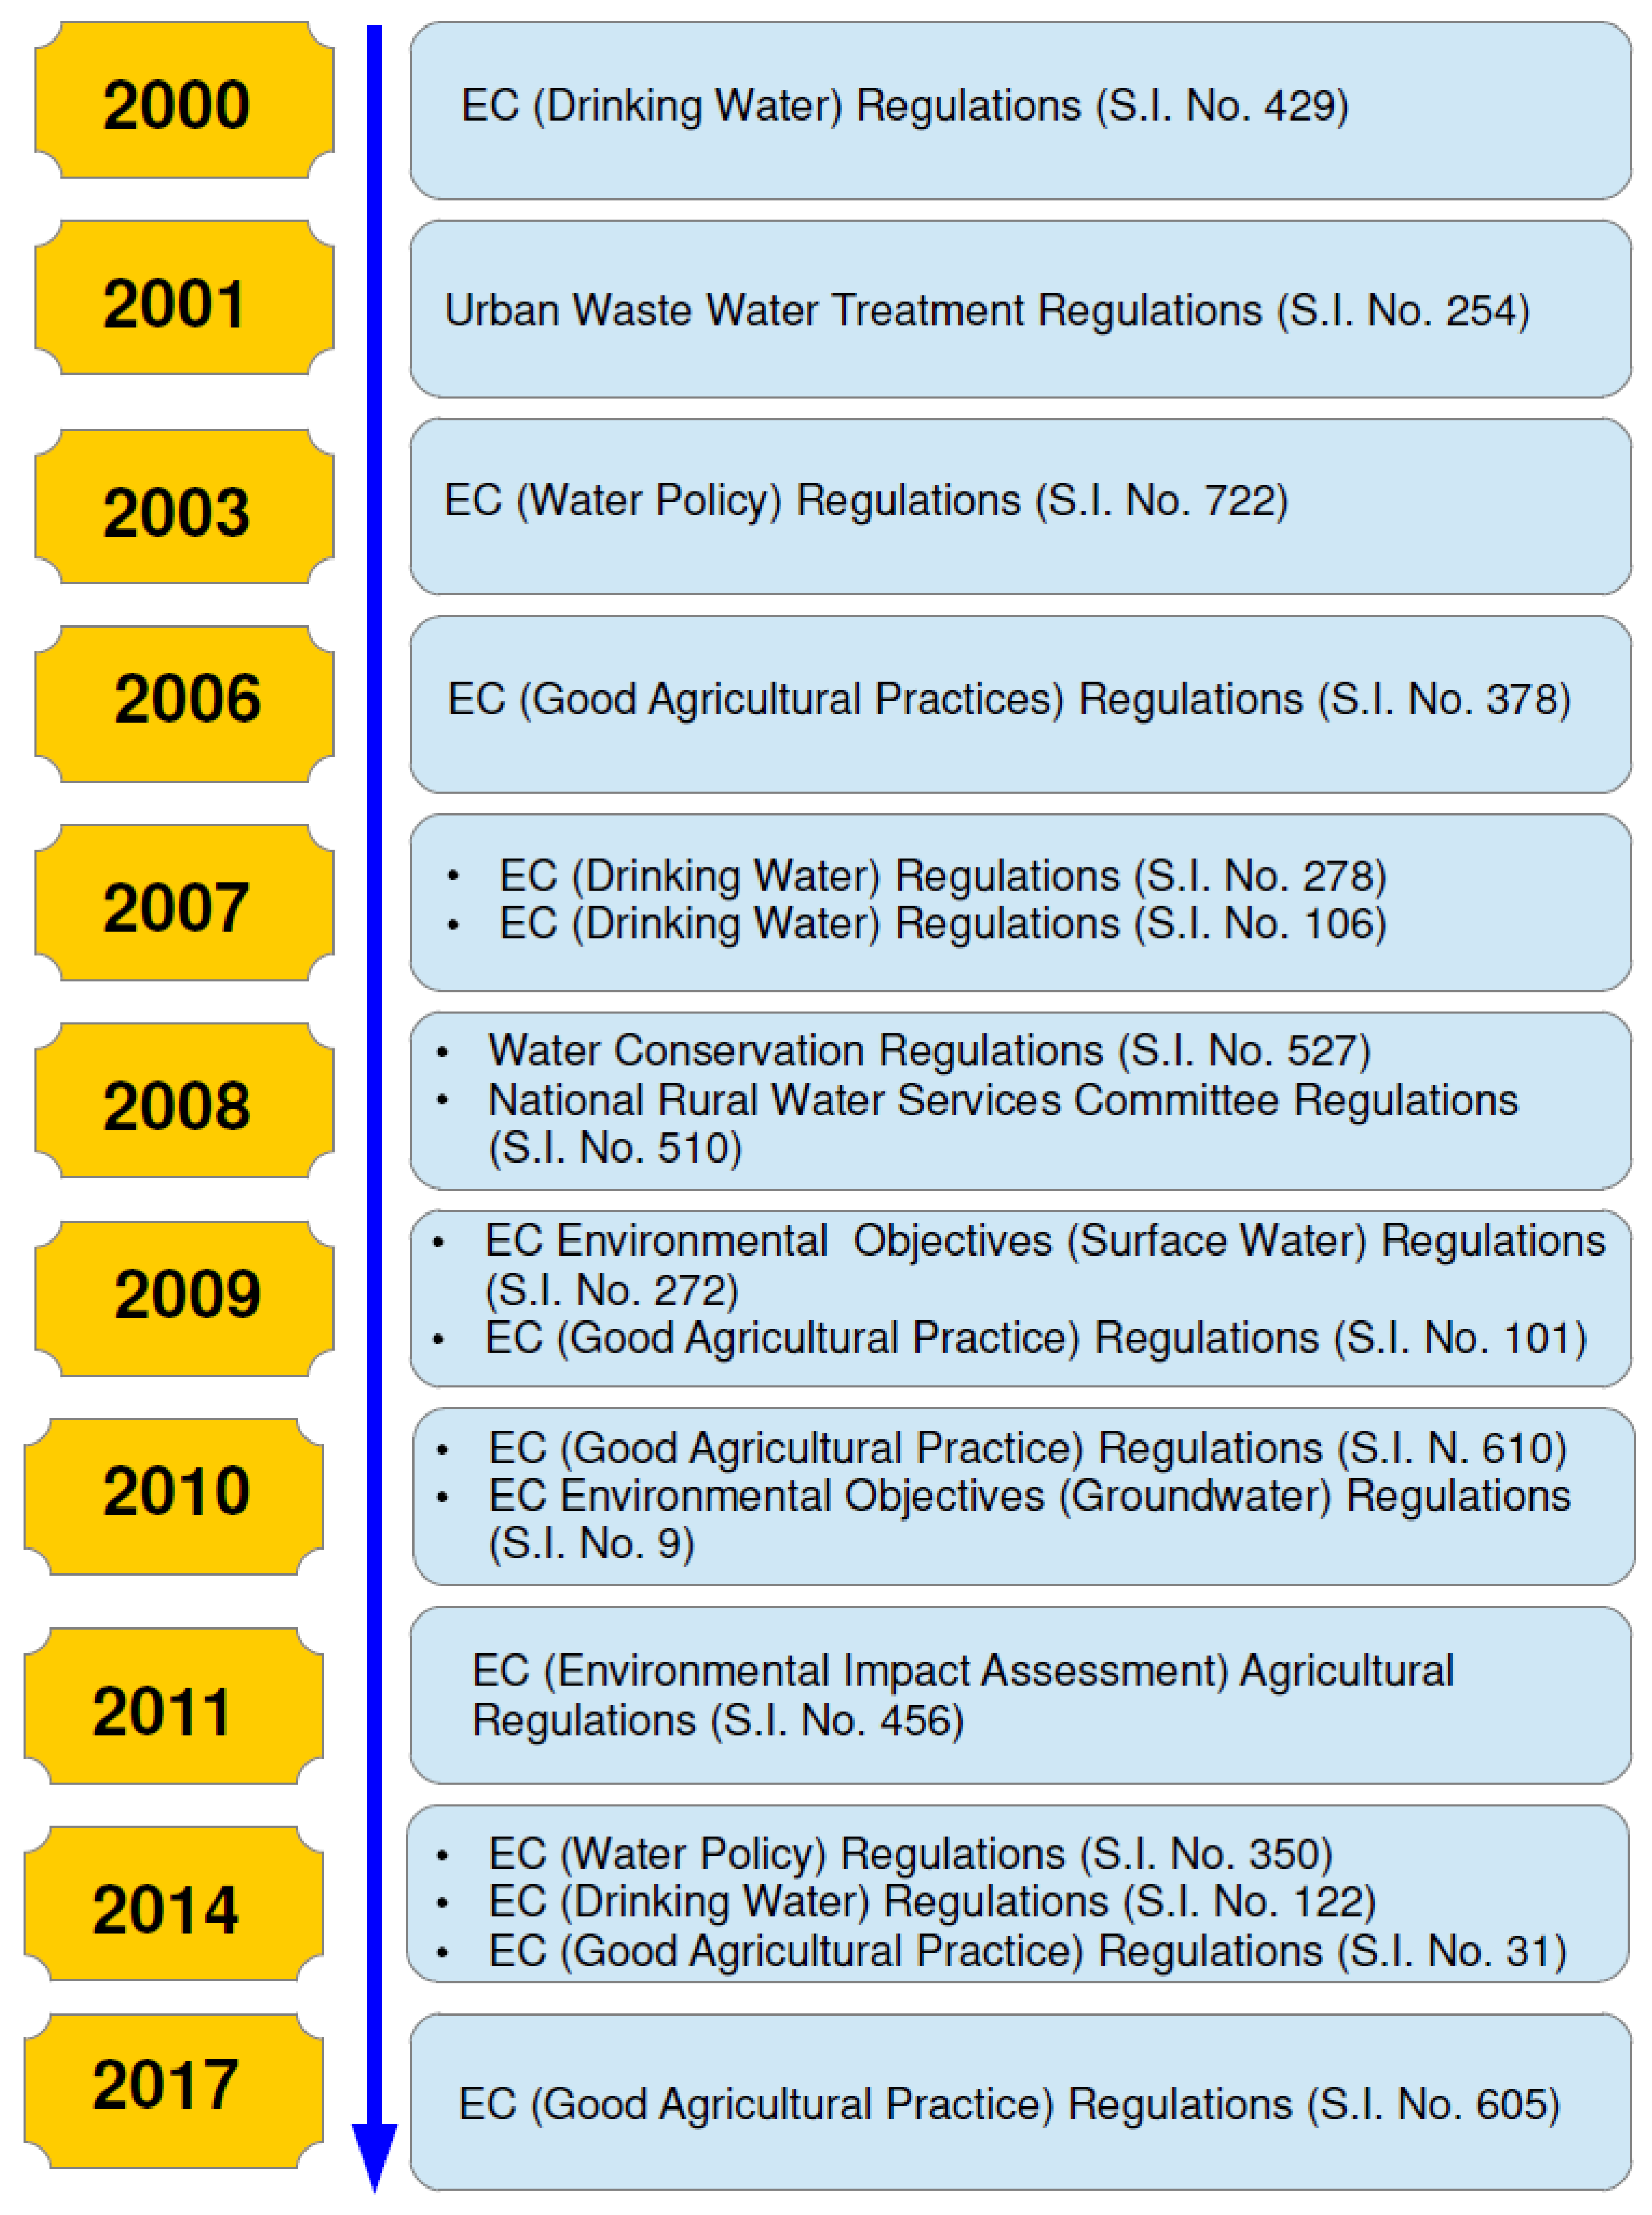
3.4. Legislation and Policies for Industrial Water Stewardship in Ireland

Ireland’s 2015 Energy White Paper proposes guidelines for a radical transformation in the energy sector in Ireland and a large reduction of CO2 emissions from 2015 to 2050. The outlook of the Energy White Paper aligns with the prevailing narrative energy policy of the EU with respect the low-carbon society transition [81]. However, the EU guidelines are not always on track with environment targets and dynamic changes in research and innovation. Gaps exist in implementation of legislation towards municipal waste recycling, release of microplastics, and status of urban air quality, leading to the loss of biodiversity [81,82].
Moreover, the EU is likely to miss its key 2030 climate and energy targets unless governments implement further action including reduction of subsidies for fossil fuels with the concurrent increase in renewable energy and materials into the industrial sector [83,84]. However, the objectives of governmental funding must be aligned with the EU Water Framework Directive with respect to definitions and recommended structure. Categorisation and programs for the development of measures on a river catchment basis with the concurrent development of assessment methods are needed to reach the targets of the EU Water Framework [85]. Figure 5 shows European water legislation and policy which were implemented by the EU to support water management in Ireland. The legislative documents provide the government with substantial guidance on how to protect water bodies according to the European water policy. In addition, also observed were several policy documents related to agricultural practices starting in 2006 on an annual basis [86]. These changes are also in agreement with modifications in government legislation coordinated by the Environmental Protection Agency in Ireland [87]. New developments in water cleaning technologies and the energy sector, pressure of the “EU green deal” on businesses and local authorities, mismatch between the most abundant water resources located in north and west of Ireland and supplying the majority of the population located in the south–east to east of Ireland has led to modification of legislation and policies [87].
Improvement in water supply–demand management can reduce pressure on both government authorities and businesses concurrently, preventing environmental damages and avoiding the necessity for the redesign of the supply infrastructure [88]. The development of an effective water supply–demand management system requires the formation of “active water citizenship” culture as a part of stakeholder and government interaction [88]. Independently or in cooperation with governmental authorities, stakeholders have the potential to realise a wide range of environmental and social benefits using self-initiated care for the water supply-demand system on the manufacturing site. “Active water citizens” often experience a lack of support from governmental authorities and are constrained by existing legislation that prevents them from substantive outcome realisation [89]. “Active industrial water citizens” can realize significant transformation in governance using low-cost sensors for monitoring leaks that reduce water loss and improve forecasting of water demand, consider novel approaches for the automatisation and control of water supply and distribution on the manufacturing site, etc. [90]. Similar to alignment with the European Green Deal objectives, it is often a very complex and time-intensive exercise to develop understanding of dynamically changing water life cycles, water demand on the industrial site, governmental requirements for the water cleaning technologies. These requirements include the replacement of synthetic chemicals with environmentally friendly organic products and the status of novel efficient water metering instruments.
Moreover, the development of artificial intelligence and data mining tools will significantly support industry with the extensive control and monitoring of any changes in water management. This can be costly to address as an individual business requiring several companies work collaboratively in tackling water management challenges. Therefore, a national program in Ireland is desired to support businesses with the initial stewardship training and expert consultancies to identify the water life cycle and develop tools for the water metering and carbon footprint assessment using various scenarios. Figure 6 illustrates a framework for the industrial water supply–demand management.
First of all, the interaction between governmental authorities and industrial enterprises is suggested to be collaborative. The establishment of the national program will through accurate analysis of the industrial infrastructure and studying policy directives and legislations identify new opportunities for the research and development of technologies and monitoring tools. The companies will be supported by consultancies and training through initial governmental funding, demonstrating how to integrate sustainable and environmentally friendly solutions in the existing industrial infrastructure. A necessary precursor to applying artificial intelligence (AI) algorithms to water management nationally, is the development of a virtual digital twin of operations, that is, a real-time virtual model that represents the status of the physical system. The AI algorithms can then be applied to the digital twin models to simulate optimal operation conditions and guide decision makers. However, progress towards a sustainable outcome will be achieved only when all participants from authorities, industry, and academia develop the culture of “active water citizens”. The development of new EU directives and governmental regulations can take several years.
The time from the point of providing an idea to the point of implementation by EU committee and authorities can be used by the “active water citizens” for the integration of sustainable solutions using such methods as exchange information between different parties, dissimilation of information to public, preliminary life cycle assessment, market analysis, organisation of webinars and short educational programs, etc. The “active water citizen” culture will address issues of incentivisation and reflect the behavioral change at the corporate and individual levels. This will establish a platform for new research programs which continue to support the initial interest of industrial enterprises and authorities in sustainable water management, as previously suggested [90]. More linkages to the international water stewardship community and global programs are recommended.

4. Conclusions

The carbon footprint has become a widely used concept by society, despite its lack of scientifically accepted and universally adopted guidelines. The development of energy and water efficient technologies, different methodologies to assess the emissions on the industrial site, and formulation of socio-economic models offer guidance for both industry and government agencies on the transition towards decarbonisation. However, this study clearly identified a gap in the compilations of data which are not readily available and, thus, make it difficult for companies to access how they are performing with respect to sustainable water consumption. The carbon footprint in water supply and treatment is calculated in Ireland using UK DBEIS database. However, companies should have more options to compare their environmental performance against others manufacturing similar products, nationally and globally in order to compare against sectorial best practice. This study showed that the reviewed EU and national documents create environmental awareness on industrial sites to minimize water usage and promote green technologies. Using the concept of “active water citizen” can significantly increase motivation and environmental awareness within industrial staff members leading to efficient usage of natural and digital resources. The establishment of a national platform in Ireland will support water stewardship through behavioral change at the corporate and individual levels, provide additional research funding and a smooth integration of sustainable policies in the industry.

Author Contributions

Conceptualization, A.T., W.H., and P.C.; methodology, A.T. and W.H.; software, A.T.; validation, A.T.; formal analysis, A.T. and W.H.; investigation, A.T. and W.H.; resources, K.S., S.M. and P.C.; data curation, K.S., P.C. and W.H.; writing—original draft preparation, A.T.; writing—review and editing, W.H. and A.T.; visualization, A.T. and K.S.; supervision, W.H.; project administration, P.C. and K.S.; funding acquisition, P.C. and K.S. All authors have read and agreed to the published version of the manuscript.

Funding

This project was funded (Grant No. 2019-W-LS-21) under the EPA Research Programme 2014–2020.

Institutional Review Board Statement

Not applicable.

Informed Consent Statement

Informed consent was obtained from all subjects involved in the study.

Data Availability Statement

Data sharing not applicable.

Acknowledgments

The authors gratefully acknowledge financial support from the EPA Research Programme 2014–2020 (Grant No. 2019-W-LS-21). The EPA Research Programme is a Government of Ireland initiative funded by the Department of the Environment, Climate, and Communications. It is administered by the Environmental Protection Agency, which has the statutory function of coordinating and promoting environmental research.

Conflicts of Interest

The authors declare no conflict of interest. The funders had no role in the design of the study; in the collection, analyses, or interpretation of data; in the writing of the manuscript, or in the decision to publish the results.

References

  1. King, C.W.; Holman, A.S.; Webber, M.E. Thirst for energy. Nat. Geosci. 2008, 1, 283–286. [Google Scholar] [CrossRef]
  2. Department for Environment Food and Rural Affairs. Future Water: The Government’s Water Strategy for England; Stationery Office: London, UK, 2008; pp. 1–98. [Google Scholar]
  3. Griffiths-Sattenspiel, B.; Wilson, W. The carbon footprint of water. River Netw. Portland 2009, 49, 1–49. [Google Scholar]
  4. Wilkinson, R.C. Methodology for Analysis of the Energy Intensity of California’s Water Systems, and an Assessment of Multiple Potential Benefits Through Integrated Water-Energy Efficiency Measures; Environmental Studies Program, University of California: Santa Barbara, CA, USA, 2000; pp. 1–6. [Google Scholar]
  5. Rothausen, S.G.S.A.; Conway, D. Greenhouse-gas emissions from energy use in the water sector. Nat. Clim. Chang. 2011, 1, 283–286. [Google Scholar] [CrossRef]
  6. Shah, T. Climate change and groundwater: India’s opportunities for mitigation and adaptation. Environ. Res. Lett. 2009, 4, 035005. [Google Scholar] [CrossRef]
  7. Khan, S.; Khan, M.; Hanjra, M.; Mu, J. Pathways to reduce the environmental footprints of water and energy inputs in food production. Food Policy 2009, 34, 141–149. [Google Scholar] [CrossRef]
  8. Carlson, S.W.; Walburger, A. Energy Index Development for Benchmarking Water and Wastewater Utilities; AWWA Research Foundation; New York State Energy Research and Development Authority: Albany, NY, USA; California Energy Commission: Sacremento, CA, USA, 2007; p. 164. [Google Scholar]
  9. Wayne, S.B.; Pierce, R.R.; Perlman, H.A. Estimated Use of Water in the United States in 1995. U.S. Environmental Protection Agency. Available online: http://water.usgs.gov/watuse/pdf1995/html/index.html (accessed on 1 September 2020).
  10. Cooley, H.; Christian-Smith, J.; Gleick, P.H. More with Less: Agricultural Water Conservation and Efficiency in California; Pacific Institute: Oakland, CA, USA, 2008; p. 69. [Google Scholar]
  11. Frijns, J. Towards a common carbon footprint assessment methodology for the water sector. Water Environ. J. 2011, 26, 63–69. [Google Scholar] [CrossRef]
  12. Friedrich, E.; Pillay, S.; Buckley, C. The use of LCA in the water industry and the case for an environmental performance indicator. Water SA 2010, 33, 443–451. [Google Scholar] [CrossRef] [Green Version]
  13. Li, H.; Zhao, Y.; Lin, J. A review of the energy–carbon–water nexus: Concepts, research focuses, mechanisms, and methodologies. Wiley Interdiscip. Rev. Energy Environ. 2019, 9, 1–18. [Google Scholar] [CrossRef]
  14. Zhang, C.; Chen, X.; Li, Y.; Ding, W.; Fu, G. Water-energy-food nexus: Concepts, questions and methodologies. J. Clean. Prod. 2018, 195, 625–639. [Google Scholar] [CrossRef]
  15. Fauré, E.; Arushanyan, Y.; Ekener, E.; Miliutenko, S.; Finnveden, G. Methods for assessing future scenarios from a sustainability perspective. Eur. J. Futures Res. 2017, 5, 17. [Google Scholar] [CrossRef] [Green Version]
  16. Beria, P.; Maltese, I.; Mariotti, I. Multicriteria versus cost benefit analysis: A comparative perspective in the assessment of sustainable mobility. Eur. Transp. Res. Rev. 2012, 4, 137–152. [Google Scholar] [CrossRef] [Green Version]
  17. Hooper, T.; Austen, M.C.; Beaumont, N.; Heptonstall, P.; Holland, R.A.; Ketsopoulou, I.; Taylor, G.; Watson, J.; Winskel, M. Do energy scenarios pay sufficient attention to the environment? Lessons from the UK to support improved policy outcomes. Energy Policy 2018, 115, 397–408. [Google Scholar] [CrossRef]
  18. Van der Voorn, T.; Svenfelt, Å.; Björnberg, K.E.; Faure, E.; Milestad, R. Envisioning carbon-free land use futures for Sweden: A scenario study on conflicts and synergies between environmental policy goals. Reg. Environ. Chang. 2020, 20, 35. [Google Scholar] [CrossRef] [Green Version]
  19. Robert, M.; Jonsson, R.D. Assessment of transport policies toward future emission targets. A backcasting approach for Stockholm 2030. J. Environ. Assess. Policy Manag. 2006, 8, 451–478. [Google Scholar] [CrossRef]
  20. Gursel, A.P.; Chaudron, C.; Kavvada, I.; Horvath, A. Reduction in urban water use leads to less wastewater and fewer emissions: Analysis of three representative U.S. cities. Environ. Res. Lett. 2020, 15, 084024. [Google Scholar] [CrossRef]
  21. OECD/IEA. Water-Energy Nexus: Excerpt from The World Energy Outlook 2016 OECD/International Energy Agency. 2016. Available online: https://webstore.iea.org/download/direct/303?fileName=WorldEnergyOutlook2016ExcerptWaterEnergyNexus.pdf (accessed on 1 August 2020).
  22. IEA. World Energy Outlook 2018; IEA: Paris, France, 2018; Available online: https://www.iea.org/reports/world-energy-outlook-2018 (accessed on 22 March 2020).
  23. Anglian Water. Strategic Direction Statement 2010–2035; Anglian Water Publications: Huntington, UK, 2009; pp. 1–74. [Google Scholar]
  24. OFWAT. Playing Our Part—Reducing Greenhouse Gas Emissions in the Water and Sewerage Sectors: Supporting Information; OFWAT: London, UK, July 2010; pp. 1–43. [Google Scholar]
  25. HM Government. The Carbon Plan: Delivering Our Low Carbon Future; HM Government: London, UK, December 2011; pp. 1–220. [Google Scholar]
  26. CIWEM. A Blueprint for Carbon Emissions Reduction in the UK Water Industry; CIWEM: London, UK, 2013; pp. 1–44. [Google Scholar]
  27. City of Melbourne. Climate Neutral Water Saving. How to Reuse Water without Increasing Greenhouse Gas Emissions; Technical Report; Australian Government: Melbourne, Australia, 2005; pp. 1–41.
  28. Australian Greenhouse Office. AGO Factors and Workbook Methods; Australian Greenhouse Office: Canberra, Australia, 2005; pp. 1–36. [Google Scholar]
  29. Gleick, P.H. Basic water requirements for human activities: Meeting basic needs. Water Int. 1996, 21, 83–92. [Google Scholar] [CrossRef]
  30. Gurung, K.; Tang, W.Z.; Sillanpää, M. Unit energy consumption as benchmark to select energy positive retrofitting strategies for Finnish wastewater treatment plants (WWTPs): A case study of Mikkeli WWTP. Environ. Process. 2018, 5, 667–681. [Google Scholar] [CrossRef]
  31. USGS. Thirsty? How ‘Bout a Cool, Refreshing Cup of Seawater? 2010. Available online: http://ga.water.usgs.gov/edu/drinkseawater.html (accessed on 1 August 2020).
  32. Klein, G.; Krebs, M.; Hall, V.; O’Brien, T. California’s Water-Energy Relationship: Staff Final Report; California Energy Commission: Sacremento, CA, USA, 2005. Available online: http://www.energy.ca.gov/2005publications/CEC-700-2005-011/CEC-700-2005-011-SF.PDF (accessed on 1 August 2020).
  33. Trubetskaya, A.; Kling, J.; Attard, T.M.; Schroeder, E.; Ershag, O. Removal of phenol and chlorine from wastewater using steam activated biomass soot and tire carbon black. J. Hazard Mater. 2019, 365, 846–856. [Google Scholar] [CrossRef] [PubMed] [Green Version]
  34. EPRI. Water and Sustainability: U.S. Electricity Consumption for Water Supply & Treatment—The Next Half Century; Electric Power Research Institute: Palo Alto, CA, USA, 2000; pp. 1–93. [Google Scholar]
  35. Database from European Environmental Agency, CO2-Emission Intensity from Electricity Generation. September. Available online: https://www.eea.europa.eu/data-and-maps/daviz/sds/co2-emission-intensity-from-electricity-generation-2/@@view (accessed on 1 August 2020).
  36. Ercin, A.E.; Hoekstra, A.Y. Carbon and Water Footprint: Concepts, Methodologies and Policy Reponses; United Nations World Water Assessment Programme: Paris, France, 2012; pp. 1–24. [Google Scholar]
  37. Cooley, H.; Gleick, P.H.; Wolff, G. Desalination, With A Grain of Salt—A California Perspective; Pacific Institute: Oakland, CA, USA, June 2006; Available online: http://www.pacinst.org/reports/desalination/desalination_report.pdf (accessed on 1 August 2020).
  38. McCarton, L.; O’Hogain, S. Sustainable Water Supply in Ireland; Seed Fund Report; Dublin Institute of Technology: Dublin, Ireland, September 2004; pp. 1–78. [Google Scholar]
  39. Haasz, D. A California Case Study; Pacific Institute: Oakland, CA, USA, 2002; Available online: www.watersave.net.uk (accessed on 1 August 2020).
  40. Friedrich, E.; Pillay, S.; Buckley, C. Carbon footprint analysis for increasing water supply and sanitation in South Africa: A case study. J. Clean. Prod. 2009, 17, 1–12. [Google Scholar] [CrossRef]
  41. Vickers, A. Implementing the US energy policy act. J. Am. Water Work. Assoc. 1996, 88, 18–112. [Google Scholar] [CrossRef]
  42. Stokes, J.R.; Horvath, A. Energy and air emission effects of water supply. Environ. Sci. Technol. 2009, 43, 2680–2687. [Google Scholar] [PubMed] [Green Version]
  43. Wolff, G.; Cohen, R.; Nelson, B. Energy Down the Drain: The Hidden Costs of California’s Water Supply. Natural Resources Defense Council and Pacific Institute, August 2004. Available online: http://www.nrdc.org/water/conservation/edrain/contents.asp (accessed on 1 August 2020).
  44. Burton, F.L.; Stern, F. Water and Wastewater Industries: Characteristics and Energy Management Opportunities; Technical Report; Electric Power Research Institute: Palo Alto, CA, USA, 1996; p. 28. [Google Scholar]
  45. Wakeel, M.; Chen, B. Energy consumption in urban water cycle. Ener. Procedia 2016, 104, 123–128. [Google Scholar] [CrossRef]
  46. Bruinsma, J. (Ed.) World Agriculture: Towards 2015/An FAO Perspective; Earthscan: London, UK, 2003; p. 432. [Google Scholar]
  47. Jackson, T.M.; Khan, S.; Hafeez, M. A comparative analysis of water application and energy consumption at the irrigated field level. Agric. Water Manag. 2010, 97, 1477–1485. [Google Scholar] [CrossRef]
  48. Whiffen, H.H. Energy efficiency and environmental news: Energy use in irrigation. In Florida Energy Extension Service; Institute of Food and Agricultural Sciences, University of Florida: Gainesville, FL, USA, 1991; p. 6. [Google Scholar]
  49. SEAI. Energy Related CO2 Emissions in Ireland 2005–2018; Sustainable Energy Authority of Ireland: Dublin, Ireland, 2020; p. 48. Available online: https://www.seai.ie/publications/Energy-Emissions-Report-2020.pdf (accessed on 1 August 2020).
  50. SEAI. Energy Security in Ireland 2020; Sustainable Energy Authority of Ireland: Dublin, Ireland, September 2020; p. 93. Available online: https://www.seai.ie/blog/energy-security/ (accessed on 1 August 2020).
  51. SEAI. Energy Related CO2 Emissions in Ireland 2005–2016; Technical Report; Sustainable Energy Authority of Ireland: Dublin, Ireland, 2018; p. 40. Available online: https://www.seai.ie/publications/Energy-Emissions-Report-2018.pdf (accessed on 1 August 2020).
  52. Moro, A.; Lonza, L. Electricity carbon intensity in European Member states: Impacts on GHG emissions of electric vehicles. Transp. Res. Part D Transp. Environ. 2018, 64, 5–14. [Google Scholar] [CrossRef]
  53. DBEIS. Conversion Factors 2020: Methodology; Department of Business Energy and Industrial Strategy: London, UK, 2020; p. 128. Available online: https://assets.publishing.service.gov.uk/government/uploads/system/uploads/attachment_data/file/901692/conversion-factors-2020-methodology.pdf (accessed on 1 August 2020).
  54. DBEIS. Greenhouse Gas Reporting: Conversion Factors 2020; Department of Business Energy and Industrial Strategy: London, UK, 2020. Available online: https://assets.publishing.service.gov.uk/government/uploads/system/uploads/attachment_data/file/891106/Conversion_Factors_2020_-_Full_set__for_advanced_users_.xlsx (accessed on 1 August 2020).
  55. Nezamoleslami, R.; Hosseinian, S.M. Data needed for assessing water footprint of steel production. Data Brief 2020, 30, 105461. [Google Scholar] [CrossRef]
  56. Mekonnen, M.M.; Gerbens-Leenes, W.; Hoekstra, A.Y. The consumptive water footprint of electricity and heat: A global assessment. Environ. Sci. Water Res. Technol. 2015, 1, 285–297. [Google Scholar] [CrossRef]
  57. Chuang, J.; Lien, H.-L.; Den, W.; Iskandar, L.; Liao, P.-H. The relationship between electricity emission factor and renewable energy certificate: The free rider and outsider effect. Sustain. Environ. Res. 2018, 28, 422–429. [Google Scholar] [CrossRef]
  58. Gu, Y.; Xu, J.; Keller, A.A.; Yuan, D.; Li, Y.; Zhang, B.; Weng, Q.; Zhang, X.; Deng, P.; Wang, H.; et al. Calculation of water footprint of the iron and steel industry: A case study in Eastern China. J. Clean. Prod. 2015, 92, 274–281. [Google Scholar] [CrossRef] [Green Version]
  59. Novartis. Environmental Data Supplement; Technical Report; Novartis: Basel, Switzerland, 2017; p. 17. [Google Scholar]
  60. Merve Kocabas, A. Improvements in Energy and Water Consumption Performances of a Textile Mill after BAT Application. Master’s Thesis, School of Natural and Applied Sciences, Ankara, Turkey, 2008; p. 172. [Google Scholar]
  61. Francis, D.W.; Towers, M.T.; Browne, T.C. Energy Cost Reduction in the Pulp and Paper Industry—An Energy Benchmarking Perspective; Governmental Office of Energy Efficiency Natural Resources Canada: Ottawa, ON, Canada, 2004; pp. 1–30. [Google Scholar]
  62. Rad, S.J.; Lewis, M.J. Water utilization, energy utilization and waste water management in the dairy industry: A review. Int. J. Dairy Technol. 2013, 67, 1–20. [Google Scholar] [CrossRef]
  63. Finnegan, W.; Yan, M.; Holden, N.M.; Goggins, J. A review of environmental life cycle assessment studies examining cheese production. Int. J. Life Cycle Assess. 2018, 23, 1773–1787. [Google Scholar] [CrossRef]
  64. Vasilaki, V.; Katsou, E.; Ponsá, S.; Colón, J. Water and carbon footprint of selected dairy products: A case study in Catalonia. J. Clean. Prod. 2016, 139, 504–516. [Google Scholar] [CrossRef]
  65. Durst, P.T.; Moore, S.J.; Ritter, C.; Barkema, H.W. Evaluation by employees of employee management on large US dairy farms. J. Dairy Sci. 2018, 101, 7450–7462. [Google Scholar] [CrossRef] [PubMed] [Green Version]
  66. Finnegan, W.; Goggins, J.; Clifford, E.; Zhan, X. Environmental impacts of milk powder and butter manufactured in the Republic of Ireland. Sci. Total Environ. 2017, 579, 159–168. [Google Scholar] [CrossRef] [Green Version]
  67. Shine, P.; Scully, T.; Upton, J.; Shalloo, L.; Murphy, M.D. Electricity and direct water consumption on Irish pasture based dairy farms: A statistical analysis. Appl. Energy 2018, 210, 529–537. [Google Scholar] [CrossRef]
  68. Yan, M.-J.; Holden, N. Water use efficiency of Irish dairy processing. J. Dairy Sci. 2019, 102, 9525–9535. [Google Scholar] [CrossRef]
  69. Raminez, C.A.; Patel, M.; Blok, P.K. From fluid milk to milk powder: Energy use and energy efficiency in the European dairy industry. Energy 2006, 31, 1984–2004. [Google Scholar] [CrossRef] [Green Version]
  70. Goel, V.; Jordan, W.; Rao, M. Energy use profile in concentrated and powdered milk manufacture. J. Dairy Sci. 1979, 62, 876–881. [Google Scholar] [CrossRef]
  71. Ridoutt, B.; Williams, S.; Baud, S.; Fraval, S.; Marks, N. Short communication: The water footprint of dairy products: Case study involving skim milk powder. J. Dairy Sci. 2010, 93, 5114–5117. [Google Scholar] [CrossRef] [PubMed] [Green Version]
  72. Boguniewicz-Zablocka, J.; Klosok-Bazan, I.; Naddeo, V. Water quality and resource management in the dairy industry. Environ. Sci. Pollut. Res. 2017, 26, 1208–1216. [Google Scholar] [CrossRef] [Green Version]
  73. Moejes, S.N. Redesign of the Milk Powder Production Chain: Assessment of Innovative Technologies. Ph.D. Thesis, Wageningen University, Wageningen, The Netherlands, 2019; p. 170. [Google Scholar]
  74. Walker, M.E.; Lv, Z.; Masanet, E. Industrial steam systems and the energy-water nexus. Environ. Sci. Technol. 2013, 47, 13060–13067. [Google Scholar] [CrossRef] [PubMed]
  75. Upton, J. Strategies to Reduce Electricity Consumption on Dairy Farms—An Economic and Environmental Assessment. Ph.D. Thesis, Wageningen University, Wageningen, The Netherlands, 2014; p. 180. [Google Scholar]
  76. Fahy, F.; Goggins, G. An Introduction to Energy Demand Challenges in Europe; Springer International Publishing: Cham, Switzerland, 2019; pp. 1–7. [Google Scholar]
  77. Pfister, S.; Vionnet, S.; Levova, T.; Humbert, S. Ecoinvent 3: Assessing water use in LCA and facilitating water footprinting. Int. J. Life Cycle Assess. 2016, 21, 1349–1360. [Google Scholar] [CrossRef]
  78. Kounina, A.; Margni, M.; Bayart, J.-B.; Boulay, A.-M.; Berger, M.; Bulle, C.; Frischknecht, R.; Koehler, A.; Canals, L.M.I.; Motoshita, M.; et al. Review of methods addressing freshwater use in life cycle inventory and impact assessment. Int. J. Life Cycle Assess. 2013, 18, 707–721. [Google Scholar] [CrossRef] [Green Version]
  79. Steubing, B.; Wernet, G.; Reinhard, J.; Bauer, C.; Moreno-Ruiz, E. The Ecoinvent database version 3 (part II): Analyzing LCA results and comparison to version. Int. J. Life Cycle Assess. 2016, 21, 1269–1281. [Google Scholar] [CrossRef] [Green Version]
  80. Herold, A.; Cook, V.; Baron, Y.; Cames, M.; Gores, S.; Graichen, J.; Kasten, M.G.; Siemons, A.; Urrutia, C.; Wolff, F. EU Environment and Climate Change Policies. State of Play, Current and Future Challenges; Policy Department for Economic, Scientific and Quality of Life Policies, Publication Office of the European Union: Brussel, Belgium, 2019; p. 90. [Google Scholar]
  81. European Chemicals Agency. Annex XV Restrictions Report, Proposal for a Restriction for Internationally Added Microplastics; ECHA: Brussel, Belgium, 2019; p. 145. [Google Scholar]
  82. EEA. Trends and Projections in Europe 2018—Tracking Progress towards Europe’s Climate and Energy Targets; EEA Report No 15/2019; EEA: Brussel, Belgium, 2019; p. 109. [Google Scholar]
  83. Dubber, D.; Gill, L. Application of on-site wastewater treatment in ireland and perspective on its sustainability. Sustainability 2014, 6, 1623–1642. [Google Scholar] [CrossRef] [Green Version]
  84. European Parliament. Directive 2000/60/EC of the European Parliament and of the Council; L 327/1; EU Report; Official Journal of the European Communities: Brussel, Belgium, 2000; pp. 1–72. [Google Scholar]
  85. Stockil, K.; Keely, N.; Valle, M.; Merritt, S. A National Roadmap for Water Sterwardship in Industry and Agriculture in Ireland; Report N. 261; EPA Research Climate—Water Sustainability; EPA: Dublin, Ireland, 2020; p. 59. [Google Scholar]
  86. Government of Ireland. Climate Action Plan 2019; Technical Report; Government of Ireland: Dublin, Ireland, 2019; pp. 1–146.
  87. Mattijssen, T.J.M.; Buijs, A.A.E.; Elands, B.H.M.; Arts, B.J.M.; van Dam, R.I.; Donders, J.L.M. The transformative potential of active citizenship: Understanding changes in local governance practices. Sustainability 2019, 11, 5781. [Google Scholar] [CrossRef] [Green Version]
  88. Garcia, M. Citizenship practices and urban governance in European cities. Urban Stud. 2006, 43, 745–765. [Google Scholar] [CrossRef]
  89. European Commission. Communications from the Commission to the European Parliament, the European Council, the Council, the European Economic and Social Committee and the Committee of the Regions; EU Report; The European Green Deal: Brussel, Belguim, 2019; Volume 640, p. 24. [Google Scholar]
  90. Stockil, K. European Water Stewardship Standards. An Investigation into the Opportunities for Ireland. Environmental Protection Agency: Johnstown Castle, Ireland. Available online: http://epa.smartsimple.ie/files/347278/105474/EWS_FINAL_Report.pdf (accessed on 2 October 2017).
Figure 2. Greenhouse gas (GHG) emission sources in the water sector.
Processes 09 00393 g002
Figure 3. Supply chain of milk dairy–system boundaries using the presented life cycle assessment methodology and classification of the production stages.
Processes 09 00393 g003
Figure 4. Energy consumption in powdered milk production.
Processes 09 00393 g004
Figure 5. Legislation supporting water stewardship in Ireland in period of 2000–2017.
Processes 09 00393 g005
Figure 6. Recommendation for the industrial water supply–demand framework.
Processes 09 00393 g006
Table 1. Direct and indirect emissions [24].
Direct emissions
Emissions from transport
Emissions from the companies own fossil fuel use
Methane and nitrous oxide from wastewater treatment
Indirect emissions
Grid electricity used for pumping and treatment of water and discharge
Grid electricity used in industrial buildings
Indirect emissions that are accounted for
Emissions from contractors and outsourced services
Business-associated transport (leased vehicles and owned by the industry buses, trucks, and cars)
Indirect emissions that are not accounted for
Chemical manufacture
Embedded emissions—from construction and manufacturing activity
Customers’ energy use to heat water
Release of methane and nitrous oxide from sludge disposed to landfill and agriculture
Table 2. Range of energy intensities for water use cycle segments [4].
Water Use Cycle SegmentRange of Energy Intensity (kWh MG−1)
Water Supply and Conveyance0–14,000
Water Treatment100–16,000
Water Distribution250–1200
Wastewater Collection and Treatment700–4600
Wastewater Discharge0–400
Table 3. Generic energy intensity of water supply types [38,39].
Source TypesEnergy Intensity
Surface Water (Gravity Fed)0
Groundwater2000
Brackish Groundwater3200
Desalinated Water13,800
Recycled Water1100
Table 4. Results of a simple carbon footprint calculation in water supply and treatment with energy and water consumption pro unit of a product [49,54,58,59,60,61,62,63,64,65,66].
IndustryEnergy
Consumption, kWh m−3
Water
Consumption, m3 m−3
Emissions,
kg CO2 m−3
DBEIS [54],
Water Supply, kg CO2 m−3
1. Steel Production [50]1.287.680.062<0.344
2. Healthcare [51]16.515.40.402>0.344
3. Textile Production [52]1.71060.006<0.344
4. Paper and Pulp, Wastewater Treatment [53]30350.321<0.708
5. Powdered Milk Production Including
Wastewater Treatment [54]
2.08 *0.611.28>0.708
* It was assumed that only electrical energy was used in the calculation.
Table 5. Results of the carbon footprint calculation in milk dairy production [49,54,62,63,64,65,66].
ParametersValueUnit
Input Parameters
1. Total Energy Input0.89GJ t−1 of powdered milk
2. Water Supply0.6m3 m−3 of liquid milk
3. Liquid Milk For 1 Kg Powder8.5l kg−1
4. Pump Energy Consumption3kWh
5. Pump Flow Rate0.086m3 s−1
6. Steam Energy Demand2700kJ kg−1 of steam
7. Energy Regeneration90–94%
8. Ambient Temperature20°C
9. Cleaning Water Temperature60°C
10. Energy Demand Wastewater0.47kWh m−3
11. Added Chemical for Cleaning0.09kg kg−1 of powdered milk
12. Wastewater2.34kg kg−1 of powdered milk
13. Wastewater Flow Rate0.014m3 kg−1 of powdered milk
14. Number of Pumps1-
15. Conversion Factor for Onsite Heat0.207kg CO2 kWh−1 [49]
16. Conversion Factor for Electricity0.375kg CO2 kWh−1 [49]
17. Conversion Factor for Wastewater0.708kgCO2e m−3 [54]
Calculated Emission Factorskg CO2 m−3 of Waterkg CO2 m−3 of Milk
1. Pasteurisation0.0260.002
2. Evaporation0.4630.016
3. Drying0.4890.027
4. Packaging0.0150.006
5. Administration0.0500.012
6. Pumping0.1590.097
7. Wastewater Treatment0.0620.038
Total1.2620.198
Publisher’s Note: MDPI stays neutral with regard to jurisdictional claims in published maps and institutional affiliations.

