Article

Production of Electricity and Heat from Biomass Wastes Using a Converted Aircraft Turbine AI-20

1
Institute of Wood Sciences and Furniture, Warsaw University of Life Sciences in Warsaw, Nowoursynowska 166 street, 02-787 Warsaw, Poland
2
Institute of Technology and Life Sciences in Falenty, Warsaw Branch, 32 Rakowiecka St., 02-532 Warsaw, Poland
*
Author to whom correspondence should be addressed.
Processes 2021, 9(2), 364; https://doi.org/10.3390/pr9020364
Submission received: 30 December 2020 / Revised: 9 February 2021 / Accepted: 10 February 2021 / Published: 16 February 2021

Abstract

:
The aim of this study was to investigate the influence of biomass micronization on energy production using a converted aircraft turbine AI-20. The test system was constructed in such a way to ensure continuous operation for a given period of time and was equipped in a chopper, a flail mill, and a micronizer. The turbine had the ability to produce energy from solid biomass and as well conventional fuels. The most energy was obtained from absolutely dry sunflower husk (17.27 MJ/kg) and the least from Poplar (7.82 MJ/kg). Miscanthus, wheat straw, and hay (approximately 17 MJ/kg) showed high values of energy production. In addition, the thermal decomposition of wheat straw at 350 and 450 °C was studied using the Py-GC/MS technique in a helium atmosphere to determine the gaseous compounds formed during biomass gasification under anaerobic conditions. The results obtained indicate the formation of compounds classified as phenols (vanillin, hydroxymethylfurfural).

1. Introduction

Increasing environmental requirements to reduce greenhouse gas emissions by various industries point to lignocellulosic biomass (wood, straw, cereal grains, etc.) as an ideal feedstock for energy production [1,2]. Additionally, the use of lignocellulosic biomass for energy production allows the utilization of small-scale cogeneration plants for energy production, providing reduction costs associated with transportation of feedstock and making the energy system more resilient to failures [3,4]. The equipment used in such energy production should allow the use of different fuel types to ensure continuous energy production and to accommodate a variable biomass mix [2].
The production activities within the existing production structure provide the organization and coordination of material streams, information, and energy during implementation, calling them a production process. From the production process, we can distinguish the manufacturing process, which is the activity that occurs during the production of the final product, which in energy companies can be heat or electricity. The essence of the entire structure of the production process is a technological process that makes up the main part of the manufacturing process. In order to generate energy during ongoing production, certain structured activities are necessary. The organization of production makes it possible to improve these activities within the framework of the processes, for example, according to the time. Additionally, it helps to reduce the consumption and waste of materials.
The idea of the production process involves the use of various types of materials, technical means and services to produce new products or services [5]. According to Brilman [6] the process is a set of consecutive operations to achieve a predetermined result. Streamlining the activities carried out within the production structure consists of analyzing and adapting the processes taking place within a given flow in the enterprise. During energy production, pipeline production is specified, which requires continuity of production. However, any break can have great financial consequences. In the case of pipeline production, the production organization strives for failure-free production while increasing productivity.
The Polish power industry is in energy transformation process [7]. The coal industry dominates the power sector in Poland, where it is the largest source of greenhouse gas emissions and a major employer. While the country has experienced strong growth in the field of renewable energy over the past decade, its future role in the energy supply mix needs to be clarified [8,9]. The Polish power industry is in an energy transformation process [10]. In Poland, the proportion of energy from renewable sources to the total primary energy generated increased from 11.73% to 14.46% in 2012–2018 [11].
The Polish government has agreed with unions on final coal mines closure [12]. The last coal mine is going to be closed in 2049. The agreement means gradual coal mines closure and shift from coal to renewable energy sources (RES) as energy sources in Poland. It is a major challenge for Poland. In 2019 the structure of electrical energy production was as follows: 49.25% from coal, 17.95% from lignite, 15.93% from RES, 5.88% from gas, 5.71% from unknown energy carriers in industrial plants and 5.11% from water plants [13].
There are agricultural biomass waste resources available in Poland [14,15]. A new phenomenon, which has been highly significant for the development of this sector, is the use of innovative, small-scale technologies of energy generation from renewable sources, which created the foundations for the growth of a citizens’ energy sector, based on the initiative of the citizens and their communities. Local energy production using biomass as fuel is an element of environmental protection [16]. Biomass can be produced on marginal land which is not suitable for food or forage production [17,18].
There is a need for new technologies which can produce electricity in small-scale installations based on rural areas [19,20]. The BioCHP project investigated an electricity and heat generation plant using biomass waste as fuel. The article explored the possibilities of using micronized biomass (sunflower husk, oat husk, wheat straw, miscanthus, hay, wood chips, willow, and poplar) in the line for electricity and heat production. Accordingly, several types of biomass were analyzed for physical and chemical characteristics. The methodology assumed conducting several comprehensive analyses; therefore, all research and processing procedures are described below, broken down into paragraphs such as micronization, measurements of Py-GC/MS, moisture measurement, and measurement of ash amount of analyzed materials.

2. Materials and Methods

2.1. Micronizing of the Materials

Research on the determination of particle decay was carried out by Flizikowski et al. [21], assuming the hypothesis that a rotating particle in the channel space of a micronizer is subject to defragmentation as a result of friction, impact strength, and tension leveling. According to the authors, the disintegration of particles in relation to the walls of the micronizer head is random. During micronization, stresses arise on the particle plane as a result of loads. The technical drawing of the micronizer nozzle is presented in Figure 1.
Following biomass materials were tested as potential fuel: sunflower husk, oat husk, wheat straw, miscanthus, hay, wood chips, willow, and poplar. The line includes machinery for biomass preparation (chaff cutter, flail mill, and micronizer) which can process biomass in different shapes as for example bales (rectangular or round) or wood chips. Biomass supplied to the line should be as dry as possible, because biomass heating value depends on moisture content. The drier biomass is there, the higher the heating value of the material. Chaff cutter cuts long pieces of biomass into smaller parts which are geometrically suitable as input to the flail mill. Flail mill grinds the biomass received from chaff cutter and supplies it to the micronizer. Micronizer micronizes biomass down to particles with maximal size of 500 micrometers.
Micronized biomass is temporarily stored in a micronized biomass magazine and further transported to a diffusion combustion chamber with special construction linked with the turbine engine AI 20. This chamber replaces the original combustion chamber of the engine AI 20. It is the only serious engine modification. The structure of the chamber is designed to fully burn all micronized biomass particles delivered to the chamber as well as other fuels such as natural gas or fuel oil. The main advantages of this design lie in flexibility regarding fuel types, providing the opportunity to choose the cheapest fuel, independent of seasonal changes in biomass yields and short response times to sudden and unexpected interruptions in fuel supply.

2.2. Moisture Measurement

The measurement of biomass moisture content can be determined in several ways. In this study, moisture content was measured using the weight-difference drying method. The drying time for sawdust and wood chip samples was 6 +/– 2 h (standard)(to determine the constant lowest weight of the sample). The drying process was carried out in laboratory conditions at 104 +/– 1 °C [22].
Moisture characteristics (M) relates to the definition of the quotient of numbers, in dividend, the difference between the values of moist mass from dry mass (dm) and the divisor of moist mass (mm), obtained value should be increased by 100%. The moisture characteristics have been written in the form of an equation:
M = m m d m m m · 100 % ,

2.3. Heating Values Measurements

The lower heating value and higher heating value were measured according to the standard ISO 1928:2009 in an IKA C 200 calorimeter. For each type of biomass, both heating values were measured six times. An average of the measurements was given as the final result. Each time an analytical sample of 1 g of raw material incinerated completely in an oxygen atmosphere at a pressure of 3 MPa was taken to the probes. Lower heating value was calculated by subtracting the heat of vaporization of the water vapor released from the fuel during its combustion from the higher heating value.

2.4. Measurement of Ash Content

The study also included an analysis of the mineral content of the individual materials. Ash is a substance of fine consistency, formed as a result of thermal conversion of biomass for heating purposes. The total ash content has a significant impact on the energy values of solid carriers [23]. The ash content determines the mineral saturation of the biomass. The plant material includes, among others: silicon, iron, aluminum, calcium, magnesium, sodium, potassium [24].
Ash content was measured in accordance with the slow ash method [25,26]. The comminuted and weighed straw sample was placed in an incineration crucible of known mass. Samples of 5 g were used in the study and weighed on a balance with an accuracy of 0.0001 g. The test sample was ashed at a temperature of 805 °C during a two-hour process. The resulting content was placed in an extractor for cooling. Next step, the mass of the crucible and its ash content were determined. Determination of the ash content (Zp) consists in determining the quotient of numbers, in dividend the difference of the mass of the crucible with the resulting ash (m3) and the weight of the empty crucible (m1) in grams, by the difference in the weight of the crucible filled with the wood biomass sample (m2) and the mass of the empty crucible (m1), where the obtained value was multiplied by 100%. Percentage of ash in the sample (Zp) was written in the form of an Equation [6]:
Z p = m 3 m 1 m 2 m 1 100 % ,

2.5. Measurements of Py-GC/MS

The analysis of components was performed using a Shimadzu (Kyoto, Japan) gas chromatograph GC-2010 connected to the pyrolizer Frontier linked to GC/MS-QP2010 mass spectrometer. An ultra-alloy capillary column with a length of 30 m, a diameter of 0.25 mm, and a deposit of 0.25 µm was used. Samples were introduced to the column with the pyrolizer in different temperatures. The samples were analyzed by a dedicated program—GC/MS solution Version 2.72. The peaks were identified with NIST11 and NIST11b libraries.
The gas chromatograph-mass spectrometry (GC/MS) analysis program was set as follows: temperature, 85 °C maintained for 0.5 min, increased to 145 °C at 15 °C/min rate, maintained for 15 min. Then increased to 200 °C at 10 °C/min rate and maintained for 15 min, increased to 300 °C at 10 °C/min rate, maintained for 25 min. The gas flow rate was 0.97 mL/min, and the detector voltage of 0.9 kV. The carrier gas was helium (PGNiG, Warsaw, Poland). During the measurements of Py-GC/MS the burning wood temperature and time process have been taken into account in order to determine the pyrolysis of the analyzed material. In the process of burning renewable fuel, four stages can be noticed in which relevant chemical processes take place. It should be noted that the boundaries between them interpenetrate, overlap and move during the pyrolysis process itself. The burning fuel temperature stages were presented in Table 1.

2.6. Electrical Energy and Heat Measurements

Electrical energy power was measured at the output of the electricity generator. Heat amount was measured for the hot air which was leaving the turbine. It was done together with a temperature measurement. The volume of electricity produced generated with the AI-20 turbine was measured at the output of the electric generator (model) using. The amount of heat generated was measured at the hot air output from the turbine using a J-type thermocouple (Fe-CuNi) [PN-EN 60584-1] was used to measure the temperature. The controller made it possible to set the desired temperature and its digital readout with an accuracy equal to 1% of the measuring range. The temperature was measured with a frequency of 0.33 Hz. Temperature and gas flow were measured to determine the heating capacity of the turbine.

3. Results

3.1. Measurement of Selected Substances

Laboratory tests were carried out to determine the physical parameters of the analyzed materials. The table lists the values of the measured substances in terms of lower and higher heating value, ash, moisture and ash amount for 80% work during the year. In the last case, it was assumed that 80% of the time during the year will be equivalent to 6400 h. The biomass fuels and their properties were presented in Table 2.
Table 3 presented the biomass consumption by the line together with ash production amount according to different biomass fuels implementation. Results were presented for fuel consumption by the line per one hour (dry fuel amount consumption and ash production from biomass) and per one year with the assumption of working 6400 h per year (80% of the year). The rest time of the year is predicted for the line services.
The above tables show the test results of various substances that can be considered as biomass. Biomass is an organic waste material generated by the processes of the agricultural or forestry industry. It can also be obtained directly from agricultural crops, forest waste or as a by-product of agri-food processing (e.g., straw or waste from horticultural production). In a solid state of aggregation, biomass is a substance used as an energy carrier and can be used for heating purposes and, consequently, also for energy purposes [29].
The general problem during industrial co-combustion is the ash content [21,30]. The situation is a result of the fraction size in the combustion of coal and biomass. Therefore, micronization is a way to adapt the form of biomass to the smallest solid fractions [21]. The conducted research shows that the analyzed substances had a low ash content, ranging from 1.2% to 4.7%. The ash from biomass can be used as a fertilizer for agricultural crop production.

3.2. Characteristics of the Block Diagram

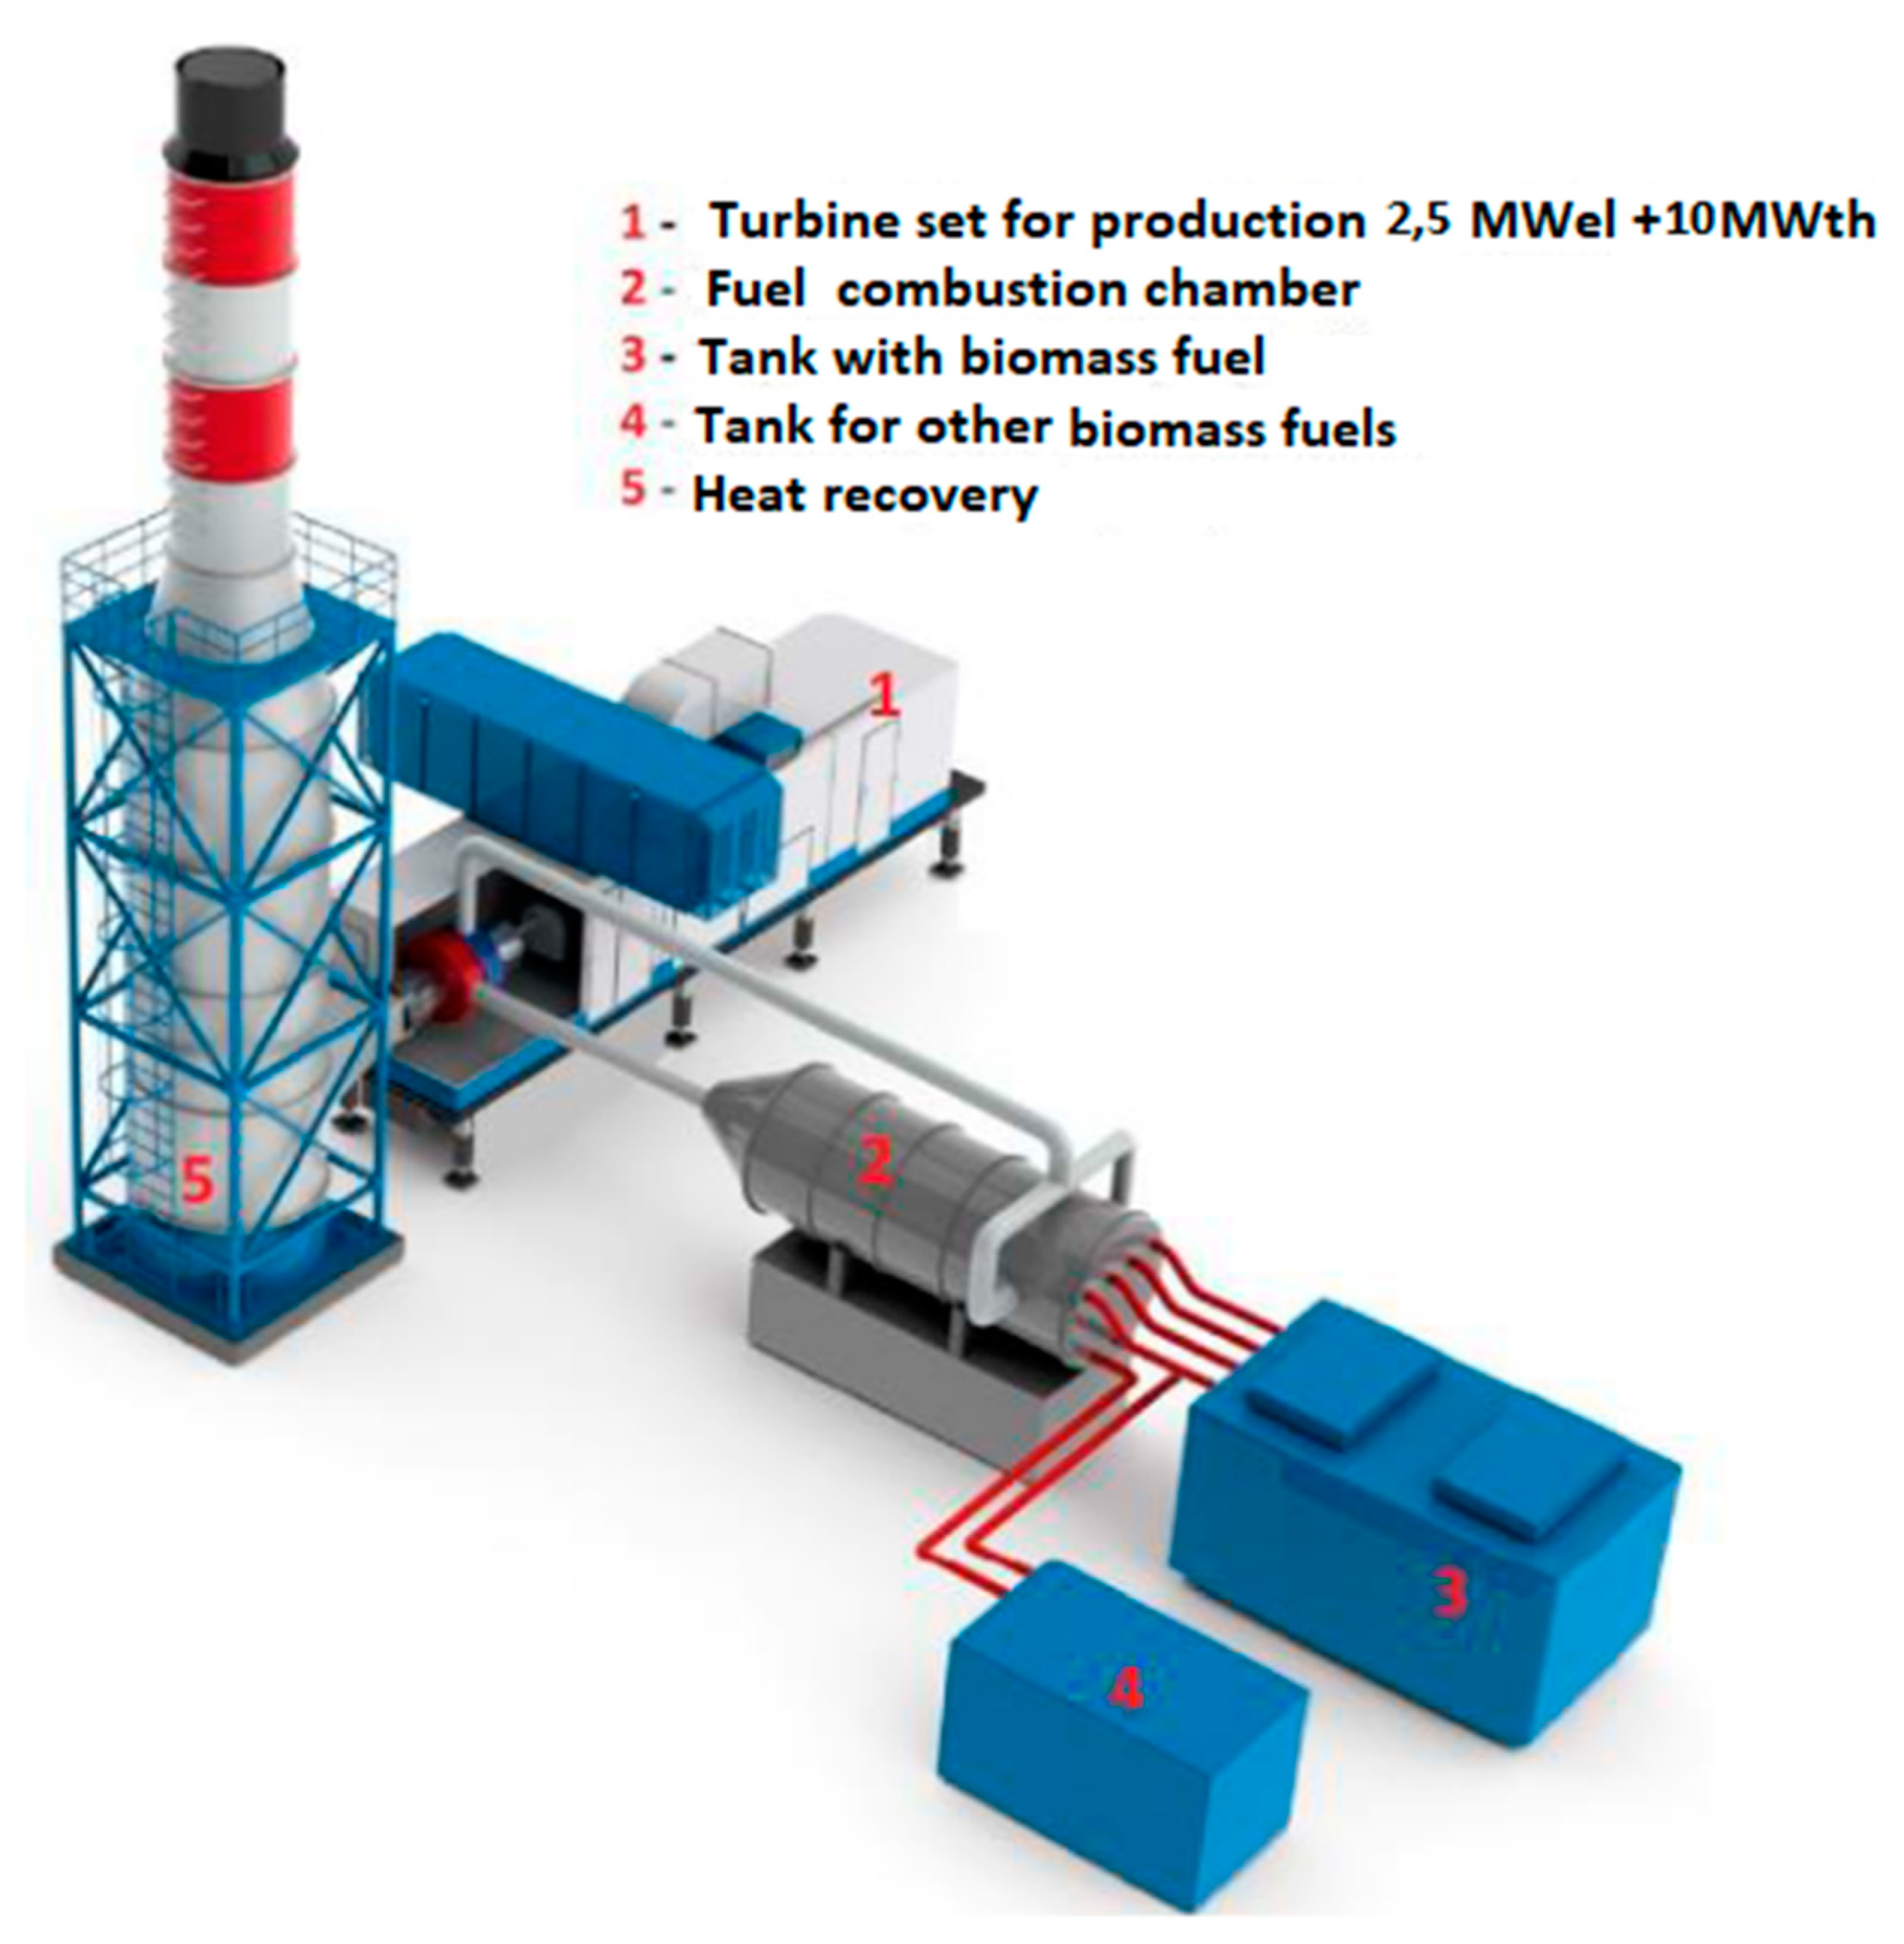
During the article studies, all of the materials were analyzed in the context of possibility of energetic use. After compiling the results, it turns out that the calorific value was on a similar level. Due to the previous results (ash content, etc.) its universality for wheat straw was selected for the next stage of the research as a material of interest. Otherwise, according to the research results, the selection of wheat straw was determined by its surplus in agriculture and its use for fodder and bedding for animals. The block diagram of the line for electricity and heat production from micronized biomass is presented in Figure 2. Presented are the measured electrical energy power (2.5 MW) and heat power (10 MW) in the shape of air temperature of 400 °C.

3.3. Measurements of Py-GC/MS

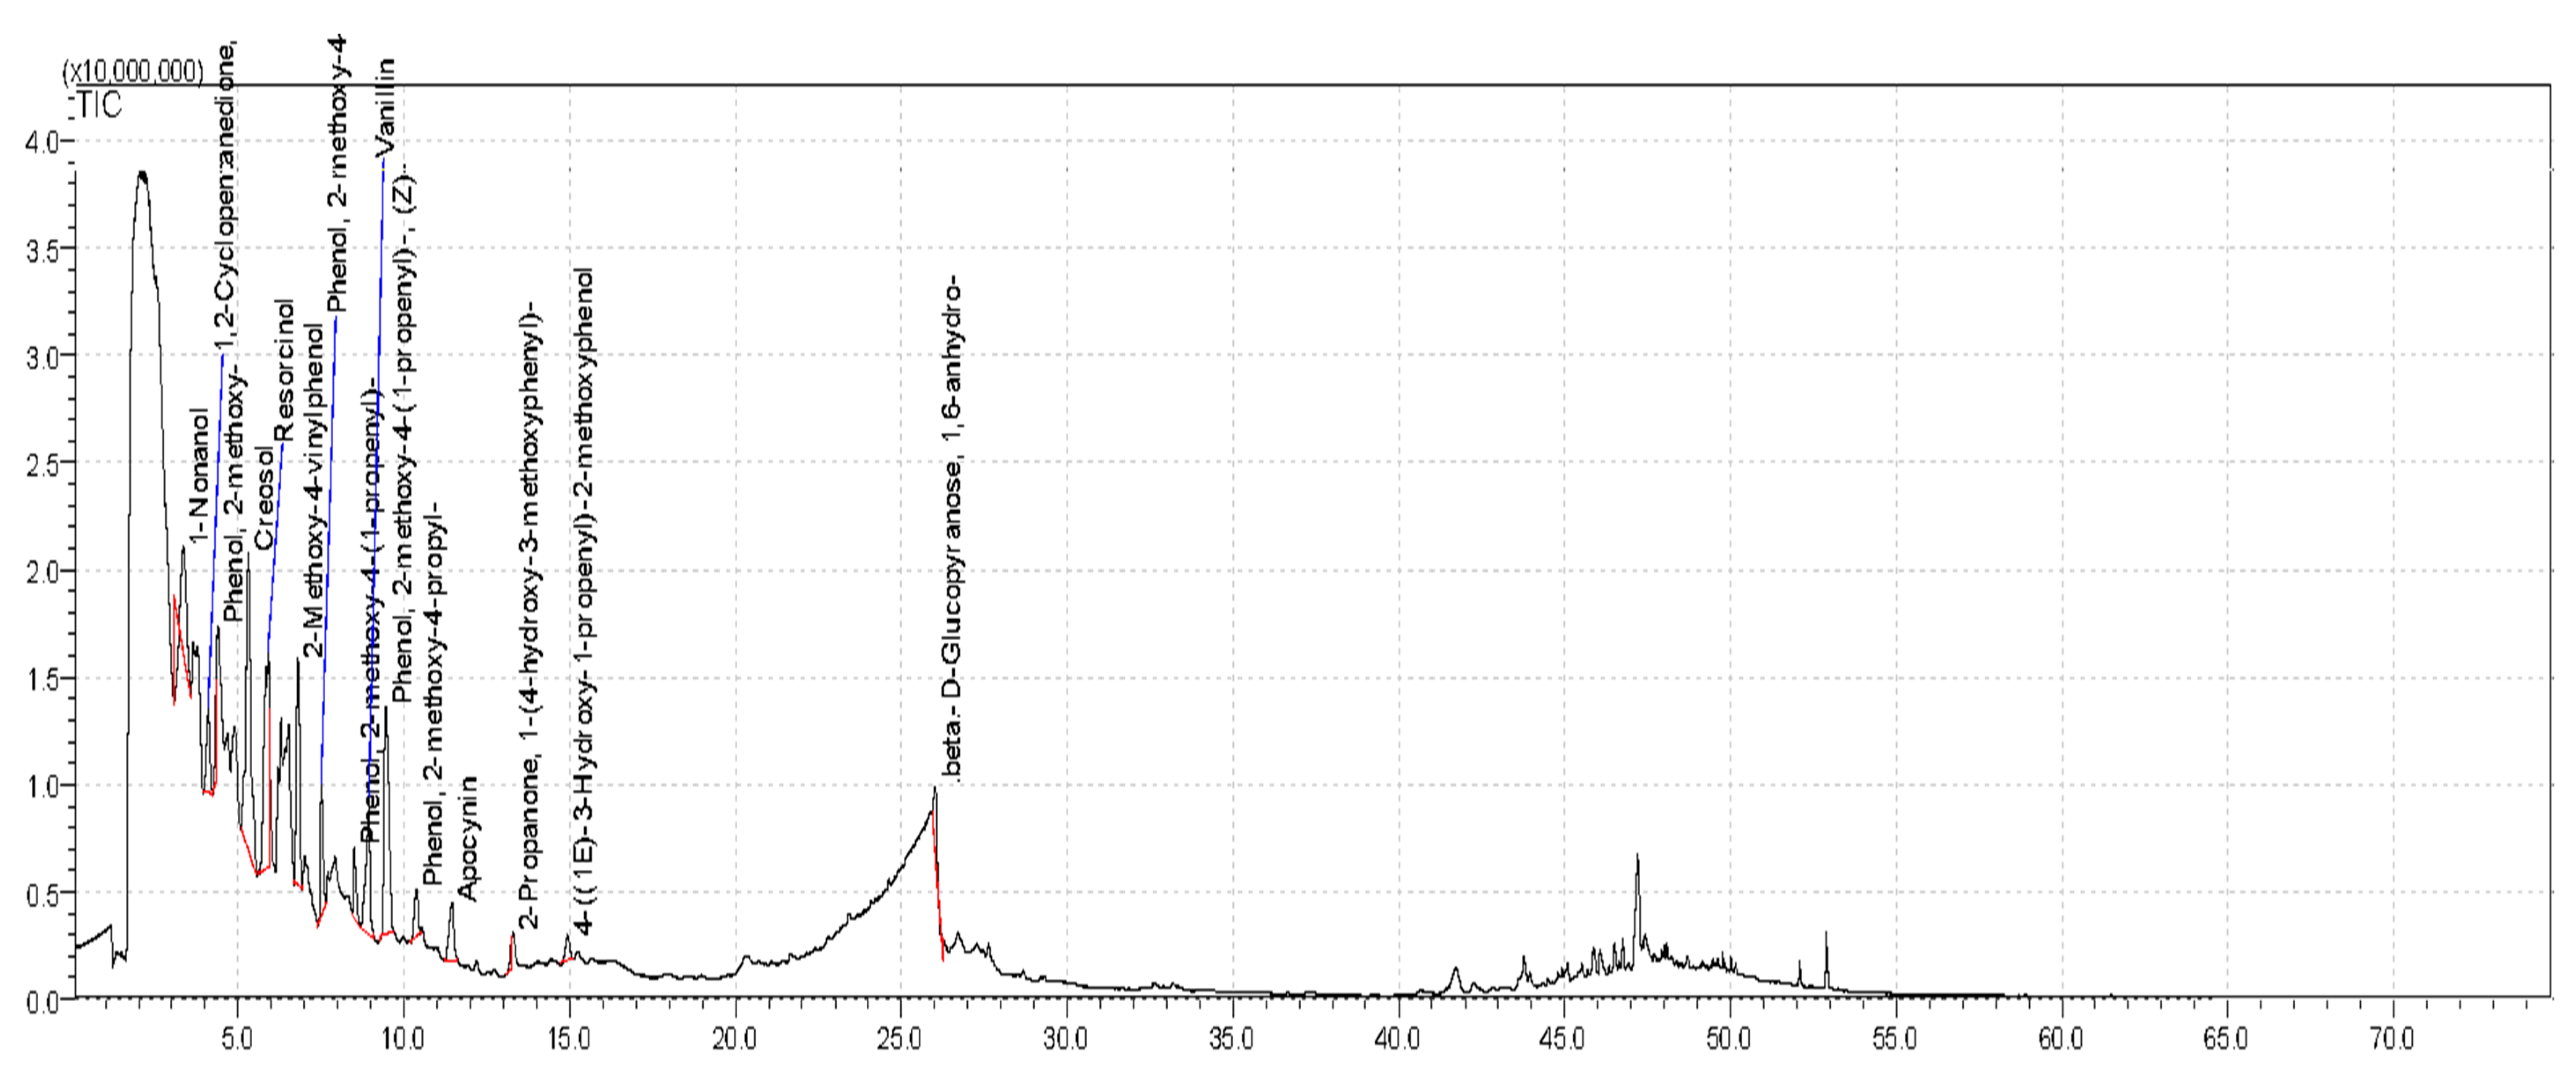
The pyrolysis of wheat straw was performed in two temperatures 350 and 450 °C, to determine the release of substances by simulating the environment of electricity and heat production in prepared block. The analysis of the composition of the obtained extracts was carried out using a Shimadzu gas chromatograph with a GC/MS QP 2010 Ultra mass spectrometer. In analysis conditions can be specified by ZB-5MS column 30 m × 0.25 mm ID × 0.25 μm df, in which helium (5.0) was the carrier gas. The number of marked extractives in wheat straw was dependent on the altitude of temperatures. The results of the isolated substances after pyrolysis in 350 and 450 °C is presented on the Figure 3 and Figure 4 as well in the Table 4 and Table 5.
When providing analysis of the above figures and tables, it can be noticed that combustion of wheat straw, in temperatures in the range between 350 and 450 °C, gives different results. In the case of using higher burning temperature (450 °C), there are 15 released substances. In the case of combustion at lower temperature (350 °C), there were only nine.

3.4. Design and Construction Production Line

Figure 5 presents the line visualization after the end of design works.
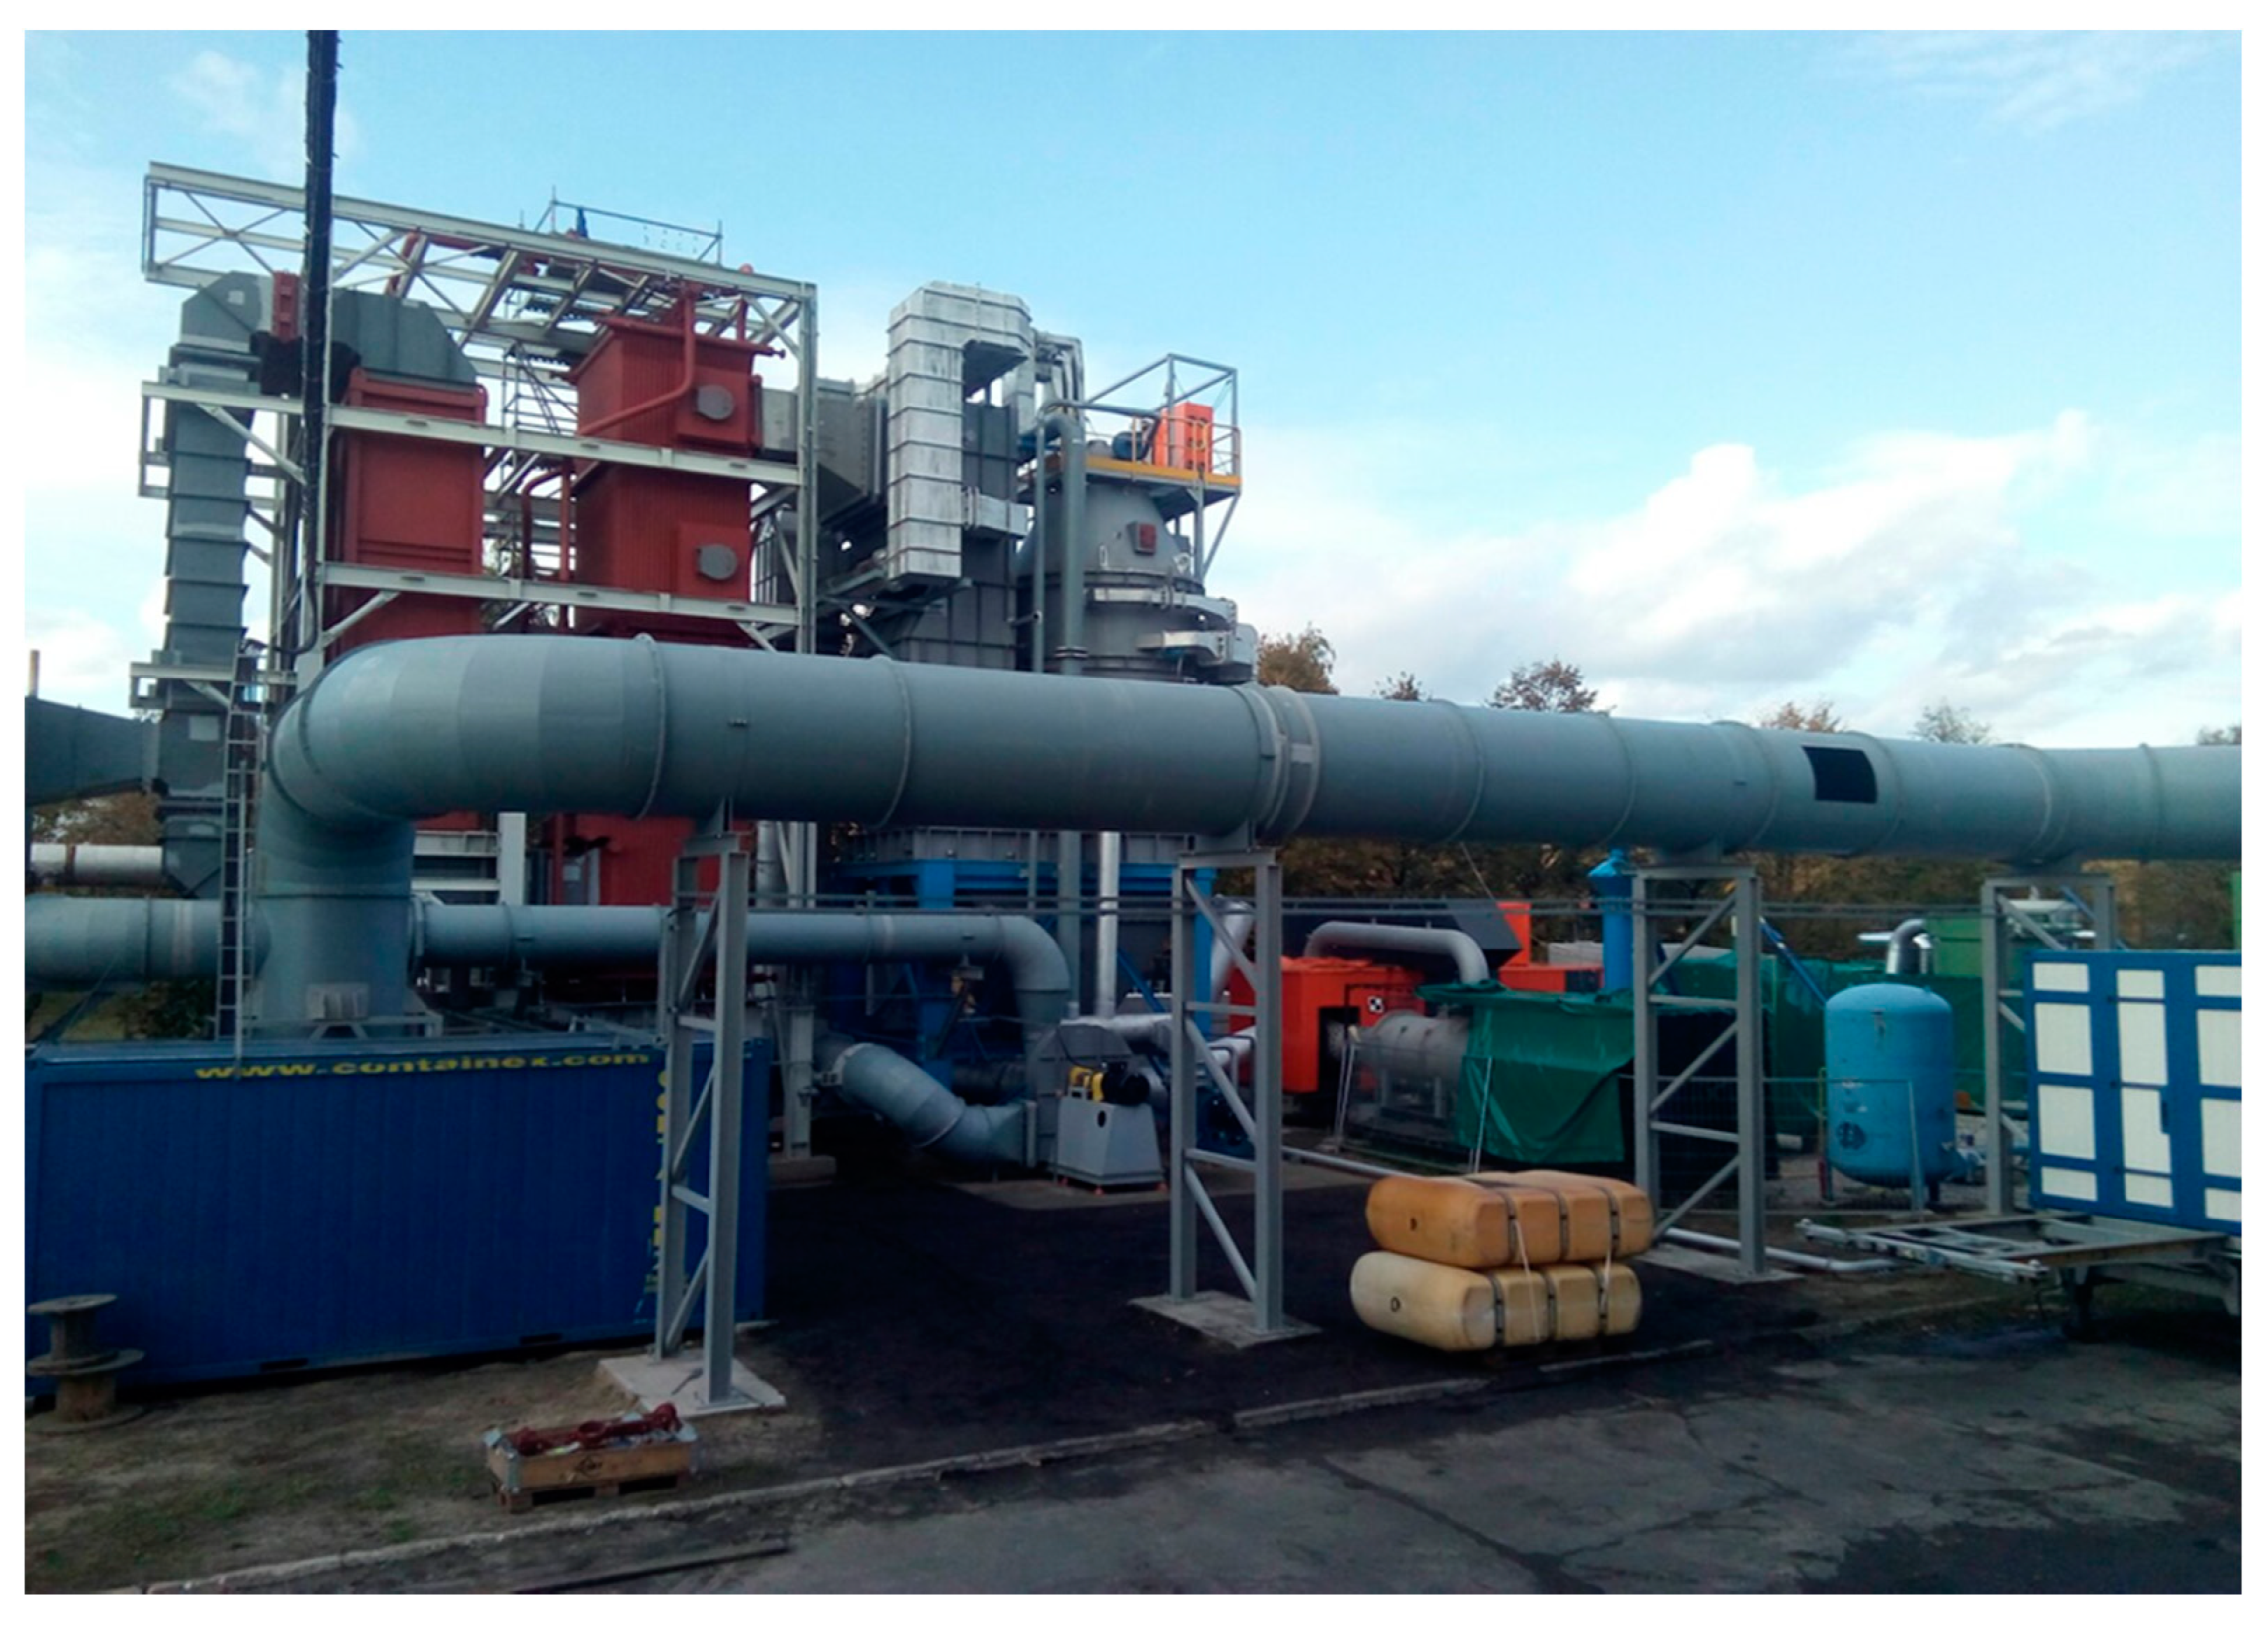
Figure 6 presents picture of the biomass power plant during construction. Figure 7 presents picture of the biomass power plant after construction with additional equipment that was needed to link the line with the energetical infrastructure of the Thermal Power Engineering Company in Karczew (Poland).

4. Discussion

In the widespread trend of using biomass in the energy sector, various expenses apply to production in terms of costs and electricity. High economic and ecological efficiency are the main factors determining the power dedicated to biomass in energy capacity [31,32,33]. Reducing the consumption of fossil fuels allows to stimulate the development of the biofuels and biocomponents as possibility to exchange fossil fuels and reduce emissions of harmful substances into the atmosphere.
Reducing the consumption of fossil fuels allows to stimulate the development of the biofuels and biocomponents as a possibility to exchange fossil fuels and reduce emissions of harmful substances into the atmosphere [34]. Compared with data in the literature [35], all biomass except poplar (7.21 MJ/kg) had higher calorific value than brown coal (8.12 MJ/kg) and municipal waste (about 10.5 MJ/kg). In contrast, hard coal has a market potential [36,37]. Industrial co-combustion of biomass with coal may be another alternative higher calorific value than biomass of approximately 22.78 MJ/kg [35].
The compounds formed during biomass gasification depend on the process temperature, and the chemical composition of the biomass used in the process [27]. The most favorable calorific value from the investigated biomass was characterized by the highest number of substances during anaerobic combustion at temperature 450 °C. Although most substances can be extracted at a higher temperature, some of them were visible for both temperature ranges. For example, in both temperatures 1,6-anhydro-beta-D-glucopyranose can be observed. It should be remembered that not only the content of substances in a given species is important, but also their toxicity, which affects activity the enzyme inhibitory. Vanillin isolated due to the decomposition of lignin was observed during pyrolysis at a temperature of 350 °C. All the substances listed can be biorefined for the purpose of preparing a properly selected fuel, but this is a topic for further scientific discussion. The compounds formed during biomass pyrolysis depend on the process temperature and the type and chemical composition of the biomass. Higher process temperatures degrade the high molecular weight compounds contained in the lignocellulosic biomass, resulting in the formation of low molecular weight derivatives of these compounds [38]. Pyrolysis of biomass is now considered as one of the methods to produce high energy fuels [39,40]. The use of a system without liquefaction of the gasified compounds increases the efficiency and cost-effectiveness of the process (no costs are incurred for cooling the gas obtained).
Market analysis based on 2010 data and their modelling indicates that with CO2 emission costs assumed at $99 in 2050, biomass energy production will be around 150 EJ. In 2010, energy production based on fossil fuels was approximately 138 EJ for coal, 171 EJ for oil, and 106 EJ for natural gas [41]. An additional influence on limiting energy production from fossil fuels in the EU is the introduction of the RED II directive [42], which tightens the emission policy in relation to the Kyoto arrangements.
The cost of a biomass-based energy production installation (heat and electricity) varies and depends among other things on the technology used and the country in which it is to be located [43]. The core of technology elaborated in BioCHP project was implementation of AI-20 engine accommodated to use micronized biomass as fuel. The power biomass line could produce 2.5 MW electrical energy and 10 MW heat. It is quite a new approach to electrical energy and heat production which has no direct references in literature. It can be presented together with known technology such as traditional electricity production using solid fuel turbine. Traditional electricity production is usually provided by the steam turbine in big electropower stations fueled by solid fuels as coal or lignite. These power plants are produced by General Electric or Runh Power Corp., Ltd. The price of completed BioCHP line was $2.27 million USD. Presented in comparison with other solutions, it was approximately two times cheaper compare to traditional electricity production line. The BioCHP line is not equipped with a steam boiler and system of steam supply to the steam turbine. However, this line has very high ability for accommodation, to other fuels than micronized biomass such as for example biogas, natural gas, vegetable oil, processed vegetable oil, and different types of mineral oils. Such flexibility of fuel supply is important for the line operator in periods, when biomass supply suddenly stops. Then, the power line can work with the use of other fuels different than micronized biomass. The main position in BioCHP power line exploitation costs are fuel costs. According to information from 2020 National Statistic Office straw biomass price was equal 33.33–44.44 USD/t at the gate of power line (average price 38.89 USD/t, exchange course 4.5 PLN/USD). Prices were calculated for big rectangle straw ballots with the dimension of 120 × 130 × 90 cm and mass about 600 kg/ballot. Straw costs should provide $0.54 million USD/year, with consumption of 14 thousand t/year of straw for the one installation. The BioCHP installation which runs on straw has an advantage over other traditional installations running on coal, that there are no additional costs for emission of CO2.

5. Conclusions

The process of micronization and production of electricity and heat from biomass wastes based on a converted aircraft turbine AI-20 was analyzed in this research. Apart from the technical approach, a chemical analysis was also provided. Improving the activities performed within the production structure consists in analyzing and adjusting the processes taking place within a given flow in the enterprise. The method of linking individual machine modules in the field of electricity and heat production creates a certain concept of the flow of fuel between the segments during the production cycle. The organization of production and the type of individual phases of the production process have a great influence on the form of flow. Depending on the material burned, it can increase or decrease production efficiency, in particular when the machines are working in cogeneration. This type of device, depending on the raw material used, allows to reduce the emission of greenhouse gases into the atmosphere and does not pay emission costs.

Author Contributions

Conceptualization, K.R. and J.B.; methodology, K.R., M.H, D.S and J.S.; vali-dation, K.R., D.S. and J.S.; formal analysis, K.R., D.S. and J.S.; in-vestigation, K.R., J.B., M.H., D.S. and J.S.; resources, K.R. and D.S.; data curation, J.B., D.S., and J.S.; writing—original draft preparation, K.R. and D.S.; writing—review and editing, K.R., D.S and J.S.; visualization, K.R., and M.H.; supervision, K.R.; project administration, K.R., and J.B.; funding acquisition, K.R. and J.B. All authors have read and agreed to the published version of the manuscript.

Funding

This research received no external funding.

Institutional Review Board Statement

Not applicable.

Informed Consent Statement

Not applicable.

Data Availability Statement

Not applicable.

Acknowledgments

Part of this work as co-financed by the National (Polish) Centre for Research and Development (NCBiR), entitled “Environment, agriculture and forestry” – BIOSTRATEG I. It was carried out as part of the project “Research and Implementation’s Preparatory Work for the Technology of Electricity and Heat Generation Technology at Boiler Powered by Micronized Biomass” (acronym BioCHP), No BIOSTRATEG1/270684/1/NCBR/2015.

Conflicts of Interest

The authors declare no conflict of interest.

References

  1. Siddiqui, S.; Friedman, D.; Alper, J. Opportunities and Obstacles in Large-Scale Biomass Utilization: The Role of the Chemical Sciences and Engineering Communities: A Workshop Summary; The National Academies Press: Washington, DC, USA, 2012; p. 60. Available online: https://www.ncbi.nlm.nih.gov/books/NBK115434/pdf/Bookshelf_NBK115434.pdf (accessed on 12 March 2020).
  2. Wickwire, S. Biomass Combined Heat and Power Catalog of Technologies U. S. Environmental Protection Agency Combined Heat and Power Partnership. 2007; p. 122. Available online: https://www.epa.gov/sites/production/files/2015-07/documents/biomass_combined_heat_and_power_catalog_of_technologies_v.1.1.pdf (accessed on 20 April 2020).
  3. Bridgwater, A.V.; Alcala, A.; Gyftopoulou, M.E. Biomass-based small and micro combined heat and power (CHP) systems: Application and status in the United Kingdom. In Small and Micro Combined Heat and Power (CHP) Systems; Woodhead Publishing Series in Energy: Sawston, UK, 2011; pp. 427–458. [Google Scholar]
  4. Freiberg, A.; Scharfe, J.; Murta, V.C.; Seidler, A. The use of biomass for electricity generation: A scoping review of health effects on humans in residential and occupational settings. Int. J. Environ. Res. Public Health 2018, 15, 354. [Google Scholar] [CrossRef] [Green Version]
  5. Durlik, I. Inżynieria Zarządzania cz. I, 7th ed.; Placet: Warsaw, Poland, 2007; p. 311. ISBN 9788374881142. [Google Scholar]
  6. Brilman, J. Nowoczesne Koncepcje i Metody Zarządzania; Polskie Wydawnictwo Ekonomiczne: Warsaw, Poland, 2001; p. 478. [Google Scholar]
  7. Borowski, P.F. Development strategies for electric utilities. Acta Energetica 2016, 4, 16–21. [Google Scholar] [CrossRef]
  8. IEA. Energy Policies of IEA Countries: Poland 2016 Review. Country Report—January 2017; International Energy Agency. 2017. Available online: https://www.apgef.com/wp-content/uploads/2017/03/Energy_Policies_of_IEA_Countries_Poland_2016_Review.pdf (accessed on 1 October 2020).
  9. Browers, H.; Oei, P. The political economy of coal in Poland: Drivers and barriers for a shift away from fossil fuels. Energy Policy 2020, 144, 111621. [Google Scholar] [CrossRef]
  10. Gawlik, L. The Polish power industry in energy transformation process. Miner. Econ. 2017, 31, 229–237. [Google Scholar] [CrossRef] [Green Version]
  11. Gradziuk, P.; Gradziuk, B. Renewable energy sources as a development opportunity for peripheral areas. Econ. Reg. Stud. 2020, 13, 184–198. [Google Scholar] [CrossRef]
  12. PAP. Morawiecki: Agreement with Miners—A Breakthrough Polish Press Agency. 2020. (in Polish). Available online: https://www.pap.pl/en/news/news,507650,unions-coal-company-reach-accord-on-polish-mining-group.html (accessed on 1 October 2020).
  13. PSE. The Achieved Power Structure in National Power Grid State on the 31.12.2019; Report of KSE. 2020. (in Polish). Available online: https://www.pse.pl/dane-systemowe/funkcjonowanie-rb/raporty-roczne-z-funkcjonowania-kse-za-rok/raporty-za-rok-2019#t1_1 (accessed on 1 October 2020).
  14. Baum, R.; Wajszczuk, K.; Pepliński, B.; Wawrzynowicz, J. Potential for agricultural biomass production for energy purposes in Poland: A review. Contemp. Econ. 2013, 7, 63–74. [Google Scholar]
  15. Nurek, T.; Gendek, A.; Roman, K.; Dąbrowska, M. The impact of fractional composition on the mechanical properties of agglomerated logging residues. Sustainability 2020, 12, 6120. [Google Scholar] [CrossRef]
  16. Nurek, T.; Gendek, A.; Roman, K. Forest residues as a renewable source of energy: Elemental composition and physical properties. BioResources 2020, 14, 6–20. [Google Scholar] [CrossRef]
  17. Krzyżaniak, M.; Stolarski, M.J.; Warmiński, K. Life cycle assessment of poplar production: Environmental impact of different soil enrichment methods. J. Clean. Prod. 2019, 206, 785–796. [Google Scholar] [CrossRef]
  18. Aberilla, J.M.; Gallego-Schmid, A.; Azapagic, A. Environmental sustainability of small-scale biomass power technologies for agricultural communities in developing countries. Renew. Energy 2019, 141, 493–506. [Google Scholar] [CrossRef]
  19. Rikkonen, P.; Tapio, P.; Rintamaki, H. Visions for small-scale renewable energy production on Finnish farms—A Delphi study on the opportunities for new business. Energy Policy 2019, 129, 939–948. [Google Scholar] [CrossRef]
  20. Kishore, V.; Bhandari, P.M.; Gupta, P. Biomass energy technologies for rural infrastructure and village power—Opportunities and challenges in the context of global climate change concerns. Energy Policy 2004, 32, 801–810. [Google Scholar] [CrossRef]
  21. Flizikowski, J.; Topoliński, T.; Opielak, M.; Tomporowski, A.; Mroziński, A. Badania i analiza eksploatacyjnych charakterystyk mikronizatora. Energetycznej Biomasy 2015, 7, 1. [Google Scholar]
  22. PN-EN 13183-1:2004. Wilgotność Sztuki Tarcicy—Część 1: Oznaczanie Wilgotności Metodą Suszarkowo-Wagową. Available online: https://sklep.pkn.pl/pn-en-13183-1-2004p.html (accessed on 5 May 2020).
  23. Grzybek, A.; Kowalczyk, K.; Janicka, A. Dobór Technologii Wykorzystującej Biomasę do Produkcji Energii; CMOLAS: Cmolas, Poland, 2007; p. 20. [Google Scholar]
  24. Babiarz, M.; Bednarczuk, Ł. Popiół ze spalania biomasy i jego wykorzystanie. WPIA AGH, p.3. Available online: http://home.agh.edu.pl/~madrygas/Surowce%20energetyczne%20i%20paliwa%20-%20laboratorium/Stale/Cw%203.%20Cieplo%20spalania%20i%20wartosc%20opalowa%20paliw%20stalych.pdf (accessed on 6 May 2020).
  25. Politechnika Warszawska. Technologia Chemiczna—Surowce i Nośniki Energii; Politechnika Warszawska: Warsaw, Poland, 2010; p. 4. [Google Scholar]
  26. Nurek, T.; Roman, K.K. Effect of mineral matter content on specific density of forest biomass. Ann. Warsaw Univ. Life Sci. SGGW Agricult. Agricult. Forest Eng. 2014, 64, 109–116. [Google Scholar]
  27. Roman, K. Selection of Technical Parameters of the Forest Biomass Briqueling Process. Ph.D. Thesis, Warsaw University of Life Sciences (WULS), Warsaw, Poland, 2017; p. 138. [Google Scholar]
  28. Diab, T.M.; Haelssig, J.B.; Pegg, J.M. The behaviour of wood crib fires under free burning and fire whirl conditions. Fire Safety J. 2020, 112, 102941. [Google Scholar] [CrossRef]
  29. Kowalska, G.B.; Kacprowska, J.; Gogacz, I.; Jurgaś, A. Energia ze Źródeł Odnawialnych r; GUS: Warsaw, Poland, 2012; pp. 13–14. [Google Scholar]
  30. Błasiak, W.; Moberg, G.; Grimbrandt, J. Redukcja tlenków azotu oraz optymalizacja spalania w komorach kotłów za pomocą asymetrycznego systemu podawania powietrza wtórnego. In Proceedings of the 10 Międzynarodowa Konferencja Technik Grzewczych, Gothenburg, Sweeden, 13–18 August 2006. [Google Scholar]
  31. Pasyniuk, P. Prawne, Technologiczne, Środowiskowe i Ekonomiczne Uwarunkowania Rozwoju Produkcji Odnawialnych Źródeł Energii w Polsce Opartych na Biomasie Pochodzenia Rolniczego; IBMER: Warsaw, Poland, 2008; p. 12. [Google Scholar]
  32. Borowski, P.F. Zonal and nodal models of energy market in European Union. Energies 2020, 13, 4182. [Google Scholar] [CrossRef]
  33. Kupczyk, A.; Mączyńska-Sęczek, J.; Golisz, E.; Borowski, P.F. Renewable energy sources in transport on the example of methyl esters and bioethanol. Processes 2020, 8, 1610. [Google Scholar] [CrossRef]
  34. Borowski, P. Development strategy of electricity production from biomass. In Proceedings of the International Congress on Mechanization and Energy in Agricultural, Antalya, Turkey, 14–17 October 2008; pp. 438–440. [Google Scholar]
  35. KOBIZE. Wartości Opałowe (WO) i Wskaźniki Emisji CO2 (WE) w Roku 2016 do Raportowania w Ramach Systemu Handlu Uprawnieniami do Emisji za rok 2019. 2018. Available online: https://www.kobize.pl/uploads/materialy/WO_i_WE_do_monitorowania-ETS-2019.pdf (accessed on 23 May 2020).
  36. ECiZ. Energetyka Cieplna i Zawodowa; 3/2010 (448) 2010; ECiZ: Warsaw, Poland, 2010; p. 41, ISSN 1734-7823. [Google Scholar]
  37. Borowski, P.F. Nexus between water, energy, food and climate change as challenges facing the modern global, European and Polish economy. AIMS Geosci. 2020, 6, 397–421. [Google Scholar] [CrossRef]
  38. Feledyn-Szewczyk, B.; Radzikowski, P.; Stalenga, J.; Matyka, M. Comparison of the effect of perennial energy crops and arable crops on earthworm populations. Agronomy 2019, 9, 675. [Google Scholar] [CrossRef] [Green Version]
  39. U.S. Department of Energy Federal Energy Management Program (FEMP). Biomass for Electricity Generation. 2016. Available online: https://www.wbdg.org/resources/biomass-electricity-generation (accessed on 4 October 2020).
  40. Hryniewicz, M.; Grzybek, A. Straw surplus accessible for Energy purposes in 2016. Prob. Agricult. Eng. 2017, 97, 15–31. (In Polish) [Google Scholar]
  41. 2050 Long-Term Strategy. Available online: https://ec.europa.eu/clima/policies/strategies/2050_en (accessed on 22 March 2020).
  42. Renewable Energy—Recast to 2030 (RED II). Available online: https://ec.europa.eu/jrc/en/jec/renewable-energy-recast-2030-red-ii#:~:text=In%20December%202018,%20the%20revised%20renewable%20energy%20directive,consumption%20by%202030%20has%20been%20raised%20to%2032% (accessed on 12 December 2020).
  43. Raslavičius, L.; Grzybek, A.; Dubrovin, V. Bioenergy in Ukraine-Possibilities of rural development and opportunities for local communities. Energy Policy 2011, 39, 3370–3379. [Google Scholar] [CrossRef]
Figure 1. The technical drawing of the micronizer nozzle.
Processes 09 00364 g001
Figure 2. The block diagram for electricity and heat production.
Processes 09 00364 g002
Figure 3. Emissions of isolated substances after pyrolysis in 350 °C.
Processes 09 00364 g003
Figure 4. Emissions of isolated substances after pyrolysis at 450 °C.
Processes 09 00364 g004
Figure 5. Visualization of the biomass power production line.
Processes 09 00364 g005
Figure 6. The biomass power plant during construction.
Processes 09 00364 g006
Figure 7. The biomass power plant after construction.
Processes 09 00364 g007
Table 1. The burning fuel temperature stages were presented in Table 1.
StageTemperature °C
Drying100 1
Gasificationabout 200 1
Burningabout 400 1,2
Burning charcoal>500 1
1 Reference [27], 2 Reference [28].
Table 2. Biofuels and their properties including the amount of ash produced during a specific operating time (6400 h).
Material (Name)Lower Heating Value
(MJ/kg)
Ash
(%)
Moisture
(%)
Higher Heating Value
(MJ/kg)
Ash Amount for 80% Work during Year
(6400 h)(t)
Sunflower husk17.274.099.4118.52448
Oat husk15.161.8911.7616.58230
Wheat straw16.741.7012.0818.05186
Miscanthus16.721.2011.8318.91134
Hay17.105.7020.0018.20557
Wood chips10.400.8040.0019.4096
Willow15.301.4519.0219.47160
Poplar7.824.7048.809.37640
Table 3. Fuels consumption and ash production for different types of biofuels.
MaterialFuel AmountDry Fuel AmountAsh AmountFuel Amount per YearAsh Amount Created per Year
(Name)(t h−1)(t h−1 d.m.)(kg h−1)(t year−1)(kg year−1)
Sunflower husk1.91.77012 160448,000
Oat husk2.21.93614 080230,400
Wheat straw1.91.72912 160185,600
Miscanthus1.91.72112 160134,400
Hay1.91.58712 160556,800
Wood chips3.11.91519 84096,000
Willow2.11.72513 440160,000
Poplar4.22.110026 880640,000
Table 4. Juxtaposition of emissions of isolated substances, 350 °C.
Substance NameRetention TimeBeginning of Retention Time End of Retention Time Area Area % Height Height % Height Ratio of Area to Height
5-Hydroxymethylfurfural6.3025.9706.65358,223,80513.953,103,75713.5618.76
4-Hydroxy-3-methylacetophenone6.7476.5937.15833,636,4298.062,712,50711.8512.40
3-Allyl-6-methoxyphenol7.4787.2927.6057,841,8981.881,299,0145.676.04
trans-Isoeugenol9.3699.2689.73050,166,01212.025,457,47323.849.19
Phenol, 2-methoxy-4-propyl-10.20610.02710.3838,757,9892.101,327,8235.806.60
Propan-2-one, 1-(4-isopropoxy-3-methoxyphenyl)-13.13012.85013.43010,909,2202.61912,7063.9911.95
2-Propenal, 3-(4-hydroxy-3-methoxyphenyl)-23.10822.74323.32219,921,3804.771,563,9936.8312.74
.beta.-D-Glucopyranose, 1,6-anhydro-26.88525.86327.4532,21×10852.896,079,67826.5436.30
3-(3-Hydroxy-4-methoxyphenyl)-l-alanine41.64841.33841.9027,171,3241.72438,9291.9216.34
Table 5. Juxtaposition of emissions of isolated substances, 450 °C.
Substance NameRetention TimeBeginning of Retention Time End of Retention Time Area Area % Height Height % Height Ratio of Area to Height
1-Nonanol3.3383.0723.57829,843,4094.454,760,5295.586.27
1,2-Cyclopentanedione, 3-methyl-4.1063.9554.23727,646,0104.124,011,6574.706.89
Phenol, 2-methoxy-4.3304.2254.3308,159,1691.224,719,8405.531.73
Creosol5.3125.0955.553142,920,66721.3013,877,47816.2510.30
Resorcinol5.9185.6355.943105,583,21515.7410,047,24111.7810.51
2-Methoxy-4-vinylphenol6.8026.6836.95070,451,49010.5010,534,47712.356.69
Phenol, 2-methoxy-4-(2-propenyl)-, acetate7.5047.3907.66230,076,1574.486,236,7437.314.82
Phenol, 2-methoxy-4-(1-propenyl)-8.5008.4238.68717,917,0742.673,273,6833.845.47
Vanillin8.9498.6879.08053,563,9727.986,441,1237.558.32
Phenol, 2-methoxy-4-(1-propenyl)-, (Z)-9.4539.2809.688106,849,80815.9310,662,93212.5010.02
Phenol, 2-methoxy-4-propyl-10.37610.20210.49715,976,6002.382,157,4162.537.41
Apocynin11.44011.24211.61025,925,6243.862,682,2913.149.67
2-Propanone, 1-(4-hydroxy-3-methoxyphenyl)-13.25813.07513.2585,674,6770.851,557,6161.833.64
4-((1E)-3-Hydroxy-1-propenyl)-2-methoxyphenol14.94714.73315.10010,811,3081.611,204,0651.418.98
.beta.-D-Glucopyranose, 1,6-anhydro-26.01825.92826.27319,509,5012.913,159,5303.706.17
Publisher’s Note: MDPI stays neutral with regard to jurisdictional claims in published maps and institutional affiliations.