Article

Techno-Economic Analysis of a Hyaluronic Acid Production Process Utilizing Streptococcal Fermentation

by
Rafael G. Ferreira
1,*,
Adriano R. Azzoni
2,
Maria Helena Andrade Santana
3 and
Demetri Petrides
4
1
Intelligen Brasil, Av. Angélica 1905, São Paulo 01227-200, Brazil
2
Departamento de Engenharia Química, Escola Politécnica, Universidade de São Paulo, Av. Prof. Lineu Prestes 580, São Paulo 05508-000, Brazil
3
Faculdade de Engenharia Química, Universidade Estadual de Campinas, Av. Albert Einstein 500, Campinas 13083-852, Brazil
4
Intelligen Inc., 2326 Morse Avenue, Scotch Plains, NJ 07076, USA
*
Author to whom correspondence should be addressed.
Processes 2021, 9(2), 241; https://doi.org/10.3390/pr9020241
Submission received: 1 January 2021 / Revised: 20 January 2021 / Accepted: 24 January 2021 / Published: 28 January 2021
(This article belongs to the Special Issue Novel Processes for Development of Fermentation-Based Products)

Abstract

:
Hyaluronic acid (HA) is a polysaccharide of alternating d-glucuronic acid and N-acetyl-d-glucosamine residues present in the extracellular matrix of connective, epithelial, and nervous tissues. Due to its singular hydrating, rheological and adhesive properties, HA has found numerous cosmetic and medical applications. However, techno-economic analyses of high value-added bioproducts such as HA are scarce in the literature. Here, we present a techno-economic analysis of a process for producing HA using Streptococcus zooepidemicus, simulated in SuperPro Designer. In the baseline scenario, HA is produced by batch fermentation, reaching 2.5 g/L after 24 h. It is then centrifuged, diafiltered, treated with activated carbon and precipitated with isopropanol. The product is suitable for topical formulations and its production cost was estimated as 1115 $/kg. A similar scenario, based on fed-batch culture and assuming a titer of 5.0 g/L, led to a lower cost of 946 $/kg. Moreover, in two additional scenarios, 10% of the precipitated HA is diverted to the production of a highly pure and high-molecular weight HA, suitable for injectable applications. These scenarios resulted in higher capital and operating costs, but also in higher profits, because HA for injectable use has a higher selling price that more than compensates for its higher production costs.

1. Introduction

Hyaluronic acid (HA), also known as hyaluronan, is a linear polysaccharide made of alternating d-glucuronic acid and N-acetyl-d-glucosamine residues joined by β-1,3 and β-1,4 glycosidic bonds. It was first isolated from bovine vitreous humor, after which it is named: hyaloid is the Greek word for vitreous, and uronic acid refers to the glucuronic acid monomer. HA is found in various vertebrates; in humans, in particular, it is present in the extracellular matrix of connective, epithelial, and nervous tissues [1]. It is especially abundant in the synovial fluid, cartilage, the skin, the vitreous humor of the eye, the vocal folds, and the umbilical cord [2]. Initially thought to be an inert space filler, HA is now recognized to perform a variety of important functions: it regulates tissue viscosity and osmosis, providing lubrication and shock absorption to the joints; and in the skin, it keeps cells hydrated and participates in signal transduction, wound healing, tissue regeneration, and healthy tissue turnover [2,3,4].
HA’s properties are closely related to its molecular weight (MW), which typically ranges from 103 to 107 Da [5]. Due to its large MW and capacity to establish multiple hydrogen bonds with water molecules, HA is very hygroscopic and exhibits unique rheological and adhesive properties. In fact, at concentrations as low as 0.2%, HA solutions present highly non-Newtonian, shear-thinning behavior, and at concentrations higher than 1.5%, HA forms stable hydrogels [3]. Interestingly, high-MW molecules and low-MW molecules display different, and sometimes even opposite biological functions: high-MW HA has lubrication, shock absorption, space-filling, anti-inflammatory and anti-angiogenic properties, whereas low-MW HA is pro-inflammatory [1,2,6].
Given HA’s numerous properties and the fact that exogenous HA is generally biocompatible and non-immunogenic, HA has found many medical and cosmetic applications [1,7,8]. Nowadays, it is widely used in skincare products and cosmetic surgery for its hydration, wound healing, and space-filling properties [9,10]. In eye surgery, HA facilitates surgical manipulations and replaces the vitreous humor lost during the procedure. In the treatment of various arthritic disorders, HA restores the lubrication and shock absorption properties of the joints [2,11,12]. It has also been used in several types of surgery to promote wound healing and prevent organ adhesion, to treat vesicoureteral reflux, and for drug delivery purposes [3,13,14]. The MW of exogenous HA also varies considerably according to its application: HA for treatment of osteoarthritis typically has 1–6 MDa; HA used as a dermal filler in cosmetic surgeries, 1–2.5 MDa; as a surgical aid in eye surgeries, 0.5–4 MDa; as a topical cream for wound healing, 0.1–1.5 MDa; as an adhesion barrier for surgeries, 0.1–0.5 MDa; and for the preparation of anti-wrinkle products, 20–300 kDa [15].
Other than vertebrates, certain bacteria, notably Lancefield A and C streptococci (e.g., Streptococcus equi subsp. zooepidemicus, S. equisimilis, S. pyogenes) and coccobacillus Pasteurella multocida, are also capable of producing HA as an extracellular capsule. Those microorganisms are pathogenic to humans and/or livestock, and the HA capsule is thought to trick the host immune system, which does not recognize it as foreign. In addition, the HA capsule appears to help these bacteria migrate from epithelial layers into the tissue and protect them from reactive oxygen species (streptococci are catalase-negative, aerotolerant anaerobes) [3].
The biosynthesis of HA is well conserved across species [7]. It starts in the cytoplasm with the phosphorylation of glucose into glucose-6-phosphate (G6P) by hexokinase; G6P is then converted into glucose-1-phosphate (G1P) by phosphoglucomutase (pgm) and into fructose-6-phosphate (F6P) by phosphoglucoisomerase (hasE/pgi). These two phosphorylated sugars give rise to the two key precursors required to produce HA. G1P reacts with UTP resulting in UDP-glucose, owing to UDP-glucose pyrophosphorylase (hasC); and subsequently UDP-glucose is oxidized by UDP-glucose dehydrogenase (hasB) into UDP-glucuronic acid (UDP-GlcA), which is one of the key precursors of HA. F6P receives an amide group from glutamine, becoming glucosamine-6-phosphate (GlcN-6P), by the action of amidotransferase (glmS); then, GlcN-6P is isomerized to glucosamine-1-phosphate (GlcN-1P) by phosphoglucosamine mutase (glmM). Next, GlcN-1P is acetylated to N-acetylglucosamine-1-phosphate (GlcNA-1P) using an acetyl-CoA molecule, and GlcNA-1P is activated by UTP, yielding UDP-N-acetylglucosamine (UDP-GlcNA) which is the other key precursor of HA. These two steps are catalyzed by a bifunctional enzyme (hasD/glmU) that has both acetyltransferase and UDP-N-acetylglucosamine pyrophosphorylase activity. Finally, the two activated precursors are joined together by hyaluronan synthase (hasA), which is a transmembrane enzyme that extrudes the polymer to the extracellular space [1,3,7,8,16].
The synthesis of a single HA dimer is clearly energy-intensive: it consumes 5 ATP equivalents; 2 NAD+ molecules; 1 acetyl-CoA molecule and 1 glutamine molecule. Moreover, given that the key HA precursors come from G6P and F6P, HA synthesis interferes with ATP production and with the pentose-phosphate pathway. In addition, HA synthesis directly interferes with the production of cell wall components in bacteria, given that G1P, UDP-glucose, and UDP-GlcNA are also necessary to produce cell wall polysaccharides, teichoic acids, and peptidoglycan, respectively [3,7,16]. Consequently, HA synthesis competes with ATP production and biomass growth for substrates, and high specific growth rates hamper the production of HA in bacteria [3,16]. An inverse correlation between the specific growth rate and the MW of HA has also been observed [3,15,16,17]. Although the MW control mechanisms have not been completely elucidated, it has been shown that higher intracellular concentrations of the key precursors, particularly UDP-GlcNA, lead to higher MWs. However, it appears that this effect depends on maintaining balanced intracellular concentrations of the two precursors as well [17,18].
Traditionally, HA is produced by extraction from animal sources, especially rooster combs. This production method has certain drawbacks, however: HA from natural sources is entangled with protein-bound glycosaminoglycans, and therefore a relatively harsh and extensive purification process is required to separate HA from other molecules. There is also a growing preference for non-animal sources of medical products out of safety concerns, notably the risk of virus or prion contamination [1,2,3]. For those reasons, the microbial production of HA has largely replaced HA extracted from animal sources [19]. The exogenous HA obtained from microbial fermentation exhibits the same properties as endogenous HA, including the highly hydrated structure, viscous and viscoelastic properties, signaling via cell receptors, anti-inflammatory effects, and cell protection [20]. Moreover, HA’s functional groups allow for chemical modifications such as crosslinking that increase HA stability in vivo and expand the range of biomedical applications of HA’s hydrogels [10,11]. The ability to control the MW of HA through fermentation conditions, and possibly through genetic engineering, is another advantage of the microbial route [7].
Although streptococci can produce HA with high MW and at relatively high titers, the fact that they are natively pathogenic and may release exotoxins or immunogens during manufacturing means that an extensive and meticulous process for product recovery and purification is necessary, especially for medical and cosmetic applications, and even more so in the case of injectable products [21]. Another disadvantage of native producers such as S. zooepidemicus is that they are nutritionally fastidious, requiring complex protein sources or elaborate chemically defined media, including several vitamins and amino acids that those bacteria cannot synthesize themselves [3]. For those reasons, HA production has been recently implemented in various heterologous systems, notably bacteria such as Corynebacterium glutamicum [22], Bacillus subtilis, Lactobacillus delbrueckii subsp. lactis, Escherichia coli, Agrobacterium sp., and Enterococcus faecalis; yeasts such as Saccharomyces cerevisiae, Pichia pastoris [7], and Kluyveromyces lactis [23]; and even plant cells, with variable degrees of success in terms of HA titer, volumetric productivity, and MW [7]. An additional advantage of heterologous production is that production hosts do not synthesize hyaluronidase, an enzyme that breaks down HA and is usually present in native-producing microorganisms [2].
Currently, most HA is manufactured via streptococcal fermentation [8]; however, recombinant production of HA was employed by Novozymes in the past [1], and it is currently used by Hyalose LLC [24]. In both of those cases, Bacillus was the host.
The global market of HA was estimated at US$ 9.1 billion in 2019, and it is expected to grow at a compound annual growth rate (CAGR) of 8.1% from 2016 to 2027 [25]. HA production is booming particularly in China, where sales are expected to grow at a CAGR of 14.1% from 2018 to 2022, and to reach a volume of 613 metric tons (MT) by the end of this period [26]. In 2018, Chinese sales of HA raw materials were estimated at 430 MT, accounting for more than 80% of the global market [27]. By way of comparison, HA production in the early 2000s was estimated to be 10–20 MT/year for ophthalmic, cosmetic, and dietary applications, and less than 1 MT/year for medical grade applications. HA prices in those segments were in the ranges of 1000–2000 $/kg and 40,000–60,000 $/kg, respectively [3]. This huge price difference is primarily due to the extremely high purity required by medical applications, and, to a lesser extent, to the higher MW required by those. Recently, the average price of HA was said to fall between 1000 and 5000 $/kg [7].
Nowadays, the most significant HA market segments are those of dermal fillers, osteoarthritis, and ophthalmology. The current increase in global sales is primarily driven by the growing demand for anti-aging skin products, and the need to treat arthritic disorders in aging populations [25]. Despite the considerable medical and economic importance of HA, there is no techno-economic analysis (TEA) of the production of HA in the literature. In fact, TEAs of high value-added bioproducts such as HA are notably scarce in the literature. This kind of analysis is however crucial to identify critical points of improvement in production processes, and thus to guide research and development efforts. As such, this work presents a TEA of a process for producing HA through streptococcal fermentation.

2. Materials and Methods

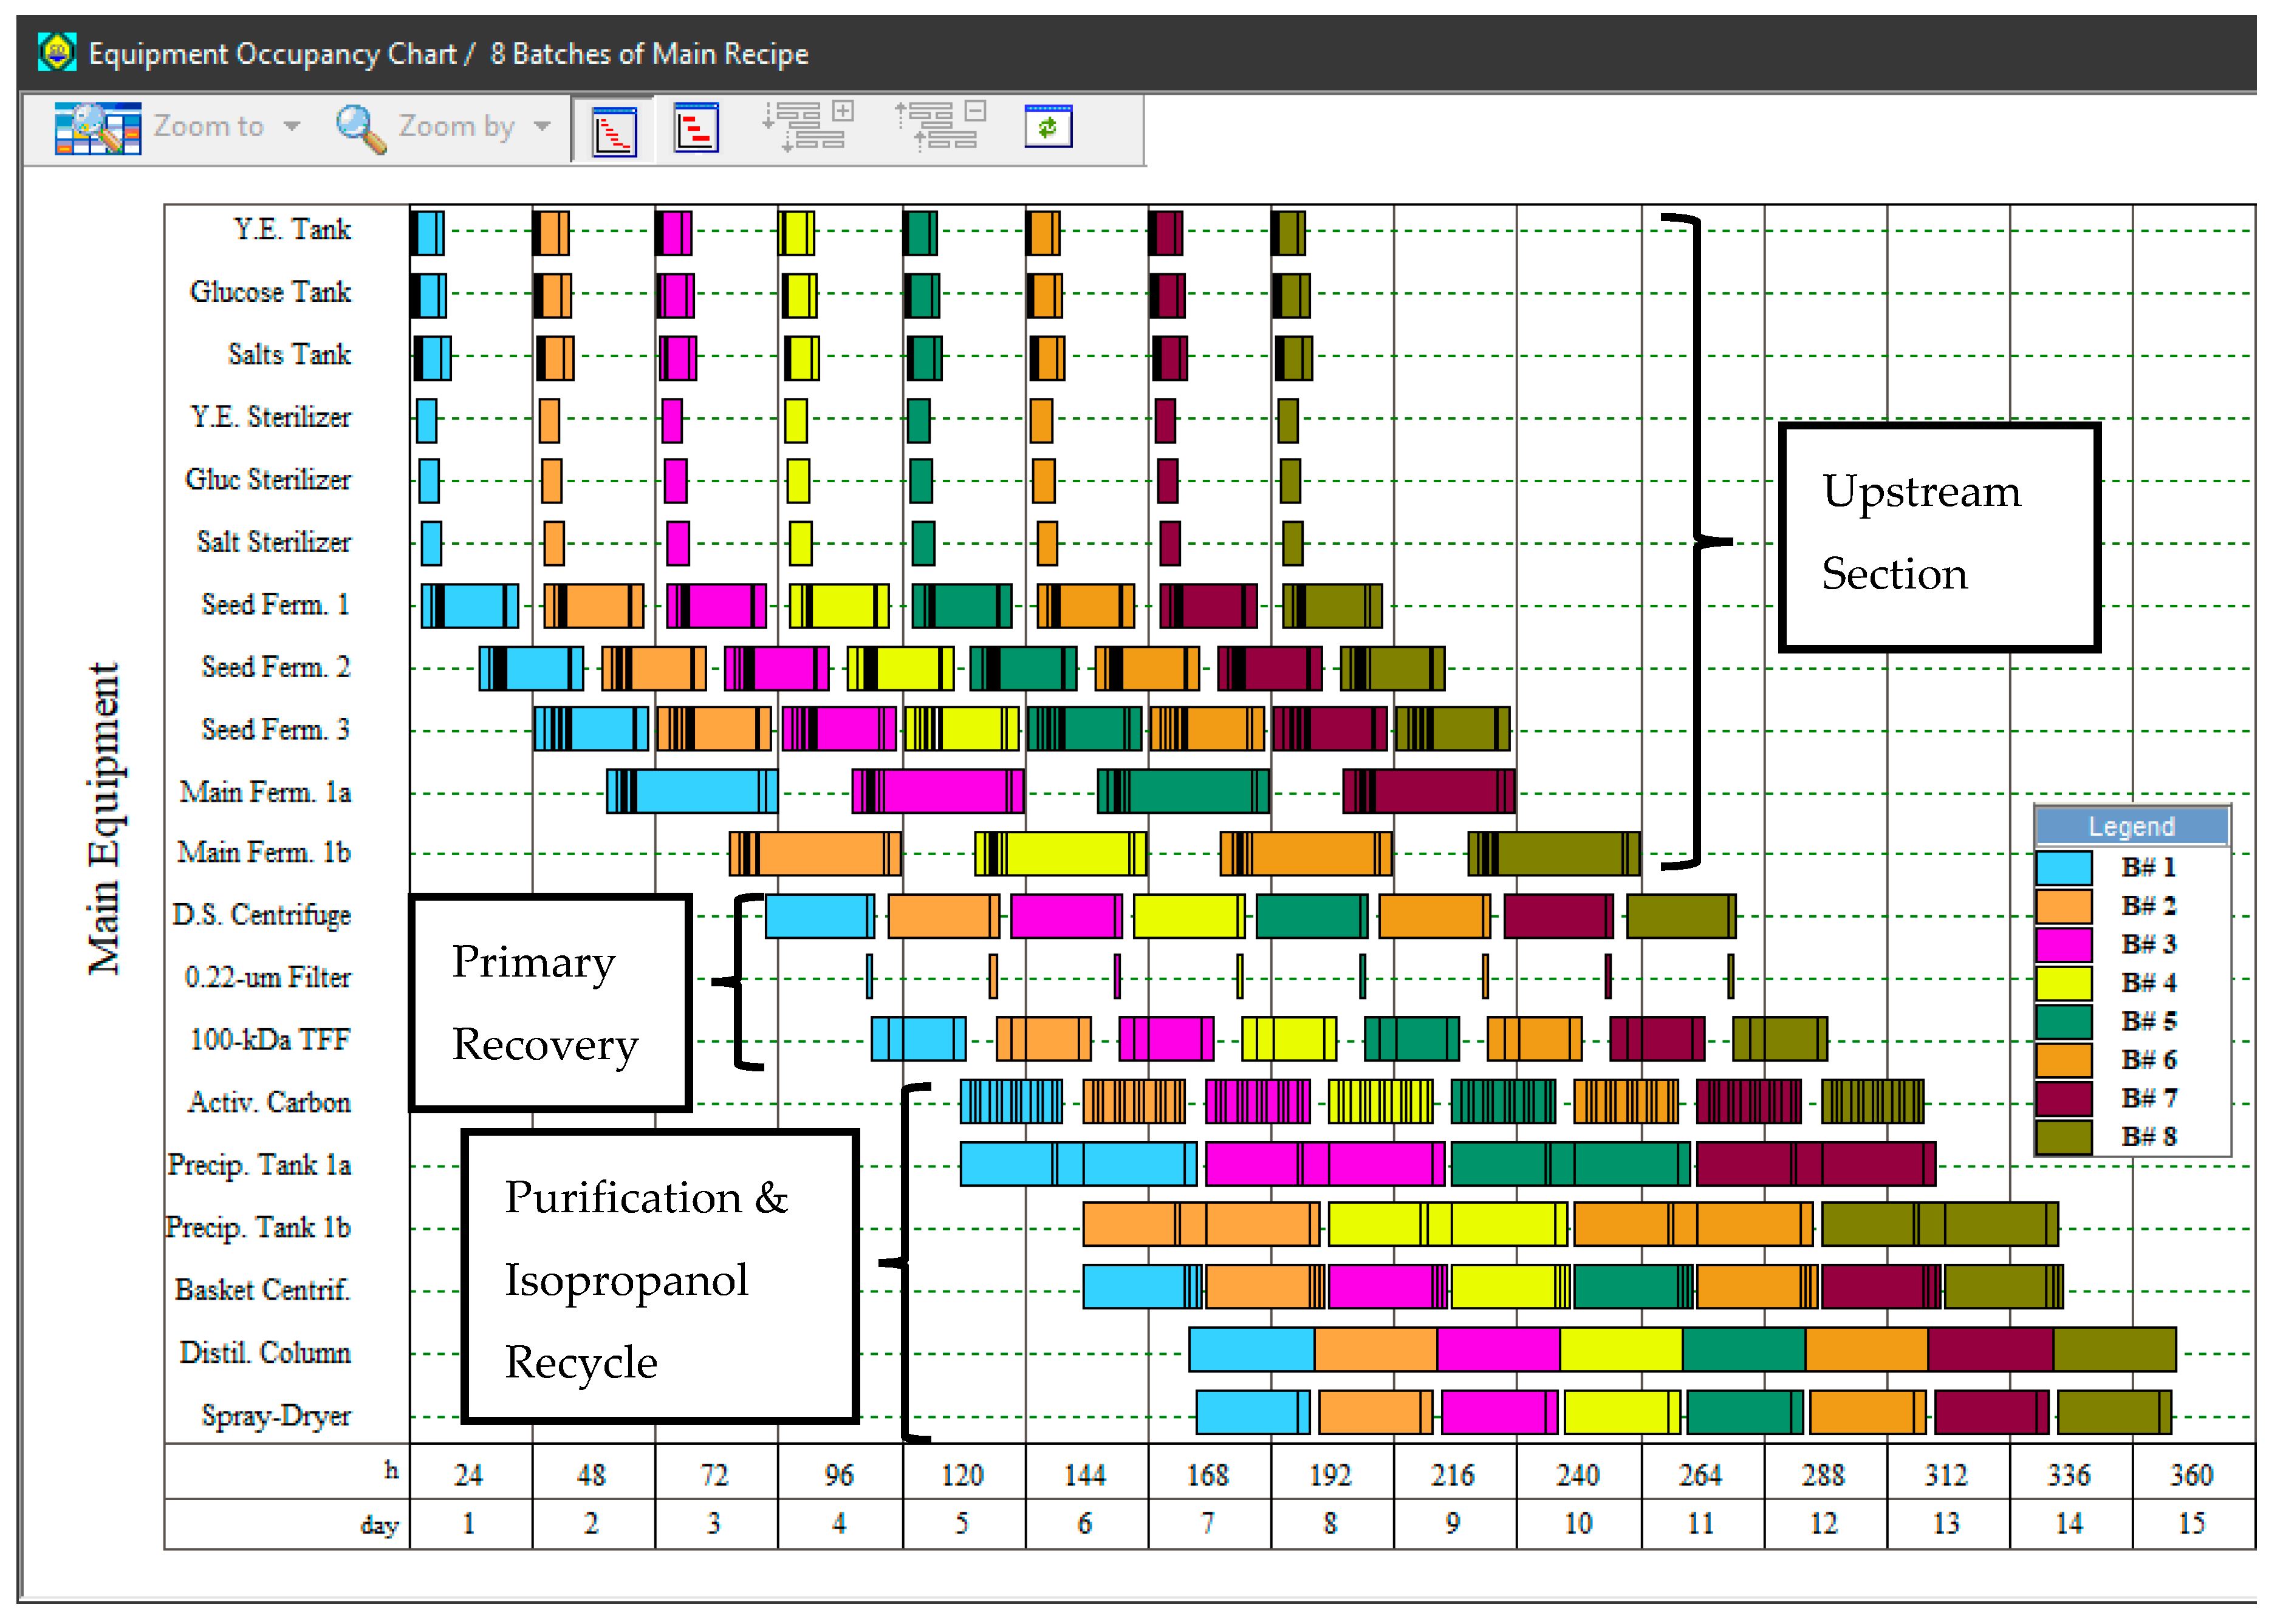
2.1. Design Basis and Process Scenarios

A process for the production of HA was designed, simulated, and economically evaluated using SuperPro Designer v12, a process simulation and economic evaluation tool marketed by Intelligen, Inc. (Scotch Plains, NJ, USA). A simplified version of the process flow diagram, created in SuperPro Designer, is provided in Figure 1. The proposed process is based on the fermentation of an attenuated, non-hemolytic strain of Streptococcus (S. zooepidemicus ATCC 39920). This microorganism was chosen because native Streptococcus producers are currently preferred in the industry [28], owning to the high titers, productivities, and MWs that they can achieve [7].
For the purpose of analysis, the process was divided into four sections:
  • Upstream Section
  • Primary Recovery Section
  • Purification Section
  • Isopropanol Recycle Section
Each section is described in detail later. Key assumptions regarding the Upstream Section, such as medium composition, fermentation duration, and yield of HA on substrate were based on laboratory scale data previously published [29]. The primary recovery and purification sections were based on the scientific and patent literature, especially references [5,21,30,31]. A total of four process scenarios were created: S1, S2, S3, and S4. In scenarios S1 and S2, we assumed that a single HA product is manufactured, in the form of a dry powder, which is suitable for topical formulations (e.g., skincare products). In scenarios S3 and S4, on the other hand, 10% of the HA recovered is diverted to the production of a highly pure, sterile, and high-MW HA that is suitable for injectable applications (e.g., treatment of osteoarthritis). In addition, scenarios S1 and S3 assume that the microbial fermentation is conducted in batch mode and attains a titer of 2.5 g/L, whereas S2 and S4 assume that fermentation is conducted in fed-batch mode and attains a titer of 5.0 g/L.
The plant was assumed to be located in the United States and constructed in 2020. The annual operating time was assumed to be 330 days. The process was designed to have an overall cycle time of 24 h in all scenarios (i.e., a new batch is initiated every 24 h). The production scale in S1 and S3 was set to 20 MT per year, which represents approximately 3% of the current world demand. A sensitivity analysis with respect to the production scale was also performed, based on the baseline process (S1).
A list of the key assumptions used to design the baseline process are given in Table 1. The detailed SuperPro Designer models corresponding to scenarios S1–S4 are available as supplemental material (Supplementary Materials SuperPro_Flowsheets.zip). They can be opened and inspected by anyone using the free evaluation edition of SuperPro Designer v12 which is available at www.intelligen.com.

2.2. Flowsheet Sections

2.2.1. Upstream Section

The Upstream Section includes the main fermentation step that produces HA, as well as a seed train to generate the required inoculum volume for the production step. The seed train is composed of three seed fermentation steps, having an expansion factor of 10×. The first seed fermentor is inoculated by a cell suspension with 30 g/L of dry biomass, while each subsequent step is inoculated by the whole broth from the previous step, and the broth from the third seed fermentor inoculates the production fermentor. This section also encompasses media preparation and aeration. The medium for all the fermentation steps is assumed to be the same; it is composed of 25 g/L of glucose, 60 g/L of yeast extract, and 11 g/L of a nondescript “Salts” component. Each one of these components is dissolved in water and heat-sterilized using a dedicated blending tank and sterilizer, and then distributed to all the fermentors. The solutions have the following concentrations: yeast extract, 40%; glucose, 50%; salts, 15%. Water is also heat-sterilized and distributed to the fermentors, to complete the batch medium volume. All fermentation steps are aerated with 2.0 VVM (volumes of air per volume of liquid per minute) of sterile air; although S. zooepidemicus is unable to perform oxidative phosphorylation, it can use oxygen to generate reducing equivalents for HA synthesis [3]. The temperature is kept constant at 37 °C with chilled water, and the pH is maintained at 7.0 with NaOH 20% w/w in all fermentation steps. The fermentation time is assumed to be 12 h in the seed fermentation steps, and 24 h in the main fermentation step. The seed and production fermentation steps were all modeled with the same mass stoichiometric equation, given below:
100 Glucose + 1 Salts + 165 Yeast Extract → 5.2 Acetic Acid + 18.6 Biomass + 80 Carbon Dioxide + 8.7 Hyaluronan + 27.5 Lactic Acid + 126 Water
The extent of the fermentation reaction was set at 95% in the seed fermentation steps, and at 99% in the main fermentation step. The heat released by fermentation was assumed to be 1800 kcal/kg of glucose consumed in all cases. The generated acetic acid, lactic acid, and HA are neutralized to completion using NaOH.
Finally, a cell lysis reaction was added to the main fermentation step to represent the spontaneous death of bacterial cells at the end of the fermentation process. The mass stoichiometry of this reaction is given below:
100 Biomass → 20 Cell Debris + 50 Contaminating Proteins + 15 Impurities + 15 Nucleic Acids
The extent of this reaction was set at 2%.
Given the assumptions above, the fermentation broth is expected to contain:
  • Sodium salts of HA, acetic acid, and lactic acid (sodium hyaluronate, sodium acetate, and sodium lactate, respectively);
  • Biomass, cell debris, bacterial proteins, nucleic acids, and other impurities (amino acids, nucleotides, minerals, etc.);
  • Residual glucose, yeast extract, and medium salts.

2.2.2. Primary Recovery Section

The Primary Recovery Section comprises a clarification step and a crossflow filtration step. First, the fermentation broth is sent to a disk-stack centrifuge to separate the bacterial cells from the HA molecules, which stay in the supernatant. It is assumed that 97% of the cells are removed, and that the heavy stream has a wet solids concentration of 600 g/L (~18% w/w on a dry basis). The supernatant then goes through a 0.22 μm dead-end filter to remove any residual cells. Next, the liquid is sent to a tangential flow filtration (TFF) system with a UF membrane having a molecular weight cut-off (MWCO) of 100 kDa. The solution is initially recirculated with the system closed; next, it is concentrated to 5 g/L of sodium hyaluronate; and finally, it is diafiltered with 8 volumes of deionized water (RO Water). The rejection coefficient of the UF membrane for sodium hyaluronate is assumed to be 0.995, with an overall product yield in this step of around 96%.

2.2.3. Purification Section

In all scenarios, the Purification Section includes granular activated carbon (GAC) adsorption, isopropanol precipitation, basket centrifugation, and spray-drying of the HA salt. It is assumed that the GAC column binds most of the contaminating proteins, nucleic acids, cell debris, glucose, acetate, and lactate that were not removed in the Primary Recovery Section, letting 99% of the HA salt pass through. An isopropanol (IPA)-rich solution (87% w/w) is then added to the aqueous HA solution, so that the final IPA concentration is equal to 42% w/w, leading to the precipitation of the HA salt (as well as of some residual nucleic acids). The HA precipitation yield was assumed to be 95%. The precipitate is then separated from the supernatant with a basket centrifuge, allowing the recovery of 95% of the precipitated HA. The jelly cake formed is washed with the same 87%-IPA solution. Lastly, the cake is dried with a spray-dryer to a final solids content of 95% w/w.
For scenarios S3 and S4, the Purification Section is larger because a fraction of the HA precipitate is diverted to produce injectable-grade HA. More specifically, 10% of the precipitate is sent to a second TFF system that has a membrane MWCO of 1000 kDa. First, the cake is dissolved in water for injection (WFI) to produce a 5 g/L solution. Then, the solution is diafiltered with 6 volumes of WFI. For this diafiltration step, it is assumed that the HA salt is composed of two major fractions: a high-molecular weight (HMW) fraction that is larger than 1000 kDa, and a “low” molecular weight (LMW) fraction that is smaller than 1000 kDa. It was assumed that 86.5% of the HA salt belongs to the HMW fraction, and 13.5% belongs to the LMW fraction. The rejection coefficient of the UF membrane was assumed to be 0.90 for the HMW fraction, and 0.10 for the LMW fraction. After the diafiltration operation, the retentate is concentrated to 5 g/L in the TFF system. Subsequently, the retentate is filter-sterilized with a 0.22 µm dead-end filter and freeze-dried to a final solids content of 95% w/w.

2.2.4. Isopropanol Recycle Section

The filtrate stream of the basket centrifugation step, which contains 43% IPA, is sent to a continuous distillation column for solvent recovery and purification. The vapor-liquid equilibrium of IPA and water was predicted in SuperPro Designer using the NRTL model. The distillate of the column (top stream) is recycled to the process and combined with fresh IPA to make up the volume required by the Purification Section. The bottom phase of the distillation column is used to pre-heat the distillation feed through a shell and tube heat-exchanger, and then it is sent to wastewater treatment.

2.3. Estimation of Operating and Capital Costs

The following operating costs were accounted for in this work: raw materials, utilities, labor, laboratory/QC/QA, waste treatment, and facility-dependent costs (the latter encompass plant maintenance, depreciation, and overhead expenses). The prices of utilities and consumables utilized were the default values provided by SuperPro. The hourly cost of labor was estimated based on the average wages of chemical equipment operators in the chemical manufacturing industry in the USA, provided by the US Bureau of Labor Statistics [33]. The cost of laboratory analyses/QC/QA was assumed to be equal to 15% of the total labor cost. The prices of raw materials were estimated based on trade data from the US International Trade Commission [34]. The selling prices of the “topical” and “injectable” HA were set at 2000 $/kg and 50,000 $/kg, respectively, considering the price ranges specified in the literature [3,7].
In the calculation of capital costs, the following items were considered: Direct Fixed Capital (DFC), Working Capital, and Startup and Validation costs. The DFC includes equipment purchase and installation costs as well as the costs of piping, instrumentation, buildings, etc., which were estimated based on the default factors of SuperPro Designer. The purchase cost of equipment was estimated based on the default cost functions of SuperPro Designer, with the exception of storage tanks, mixing tanks, and fermentors, whose purchase costs were estimated using custom cost models based on data from the DACE Price Booklet [35]. The Working Capital was estimated as the amount necessary to cover 30 days of labor, raw materials, utilities, and waste treatment expenses. Finally, the plant Startup and Validation cost was estimated as 20% of the DFC.

3. Results

3.1. Process Simulation

The baseline scenario (S1) was modeled following the assumptions described in the Methodology section. Since the production fermentation step has a cycle duration of 33 h, two production fermentors are required operating in staggered mode (alternating from batch to batch) to operate the overall process with a cycle time of 24 h. The Equipment Occupancy Chart (Figure 2) illustrates the rotation of two main fermentors (Main Ferm. 1a and Main Ferm. 1b) between consecutive batches, so that a new batch can be initiated every 24 h. The size of each production fermentor is 35 m3. The 24-h cycle time enables the processing of 323 batches per year. A volume of 27.6 m3 of fermentation broth is produced per batch, with a concentration of 2.5 g/L of sodium hyaluronate and 5.0 g/L of dry cell weight. Significant amounts of acetate (1.9 g/L) and lactate (9.4 g/L) are also generated, which is in accordance with the fermentative metabolism of the microorganism. High levels of residual medium components, especially salts (10.5 g/L) and yeast extract (21.1 g/L), are found in the broth as well; the latter is in fact the main source of contaminating peptides that must be eliminated in the downstream portion of the process. At the end of the process, 61.9 kg of HA salt (with a solids content of 95% w/w) is produced per batch, resulting in an annual throughput of 20 MT of manufactured product. The product contains less than 0.01% of impurities (cell debris, proteins, and nucleic acids) on a dry solids basis and is appropriate for topical applications such as skincare products.
Table 2 displays the amount of each raw material used per kg of product in scenario S1, broken down by process section. Approximately 2.9 MT of purified (RO) water is consumed in total, primarily in the Primary Recovery Section. Significant quantities of cleaning solutions are required in most process sections: a total of 59.0 kg of CIP-Acid and 118.2 kg of CIP-Caustic are indeed consumed per kg of product. With respect to medium components, 12.3 kg of glucose and 29.6 kg of yeast extract are required per kg of product. The recovery and recycling of isopropanol utilized in the Purification Section reduce the demand for fresh isopropanol to just 2.6 kg per kg of product.
The phase diagram for the mixture of IPA and water predicted by the NRTL model of SuperPro Designer is shown in Figure 3. It predicts the formation of an azeotrope at a mass fraction of 87.7% w/w of IPA, with a boiling point of 80 °C, which is in agreement with the experimental data [36]. The composition of the IPA purification column distillate is approximately equal to that of the azeotrope.

3.2. Economic Evaluation

3.2.1. Comparison of Process Scenarios S1–S4

Table 3 displays the main results of the economic analysis. It includes the total capital investment (TCI), the unit production cost (UPC), and a few profitability metrics for each one of the four scenarios described in the Methodology. The estimated TCI is $53.5 and $44.3 million for scenarios S1 and S2, respectively. Scenarios S3 and S4 require higher TCI of $107.0 and $89.6 million, respectively, because they utilize additional steps to produce highly pure, high-MW HA that is appropriate for injectable applications. Those steps include an additional TFF system to separate high-MW from low-MW HA, and a freeze-dryer instead of a spray-dryer because spray-drying reduces the MW of HA [37]. Both equipment items entail significant equipment purchase costs. In addition, the permeate from this TFF unit, which is highly dilute, is recycled and mixed with the precipitation cake prior to spray-drying; therefore, considerably more water must be removed from that stream, resulting in a larger and more expensive spray-dryer.
On the other hand, the fed-batch scenarios, S2 and S4, require lower capital investments than their batch counterparts, S1 and S3. That is because the fed-batch processes lead to a higher product titer (2×), and therefore equipment of smaller capacity is required to manufacture the same amount of product.
The UPC results follow the same trends as the TCI: S1 and S2 lead to 1115 and 946 $/kg of product, respectively, while S3 and S4 show higher values, 1691 and 1449 $/kg, respectively. However, it should be noted that those values only account for the amount of main product (i.e., “topical-use” HA) manufactured, which is lower in S3 and S4 than in S1 and S2, since part of the HA becomes “injectable-use” HA in S3 and S4. The amounts of “topical-use” and “injectable-use” HA manufactured in each scenario are also included in Table 3.
The profitability metrics show that the scenarios with production of injectable-use HA, S3 and S4, are more favorable than their corresponding single-product counterparts, S1 and S2, despite having higher capital and operating costs. In fact, the ROI’s of S3 and S4 are higher, their payback times are lower, and their net present values are much higher than those of their single-product counterparts, S1 and S2. These results can be explained by the fact that the “injectable-use” HA produced in S3 and S4 has a very high selling price that more than compensates for the higher production costs of these scenarios. As expected, the fed-batch processes (S2 and S4) also present better profitability results than their batch counterparts (S1 and S3), given that they require lower capital and operating resources to generate the same output.
Figure 4 complements Table 3 by showing the UPC for each scenario, broken down by cost categories such as raw materials, labor, utilities, etc. In all scenarios, the facility-dependent and the labor costs are the largest components, together accounting for more than 2/3 of the UPC. The facility-dependent cost comprises plant maintenance costs, plant depreciation, and overhead costs; as such, it is closely related to the equipment purchase costs and follows a behavior like the TCI. The third largest cost category is that of consumables, which in this process consist of the filtration membranes used in the Primary Recovery and Purification sections. The fourth largest cost category is that of raw materials, such as glucose and yeast extract.

3.2.2. Breakdown of Production Costs by Process Section in Scenario S1

In order to better understand the main cost drivers of HA production, it is useful to analyze the capital and operating costs incurred by the process in each process section. This is done in Figure 5 for the baseline scenario, S1. It shows that the largest operating and capital costs are associated with the Upstream Section, followed by the Primary Recovery Section; the Purification Section comes in a distant third place. The facility-dependent cost follows a similar trend, which is natural given that facility-dependent costs and capital costs are related to each other.
Labor costs are significant for all the process sections. Other cost categories, however, are concentrated in one or two sections; in fact, most of the raw materials cost is associated with the Upstream Section (due to media); almost all the cost of consumables is associated with the Primary Recovery Section (due to microfiltration and ultrafiltration membranes); and the cost of utilities is concentrated in the Upstream Section (due to power and cooling water consumption) and in the Isopropanol Recycle Section (due to steam and cooling water demand). The cost of laboratory/QC/QA is estimated as a fraction of the labor cost, and therefore follows the same distribution as the labor cost.

3.2.3. Effect of Production Scale

The influence of production scale on the UPC and TCI for scenario S1 is displayed in Figure 6. In the range analyzed, a 5× increase in production scale (from 10 to 50 MT/year) results in only a 2.6× increase in TCI (from $37.5 to $97.2 million) and in a 1.5× increase in the annual labor cost (the labor cost is not displayed on Figure 6). The costs of raw materials, utilities, and consumables increase proportionally with the production scale. The reduced increase of the capital and labor costs with production scale results in a major decrease of the UPC (from 1708 $/kg at 10 MT/year to 752 $/kg at 50 MT/year).

4. Discussion

The results of the economic analysis suggest that the proposed process design is efficient for the production of HA given that, even in the most conservative case (S1), the estimated production cost of 1115 $/kg is close to the lower end of the market price range of the polysaccharide (1000 $/kg). This is possible because of a relatively simple recovery and purification process that achieves high purification yields and high purity while avoiding the use of expensive chromatographic steps. A key feature of the present design is the use of an ultrafiltration-diafiltration (TFF) step early in the downstream portion of the process using a 100-kDa membrane, as proposed by reference [21]. The diafiltration mode enables the elimination of most impurities present in the extracellular broth, such as organic acids, salts, sugars, and peptides, which are much smaller than the product of interest. This step also eliminates molecules of HA smaller than 30 kDa, which are known to be proinflammatory and therefore harmful for cosmetic or medical applications. In addition, the product solution concentration accomplished by the TFF system reduces the processing volumes and equipment size in subsequent purification steps.
The economic results also indicate that, within the range of production scales analyzed, the facility-dependent and labor costs are the dominant components of the operating cost. This is indicative of the processes that produce high value products at a relatively small scale, which is common in the pharmaceutical industry. The facility-dependent cost is particularly high in this process because of the low product titer in the fermentation broth (2.5 g/L), which is necessary to avoid excessive viscosity. Actually, this is an inherent physicochemical limitation of the product that cannot be overcome easily. As illustrated by scenario S2, if a product titer of 5.0 g/L is feasible, the unit production cost can be reduced by 15% primarily because of the smaller equipment sizes required in the Upstream Section.
The economics of the process can also be improved by producing high-MW HA for injectable use, which has a much higher market value than “conventional” HA, as demonstrated by scenarios S3 and S4. Even though these scenarios require much higher capital investments, they are in fact way more profitable than their single-product counterparts, S1 and S2. Some caveats are warranted, however: The profitability depends to a large extent on the selling price of the injectable product; and the amount of injectable HA is constrained by the market demand of this type of product, which is much smaller than that of the topical HA. Moreover, it should be noted that the present economic analysis does not account for up front R&D costs and clinical trial expenses. Those costs may be substantial and unavoidable, especially in the case of injectable HA manufacturing.
Although there are no process economic analyses of the production of HA or even of similar polysaccharides in the literature, Vázquez et al. [38] have estimated the cost of media for producing HA in commercial and low-cost media using S. zooepidemicus. The low-cost media in that work was composed of mussel processing wastewater as a sugar source and tuna peptone as a protein source. Their analysis estimated a medium cost of approximately 2.4 and 1.4 €/g of HA for the commercial and low-cost medium cases, respectively. Considering the current exchange rate of 1.21 US$/€, those numbers would be equivalent to approximately 2910 and 1700 US$/kg of HA, respectively, which are much higher than the raw material costs, and even unit production costs, estimated in the current work. This large difference may be attributed to the lower conversion yields assumed in that work.
Given that proteins are other large macromolecules (heteropolymers) produced by fermentation using similar operations, it seems reasonable to consider the manufacturing cost of proteins produced by fermentation/cell culture as a benchmark for the cost of HA. Industrial enzymes typically have a production cost of tens of dollars per kg of protein, whereas pharmaceutical proteins may cost tens of thousands to more than a million of dollars per kg [39]. Such a large difference in magnitude is primarily because of the differences in process scale, volumetric productivity, and purity requirements. Given that HA volumes and purity requirements are between those of industrial enzymes and pharmaceutical proteins, it seems logical that the unit production cost of HA would fall somewhere in the middle, which is indeed the case.
It should be stressed that all the data presented in the Results section were obtained from process simulations based on various assumptions described in the Methodology section. In fact, a myriad of factors affects the production of HA and its economic feasibility, including: fermentation conditions (e.g., medium composition, temperature, pH, mixing, aeration) and the resulting yield, titer, and productivity; the MW distribution of the HA produced; the yield of each recovery and purification step; prices of equipment, utilities, consumables, and raw materials; operator wages; plant location and operating hours; selling prices of topical grade HA and injectable grade HA, etc. Moreover, certain assumptions, such as fermentation yield, titer, and productivity, were based on data derived from laboratory scale experiments [29]. An actual industrial process could produce significantly different results if the process deviated from those assumptions; in particular, large-scale fermentation of S. zooepidemicus might lead to different yields, titers, productivities or MW due to changes in mass and heat transfer, contamination by other microorganisms, unwanted mutations, etc. Mass and energy transfer issues are of particular concern in HA production, because of the extremely high viscosity of the product.
The results of this work also suggest additional strategies to improve the economics of HA production. The large facility-dependent and labor costs, for instance, could be reduced if the plant were built in a country that has lower facility and labor costs than the U.S. Increasing the fermentation titer and downstream yields would also be useful to reduce HA cost. Fermentation titer, in turn, could be boosted by optimizing the microbial culture, by genetically modifying the native producers or by engineering recombinant systems. In particular, enzymes directly related with the synthesis of HA could be engineered or overexpressed so as to increase HA yield or MW. In fact, the overexpression of enzymes involved with the synthesis of HA precursors has already been shown to increase HA MW in S. zooepidemicus. Especially, a correlation between higher expression of hasD/glmU (the enzyme that catalyzes the final steps of UDP-GlcNA synthesis) and higher HA yield and MW has been observed [16], suggesting that hasD/glmU would be an interesting target for improvement. Recombinant production of HA in a non-pathogenic host, such as C. glutamicum or B. subtilis, could also improve the process by diminishing health risks to personnel and by reducing the size and complexity of the purification section. In any case, the current work may serve as a starting point for developing novel HA production processes in the future.

5. Conclusions

The current work presents a thorough process design and economic analysis of the large-scale (20 MT/year) production of HA by Streptococcus zooepidemicus, including the multiple purification steps required to manufacture a product suitable for medical and cosmetic applications. The economic evaluation provides estimations for the capital and operating costs, as well as the profitability metrics of the process, considering four different scenarios. The breakdown of the production costs indicates that the facility-dependent and labor costs dominate in all scenarios, which is expected for a product of relatively high value and low volume such as HA. This suggests that improving the fermentation titer and downstream yields, as well as simplifying the downstream portion of the process, would be promising targets of research aiming to make HA more affordable. Increasing fermentation titer could be achieved by optimizing the fermentation process, by genetically modifying native producers such as S. zooepidemicus, or by engineering recombinant systems such as Corynebacterium glutamicum or Bacillus subtilis. Moreover, a recombinant host, if non-pathogenic, could simplify downstream processing and make the product safer. The small contribution of media to the production cost suggests that medium optimization should focus on improving the fermentation titer, rather than identifying cheaper raw materials.
The present study also shows that the cost of downstream processing in the production of HA is significant because of the high cost of consumables associated with the tangential-flow and polishing filtration steps. The scenarios in which a portion of HA goes through additional processing in order to produce a sterile, high MW, and highly pure product for medical applications illustrate how a more extensive purification section can be economically beneficial when the final product can be sold at a substantially higher price.
It is worth emphasizing that a complex production process such as the one described in this article possesses a very large number of parameters, some of which are not accurately known or have an intrinsic degree of variability. This is especially true for biological processes such as fermentation, and even more so considering a polydisperse product that has an extremely high viscosity that poses great challenges to scale-up. As a consequence, the results presented in this work have a degree of uncertainty that must be recognized. The different scenarios evaluated, and the sensitivity analysis performed with respect to the process scale attempt to address a portion, albeit small, of this uncertainty. In future works, the impact of uncertainty and variability could be further quantified by performing Monte Carlo simulation studies. Despite the uncertainty in the results, this study and its accompanying process models have the potential to serve as starting points for developing novel HA production technologies, including processes that utilize different microorganisms and downstream strategies.

Supplementary Materials

The following are available online at https://www.mdpi.com/2227-9717/9/2/241/s1. The four process flowsheets created in SuperPro Designer v12 for this work are available as a zip folder (SuperPro_Flowsheets.zip).

Author Contributions

Conceptualization, R.G.F., M.H.A.S., D.P.; methodology, R.G.F., A.R.A., D.P., and M.H.A.S.; formal analysis, R.G.F.; investigation, R.G.F., A.R.A., M.H.A.S.; visualization, R.G.F.; writing—original draft preparation, R.G.F.; writing—review and editing, all authors; supervision, D.P. All authors have read and agreed to the published version of the manuscript.

Funding

The authors thank Conselho Nacional de Desenvolvimento Científico e Tecnológico–CNPq, Brazil (Grant 304125/2018-0) for financial support.

Institutional Review Board Statement

Not applicable.

Informed Consent Statement

Not applicable.

Data Availability Statement

All the data used or generated in this work is contained in the four SuperPro Designer flowsheets made available as Supplemental Materials (see above).

Acknowledgments

The authors thank the Coordenação de Aperfeiçoamento de Pessoal de Nível Superior–Brazil (CAPES/PROEX)–Finance Code 001 for support.

Conflicts of Interest

R.G.F. and D.P. work for Intelligen, the company that markets the SuperPro Designer process simulator.

References

  1. Sze, J.H.; Brownlie, J.C.; Love, C.A. Biotechnological production of hyaluronic acid: A mini review. 3 Biotech 2016, 6, 67. [Google Scholar] [CrossRef] [PubMed] [Green Version]
  2. Kogan, G.; Šoltés, L.; Stern, R.; Gemeiner, P. Hyaluronic acid: A natural biopolymer with a broad range of biomedical and industrial applications. Biotechnol. Lett. 2007, 29, 17–25. [Google Scholar] [CrossRef] [PubMed]
  3. Chong, B.F.; Blank, L.M.; Mclaughlin, R.; Nielsen, L.K. Microbial hyaluronic acid production. Appl. Microbiol. Biotechnol. 2005, 66, 341–351. [Google Scholar] [CrossRef] [PubMed]
  4. Laurent, T.C. “The Tree”: Hyaluronan Research in the 20th Century. Hyaluronan Today 2002. Available online: https://www.glycoforum.gr.jp/article/06A1.html (accessed on 29 November 2020).
  5. Cavalcanti, A.D.D.; de Melo, B.A.G.; Ferreira, B.A.M.; Santana, M.H.A. Performance of the main downstream operations on hyaluronic acid purification. Process Biochem. 2020, 99, 160–170. [Google Scholar] [CrossRef]
  6. Rayahin, J.E.; Buhrman, J.S.; Zhang, Y.; Koh, T.J.; Gemeinhart, R.A. High and Low Molecular Weight Hyaluronic Acid Differentially Influence Macrophage Activation. ACS Biomater. Sci. Eng. 2015, 1, 481–493. [Google Scholar] [CrossRef] [Green Version]
  7. de Oliveira, J.D.; Carvalho, L.S.; Gomes, A.M.V.; Queiroz, L.R.; Magalhães, B.S.; Parachin, N.S. Genetic basis for hyper production of hyaluronic acid in natural and engineered microorganisms. Microb. Cell Fact. 2016, 15, 119. [Google Scholar] [CrossRef] [Green Version]
  8. Liu, L.; Liu, Y.; Li, J.; Du, G.; Chen, J. Microbial production of hyaluronic acid: Current state, challenges, and perspectives. Microb. Cell Fact. 2011, 10, 1–9. [Google Scholar] [CrossRef] [Green Version]
  9. Papakonstantinou, E.; Roth, M.; Karakiulakis, G. Hyaluronic acid: A key molecule in skin aging. Dermato-endocrinology 2012, 4, 253–258. [Google Scholar] [CrossRef] [Green Version]
  10. Neuman, M.G.; Nanau, R.M.; Oruña-Sanchez, L.; Coto, G. Hyaluronic Acid and Wound Healing. J. Pharm. Pharm. Sci. 2015, 18, 53. [Google Scholar] [CrossRef] [Green Version]
  11. Lin, F.-H.; Su, W.-Y.; Chen, Y.-C.; Chen, K.-H. Cross-Linked Oxidated Hyaluronic Acid for Use as a Vitreous Substitute. U.S. Patent 8,197,849 B2, 12 June 2012. [Google Scholar]
  12. Nicholls, M.A.; Fierlinger, A.; Niazi, F.; Bhandari, M. The Disease-Modifying Effects of Hyaluronan in the Osteoarthritic Disease State. Clin. Med. Insights Arthritis Musculoskelet. Disord. 2017, 10, 117954411772361. [Google Scholar] [CrossRef] [Green Version]
  13. Ito, T.; Yeo, Y.; Highley, C.B.; Bellas, E.; Benitez, C.A.; Kohane, D.S. The prevention of peritoneal adhesions by in situ cross-linking hydrogels of hyaluronic acid and cellulose derivatives. Biomaterials 2007, 28, 975–983. [Google Scholar] [CrossRef] [PubMed] [Green Version]
  14. Yeo, Y.; Highley, C.B.; Bellas, E.; Ito, T.; Marini, R.; Langer, R.; Kohane, D.S. In situ cross-linkable hyaluronic acid hydrogels prevent post-operative abdominal adhesions in a rabbit model. Biomaterials 2006, 27, 4698–4705. [Google Scholar] [CrossRef] [PubMed]
  15. Schulte, S.; Doss, S.S.; Jeeva, P.; Ananth, M.; Blank, L.M.; Jayaraman, G. Exploiting the diversity of streptococcal hyaluronan synthases for the production of molecular weight–tailored hyaluronan. Appl. Microbiol. Biotechnol. 2019, 103, 7567–7581. [Google Scholar] [CrossRef] [PubMed]
  16. Marcellin, E.; Steen, J.A.; Nielsen, L.K. Insight into hyaluronic acid molecular weight control. Appl. Microbiol. Biotechnol. 2014, 98, 6947–6956. [Google Scholar] [CrossRef] [PubMed]
  17. Shah, M.V.; Badle, S.S.; Ramachandran, K.B. Hyaluronic acid production and molecular weight improvement by redirection of carbon flux towards its biosynthesis pathway. Biochem. Eng. J. 2013, 80, 53–60. [Google Scholar] [CrossRef]
  18. Chen, W.Y.; Marcellin, E.; Steen, J.A.; Nielsen, L.K. The Role of Hyaluronic Acid Precursor Concentrations in Molecular Weight Control in Streptococcus zooepidemicus. Mol. Biotechnol. 2014, 56, 147–156. [Google Scholar] [CrossRef]
  19. Cheng, F.; Yu, H.; Stephanopoulos, G. Engineering Corynebacterium glutamicum for high-titer biosynthesis of hyaluronic acid. Metab. Eng. 2019, 55, 276–289. [Google Scholar] [CrossRef]
  20. Gupta, R.C.; Lall, R.; Srivastava, A.; Sinha, A. Hyaluronic Acid: Molecular Mechanisms and Therapeutic Trajectory. Front. Vet. Sci. 2019, 6, 192. [Google Scholar] [CrossRef] [Green Version]
  21. Corsa, V.; Carpanese, G. Process for the Purification of Hyaluronic Acid. U.S. Patent 2019/0023813 A1, 24 January 2019. [Google Scholar]
  22. Wang, Y.; Hu, L.; Huang, H.; Wang, H.; Zhang, T.; Chen, J.; Du, G.; Kang, Z. Eliminating the capsule-like layer to promote glucose uptake for hyaluronan production by engineered Corynebacterium glutamicum. Nat. Commun. 2020, 11, 3120. [Google Scholar] [CrossRef]
  23. Gomes, A.M.V.; Netto, J.H.C.M.; Carvalho, L.S.; Parachin, N.S. Heterologous Hyaluronic Acid Production in Kluyveromyces lactis. Microorganisms 2019, 7, 294. [Google Scholar] [CrossRef] [Green Version]
  24. Westbrook, A.W.; Ren, X.; Oh, J.; Moo-Young, M.; Chou, C.P. Metabolic engineering to enhance heterologous production of hyaluronic acid in Bacillus subtilis. Metab. Eng. 2018, 47, 401–413. [Google Scholar] [CrossRef] [PubMed]
  25. Grand View Research Hyaluronic Acid Market Size, Industry Analysis Report, 2020–2027. Available online: https://www.grandviewresearch.com/industry-analysis/hyaluronic-acid-market (accessed on 15 November 2020).
  26. Hyaluronic Acid Producers Benefit from Beauty Boom. Available online: http://www.chinadaily.com.cn/global/2019-08/07/content_37499383.htm (accessed on 15 November 2020).
  27. Statista. Total Sales Volume of the Hyaluronic Acid Raw Materials in China from 2014 to 2018. Available online: https://www.statista.com/statistics/1043602/china-hyaluronic-acid-raw-material-market-sales-volume/ (accessed on 15 November 2020).
  28. Santosh, Y.; Dharmendra, J.; Nataraj, V.; Velankar, H.; Kapat, A.; Rangaswamy, V. Process for Purification of High Molecular Weight Hyaluronic Acid. EP 2 216 412 B1, 3 October 2012. [Google Scholar]
  29. Pires, A.M.B. Estudos Metabólicos para Otimização de Condições Nutricionais e de Cultivo para Produção Microbiana de Ácido Hialurônico. Ph.D. Thesis, Universidade Estadual de Campinas, Campinas, Brazil, 2009. [Google Scholar]
  30. Rangaswamy, V.; Jain, D. An efficient process for production and purification of hyaluronic acid from Streptococcus equi subsp. zooepidemicus. Biotechnol. Lett. 2008, 30, 493–496. [Google Scholar] [CrossRef] [PubMed]
  31. Pagliuca, M.; Ruggiero, A.; Volpe, F. Production of Highly Purified Sodium Hyaluronate (HANA) with Controlled Molecular Weight. U.S. Patent 9,347,079 B2, 24 May 2016. [Google Scholar]
  32. Altergon Altergon—Quality & Safety. Available online: https://www.altergon.com/hyaluronic-acid/quality-safety.php?PHPSESSID=plhl6eae87em1gjvbdlg89kr77 (accessed on 18 December 2020).
  33. US Bureau of Labor Statistics Hourly Mean Wage for Chemical Equipment Operators and Tenders in Chemical Manufacturing in the United States. Available online: https://beta.bls.gov/dataViewer/view/timeseries/OEUN000000032500051901103 (accessed on 14 December 2020).
  34. US International Trade Commission. US International Trade Commission Dataweb. Available online: https://dataweb.usitc.gov/trade/search/ (accessed on 18 November 2020).
  35. DACE—Dutch Association of Cost Engineers DACE Price Booklet. Available online: https://www.dacepricebooklet.com/ (accessed on 19 October 2020).
  36. National Center for Biotechnology Information. PubChem Compound Summary for CID 3776, Isopropyl Alcohol. Available online: https://pubchem.ncbi.nlm.nih.gov/compound/3776#section=Kovats-Retention-Index (accessed on 22 December 2020).
  37. Toemmeraas, K.; Bach, P. Spray Drying of High Molecular Weight Hyaluronic Acid. U.S. Patent Application 2014/0155347 A1, 5 June 2014. [Google Scholar]
  38. Vazquez, J.A.; Montemayor, M.I.; Fraguas, J.; Murado, M.A. Hyaluronic acid production by Streptococcus zooepidemicus in marine by-products media from mussel processing wastewaters and tuna peptone viscera. Microb. Cell Fact. 2010, 9, 46. [Google Scholar] [CrossRef] [PubMed] [Green Version]
  39. Puetz, J.; Wurm, F.M. Recombinant Proteins for Industrial versus Pharmaceutical Purposes: A Review of Process and Pricing. Processes 2019, 7, 476. [Google Scholar] [CrossRef] [Green Version]
Figure 1. Simplified process flow diagram for the microbial production of hyaluronic acid. The portion encircled by a purple rectangle only exists in scenarios S3 and S4. The rest of the process is common to all scenarios (S1–S4).
Processes 09 00241 g001
Figure 2. Equipment occupancy chart for the production of 8 batches of hyaluronic acid (scenario S1). The Y-axis lists the main equipment items used in the process, while the X-axis represents time. Each batch is shown by a distinct color.
Processes 09 00241 g002
Figure 3. Phase diagram for the mixture of isopropanol and water at a constant pressure (1.013 bar). The azeotropic point is indicated by a black arrow. This chart was generated by SuperPro Designer using an NRTL model of vapor-liquid equilibrium.
Processes 09 00241 g003
Figure 4. Breakdown of the unit production cost for all evaluated scenarios.
Processes 09 00241 g004
Figure 5. Breakdown of the unit production cost and capital investment by process section (scenario S1).
Processes 09 00241 g005
Figure 6. Effect of the production scale on the unit production cost and total capital investment (scenario S1).
Processes 09 00241 g006
Table 1. Design basis for the microbial production of hyaluronic acid (HA).
ParameterSpecification
Production Scale20 MT of HA/yr
Annual Operating Time7920 h (330 days)
Process Cycle Time24 h
Production Fermentation Cycle Duration33 h
Concentration of HA (as sodium hyaluronate) in the broth 12.5 g/L
Concentration of biomass (DCW) in the broth 15.0 g/L
Contaminating peptides/proteins in the broth 121 g/L
% of Proteins in the Final Product≤0.1% 2
1 By the end of fermentation, in scenarios S1 and S3. Scenarios S2 and S4 result in concentrations 2× higher. 2 According to the specifications of the European Pharmacopoeia for sodium hyaluronate to be used parenterally [32].
Table 2. Amounts of raw materials used to produce 1 kg of hyaluronic acid, broken down by process section (scenario S1).
Raw MaterialUpstream Section
(kg/kg MP 1)
Primary Recovery (kg/kg MP)Purification
(kg/kg MP)
Isopropanol Recycle
(kg/kg MP)
Total
(kg/kg MP)
Air1729.20.018.80.01748.0
CIP-Acid13.530.015.50.059.0
CIP-Caustic34.756.127.50.0118.2
Glucose12.30.00.00.012.3
Isopropanol0.00.00.02.62.6
NaOH
(20% w/w)
10.30.00.00.010.3
NaOH
(4% w/w)
0.00.08.00.08.0
RO Water427.42133.3300.30.02861.0
Salts4.80.00.00.04.8
Water399.00.00.00.0399.0
Yeast Extract29.60.00.00.029.6
1 MP stands for main product, i.e., sodium hyaluronate with a moisture content of 5% w/w.
Table 3. Total capital investment, unit production cost, and profitability metrics for all evaluated scenarios of hyaluronic acid production.
S1S2S3S4
Total Capital Investment (million US$)53.544.3107.089.6
Unit Production Cost (US$/kg)111594616911449
Return on Investment (ROI)32.6%43.5%42.5%53.1%
Payback Time (years)3.072.302.351.88
Net Present Value 1 (NPV) (million US$)92.4115.3276.5308.7
Product for Topical Use (kg)20,00020,00019,06719,067
Product for Injectable Use (kg)00871871
1 Considering an annual interest rate of 5%.
Publisher’s Note: MDPI stays neutral with regard to jurisdictional claims in published maps and institutional affiliations.

