Article

Design, Modelling, and Experimental Validation of a Scalable Continuous-Flow Hydrothermal Liquefaction Pilot Plant

1
Department of Engineering, Aarhus University, 8000 Aarhus, Denmark
2
Center for Quantitative Genetics and Genomics, Aarhus University, 8000 Aarhus, Denmark
*
Author to whom correspondence should be addressed.
Processes 2021, 9(2), 234; https://doi.org/10.3390/pr9020234
Submission received: 31 December 2020 / Revised: 20 January 2021 / Accepted: 22 January 2021 / Published: 27 January 2021
(This article belongs to the Special Issue Process Design of Biomass Thermochemical Conversion)

Abstract

:
In this study, the design and practical implementation of a novel, scalable plug-flow pilot plant for hydrothermal liquefaction of organic feedstock is presented. The overall discussion comprises the system’s design, process modelling, and simulation, as well as results for an experimental validation of the proposed design with a focus on fluid dynamics and heat transfer. The design criteria take into account the scalability of the plug-flow processing system, optimized non-isothermal flow conditions of highly viscous liquids in a tubular system at harsh process conditions, specifically high pressure and medium temperatures, and overall maintenance suitability. A novel forced flow oscillation system as well as unique heat exchange design to reduce the energy consumption during system operation, maximize local flow mixing, and minimize plugging are proposed and experimentally tested. To achieve a better understanding and optimization of Hydrothermal Liquefaction (HTL) (and other) processing systems, a mathematical model of heat transfer coupled with non-isothermal fluid flow was also developed and implemented.

1. Introduction

The rapidly growing demand for transportation fuels and materials derived from renewable sources calls for innovative and disruptive technologies to be implemented within the context of the circular bio-economy. Whilst there is general consensus that the majority of land-based fuel requirements will be met by a combination of renewably derived electric and hydrogen solutions together with combined grid energy storage, the challenge of reducing the marine, aviation, and sustainable material sector’s carbon life cycles on a large scale remains.
Some processes focus on carbon dioxide as a chemical building block making a varied array of chemicals used throughout the industry such as ethylene, methanol, formaldehyde, and liquid hydrocarbon fuels [1]. Other thermochemical pathways include thermal and catalytic gasification followed by Fischer–Tropsch or methanation reactions, hydrothermal carbonization, and torrefaction [2].
The Hydrothermal Liquefaction (HTL) process provides several advantages as it primarily avoids the energy penalty associated with gaseous-phase processes by exclusively operating in the liquid phase, a high carbon yield, as well as producing more stable biocrude oils [3]. Because a well-designed HTL process does not overshoot the desired molecular weight of the target products, the energy savings compared to a gasification step, where the incoming feedstock is first broken down to primarily hydrogen and carbon monoxide, are significant. Either an ex- or in-situ hydro treating process can optionally follow the HTL process, in order to obtain products with generally higher hydrogen content, lower oxygen content and an increased HHV. This allows for the production of valuable compounds such as aromatic compounds derived from lignin residues originating from pulping processes, transportation fuels from municipal solid wastes, and sewage sludge [4]. In addition, it allows for efficient recovery of phosphate in an accessible form. The ability to convert such a diverse array of materials means that HTL is a truly versatile process allowing for the production of sustainable compounds from what are currently cost negative feedstock. HTL provides the opportunity of a breakthrough in water treatment technology, which has the potential to provide economic and societal benefits to millions across the developing world [1].
HTL is extreme pressure process with temperature ranges between 150 and 374 °C which is the supercritical temperature of water [5]. Above the supercritical point (where the physical and chemical properties of water changes drastically) the process is usually referred to as hydrothermal- or catalytic gasification. The dielectric constant is close to that of benzene, which means that nonpolar substances becomes soluble in water, while the self-dissociation decreases and radical formation increases, resulting in a scission heavy process, which produces smaller and more volatile products; hence, the name hydrothermal gasification [6]. By keeping the temperature in the subcritical region, while keeping the pressure above the boiling point of the solvent (usually water or a water/ethanol solution), ionic thermal depolymerization processes convert the biomass into biocrude, an oil somewhat similar to that of crude oil, by cleaving bonds with relatively low dissociation energy. Previous studies have shown that if biocrude yield is the main focus, then 300 °C is the preferred set point temperature, while if the higher heating value is the main focus, higher temperature should be used [7,8].
While many different reactions occur during HTL, the thermal depolymerization is mainly due to hydrolysis reactions (and decarboxylation at higher temperatures), which results in an oil product with high H/C and low O/C ratios, properties that are preferred when producing fuel oil. However, if the focus is on chemical production, the aim is usually to retain as many as the functional groups as possible, in a product stream that can later be separated into specific compounds. If the product has a more general use, e.g., for foams, additives in bio-asphalt or as binders, the focus is usually to get a product with a high concentration of certain functional groups (alcohols, acid groups, ketones, etc.) and a somewhat well-defined average molecular weight [9,10].
To achieve such specific properties from a chemically complex starting material, it is necessary to have a well-defined process with a high degree of controllability. Therefore, the primary aim of this study was to demonstrate the construction, commissioning and initial optimization of a scalable hydrothermal liquefaction facility capable of processing highly viscous and high dry matter feedstock slurries. For this purpose, a continuous plug-flow HTL processes has been modelled, the HTL pilot plant has been designed and further tested.

2. Materials and Methods

2.1. General Design

2.1.1. Process System Design

The general overview of primary components and the process flow of the HTL plug-flow processing system is depicted in Figure 1. The main flow system consists of Inconel 625 pipes with an inner (outer) diameter of 14.27 mm (25.40 mm) and total pipe length of 147 m. The process starts when an untreated biomass is loaded into a twin-screw kneader extruder where it is milled and further supplied to a custom built premixing system.
In the premixing system, municipal water is added to the biomass to achieve the desired dry matter content (typically 10–20%), and optionally an acid or base catalyst is added such as potassium or sodium hydroxide in order to promote desirable catalytic thermal depolymerization reactions. A small amount of viscosity modifier (carboxy-methyl cellulose) may be added to aid in stabilizing the biomass slurry, particularly from a feed input perspective. From the premixing system the slurry is fed via a helical screw pump to a high-pressure reciprocating pump (HPRP) (Graco WM2U78, 68:1 air driven piston pump Graco Inc., Minneapolis, MN 55413, USA), which can deliver up to 345 bar working pressure.
The HPRP plays the role of a main pressure generating and biomass supplying unit, which continuously maintain the operating pressure of up to 350 bar and a flow rate of up to 100 L/h. The pretreated and pumped biomass flows further through a counter-current heat exchanger, with a pipe length of 2 × 25 m, where it is preheated up to 75–80% of the set point temperature, depending on operating conditions. The preheated flow is then sent to a trim heater, where the biomass is heated to the set point temperature.
The trim heater has a length of 17 m, and additionally has 32 × 1200 W heating elements distributed along its length. The HTL reactions start within the last part of the trim heater and continue in the following 61 m long reactor, where a near-constant temperature is maintained. After the product exits the reactor, it is directed back to the heat exchanger where it meets the cold biomass in a counter-current flow configuration in order to achieve a semi-rapid cooling. The cooled product is then passed through a 6m long water jacketed product cooler, where it can be cooled down to approximately 70 °C, if needed.
Finally, a depressurization system relieves the pressure and the product flows to a product barrel. In addition, in order to generate a forced oscillatory flow within the entire process system, two hydraulic pistons are connected to the piping line.

2.1.2. Fluidic Design and Feed system

In a plug flow reactor, time and temperature are the variables that are most sensitive regarding continuous processes. In this case, the HTL process requires turbulent or partly turbulent flow to achieve uniform residence time and temperature profiles, necessary to get the optimum distribution in the product stream(s). Furthermore, in a research plant it is often necessary to be able to test a lattice of different reaction parameters; therefore, it is preferable that pressure, residence time, and flow are individually variable as far as reasonably practical.
To achieve this each of individual process units control the above-mentioned parameters. The feed pump (HPRP) controls the pressure, the overall flow rate and thus the residence time is controlled by a take-off system in a semi-continuous manner and the local flow rate is controlled by an oscillation system operating at a specified flow frequency. This makes the reactor novel in terms of decoupling the residence time from the volume of the reactor.
The pressure control of the system is controlled manually by controlling the pressure of the airflow driving the pump (HPRP) where the system pressure is given by the ratio between the air piston and the hydraulic pressure, i.e., a change of one bar in air pressure will result in a change of system pressure of 68 bar. The modifications include a low-volume feed tank and an eccentric screw pump. These modifications have been added to provide continuous stirring of the feed slurry, to minimize the need for excessive stabilization and pretreatment of the biomass.

2.1.3. The Take-Off System

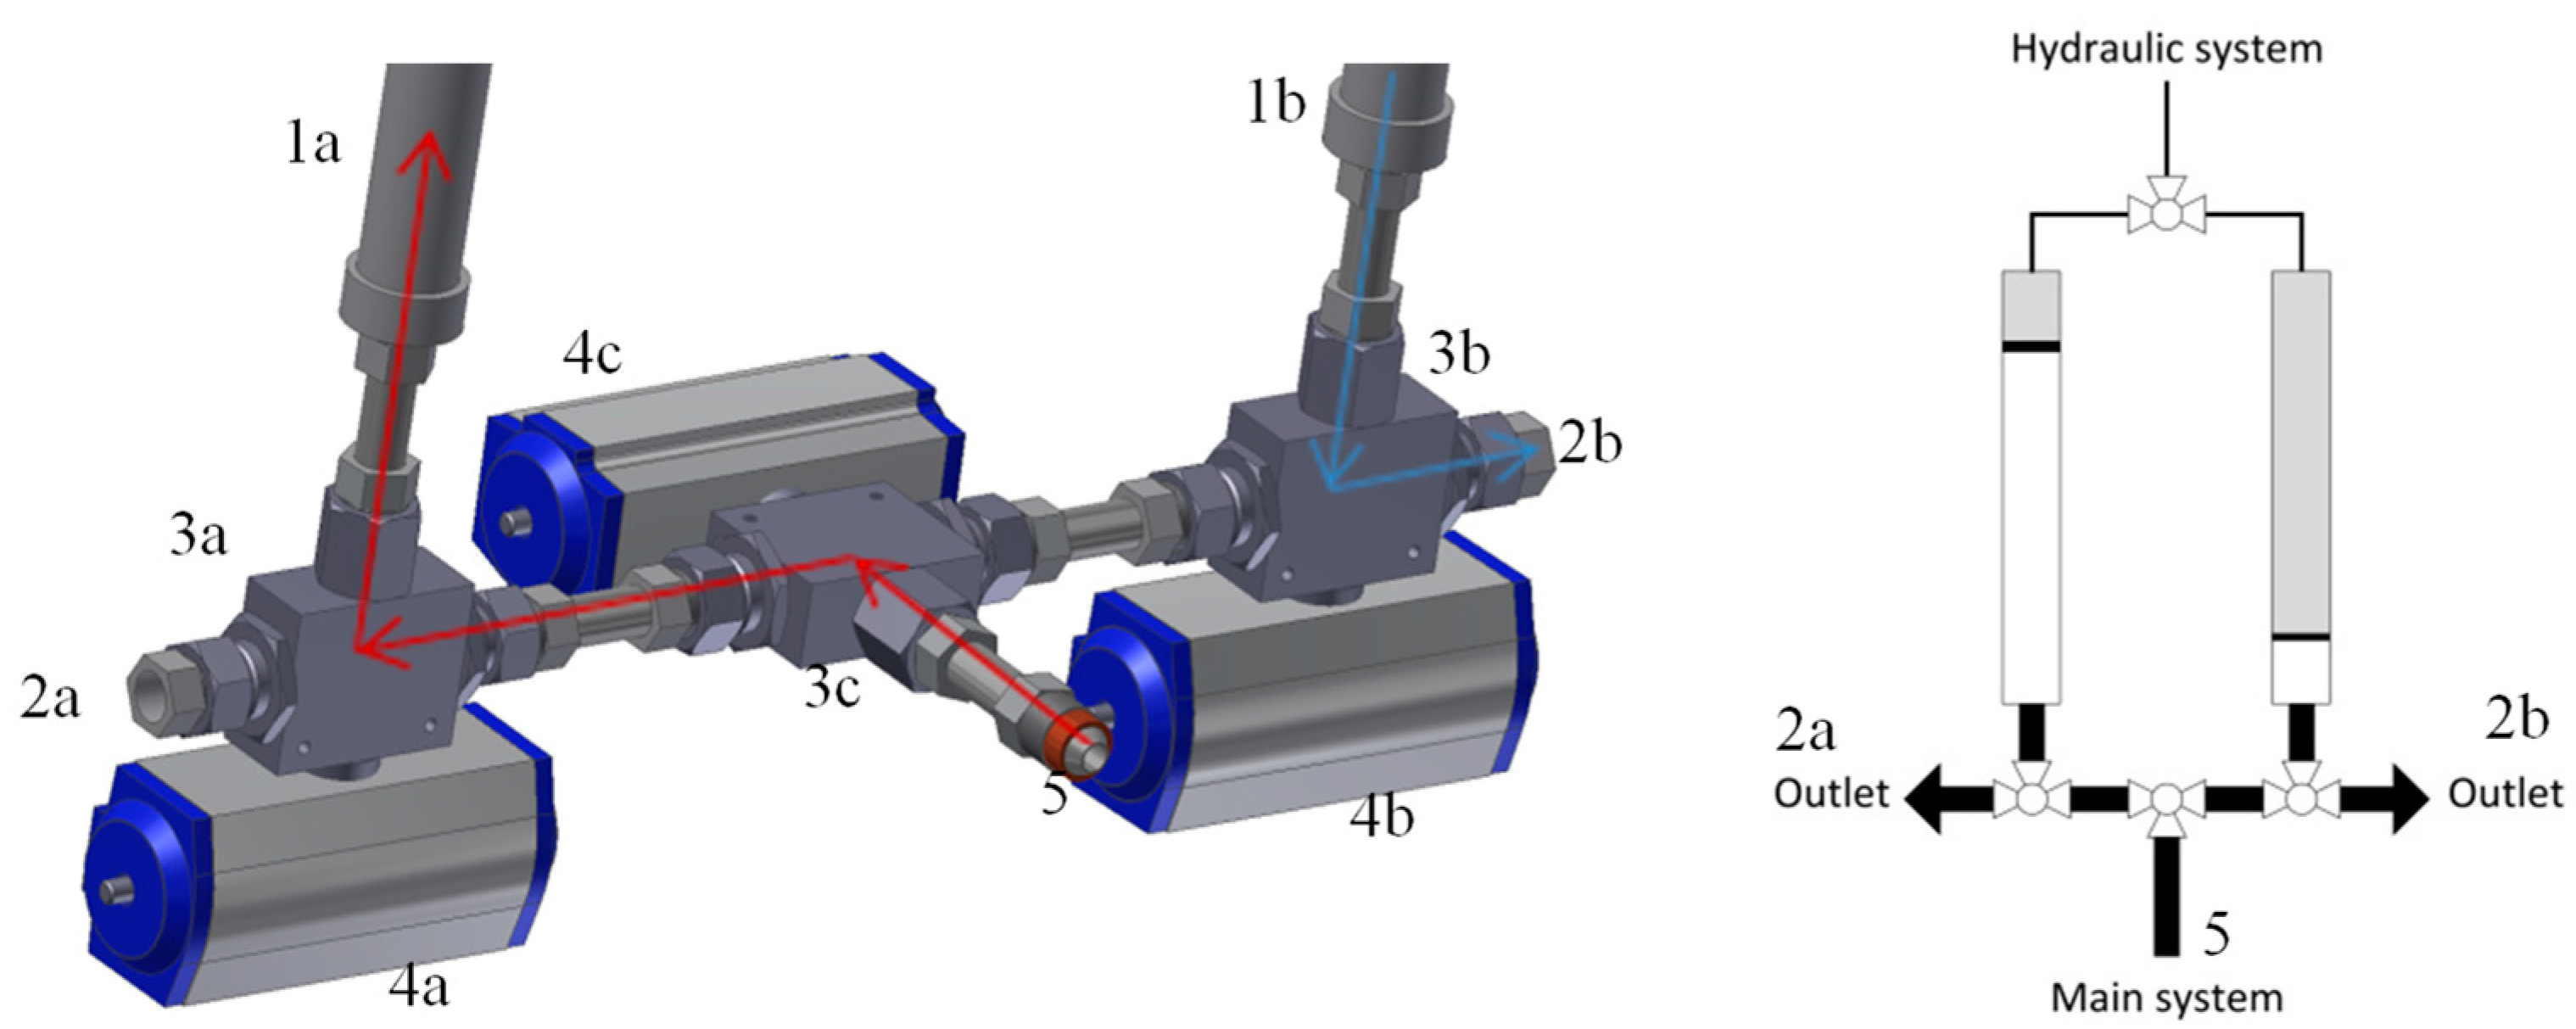
The flow and pressure take-off (Figure 2) is controlled by what is essentially a reverse dual piston pump The take-off cycle works as follows: The middle valve (Figure 2(3c)) opens to side a, where the valve (Figure 2(3a)) is open towards the middle; the piston in cylinder 1a goes up to take in product; 3c opens towards side b, while the piston continues to move up, to reduce the pressure; 3a opens towards the low pressure side (Figure 2(2a)); the 1a begins to empty; 3a opens towards 3c while the piston continues to move down, to build up a pressure. The cycle then starts over. Side b has the cycle, but with an offset. This results in a close-to-continuous flow, where the valves 4a and 4b turn without a pressure difference, thus decreasing wear and tear. Technical specifications for the take-off system can be found in supporting information. During plant start-up, the take-off system can be bypassed via a Back Pressure Regulator (BPR) in order to reduce mechanical wear on moving parts.

2.1.4. Oscillatory System

In order to lower the viscosity of the non-Newtonian shear-thinning bio-slurry and to increase the heat recovery/transfer rate, an oscillating flow is created in most of the 147 m system, Figure 3. It is generated with a hydraulic controlled piston in each end, running in reverse phase, see Figure 4. These pistons create a displacement of approximately 2 m in each direction, resulting in a localized flow of 0.4 to 1 m/s, which is approximately an order of magnitude higher than the overall flow rate. The higher flow rate and constant de- and acceleration results in a flow with more turbulence and higher shear stress, which lowers the viscosity, increases the heat transfer rate and creates a more uniform residence time and temperature profile. Technical specifications for the oscillatory system can be found in supporting information.

2.1.5. Thermal System

To perform the efficient operation of a scalable HTL plant in terms of total operating costs and optimal physio-chemical performance, several requirements are imposed to the thermal part of the processing system: (a) energy recovery; (b) bio-slurry preheating; and (c) fast product cooling. These have been satisfied by the design of the specific thermal components, as well as configuration design of the processing system. The thermal part of the processing system consists of three major components: (1) the heat exchanger which is designed to ensure the thermal energy recovery with primary functions of bio-slurry preheating and product cooling; (2) the trim heater, which serves to provide a relatively fast final heating of the preheated bio-slurry; and (3) the reactor where the majority of chemical HTL reactions occur.
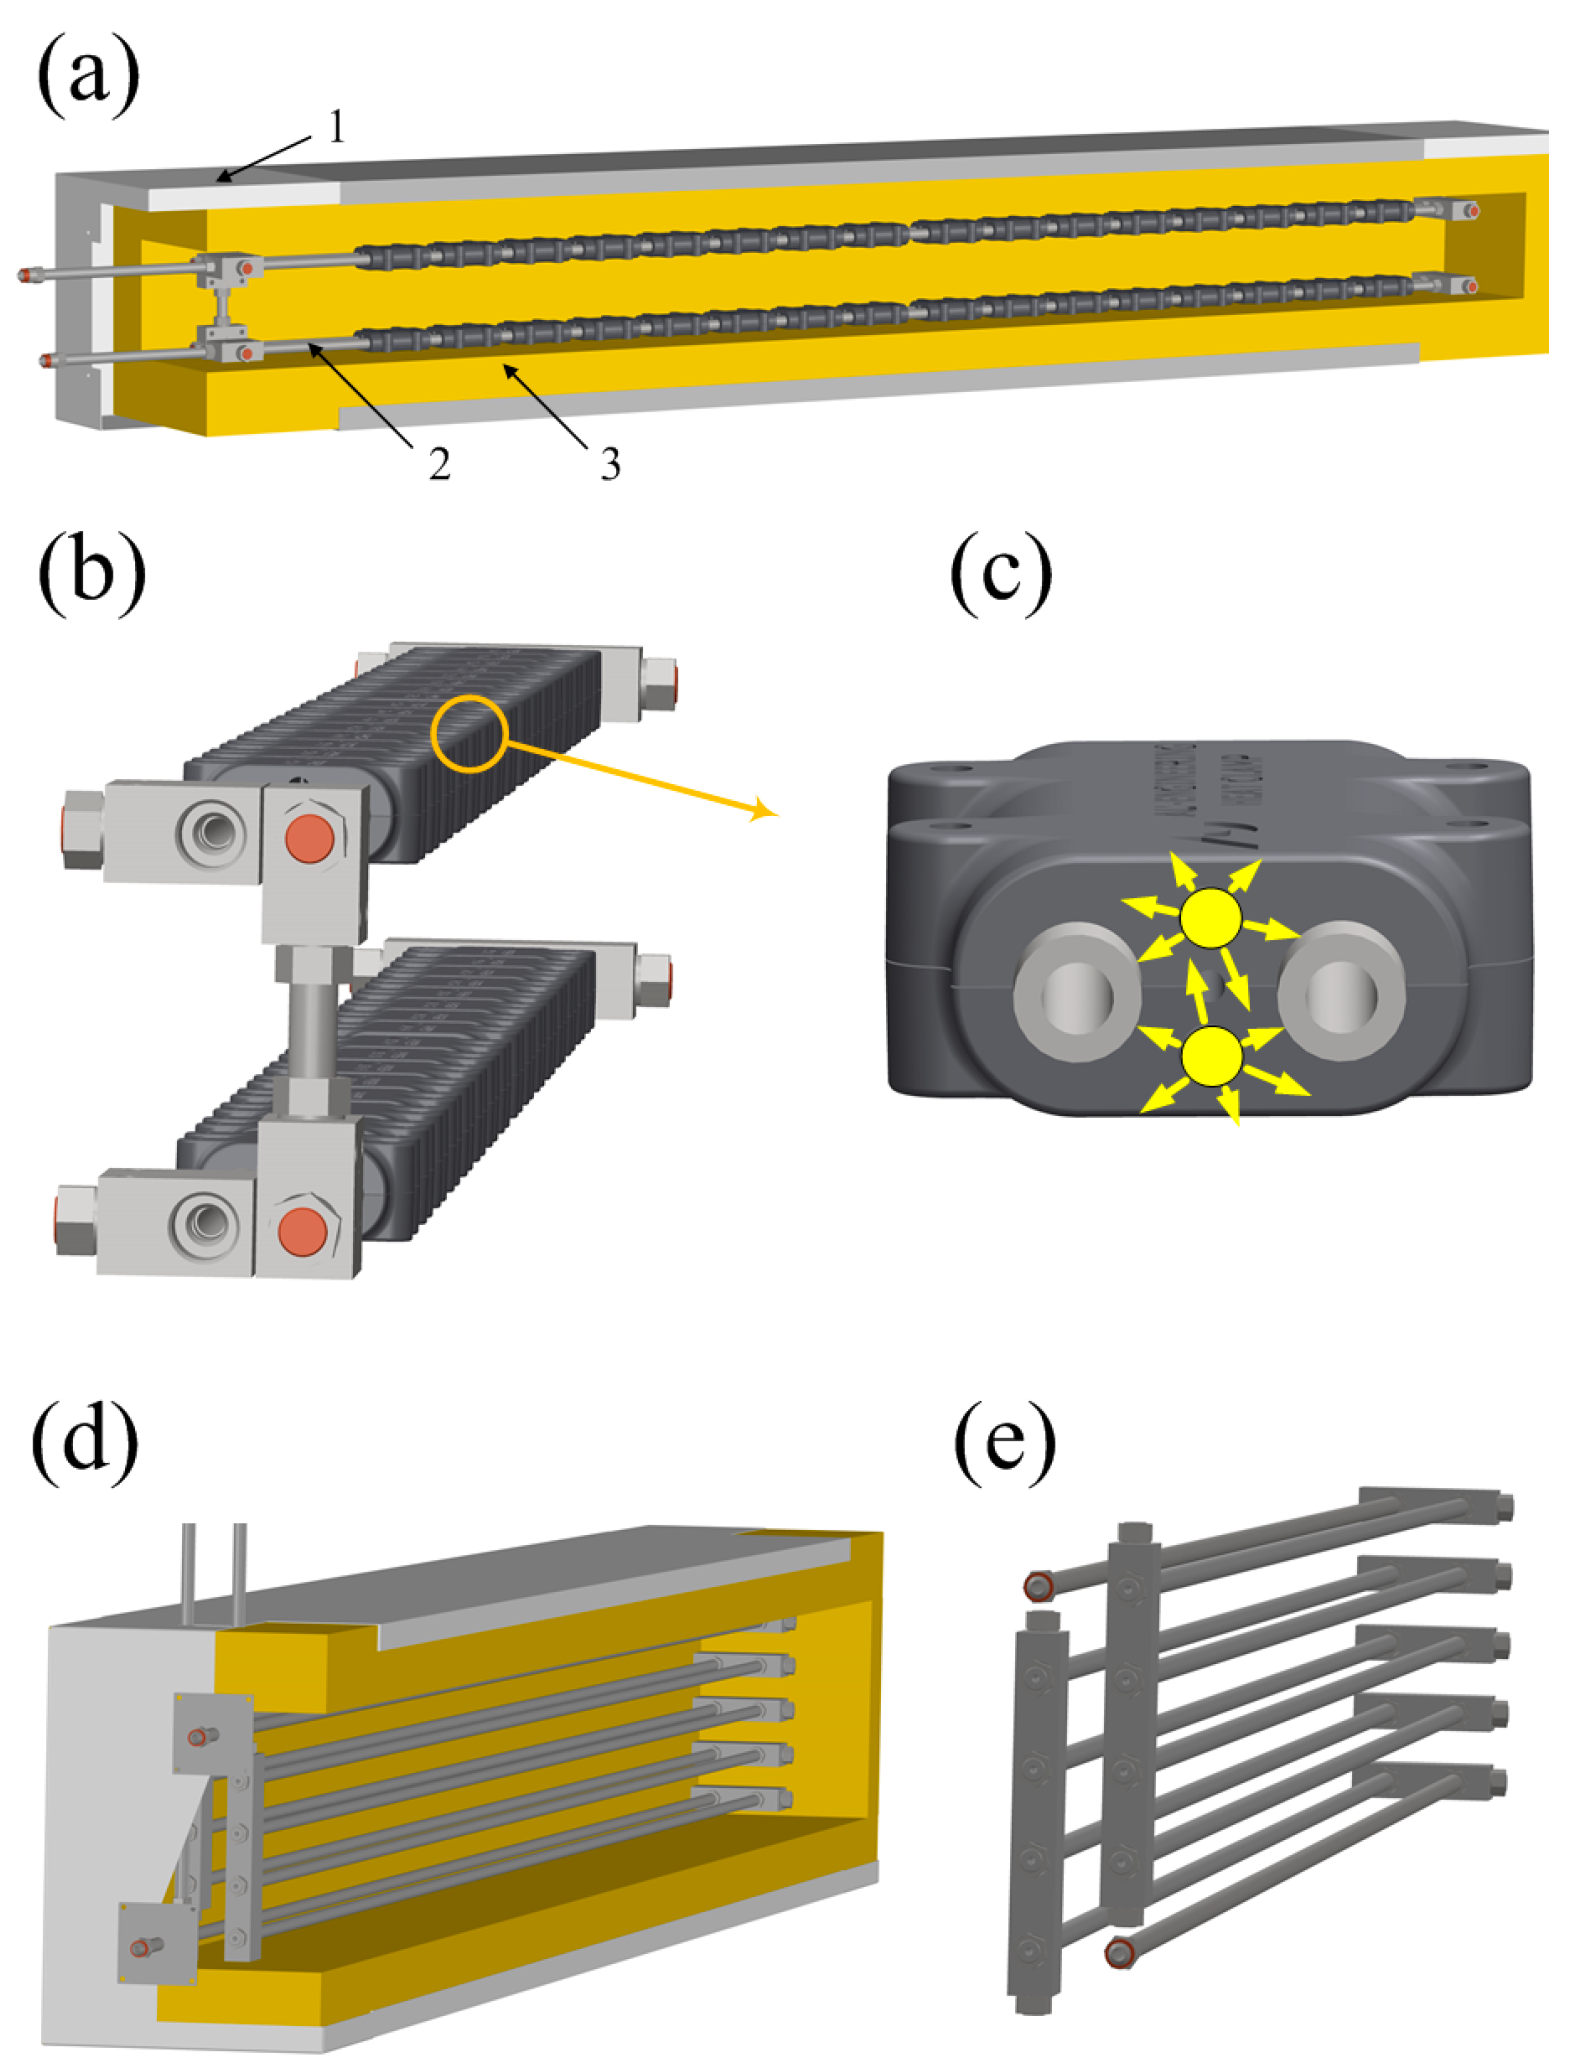
To avoid excessive repolymerization reactions in the product flow, fast cooling is required after the reactor. Most of the thermal energy removed from the product flow can be recovered by heating the incoming cold bio-slurry. This is done in a counter-current heat exchanger, due to its well-known efficient heat transfer properties. The combination of high pressure, high temperature, non-homogeneous, and viscous slurry, renders traditional heat exchanger designs such as plate and shell and tube impractical, if not impossible to incorporate. Because of this a new heat exchanger design has been realized, where a complete cross-section view can be seen in Figure 4a.
In addition to the requirements discussed above, the heat exchanger requires a low capital cost and to be maintenance suitable, which supplementary determines the specific unit design. The overall configuration and main construction elements of the unit are shown in Figure 4. The main component of the unit is the heat exchanger which consists of two pipe line systems (2 × 24 m), which are thermally connected with cast iron clamps, Figure 4b. The clamps act as a heat transfer medium and are equally distributed along the pipes (with an average distance between each clamp of 30 mm), Figure 4c. To reduce the heat flux to an ambient medium, the heat exchanger is placed into a stainless steel coffer, filled with Rockwell dense mats insulation.
The trim heater unit, Figure 5a, has a relatively short pipe line system ( 17   m length in total), which is a one-pipe bundle placed in two rows, Figure 5b. The heat transfer medium, which is essentially the same as the heat clamps in the heat exchanger, these are equally distributed along the bundle (with an average distance between each clamp of 85 mm). The heat sources are 600 W rod-like heating elements embedded into the clamps as shown in Figure 5c. As with the heat exchanger, the pipes are placed in a stainless still coffer and filled with insulation in the same manner as the heat exchanger, with the exception of there being no glass foam.

2.1.6. Clean in Place System (CIP)

As a part of the practicality of running a continuous HTL plant, a fully automated and continuous cleaning system is required to prevent the system blocking in the case of a system failure. The primary response upon system failure is to keep the system contents moving by means of the oscillation system while the issue is resolved. If this is not possible, the CIP system circulates a strong soap around the system in order to ensure that blockages are minimized and mechanical integrity is maintained. The system can be operated with recycle circulation in order to reduce cleaning material expenses. Once the take-off system pistons are clean, the flow can be bypassed around the take-off system via a back-pressure regulator (BPR) in order to reduce mechanical wear as is the case for heating up the system using only water.

2.1.7. Pressure Relief System

In the case of a sudden partial depressurization resulting in sudden gaseous phase operation, a fully automated blowdown procedure can be triggered, whereby the pressure is relieved through expansions via an exhaust vent at two locations.

2.2. Mathematical Model

HTL of biomass is known to be an effective technology to produce bio fuels [11,12]. The underlying mechanism of HTL comprises a range of continuous processes; biomass depolymerization, decomposition and recombination under the sub- and super-critical conditions [11,12]. Therefore, there are two coupled, though distinguishable, process types which determine the hydrothermal liquefaction. The chemical processes, which are responsible for biomass decomposition, as well as a new product formation, and the physical processes of heat and mass transfer.
The mathematical modelling is an important stage of design and study of HTL systems. However, despite active research and practical application of HTL technology, modelling studies of hydrothermal liquefaction have mostly been dedicated to chemical product conversion [13,14], whereas the processes of heat and mass transfer has not attracted sufficient attention.
In the context of the current work, the purpose of development of a mathematical model of an HTL system is to addresses the following; better understanding and prediction of complex the physical processes of heat and mass transfer (fluid flow), under the sub-critical conditions during hydrothermal liquefaction; and optimization of the design, with the objectives of enhancing the energy efficiency, optimizing the temperature profile and achieving a better control of the chemical composition of the product stream.

2.2.1. Modelling Approach and Assumptions

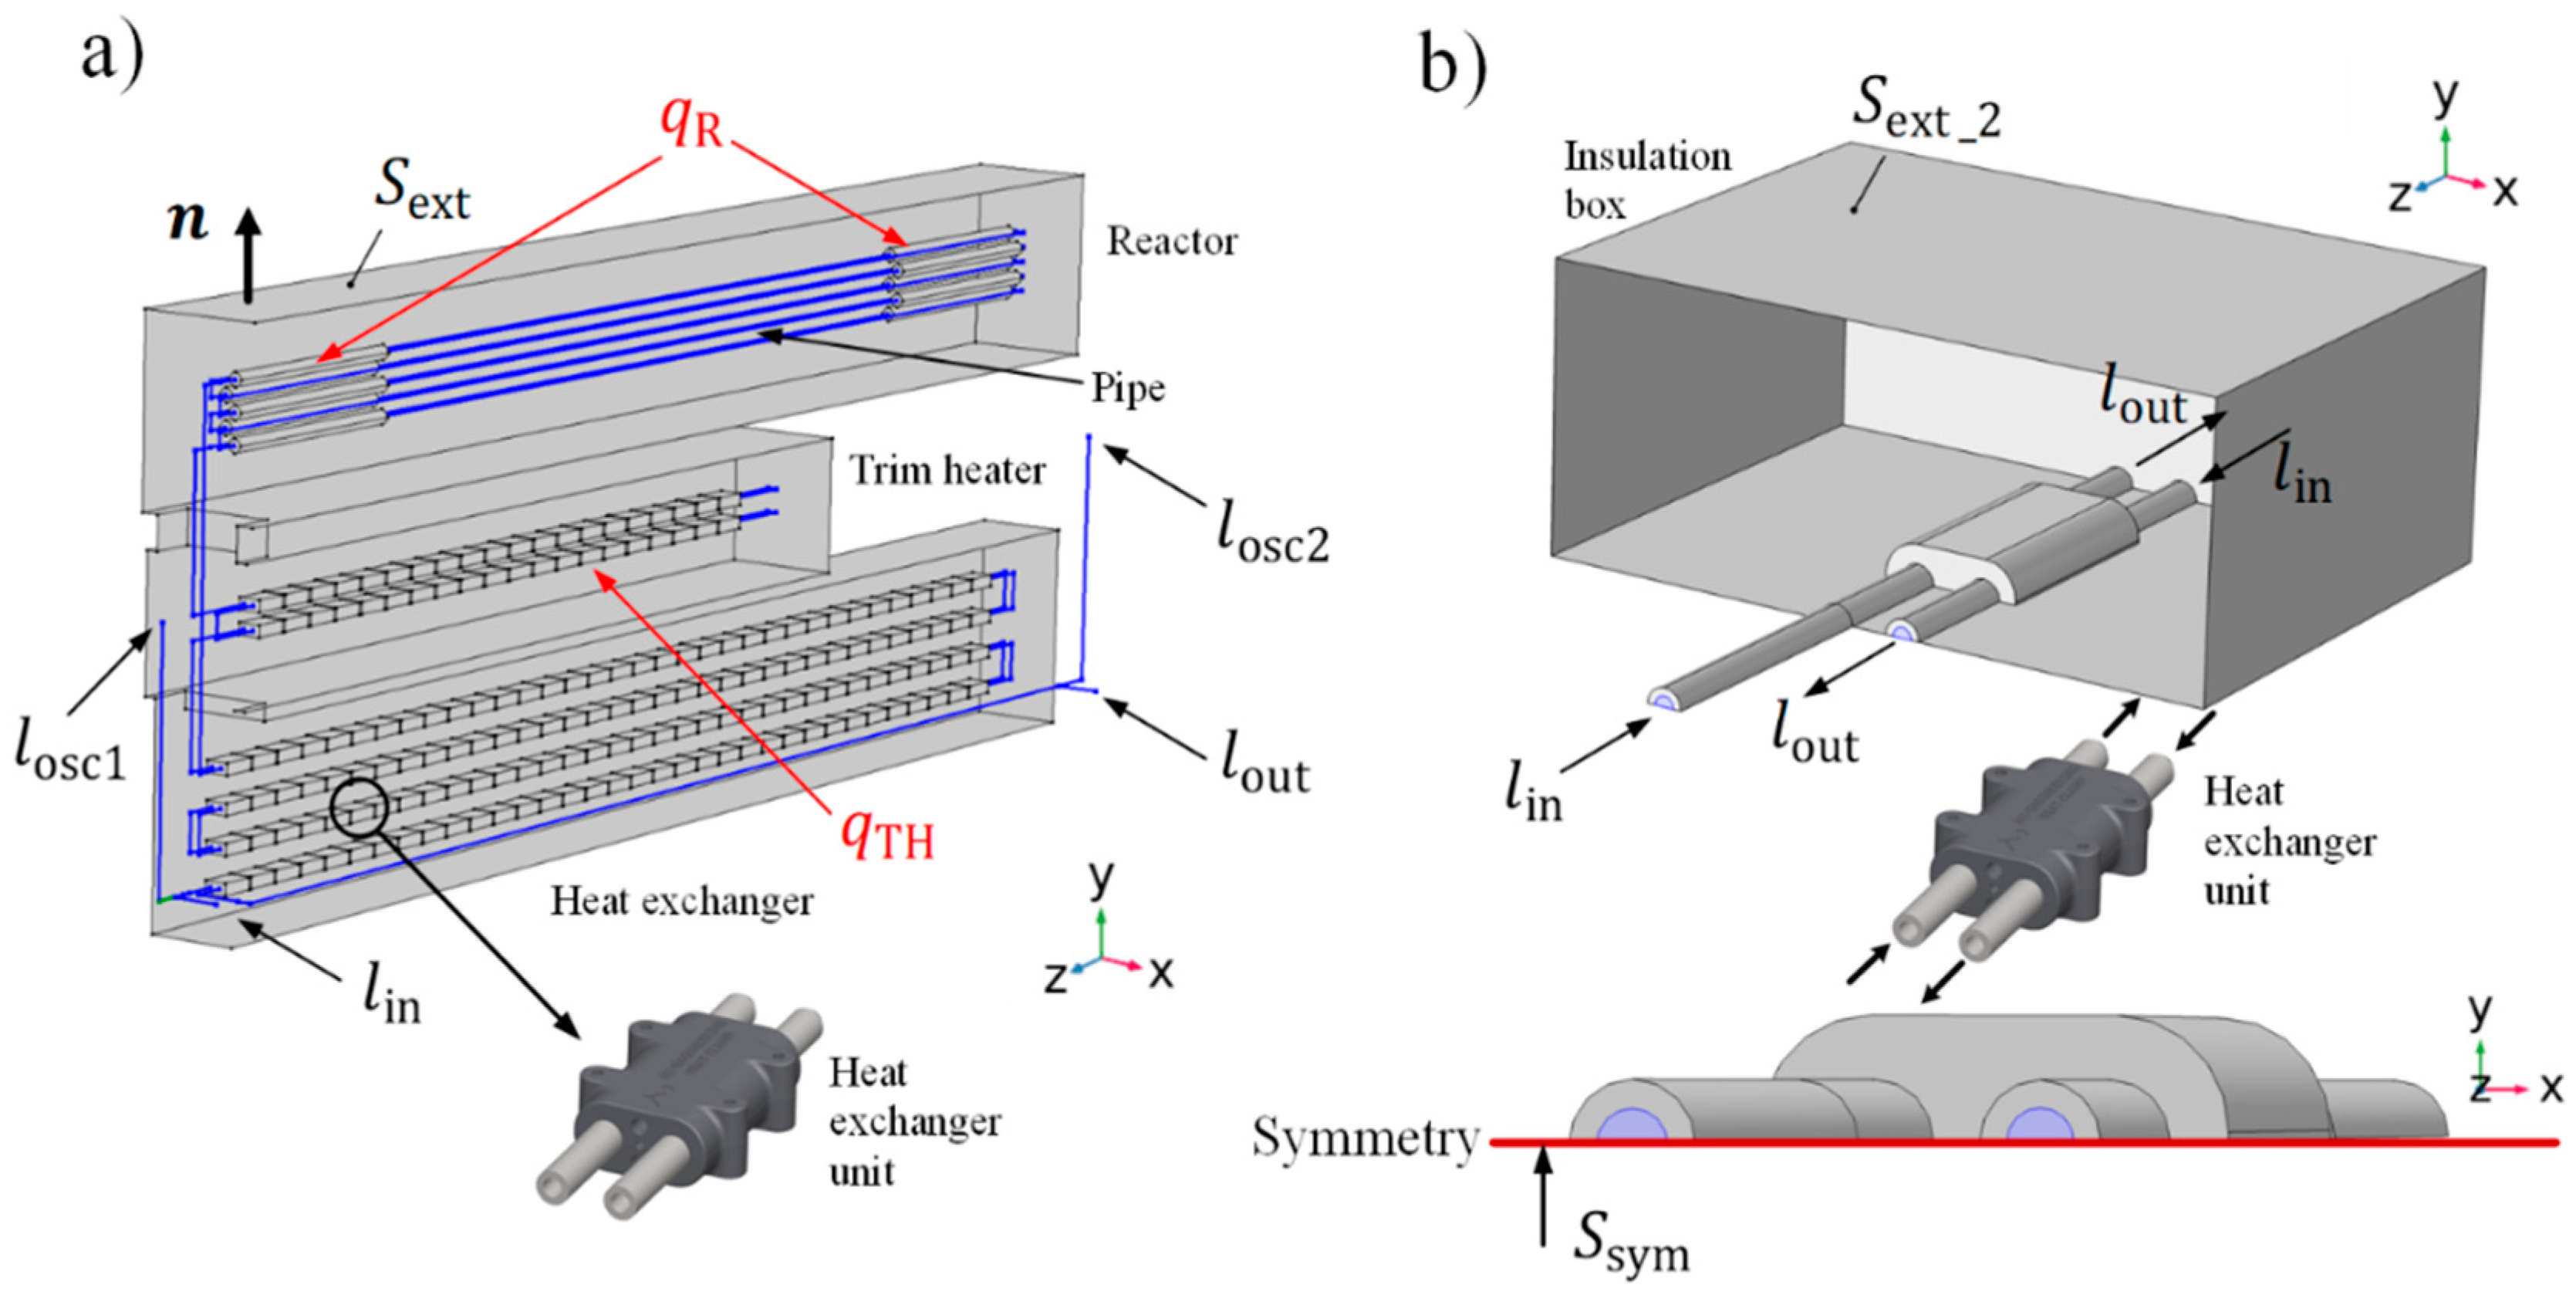
A characteristic length of geometrical domains (Figure 6), where the processes take place, ranges from a microscale length, ~ 10 3 m, which is determined by the pipe’s diameter, to a macroscale length, ~10 to 102 m, which is determined by the length of the pipe.
The microscale characteristic length determines a minimal size of a computational mesh element in the geometrical domains. As a result, a computational mesh of the entire model can comprise of more than 10 9 mesh elements in total. This imposes significant computational limitations on numerical solution of the microscale-defined model of the HTL reactor, since the amount of required floating-point operations to complete the simulation is proportional to the number of estimated mesh elements.
The microscale characteristic length is a key parameter mainly for the process of fluid flow in the pipe. The simplified Navier–Stokes equations, where averaged characteristics of velocity and pressure are assumed in a flow, allows a model of quasi-one-dimensional flow in the pipe [15]. Hence, the microscale length become redundant in the case of a one-dimensional pipe and the macroscale characteristic length can be allowed everywhere in the model’s domains (Figure 6a). The numerical solution for such macroscale-defined models give a detailed temperature distribution in the reactor, though only the averaged characteristics of temperature, velocity and pressure distribution along the (one-dimensional) pipe.
In order to resolve the detailed flow and heat transfer conditions within the pipe, the detailed thermo-fluidic microscale-defined model, restricted in the space to one heat exchanger unit with relatively short pipe parts (Figure 6b), was also established.
Overall, the introduced two-scale modelling approach, aimed to overcome the computational limitations, can be outlined in the following (simulation) scheme. At first, we simulate the macroscopic HTL system model in a geometry domain depicted in Figure 6a. The results give a macroscopic temperature, velocity and pressure distribution in the reactor. Then, the microscopic heat exchanger unit model is simulated, in a geometry domain depicted in Figure 6b. The results give microscopic characteristics of non-isothermal turbulent fluid flow. The coupling between these two scale-defined models is realized through the boundary conditions.

2.2.2. Macroscale Model: Fluid Flow and Heat Transfer (on the Pipe Domain)

The following momentum and continuity equations determine the pressure-driven quasi-one-dimensional flow in the pipe [15]:
ρ u ˙ = P ( 2 d h ) 1 f D ρ | u | u
A ρ ˙ + · ( A ρ u ) = 0
where ρ is the density of the fluid; u is the cross-section averaged velocity; p is the pressure; f D is the Darcy friction factor; d h is a mean hydraulic diameter; A is a pipe’s inner cross-section area; dot denote a time derivative.
Two types of fluids, pure water and a Miscanthus suspension (10% dry matter content), were experimentally tested and, hence, considered in the model. In contrast to the water flow, where the common Newtonian fluid model is applicable, the Miscanthus suspension appears to behave as a shear-thinning fluid, characterized by a yield stress [16] and, therefore, require a non-Newtonian fluid model [16,17].
The Bingham plastic model describes the stress-deformation behavior of the Miscanthus suspension [17,18]:
τ = τ y + μ γ ˙   for   | τ | > τ y
γ ˙ = 0   for   | τ | < τ y
where τ is the shear stress; τ y is the yield stress, chosen to be 15 Pa, according to the experimental data; this is also in agreement with the results represented in [16]; μ is the constant plastic viscosity, μ = 0.22   Pa · s according to our measurements; and γ ˙ is a shear rate; dot denotes a time derivative.
The energy balance equation for an incompressible fluid in a pipe [19]:
ρ A C P T ˙ L + ρ A C P u · T L = · A k T L + ( 2 d h ) 1 A f D ρ | u | u 2 + Q w
where C P is the heat capacity at the specific pressure; T L is the temperature of the fluid; k is the thermal conductivity of the fluid and Q w is the external heat exchange through the pipe wall; dot denotes a time derivative.
The boundary value problem on the pipe’s domain (Figure 6a) complete the following boundary conditions:
u | l osc 1 ,   l osc 2 = 0
p | l inl = p inl
p | l out = p out
T L | l inl = T L inl
In the case of a steady-state solution p inl = const , p out = const . In the case of the time dependent solution
p inl = p a inl + p Δ · sin ( ω t + φ inl )
p out = p a out + p Δ · sin ( ω t + φ out )
where p a inl ( p a out ) is the amplitude of the pressure oscillation; ω is the angular frequency; φ inl ( φ out ) is the phase; p Δ is pressure amplitude (see the Supplementary Materials for the experimental data on pressure dynamics). Equations (5) and (6) simulate forced flow oscillations.
The steady-state solution serves as an initial condition for the time dependent boundary value problem.

2.2.3. Macroscale Model: Heat Transfer (on the Rest of the HTL System’s Domain)

The heat transfer obeys the conduction equation [20]:
ρ C P ( T ˙ + u · T ) = · k T + Q
where T is the temperature; Q is a heat source, Q = q TH + q R , where q TH and q R are overall heat transfer rates of the trim heater units and the reactor’s additional heat source units respectively; u is velocity field, u = 0 ; dot denote a time derivative.
The boundary conditions, defined on the outer surface S ext of the HTL system, describe the thermal radiation and convective heat flux:
n · ( k T ) = ε σ ( T 4 ext T 4 )   | S ext + h ( T ext T )   | S ext
where ε is an emissivity; σ is the Boltzmann constant; T ext is an ambient temperature; n is normal to S ext ; h is a heat transfer coefficient. The initial condition is T | t = 0 = T 0 .

2.2.4. Macroscale Model: The Coupling Interface between the Domains

The coupling between the models defined on different domains provided through the external heat exchange through the pipe wall ( Q w , Equation (4))
Q w = h eff ( T T L )
where h eff is an effective value of the heat transfer coefficient.

2.2.5. Microscale Model

To model the flow disturbance induced by the oscillatory system in, we utilize the large eddy simulation (LES) approach. The LES technique relies on a decomposition of flow field to large and small scales, which is realized via a low-pass filter, G , of the Navier–Stokes equations [21]:
f ( x , t ) ¯ = G f ( x , t )
where f ¯ is a filtering variable; f ( x , t ) is a flow quantity (velocity and pressure), function of space and time variables ( x , t ) ; is a convolution product.
From Equation (9) it follows that f = f ¯ + f , where the filtered part f ¯ represents the large scales of the flow (resolved by the model) and sub-filtered part f represents the small scales of the flow which is unresolved part and is subject to additional sub-grid scale modelling.
The filtered Navier–Stokes equations [21]
· u ¯ = 0
u ¯ ˙ + · ( u ¯ u ¯ ) = p ¯ + ν 2 u ¯ · τ S G S
where u ¯ is a velocity field; bar denotes a filtered field; dot denotes a time derivative; denotes an outer product operator; τ S G S is a sub-grid stress tensor.
The stress tensor τ S G S consists of the resolved and unresolved scales. The unresolved velocity and pressure scales are modelled according to the residual based variational multiscale method [22].
The process of conductive heat transfer in the pipe is described by Equation (7), where u = u ¯ .
The boundary conditions for the microscale model:
u ¯ | wall = 0
n T ( p ¯ I + K ) n | l inl = p inl
( p ¯ I + K ) n | l out = p out n
u ¯ · n | S sym = 0
K n ( K n · n ) n | S sym = 0
n · ( k T ) | S ins = 0
T | S ext _ 2 = T macro
n · ( k T ) | l inl = ρ H u ¯ · n
n · ( k T ) | l out = 0
where n is normal to the inlet (outlet) boundary and to the symmetry plane S sym ; I is an identity tensor; p inl ( p out ) the pressure on boundaries, holds the same properties as for the macroscopic model; K = μ ( u ¯ + ( u ¯ ) T ) , μ is dynamic viscosity; S ins is an external surface of the pipes extended outside the box enclosing the heat exchanger unit; S ext _ 2 is an external surface of the box enclosing the heat exchanger unit; T macro is the solution of the macroscopic model; H is an enthalpy.

2.2.6. Numerical Solution

The problem was formulated and numerically solved using COMSOL Multiphysics 5.0 software, COMSOL, Inc., Burlington, MA. The model (system of partial differential equations) was discretized using the finite element method. Then the system of discretized algebraic equations was solved using iterative solvers available within the software.

2.3. Experimental Characterization

The experimental tests consisted of non-Newtonian flow characterization followed by reactor flow characterization tests. Two types of reactor flow tests were considered, namely a pulse and a step test. In this case an extended pulse test was used, analogues to two step tests in close succession, repeated three times.

2.3.1. Non-Newtonian Flow Characteristics of Biomass Slurries

As biomass slurries are highly non-Newtonian it is of great importance to understand the shear thinning characteristics of biomass slurries with varying dry matter contents. In these experiments, it was chosen to use milled pine slurries (see Section 2.3.3) in three dry-matter concentrations: 4.4%, 8.3%, and 16%. The plant’s circulation pump was used to circulate the biomass via a well-defined constriction over which the pressure drop was measured by means of a differential pressure sensor (Aplisens APR-2200ALW). The constriction reduced the 60 mm internal diameter feed line to a 200 mm long and 20 mm internal diameter tube via two 40mm long conical adaptors Taking into account the constriction geometry, the flowrate and the differential pressure the apparent (dynamic) viscosity could be determined. A Labview Compact Data Acquisition Unit (cDaq-9171) with module NI-9208 was used to continuously sample and collect data from the differential pressure sensor.

2.3.2. HTL Plant Facility

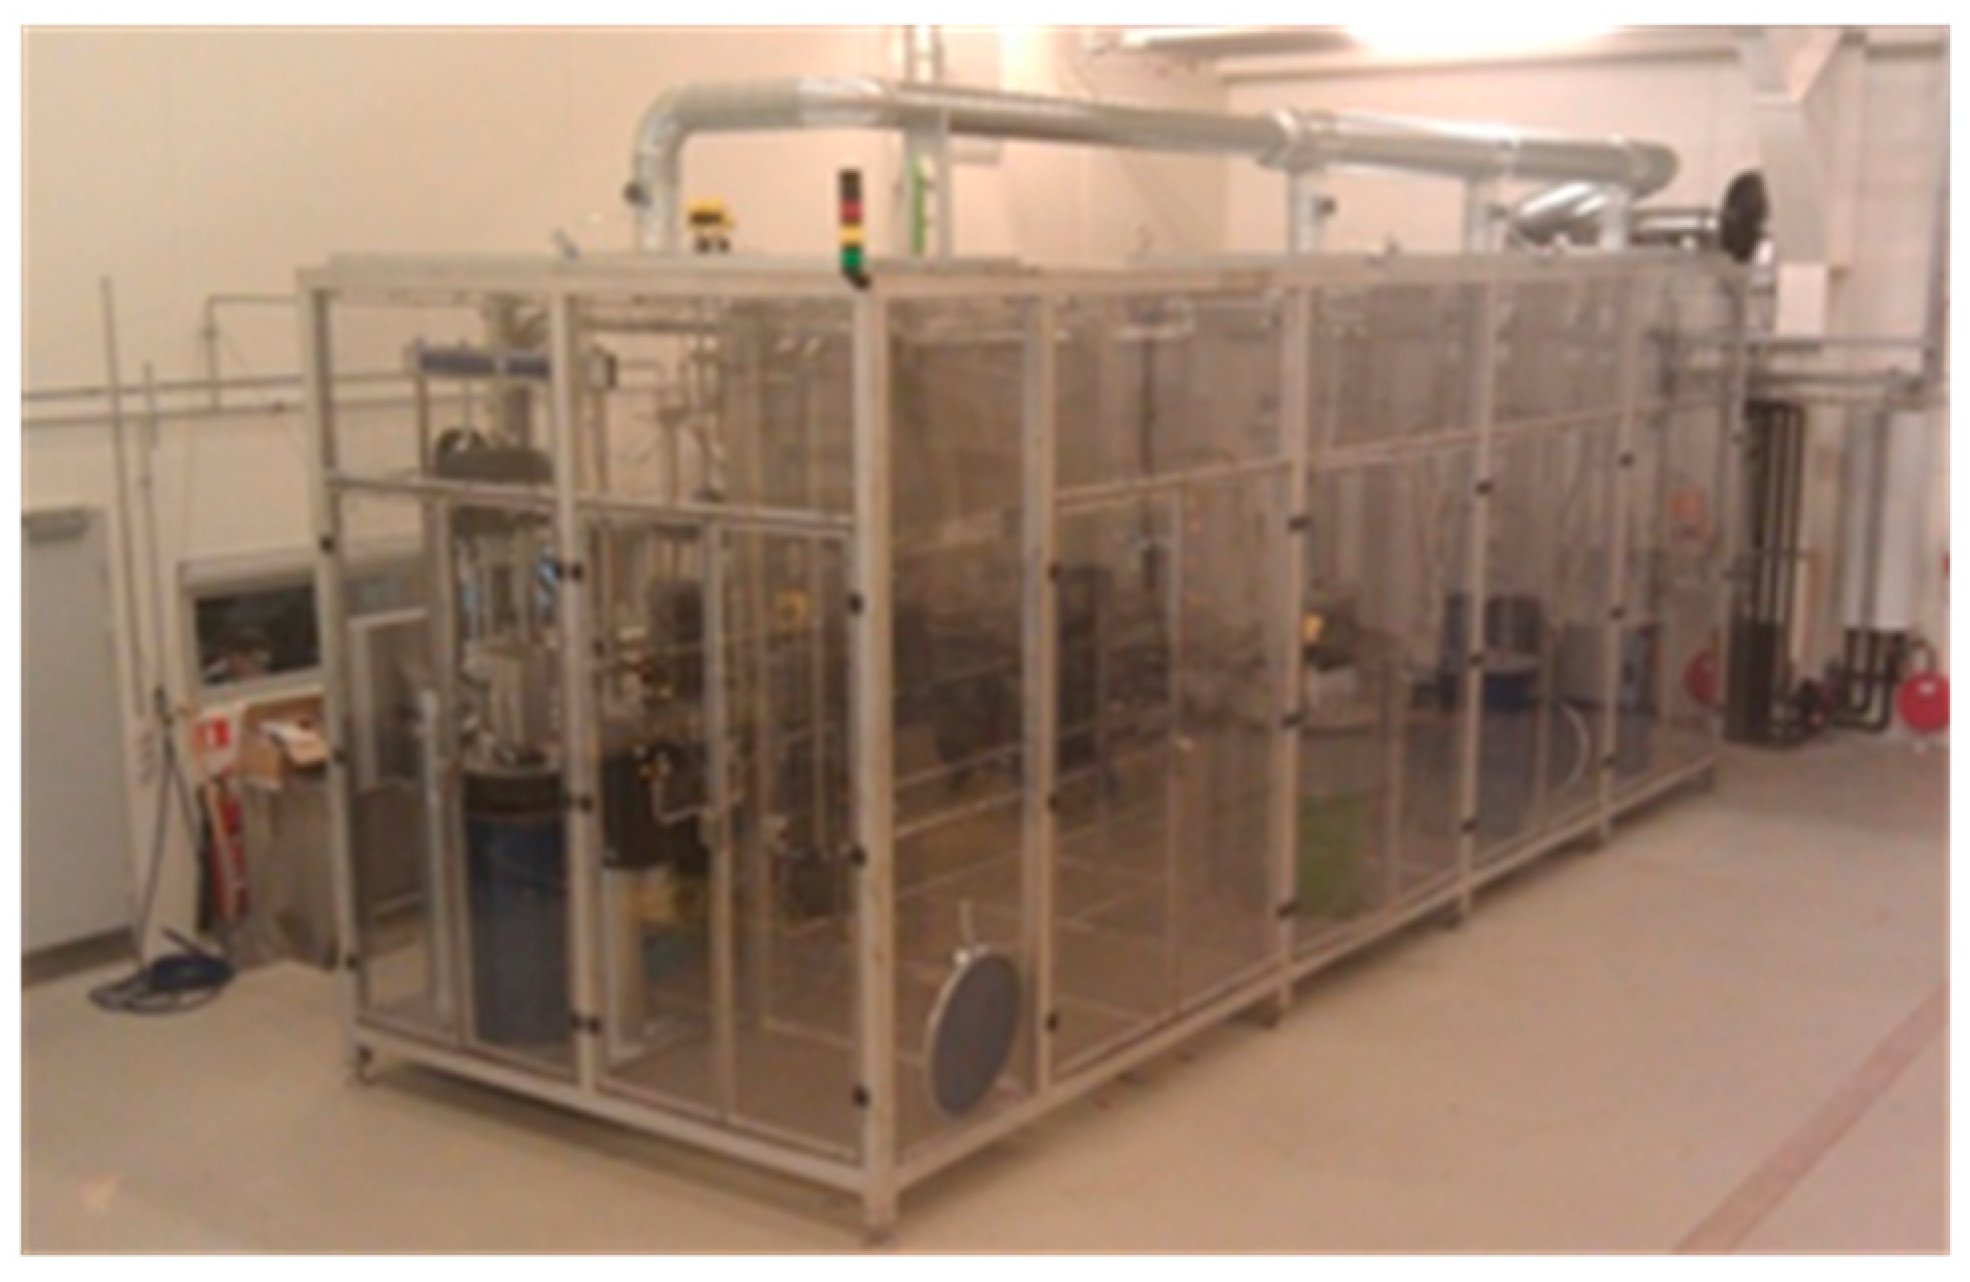
The main part of the HTL pilot plant (Figure 7) is outfitted with 58 type-K thermocouples in Inconel 600 sleeves. Thirty-two of these are located in the trim heater measuring the temperature of the individual heat clamps. The rest are located along the 147 m pipe system, approximately 6 m apart, ensuring a detailed overview of the temperature profile. The pressure is measured with Vegabar BR53.DXGF1ZHDMAM (4–20 mA, 0–600 bar) pressure transmitters from Vega, at the start and end of each main unit operation, namely the heat exchanger, trim heater, reactor and cooler. Additionally, a PY2033 (18–32 V, 0–25 bar) pressure indicator from IFM electronic gmbh is placed after the take-off system. The flow rate could be determined by the number cycles per time for both the take-off system and feed pump, as both these volumes are well defined to 250 mL and 192 mL per stroke, respectively, but the exact flowrate is determined and controlled by the takeoff system as it is less sensitive air trapped in the feed material. The overall pressure of the system is on the other hand controlled by the air piston driven feed pump, using the pressure of the air to regulate the high-pressure output as there is a 68:1 ratio between the area of the air and the pump pistons, respectively.

2.3.3. Slurry Preparation

A miscanthus slurry with dry matter content of 15% was prepared via extrusion. For the non-Newtonian flow experiments, similar slurries with varying concentrations were prepared from extruded pine sawdust. Extruded biomass was prepared from roughly chopped material (+10 to 50 mm) using a Xinda, 65 mm twin screw extruder with 2000 mm barrel length. The extruded lignocellulosic biomass was added base "catalyst", which is common to reduce the amount of charring in the process. For the plug flow experiments slurries with two different bases (0.25 M KOH and NaOH) was used in order to provide the ability to quantify the broadening of the pulse. Potential differences in the chemical behavior of potassium and sodium bases were deemed less significant from a flow characterization point of view. A similar method has previously used this analysis technique [4].
The HTL plant was heated up using water and operated at the following process conditions, achieving a "pseudo steady state" after running for approximately four hours. The first two pulses were run with oscillation, at a frequency corresponding to 2 m—an oscillation frequency of 0.044 Hz (corresponding to 2.25 complete cycles per minute) of movement along the system, independent of the forward feedstock flow movement.
The process parameters used in these experiments are: temperature—350 °C; pressure—200 bar; flow rate—0.8 L/min. This corresponds to an approximate residence time of 25 min in total, considering the density is changing continuously along the length of the reactor.

2.3.4. Flow Characterization Method

Two types of reactor flow tests were considered, namely a pulse and a step test. In this case an extended pulse test was used, analogues to two step tests in close succession, repeated three times.
Input Injection Method. After the HTL plant reached steady state conditions with water, it was run using the willow slurry with sodium hydroxide for an hour, with oscillation. The feed slurry hopper was run until close to empty, at which point the potassium hydroxide-containing slurry was pumped rapidly into the hopper while the recirculation from the hopper was temporarily discarded into a bucket in order to ensure as sharp an input pulse as possible. This procedure was repeated for the next pulse injection, for a total of three pulses, one with oscillation turned on and a pulse with the oscillation turned off.

2.3.5. Output Response Characterization

The output response was measured by taking a single 50 mL sample exiting the system, once the residence time had passed, every 2 min for both concentration pulses. These samples contained a mixture of solids and two liquid phases, namely the oily biocrude and aqueous liquid phases. The distribution of potassium ions between the oil and aqueous phases were then allowed to equilibrate for 12 months. Once equilibrated, the sample vials were carefully opened with minimal shaking, and the aqueous phase filtered gravimetrically. A 10 μL sample from these filtered samples were then extracted from each 50 mL sample vial, and transferred into 10 mL centrifugal vials. Following this 0.99 mL of 1.0 M fuming nitric acid was added to each vial. Finally, 9 mL of Millipore water were added to the samples in order to bring the final solution up to 10 mL in total, reaching a dilution of 1:1000 with a final nitric acid concentration of 0.1 M for elemental analysis.

2.3.6. Ion Concentration Analysis

Sodium and Potassium concentrations were measured on an Agilent 7900 quadropole ICP-MS at the AGiR laboratories at the Department of Geoscience, Aarhus University. The analyses were done with helium in the collision cell to minimize argon interferences on potassium. Indium was used as an internal standard for drift correction and NIST 1643 F was used as an external standard to check accuracy and precision.

3. Results

3.1. Non Newtonian Behavior of Biomass Slurries

Following the above experimental procedure, the volumetric pump setting was varied in 10% intervals from 10% to 100% of its maximum flow. The dimensions of the constriction with the sudden constriction and expansion was converted to equivalent pipe lengths. The same non-Newtonian model representing a Bingham plastic used in the modelling section are applied to the experimental viscosity data here as well, Figure 8. It can be noted, that whereas the low concentration biomass slurries exhibit near Newtonian behavior, the contrary is the case for the high dry-matter slurries.

3.2. Flow Characterization Verification

The results from collection and analyzing nearly one hundred samples throughout three pulse experiments or six step changes.
It is seen, Figure 9, that the flow behavior of the reactor system has a high degree of plug flow behavior, and the step change occurs over only a few data points. As seen above there is no significant difference in the pulse broadening between oscillation and non-oscillation experiments.

3.3. Temperature Distribution in the HTL System

The general 3D view of temperature distribution within the HTL system, as a result of the macroscale model simulation, is depicted in Figure 10b. The temperature distribution determined mainly by the compact design of the HTL system. Such a design, besides the constructive advantages, allows reuse of thermal energy released in different parts of the system. This, in general, optimizes the energy usage.
The temperature distribution along the pipe, simulated for two different fluids, is depicted in Figure 10a. Two different operation scenarios were tested: (i) flow without forced oscillation, and (ii) flow with forced oscillation (these results are not shown in Figure 10a). In general, the simulated data (black solid line, represents the first scenario) fit reasonably well with the measured data (the colored dots), regardless of the fluid type, though, the errors are not equally distributed along the pipe (see the error plots). Unfortunately, the macroscopic model, due to the accepted assumptions (and, hence, simplifications) was not able to reproduce the observed differences in temperature distribution caused by forced oscillations.
To estimate the effect of forced flow oscillation on the heat exchange rate in the heat exchanger, we calculate temperature differences, Δ T i , (where the temperatures were measured along the heat exchanger pipes) between two cases of operation: without forced ( T oscill i ) and with forced ( T + oscill i ) flow oscillation,
Δ T i = T + oscill i T oscill i
where subscript i indicates the particular location of measured temperature ( T + oscill i , T oscill i ) along the pipes and, hence, the particular calculated difference Δ T i . The distribution of Δ T i in case of different operated fluids depicted in Figure 10c.
The effect of forced oscillation on the heat transfer is not the constant along the pipes. This can be observed by relating the position of plotted data to the dashed line in Figure 10c. The line separates two planes, + Δ T and Δ T , correspondent to the direction of energy exchange due to forced oscillation. The data lying on the dashed line indicate no effect of forced oscillation. Overall, the forced oscillation shows lower effect on the heat transfer with the Miscanthus suspension compared to the pure water, a behavior which is not entirely understood at this time.

3.4. The Effect of Forced Flow Oscillation on the Heat Transfer

The oscillatory system (Figure 3), besides the direct regulation of dynamical properties of the non-Newtonian shear-thinning bio-slurry flow, is aimed to optimize the energy consumption during operation. The energy effect of the oscillatory system mainly localized within the heat exchanger unit of the reactor. In addition to the constructive design optimization of the heat exchanger, directed towards, amongst other things, enhancing the heat exchange rate between the inflow and outflow pipes, the forced flow oscillation, due to additionally induced turbulent mixing (Figure 11), increase the heat exchange rate between the pipes (Figure 10).

4. Discussion

The non-Newtonian behavior of high dry-matter lingo-cellulosic biomass slurries as seen in Figure 8 are quite dramatic. For a 16% DM pine slurry, the increase of the flowrate over a constriction by a factor of 10 only increased the pressure drop by a factor of 1,4 as the shear induced apparent viscosity is lowered by a factor of 7! This dramatic behavior is the basis for the design of the feed system and the oscillatory flow system. In general, one would expect a large energy penalty by increasing the local flow rate in a tubular system. However, we only see marginal pressure differential pressure variations in the range of a few bar over the length of the 120 m system despite the dramatic flowrate changes during oscillation. The lowering of the dynamic viscosity combined the higher surface velocity would benefit the heat transfer as discussed below.
The results in Figure 10c show a true energy saving gain due to the forced oscillation. The energy saving realized in increased energy exchange between the (“cold” and “hot”) pipes in the heat exchanger. The inflow pipe (blue line in Figure 10c) receives energy from the counter-current outflow pipe (the red line in Figure 10c).This increased energy exchange in the heat exchanger allows for a reduction of energy consumption further on, in the trim heater. The effects may seem small, but an increase of energy recovery from, e.g., 84% to 87%, as seen in other studies [23], reduces the heating costs by nearly 30%, and the effect of oscillation is expected to be higher with the higher heat exchanger dimensions in a full-scale plant.
During the plug-flow behavior experiments, it was expected that the oscillation would give some additional pulse broadening due to the feed that is introduced into reciprocating flow moving the systems content several meters back and forth. On the other hand, the increased local flow rate due to oscillation, especially during heat up of the viscous biomass, should give rise to local mixing or even turbulence favoring a more plug flow behavior. The lack of any significant difference between the non-oscillation and the oscillation data as seen in Figure 9 could indicate that these two factors simply cancel each other out. As to the degree of plug flow behavior, and thus the variation in residence time for the feed, it is apparent that even though an ideal plug flow behavior cannot be claimed, the distribution of residence time is quite limited and that the reactor system for practical purposes is approaching a plug flow behavior. Supporting this notion is that the discrete sampling of approximately 0.5 L at a time will in average result in addition apparent mixing corresponding to one sampling point or approximately 2 min. The difference in the K/Na ratios in the different experiments are most likely due to small variation in how efficient the hopper was drained between the different runs, and should have significance for these discussions.
The demonstrated plug flow behavior is positive from a product specification point of view; with a more uniform regime allowing for better predictability of products to be formed provided the feed is relatively well characterized and homogenous. This is especially true regarding the formation of specific chemical functional groups (such as phenols and other aromatic compounds) being heavily dependent on reactor residence time. From an upscaled system perspective, this result is potentially more relevant from a specialty chemicals production point of view which would be most likely be operated at temperatures lower than that aimed for conventional fuels production, assuming specialty oxygenated compounds are desired.
In general, the obtained results will have a positive influence on the techno-economic and life-cycle analysis results for the HTL process. Aspects of this have been studied in several papers for instance [23,24,25] and will be the subject of further studies.

5. Conclusions

A fully functional design including several novel design elements, for a hydrothermal liquefaction pilot plant capable of processing a diverse array of feedstock was presented. An oscillatory flow system, generating relatively high local flow rate with an independently controllable overall flow rate (and therefore residence time) showed no significant change in residence time distribution (plug flow behavior). However, the oscillation did improve heat transfer significantly, reducing the energy input needed to reach reactor temperature. An unusual solution to obtain efficient direct heat exchange under extreme process conditions with the avoidance of constrictions in the tubular system was presented, in which cast iron "heat clamps" transfer energy directly from the product to the feed end of the tubular system. Supporting the understanding of non-Newtonian flow properties of high DM biomass feedstock, kinetic viscosity data showed a factor of 7 reduction in viscosity when increasing the flow a factor of 10. Central data for flow behavior and thermal transport were modelled in order to give further insight into such complex systems.
The developed simulation fits reasonably well with the measured data, regardless of the fluid type even though the thermal errors are not equally distributed along the pipe. The macroscopic model, due to the accepted assumptions (and, hence, simplifications) was not able to reproduce the observed differences in temperature distribution caused by forced oscillations. The simulations reveal spatially variable flow resistance. The distribution of resistance coefficient along the pipe shows its sharp decrease along the cold pipe of the heat exchanger and following the trim heater. The friction factor has its maximal value at the entry point and minimal within the reactor unit.

Supplementary Materials

The following are available online at https://www.mdpi.com/2227-9717/9/2/234/s1, S1: Experimental data and modeling, S2: Slurry viscosity data, S3: Plug flow data.

Author Contributions

Conceptualization and construction of plant, I.J. and, B.K., modelling methodology, V.M.; experimental work B.K., D.M., and I.J., writing—review and editing, All; All authors have read and agreed to the published version of the manuscript.

Funding

Bio-Value Strategic Platform for Innovation and Research, co-funded by The Danish Council for Strategic Research and The Danish Council for Technology and Innovation, case no: 0603-00522B.

Data Availability Statement

Data is contained within the article or supplementary material.

Acknowledgments

The authors want to acknowledge the professional help from Department of Geoscience, Aarhus University for analysis of the plug flow study samples.

Conflicts of Interest

The authors declare no conflict of interest.

References

  1. Lunsford, J.H. Catalytic conversion of methane to more useful chemicals and fuels: A challenge for the 21st century. Catal. Today 2000, 63, 165–174. [Google Scholar] [CrossRef]
  2. Cuéllar-Franca, R.; García-Gutiérrez, P.; Dimitriou, I.; Elder, R.H.; Allen, R.W.; Azapagic, A. Utilising carbon dioxide for transport fuels: The economic and environmental sustainability of different Fischer-Tropsch process designs. Appl. Energy 2019, 253, 113560. [Google Scholar] [CrossRef]
  3. Madsen, R.B.; Anastasakis, K.; Biller, P.; Glasius, M. Rapid Determination of Water, Total Acid Number, and Phenolic Content in Bio-Crude from Hydrothermal Liquefaction of Biomass using FT-IR. Energy Fuels 2018, 32, 7660–7669. [Google Scholar] [CrossRef]
  4. Biller, P.; Johannsen, I.; dos Passos, J.S.; Ottosen, L.D.M. Primary sewage sludge filtration using biomass filter aids and subsequent hydrothermal co-liquefaction. Water Res. 2018, 130, 58–68. [Google Scholar] [CrossRef] [PubMed]
  5. Peterson, A.A.; Vogel, F.; Lachance, R.P.; Fröling, M.; Antal Jr, M.J.; Tester, J.W. Thermochemical biofuel production in hydrothermal media: A review of sub- and supercritical water technologies. Energy Environ. Sci. 2008, 1, 32–65. [Google Scholar] [CrossRef]
  6. Katritzky, A.R.; Barcock, R.A.; Balasubramanian, M.; Greenhill, J.V.; Siskin, M.; Olmstead, W.N. Aqueous High-Temperature Chemistry of Carbo- and Heterocycles. 20. Reactions of Some Benzenoid Hydrocarbons and Oxygen-Containing Derivatives in Supercritical Water at 460 °C. Energy Fuels 1994, 8, 487–497. [Google Scholar] [CrossRef]
  7. Gai, C.; Li, Y.; Peng, N.; Fan, A.; Liu, Z. Co-liquefaction of microalgae and lignocellulosic biomass in subcritical water. Bioresour. Technol. 2015, 185, 240–245. [Google Scholar] [CrossRef]
  8. Zhu, Z.; Rosendahl, L.; Toor, S.S.; Yu, D.; Chen, G. Hydrothermal liquefaction of barley straw to bio-crude oil: Effects of reaction temperature and aqueous phase recirculation. Appl. Energy 2015, 137, 183–192. [Google Scholar] [CrossRef]
  9. Mahmood, N.; Yuan, Z.; Schmidt, J.; Xu, C.C. Production of polyols via direct hydrolysis of kraft lignin: Effect of process parameters. Bioresour. Technol. 2013, 139, 13–20. [Google Scholar] [CrossRef]
  10. Li, H.Q.; Shao, Q.; Luo, H.; Xu, J. Polyurethane foams from alkaline lignin-based polyether polyol. J. Appl. Polym. Sci. 2016, 133. [Google Scholar] [CrossRef]
  11. Gollakota, A.R.K.; Kishore, N.; Gu, S. A review on hydrothermal liquefaction of biomass. Renew. Sustain. Energy Rev. 2018, 81, 1378–1392. [Google Scholar] [CrossRef]
  12. Castello, D.; Pedersen, T.H.; Rosendahl, L.A. Continuous hydrothermal liquefaction of biomass: A critical review. Energies 2018, 11, 3165. [Google Scholar] [CrossRef] [Green Version]
  13. Yang, J.; Corscadden, K.; Niu, H.; Lin, J.; Astatkie, T. Advanced models for the prediction of product yield in hydrothermal liquefaction via a mixture design of biomass model components coupled with process variables. Appl. Energy 2019, 233, 906–915. [Google Scholar] [CrossRef]
  14. Li, Y.; Leow, S.; Fedders, A.C.; Sharma, B.K.; Guest, J.S.; Strathmann, T.J. Quantitative multiphase model for hydrothermal liquefaction of algal biomass. Green Chem. 2017, 19, 1163–1174. [Google Scholar] [CrossRef]
  15. Barnard, A.C.L.; Hunt, W.A.; Timlake, W.P.; Varley, E. A Theory of Fluid Flow in Compliant Tubes. Biophys. J. 1966, 6, 717–724. [Google Scholar] [CrossRef] [Green Version]
  16. Botto, L.; Preuss, K.; Robertson, L.X.; Xu, X.Y. Physical characterisation and yield stress of a concentrated Miscanthus suspension. Rheol. Acta 2014, 53, 805–815. [Google Scholar] [CrossRef]
  17. Duncan, J.C.; Shahravan, A.; Samaniuk, J.R.; Root, T.W.; Graham, M.D.; Klingenberg, D.J.; Scott, C.T.; Bourne, K.J.; Gleisner, R. Pressure-driven flow of lignocellulosic biomass: A compressible Bingham fluid. J. Rheol. 2018, 62, 801–815. [Google Scholar] [CrossRef]
  18. Mitsoulis, E. Flows of viscoplastic materials: Models and computations. Rheol. Rev. 2007, 43, 135–178. [Google Scholar]
  19. Lurie, M.V. Modeling of Oil Product and Gas Pipeline Transportation; Wiley: Hoboken, NJ, USA, 2009; pp. 1–214. [Google Scholar]
  20. Lienhard, J.H., IV; Lienhard, J.H., V. A Heat Transfer Textbook, 4th ed.; Phlogiston Press: Cambridge, MA, USA, 2018; p. 768. [Google Scholar]
  21. Sagaut, P.; Deck, S.; Terracol, M. Multiscale and Multiresolution Approaches in Turbulence; World Scientific: Singapore, 2006; pp. 1–341. [Google Scholar]
  22. Bazilevs, Y.; Calo, V.M.; Cottrell, J.A.; Hughes, T.J.R.; Reali, A.; Scovazzi, G. Variational multiscale residual-based turbulence modeling for large eddy simulation of incompressible flows. Comput. Methods Appl. Mech. Eng. 2007, 197, 173–201. [Google Scholar] [CrossRef]
  23. Anastasakis, K.; Biller, P.; Madsen, R.B.; Glasius, M.; Johannsen, I. Continuous Hydrothermal Liquefaction of Biomass in a Novel Pilot Plant with Heat Recovery and Hydraulic Oscillation. Energies 2018, 11, 2695. [Google Scholar] [CrossRef] [Green Version]
  24. De Jong, S.; Hoefnagels, R.; Faaij, A.; Slade, R.; Mawhood, R.; Junginger, M. The feasibility of short-term production strategies for renewable jet fuels—A comprehensive techno-economic comparison. Biofuels Bioprod. Biorefin. 2015, 9, 778–800. [Google Scholar] [CrossRef]
  25. De Jong, S.; Antonissen, K.; Hoefnagels, R.; Lonza, L.; Wang, M.; Faaij, A.; Junginger, M. Life-cycle analysis of greenhouse gas emissions from renewable jet fuel production. Biotechnol. Biofuels 2017, 10, 64–71. [Google Scholar] [CrossRef] [PubMed] [Green Version]
Figure 1. Schematic diagram of the Hydrothermal Liquefaction (HTL) plug-flow processing system.
Processes 09 00234 g001
Figure 2. The takeoff system. 1—piston, 2—outlet, 3—three-way valve, 4—actuator, 5—main system. Red arrows indicate high pressure flow; blue arrows indicate low pressure flow. In this instance, the left side of the take-of system is taking in pressurized product from the main system, while the right side is pushing depressurized product out. The left picture depicts an isometric view; the right picture depicts a technical drawing.
Processes 09 00234 g002
Figure 3. Oscillation system. 1—piston, 2—2-way valve, 3—main system, 4—feed system, 5—take-off system. The red arrow indicates the oscillating flow created by the two reverse-phase cylinders. The left picture depicts an isometric view; the right picture depicts a technical drawing.
Processes 09 00234 g003
Figure 4. Heat exchanger. (a) Isometric view with a section cut which visualizes an internal construction of the unit; 1—coffer, 2—piping system with heating clamps, 3—insulation. (b) The piping system with the heating clamps. (c) The heating.
Processes 09 00234 g004
Figure 5. Trim heater and reactor unit. (a) The general view with a section cut which visualizes an internal construction of the unit; 1—coffer, 2—piping system with heat transfer clamps, 3—insulation. (b) The pipe line system with heat transfer clamps. (c) The heat transfer clamp with embedded rod-like clamp-on heating elements (yellow circles); yellow arrows visualize direction of heat flux. (d) The general view of the reactor unit. (e) The pipe line system of the reactor unit. Constructively, the reactor unit is designed and fabricated in the same way as the other two thermal units. The main constructive element (d,e) is a 61 m pipe line system (the reactor) placed into an insulated coffer, filled with insulation. Despite the insulation, the overall size of the reactor is too large to be adiabatic. Since the thermal stability within the reactor is important for HTL reactions, additional heat sources (6 × 1000 W heat bands) are distributed along the reactor pipes, so the constant temperature within the reactor can be maintained in order to ensure isothermal conditions.
Processes 09 00234 g005
Figure 6. Geometrical domains of the HTL plant. (a) Macroscale model domain: represents the entire reactor’s 3D geometry with 1D pipe. (b) Microscale model domain: represents 3D symmetrical model of the heat exchanger unit. The blue lines indicate the pipe; n is a normal vector to an external surface S ext ; l osc 1 ,   l osc 2 are the endings of the oscillatory units; l in is an inlet boundary; l out is an outlet boundary; q TH and q R are overall heat transfer rates of the trim heater units and the reactor’s additional heat source units respectively, the red arrows point out at which sub-domains those variables are defined; S ext _ 2 is an external surface of insulation box around the heat exchanger unit; red line on (b) indicate the position of symmetry plane S sym .
Processes 09 00234 g006
Figure 7. HTL plant. The completed HTL pilot plant incased in a protective steel and polycarbonate coffer, with active suction from areas, which can contain open containers.
Processes 09 00234 g007
Figure 8. Non-Newtonian characteristics of pine saw dust slurries of varying dry matter contents. To the left the differential pressure over a constriction is shown at varying flowrates. To the right the corresponding apparent viscosity is depicted at varying shear rates.
Processes 09 00234 g008
Figure 9. Ion concentrations from plug flow experiments. Molar Ratio Uncertainties represented as the sum of the individual two molar uncertainties.
Processes 09 00234 g009
Figure 10. Temperature distribution in the HTL system. (a) Temperature distribution of flowing liquid along the pipe. The dots and corresponding bars indicate the measured data and their errors, respectively. The blue color corresponds to the data measured during operation, without forced oscillation; the red color corresponds to the data measured during operation, with forced oscillation. Black lines are simulated data (in the case of no forced oscillations). The length of the pipe expressed as a normalized length l / l H E , where l H E is the length of the inflow (outflow) pipe in the heat exchanger. The bar plots (the second line of plots, E r r   vs   l / l H E ) indicate the relative errors of simulation correspondent to the measured data, E r r = ( m e a s u r e d s i m u l a t i o n ) / m e a s u r e d . Average pressure during operation: 131   bar . (b) 3D simulation result for the macroscale model. (c) The effect of forced flow oscillation on heat transfer in the heat exchanger. The black dotted line indicates the measured normalized temperature difference Δ T (Equation (12), distributed along the heat exchanger pipes, between the two cases of operation: Without and with forced flow oscillation. The blue line corresponds to the cold pipe (pre trim heater), the inflow pipe that receives energy from the counter-current outflow pipe; while the red line corresponds to the hot pipe (post reactor). The length of the pipes expressed here as a normalized length l / l m a x , where l m a x is a maximum length of the inflow (outflow) pipe in the heat exchanger. The dashed line separates two planes, + Δ T and Δ T , corresponding to the direction of energy exchange due to forced oscillation. The data lying on the dashed line indicate no effect of forced oscillation.
Processes 09 00234 g010
Figure 11. The effect of forced flow oscillation. (a) Flow disturbance development in the cold pipe of the heat exchanger due to forced oscillation with a frequency of 0.1   Hz . The results obtained from the microscale model simulation, which depict the central 2 d part of the pipe segment, where d is the pipe diameter; (b) the approximation of the pressure difference (pressure drop) between the inlet and outlet of the heat exchanger; (see the Figure S4 in SM S1 for the reference experimental data); P1 and P2 are the pressures at opposite ends of the pipe.
Processes 09 00234 g011
Publisher’s Note: MDPI stays neutral with regard to jurisdictional claims in published maps and institutional affiliations.