Article

Dry Mesophilic Anaerobic Digestion of Separately Collected Organic Fraction of Municipal Solid Waste: Two-Year Experience in an Industrial-Scale Plant

1
Calabra Maceri e Servizi S.p.A, Via Marco Polo, 54, I-87036 Rende (CS), Italy
2
Department of Environmental and Chemical Engineering, University of Calabria, Via P. Bucci, I-87036 Rende (CS), Italy
3
Waste to Methane S.r.l., Via Marco Polo, 54, I-87036 Rende (CS), Italy
*
Author to whom correspondence should be addressed.
Processes 2021, 9(2), 213; https://doi.org/10.3390/pr9020213
Submission received: 22 December 2020 / Revised: 19 January 2021 / Accepted: 21 January 2021 / Published: 24 January 2021
(This article belongs to the Special Issue Current Trends in Anaerobic Digestion Processes)

Abstract

:
In this paper, performance analysis over two years’ operation of an industrial anaerobic digestion (AD) plant of a separately collected organic fraction of municipal solid waste is presented. The continuous plug-flow AD plant is still regularly operating and it has been fully operational since September 2018. Since then, it has been supplied with 40,000 t/y of pretreated separately collected organic fraction of municipal solid waste from municipalities of the Calabria region in Southern Italy. The AD process is carried out in a mesophilic regime at 40 ± 0.5 °C, using a constant hydraulic retention time (HRT) of 22 days and a substrate with average total solids and average total volatile solids of 30.0% and 22.2%, respectively. In the last two years, the plant produced an average of 191 m3 and 860 m3 of biogas per tonne (t) of organic input material and of total volatile solids, respectively, with an average methane specific production of 508 m3/t (total volatile solids). The average CH4 percentage in the biogas was of 59.09%. The obtained results came out from the combination of high organic content of separately collected organic fraction of municipal solid waste, optimized pretreatment system and operating conditions adopted.

1. Introduction

In recent years, the output of municipal solid waste (MSW), particularly food waste, has increased dramatically. It has been reported [1] that every year European Union citizens produce 76 kg of food waste per capita at a household level and this value raises up to 179 kg when considering waste generated by the manufacturing industry. In parallel, waste disposal of MSW has become a big issue as landfills and incinerators are still widely used as common methods of waste disposal, causing serious problems related to land, air, and water pollution. Directive n° 2008/98/EC of the European Parliament and of the Council of 19 November 2008, changed by current consolidated version of 2018/07/05 [2] imposes a priority order in waste management following this waste hierarchy: (a) prevention; (b) preparing for reuse; (c) recycling; (d) other recovery (e.g., energy recovery) and (e) disposal. This hierarchy must be followed both by consumers (a, b) and waste plant managers (c, d and e). In 2014, the US Environmental Protection Agency (EPA) defined a similar hierarchy in food waste management [3]. Developing sustainable solutions for waste management, especially for the organic waste management, is among the great challenges of modern society.
Nowadays, anaerobic digestion AD is considered as one of the most effective and environment-friendly processes for recycling the organic waste [4] as it produces two outputs: an energy-rich gas phase [5,6] (the so-called biogas) and a liquid stream called digestate which can be directly used in agriculture or through its conversion into value-added products [7].
AD is a complex microbial process [8], occurring in the absence of oxygen, that converts organic matter into biogas. The biochemical process takes places in four stages (hydrolysis, acidogenesis, acetogenesis and methanation) carried out by specific groups of microorganisms. The produced biogas consists of two main components, methane (50–70%) and carbon dioxide (30–50%), together with other minor components including hydrogen sulfide (H2S), nitrogen (N2), oxygen (O2), water vapor, ammonia (NH3), hydrogen (H2) and volatile organic compounds (VOCs).
Generally, operating conditions and performances of the various types of commercially available anaerobic digesters and AD processes treating organic fraction of MSW (OFMSW) developed on an industrial scale have been quantified in well-defined ranges [9,10,11,12,13,14,15] (Table 1).
Dry conditions are more often applied to the food waste AD process as they present several advantages with respect to wet ones. In fact, although wet AD plants treating food waste produce higher biogas yields, about 150–190 m3 per t of waste compared to an average of 78 m3/t for dry conditions [16], dry AD plants can treat up to three times greater quantities of organic substrate, generating double the biogas yield per digester volume compared to wet AD plants [11]. Moreover, in the AD dry process, less or no water is required, consequently simplifying the postdigestion operations for digestate treatment. Nevertheless, application of dry conditions can considerably influence the AD plant performance as high total solids (TS) content could reduce substrate degradation and methanogenic activity leading to less biogas production [17,18,19,20]. It has been reported that, in food waste dry AD, in mesophilic condition, an increase in TS content from 14% to 18% led to a 31% reduction in methane yield [21], and it was necessary to increase the retention time from 20 to 40 days to maintain stable dry mesophilic conditions [22]. Likewise, biogas and methane production decreased with the total solid contents increasing from 20% to 30% in dry batch thermophilic AD of food waste [23]. Therefore, despite the advantages over wet AD, lacking of in-depth knowledge on TS effects on AD process still limits both diffusion and wider industrial application of food waste dry AD.
Operating temperature is another crucial factor for food waste AD process. Temperature variations influence both microbiological communities [24] and biogas production. Some studies have shown that thermophilic temperatures, such as 55 °C, produced less biogas than mesophilic temperatures of 35 °C and 45 °C [25], or even led to failure of food waste AD process [24]. Another study reported that maximum biogas production is achieved at 50 °C compared with other temperatures in the range from 30 °C to 60 °C [26]. Generally, higher temperatures improve the production rate of biogas. In particular, it has been reported that the hydrolytic/acidogenic rate of food waste is proportional to the increase of temperature [27,28]. Thus, at the same organic loading rate (OLR), thermophilic AD increases either the degradation rate of organic MSW [29] or the solubility of organic compounds, also reducing the solubility of the biogas in the liquid [30], leading to a faster production of biogas compared to mesophilic AD. However, the overall methane production amount in thermophilic AD is almost identical to that obtained in mesophilic conditions [31,32], as exergonic reactions, such as methanogenesis, reduce their performance with higher temperature [1].
There are many substances that can inhibit the AD process, if present in certain concentrations [33,34,35]. The most frequent inhibition problems are mainly due to the accumulation of volatile fatty acids (VFA) or ammonia [36]. A phenomenon referred to as “acidosis” [37] is the acidification caused by VFA accumulation and it is associated with a rapid drop in pH resulting in a severe inhibition of methanogenic activity in organic waste AD under both mesophilic and thermophilic temperatures [38,39]. In fact, while on the one hand increasing temperature and OLR improves biogas production, on the other high concentrations of substrate may generate inhibitory effects [40,41,42], due to the accumulation of VFA and total ammonia nitrogen (TAN) because of the slower methanogenic metabolism with respect to the acetogenic activity [43,44]. In aqueous conditions, TAN exists in both ammonium ion (NH4+) and free ammonia (FAN, NH3) form [45], the second one being suggested as the main cause of inhibition. Actually, FAN may passively diffuse into the cells of methanogens resulting in proton imbalance and potassium deficiency [33,46] and leading to cell activity inhibition [47]. Although several studies have been published on the determination of TAN and FAN inhibition thresholds in dry AD processing of OFMSW, there is no yet a well-defined FAN inhibition value. However, a recent study has shown that high pH and temperature values increase FAN concentration in the aqueous medium and therefore the level of toxicity [48]. Process inhibition due to the accumulation of VFA and TAN/FAN is the main problem facing food waste dry AD plants, especially those working in thermophilic conditions. Some industrial plant experience [49] has shown that, starting from thermophilic conditions, it was necessary to pause the feeding for two months due to VFA and ammonia accumulation, and then restart in mesophilic conditions. However, no instability problems were reported in mesophilic conditions.
In the management of an industrial dry AD plant treating food waste, it is therefore necessary to reach the right balance of the various process parameters, such as temperature, OLR, retention time and TS content, both to optimize the biogas production and to avoid the AD process instability or failure problems.
Since AD is a complex process in which many species of coexisting microorganisms have different vital needs, it will be necessary to steadily monitor the trend of the process to check system stability and to optimize the overall efficiency of the biogas production. Furthermore, since there is not just a single control parameter suitable to reflect the state of the entire AD process, it is necessary to measure as many useful parameters as possible [50,51] to understand the process goodness and of any necessary actions to be taken. Methane production rate is normally stable in the digester and it is often used in AD plants as a simple indicator of process stability as the response to process conditions modifications is almost instantaneous [52,53]. However, a change in methane yield does not provide any information about biological processes and on the causes of any imbalances that might occur. In fact, since fluctuations in the production and composition of the biogas can also take place in conditions of stability, being linked to multiple factors such as substrate load and composition, temperature, pH etc., methane or biogas production cannot be used as a single criterion for a direct evidence of process imbalance without considering any other parameter. Some of them, such as pH, temperature, pressure, oxidation-reduction potential, biogas flow and composition, can be also measured on-line [54] using commercially available sensors and instrumentation. Other parameters, such as TS, total volatile solids (TVS), total alkalinity (TA), VFA, chemical oxygen demand (COD), biological oxygen demand (BOD), ammonia, toxic substances, total organic carbon (TOC), total nitrogen, phosphorus and sulfur content require sampling and off-line analysis.
Dealing with such a complex process and starting from at a laboratory and pilot plant scale assessment [55], the paper presents the results of biogas and methane production from an industrial dry mesophilic AD plant fed with separately collected OFMSW (SC-OFMSW), during a two-year period of continuous operation. In addition to the quantity and quality of the biogas produced, the values of some important control parameters are reported. In particular, pH, TS and TVS for feeding has been periodically measured, as well as pH, TS, TVS, ammonia, VFA and alkalinity ratio (VFA/TA) for both digestate and substrate inside the digester.

2. Materials and Methods

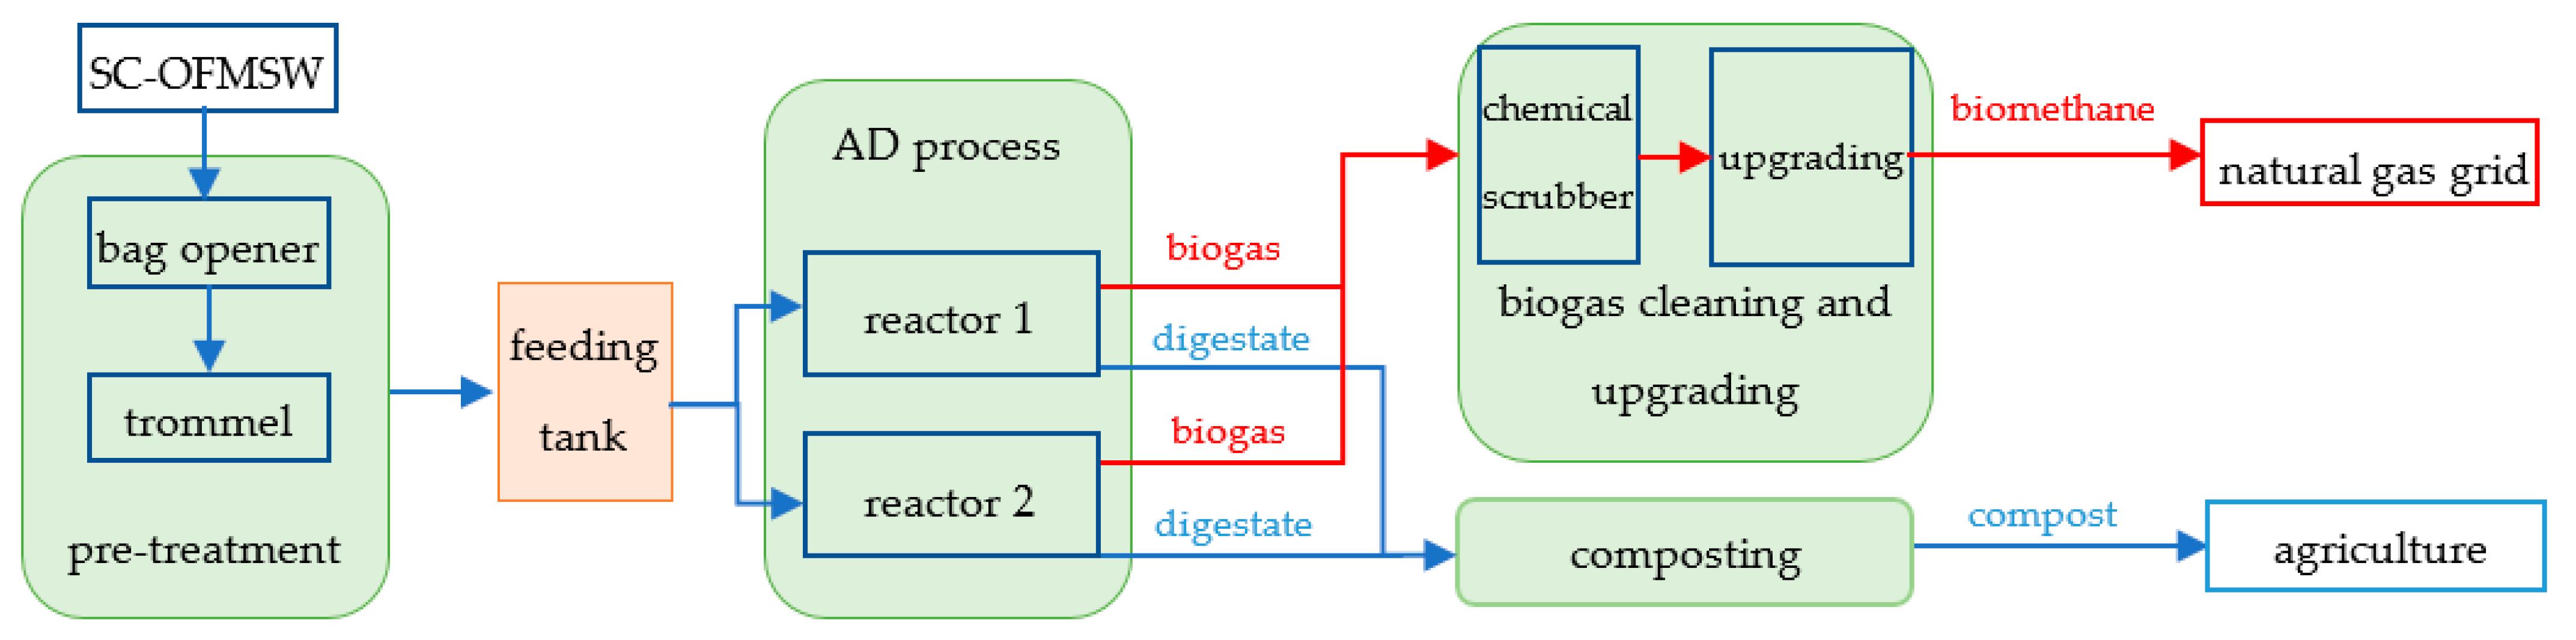
2.1. Industrial AD Plant Characteristics

This plant is currently operating within a larger mechanical-biological treatment (MBT) plant located in the city of Rende (Calabria region, Italy). The AD plant treats about 40,000 t of SC-OFMSW/y coming from various municipalities of Calabria region. AD plant operations can be summarized as following (Figure 1): pre-treatment, AD process, digestate composting, biogas purification and upgrading.
Plastic collection bags containing the organic waste are dumped in the specific reception area at the digestion plant. A bag opener is used as the first step of the pre-treatment to separate most of the plastic and reduce the size of the substrate. Afterwards, a trommel cleans the material destined to AD process from residual unwanted fractions. The organic fraction obtained has dimensions less than 30 mm and is collected in a large tank feeding the AD system. The pretreated organic waste is loaded into the feeding tank without the insertion of any vegetable biomass, fluids, water or other additives, slowly stirred by a vertical mixer to prevent crust forming or clustering, and piped to the AD system through a pneumatic feeding line. A specially made piston pump is used for feeding pretreated material in an automatic manner and is managed by a specially developed programmable logic controller (PLC) by means of which it is possible to set and control quantity and frequency of pretreated SC-OFMSW to be fed. Single-stage AD process takes place in two independent, parallel and continuous slowly moved tank reactors R1 and R2 (volume of about 1200 m3 each) with a treatment capacity of 20,000 t of SC-OFMSW/y per single unit. Both reactors are horizontal and equipped with a heating system to maintain the constant operating temperature. Continuous and horizontal plug-flow process is ensured by a slow rate rotating reel, also useful for degassing even though no relevant mixing effects are induced. The first reactor has been fully operational since September 2018, while the second one since the end of October 2018. During the period examined (September 2018–September 2020), both reactors worked under the same operating conditions: temperature = 40 ± 0.5 °C, OLR = 10.1 kg TVS/m3 d and hydraulic retention time (HRT) = 22 d. The AD process took place without adding any additives and no recirculation was performed.
The digestate liquid stream resulting from the AD process is pumped to the adjacent composting sector, without any liquid separation or other physical treatment, and transformed into organic high-quality compost, according to the Italian legislation [56]. The biogas produced is cleaned using a chemical scrubber and transferred to the upgrading section to obtain biomethane ready to be injected into the natural gas distribution network, according to the strict technical characteristics required by Italian legislation [57].

2.2. Sampling

Samples were collected and analyzed once a day for six days a week, except on Sundays and on public holidays. In addition to the feed sample, which was in common for both reactors, inside reactor samples (IR1 and IR2) and digestate samples (D1 and D2) were collected. IR1 and IR2 sampling points are located in the middle of the long side of the reactor, at a height of 3 m, while D1 and D2 samples are usually taken at the unloading system before the composting line. Biogas was automatically sampled and analyzed by means of the on-line stationary MRU SW-100 Biogas measuring system every eight hours for both reactors.

2.3. Monitoring and Control Methods

Temperature inside the reactors was monitored continuously via built-in probes connected to a data acquisition system. Daily biogas yield was measured by industrial flowmeters, separately for the two reactors, every 24 h. Biogas composition (CH4%, CO2%) was determined by mean of the on-line MRU SW-100 Biogas system mentioned before. pH was measured with a Hanna HI5222 pHmeter equipped with an HI10480 electrode. TS, TVS and TAN content were determined according to standard methods [58]. The VFA/TA value was measured with a Hach AT1000 automatic titrator according to the Nordmann method [59].

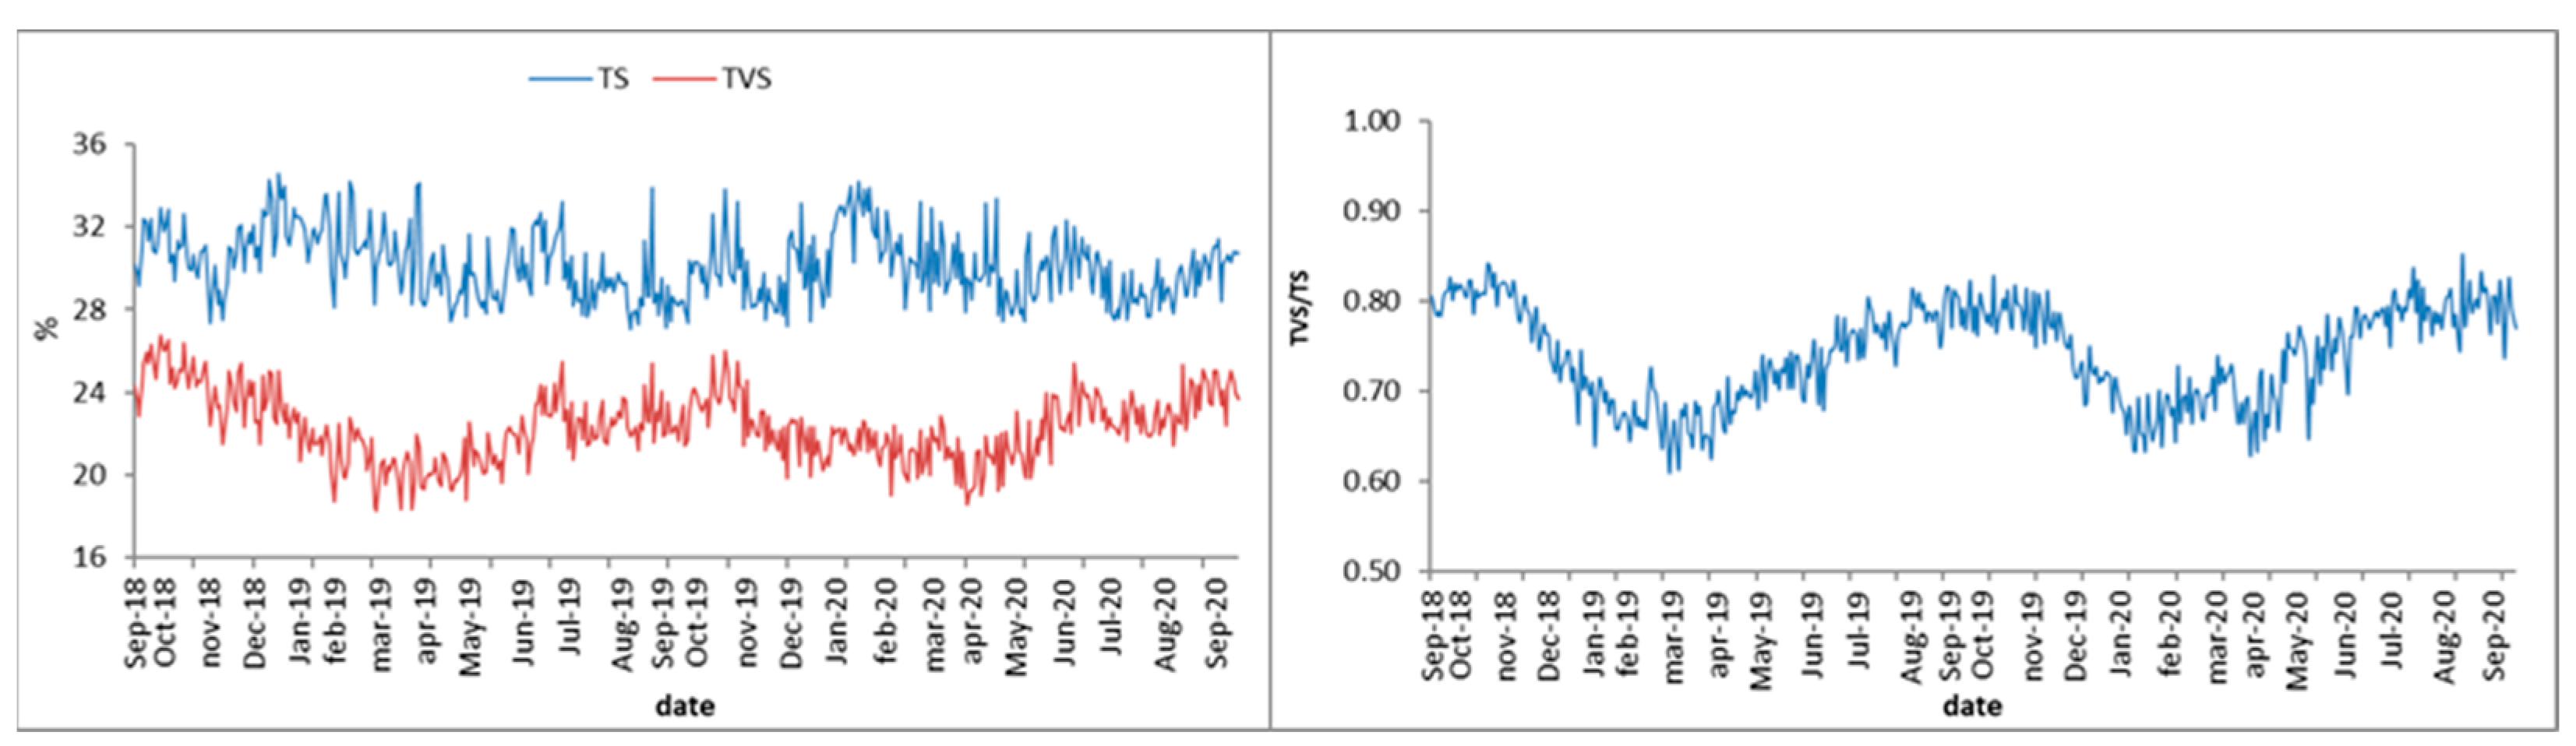
2.4. Feeding Characteristics

The used feed is that defined by the European waste code 20 01 08 which identifies biodegradable kitchen and canteen waste deriving from municipal wastes (household waste and similar commercial, industrial and institutional wastes) including separately collected fractions.
OFMSW has reached a high degree of separation in recent years, probably as the effect of the increased information and improved environmental education that population received over time. This fact, together with the adopted pre-treatment system, make it possible to feed the two reactors with a substrate characterized by less than 1% by weight of undesirable and nonmethanizable material such as glass, metals, stones, non-biodegradable plastics, cork and textiles.
Among the factors responsible for digestion performance, food waste composition [60] and quality [61] play a crucial role in cumulative methane production and they can be affected by various elements, including territorial differences, climate, collection frequency and season. For the examined period, TS, TVS and pH of the pretreated organic substrate, before being fed, were measured. As shown in Figure 2, the pH trend is strongly influenced by seasonality. In the warmer months, from May to October, the average pH was equal to 4.5 while, in the colder period, from December to March, it was 5.7.
A similar seasonal variation is visible in the TVS trend and TVS/TS ratio trend (Figure 3).
Between June and September, the average value of TVS was 23.1% while between January and April it was 21.0%. The total average of TVS calculated over the two-year period was 22.2%. A possible relationship with seasonality is not evident from TS trend (Figure 3). In fact, the average values of TS in both summer and winter periods are almost equal to the total average value of 30.0%.

2.5. Organic Loading Rate (OLR)

Aiming to introduce a constant daily volume of biomethane into the distribution network, it has been necessary to provide the AD process with a constant daily supply of volatile solids quantity. During the two examined years, for both reactors, the quantity of volatile solids to be fed daily was 9.8–10.3 kg of TVS per m3 of reactor volume (with an average value of 10.1 kg), while the average of TS was 13.6 kg/m3 d. Since volatile solids percentage usually changes according to seasons (Figure 3), the quantity of fed pretreated organic was not constant but it was set to 51–54 t/d in the summer months and 55–58 t/d in the colder months, with a total two-year average of 54.5 t/d. The total amount of daily feed was equally distributed over the 24 h.

3. Results and Discussion

3.1. Biogas and Methane Yield

The produced volumes of biogas and methane were measured separately for the two reactors even though no appreciable difference was noticed for both daily quantity of produced biogas and methane percentage in the biogas (Table 2). The production rate and the specific biogas and methane production, referred to both TVS and input organic material, are also reported.
Daily deviations of about ±5.5% from the average values reported were sometimes found, probably due to the daily fluctuation of the organic waste to be processed. More pronounced deviations were observed after temporary feed stop but biogas and methane production returned to the reported average values, once the normal feeding conditions were re-established.
Although numerous studies of AD have already been performed at laboratory scale and on pilot plants, the transfer and replication of these studies results to industrial scale have rarely occurred because process management and fluctuations control are relatively more difficult in full-scale plants.
The addition of cosubstrates in an appropriate ratio with OFMSW [12,62,63,64] is often needed to maintain optimum availability of macro- and micronutrients required for metabolic activity, improving process efficiency, kinetics, stability and economic competitiveness. Full-scale applications of the OFMSW codigestion with sewage sludge [65], animal waste, wastewater, agriculture waste and other additives [66,67,68] can even double the specific biogas production and increase the methane content.
The reported cases concerning plants of AD of OFMSW without the use of co-substrates are very few and often lacking in detailed information. Several commercial full AD plants treating OFMSW have been developed over the years (Table 3).
A comparative analysis of the obtained results (Table 2) with open literature data from other biogas plants (Table 3) highlights the higher yield of both biogas and biomethane reached in the AD plant under study. Compared to reported wet industrial plants [69,71,73,77,78,79], a higher biogas and methane production rate was obtained in Rende dry plant. An exception is the Barcelona plant [78] which, however, to obtain such a high methane production, used a very low OLR and HRT of up to 40 days. Rende plant was able to obtain high methane production using higher OLR, corresponding to 10.1 kg TVS/m3 d, and process greater quantities of OFMSW per day. Moreover, compared to Barcelona and other wet plants, digestate does not have to undergo a post-treatment for liquid fraction separation but it is directly composted.
Operating conditions similar to those used in the Rende plant, such as TS content and temperature in the mesophilic range, have enabled the production of 400 m3 of methane per tonne of TVS in the Bassano plant [74]. However, to achieve this performance, the Bassano plant used an OLR of 4–6 kg TVS/m3 d and an HRT of 40–60 days. In the two examined years, the Rende plant reached an average methane production of 508 m3/t TVS adopting an OLR equal to double and an HRT about half of Bassano plant. It should be noted that the other plants shown in Table 3 operating in dry conditions [15,70,75,80] reached much lower biogas and methane yields than those of the Rende plant, whose performances have not been reached even if thermophilic temperature was applied [72].
The best AD performances obtained in the Rende plant are mainly due to the better quality of the feedstock and to operating conditions.
The quality of the OFMSW greatly affects the productivity of the AD process as it has been shown [81,82] that the source sorted and segregated OFMSW have a higher percentage of biodegradability, leading to greater biogas yields and an improved quality digestate for agricultural land applications, with respect to the mechanically sorted OFMSW. Results of a study conducted [74] in the Bassano plant have shown that biogas production from mechanically sorted OFMSW is about three times lower than source-sorted OFMSW. These results can be confirmed by the low methane production from the dry AD of mechanically sorted OFMSW in the Oława, Varenne Jarcy and Amies plants. Consequently, waste collection can be considered as the first key-treatment step which significantly affects the characteristics and the yields of biogas production through OFMSW AD.
Currently, the separate collecting system adopted by many municipalities of the Calabria region provides the Rende plant with OFMSW which is rich in food waste with a high methane potential and a reduced fraction of inert and nonfermentable materials. The OFMSW collection strategy together with the pretreatment system used make it possible to obtain a high-quality feed with the presence of unmethanizable materials below 1%.
Particle size can also affect the performance of AD process as the increase in contact surface area available to the microorganisms can positively impact on process kinetics. Although the AD of pretreated organic materials with smaller particles is generally associated with an increased biogas production and accelerated kinetics, especially for ligno-cellulosic materials [83,84,85,86] and waste-activated sludge [87,88], contradictory studies have been reported [11] on the effectiveness of particle size reduction in AD process. In fact, both decrease and no significant effect on biogas production have been reported after reducing particle size of several feedstock, especially OFMSW [89] and food waste [90], due to VFA accumulation resulting in decreased methane production. Since the general perception that a smaller particle size automatically leads to higher AD performance is not necessarily correct, it is indispensable to determine the most suitable particle size according to the specific AD plant characteristics. The choice of a pretreatment system able to release a feed with a particle size of less than 30 mm and TS = 30.0% represented a fair compromise between the stream handling, via pumping system, and the degree of biodegradability and fermentability.
The choice of operating in dry conditions has allowed processing a greater quantity of pretreated SC-OFMSW in a smaller reactor volume and thus to use a higher OLR, with respect to wet conditions.
The combination of the quality and the particle size of the pretreated feed together with the operating conditions of OLR, HRT and temperature made it possible to achieve the reported AD process performances.

3.2. Control Parameters Values

The pH, VFA/TA, TVS and TAN values were almost the same for both reactors (Table 4). For all monitored points, the mean, minimum and maximum observed values are reported.
During the two monitored years, the average pH inside both reactors (IR1 and IR2) fell within the range considered optimal for the AD process. Sometimes a deviation from the average value of up to 0.5 pH units was found, but no significant repercussions were observed on the biogas production. The pH of the two digestates (D1 and D2) was on average higher by about 0.1 units compared to IR1 and IR2.
The VFA/TA values were also in line with those considered ideal for managing the AD plant [91]. Even at the maximum observed VFA/TA value of 0.452, no negative effect on biogas production was found and no corrective actions were taken.
Starting from a TVS average percentage of 22.2% in the pretreated SC-OFMSW fed, it is observed that an average value of 8.38% and 8.42% of the TVS of the two digestates D1 and D2 were obtained, with a TVS removal efficiency of 62.3% and 62.1%, respectively. By calculating the TVS removal percentage at points IR1 (TVS = 8.99%) and IR2 (TVS = 8.98%), a value of 59.5% was obtained in both cases; this value represents the removal efficiency obtained in the first half of the reactors, since the analyzed points IR1 and IR2 are placed in the middle length of them. The TVS removal percentage in the second half of the reactors is 2.8% for R1 and 2.6% for R2. This leads us to conclude that most of the TVS removal and consequently biogas production, about 95.5%, takes place in the first half of the reactors while the remaining 4.5% takes place in the second half of the reactors.
So far, the literature has not defined a precise level of TAN and FAN concentration to be considered as an inhibitory threshold of the AD process, since it depends on many factors such as waste stream, pH, temperature, acclimation etc. [45]. The average measured TAN values of the two reactors were 3.79 g/L and 3.76 g/L corresponding to average FAN values of 0.47 g/L and 0.45 g/L, respectively, falling within the range of values generally considered normal for the AD process. No inhibitory effect [92] was observed with the measured values of TAN, demonstrating a good tolerance and adaptation capacity of the microbial community to the operating conditions.

4. Conclusions

The results related to the monitoring of the performance and operating conditions of the dry mesophilic AD plant located in Rende (Italy) from September 2018 to September 2020 have been reported. The obtained biogas and methane yield were higher than those reported so far in the literature for other similar AD full-scale processes treating OFMSW. With an average OLR of 10.1 kg TVS/m3 d, they were 860 m3/t TVS and 508 m3/t TVS of biogas and methane, respectively. The production rate was of 8.67 m3/m3 d for biogas and 5.12 m3/m3 d for methane. The values of the monitored parameters of pH, VFA/TA and TAN fell within the generally accepted optimal ranges of the AD process. The production data and the operating parameters values were practically the same for both reactors used. The AD process remained stable without the addition of cosubstrates or other additives and no inhibitory effect was found. The association of the SC-OFMSW quality, the pre-treatment system and the operating conditions adopted made it possible to obtain the reported results.

Author Contributions

Conceptualization, A.L.P. and G.Z.; investigation, A.L.P., M.S. and M.B.; data curation, M.B.; writing—original draft preparation, A.L.P. and M.S.; supervision, M.M.; project administration, G.Z. All authors have read and agreed to the published version of the manuscript.

Funding

This research received no external funding.

Institutional Review Board Statement

Not applicable.

Informed Consent Statement

Not applicable.

Data Availability Statement

Data is contained within the article.

Conflicts of Interest

The authors declare no conflict of interest.

References

  1. Morales-Polo, C.; del Mar Cledera-Castro, M.; Soria, B.Y.M. Reviewing the anaerobic digestion of food waste: From waste generation and anaerobic process to its perspectives. Appl. Sci. 2018, 8, 1804. [Google Scholar] [CrossRef] [Green Version]
  2. Eur-Lex. Available online: https://eur-lex.europa.eu/eli/dir/2008/98/2018-07-05 (accessed on 21 December 2020).
  3. US EPA. Available online: https://www.epa.gov/sustainable-management-food (accessed on 21 December 2020).
  4. Rada, E.C. Biological Treatment of Solid Waste, Enhancing Sustainability, 1st ed.; Apple Academic Press, Inc.: Oakville, ON, Canada, 2015; pp. 3–103. [Google Scholar] [CrossRef]
  5. Kaparaju, P.; Rintala, J. Generation of heat and power from biogas for stationary applications: Boilers, gas engines and turbines, combined heat and power (CHP) plants and fuel cells. In The Biogas Handbook, 1st ed.; Woodhead Publishing Limited: Cambridge, UK, 2013; pp. 404–427. [Google Scholar] [CrossRef]
  6. Svensson, M. Biomethane for transport applications. In The Biogas Handbook, 1st ed.; Woodhead Publishing Limited: Cambridge, UK, 2013; pp. 428–443. [Google Scholar] [CrossRef]
  7. Guilayn, F.; Rouez, M.; Crest, M.; Patureau, D.; Jimenez, J. Valorization of digestates from urban or centralized biogas plants: A critical review. Rev. Environ. Sci. Bio/Technol. 2020, 19, 419–462. [Google Scholar] [CrossRef]
  8. Gerardi, M.H. The Microbiology of Anaerobic Digesters, 1st ed.; John Wiley & Sons, Inc.: Hoboken, NJ, USA, 2003. [Google Scholar] [CrossRef]
  9. Karagiannidis, A.; Perkoulidis, G. A multi-criteria ranking of different technologies for the anaerobic digestion for energy recovery of the organic fraction of municipal solid wastes. Bioresour. Technol. 2009, 100, 2355–2360. [Google Scholar] [CrossRef] [PubMed]
  10. Van, D.P.; Fujiwara, T.; Tho, B.L.; Toan, P.P.S.; Minh, G.H. A review of anaerobic digestion systems for biodegradable waste: Configurations, operating parameters, and current trends. Environ. Eng. Res. 2020, 25, 1–17. [Google Scholar] [CrossRef] [Green Version]
  11. Rocamora, I.; Wagland, S.T.; Villa, R.; Simpson, E.D.; Fernández, O.; Bajón-Fernández, Y. Dry anaerobic digestion of organic waste: A review of operational parameters and their impact on process performance. Bioresour. Technol. 2020, 299, 122681. [Google Scholar] [CrossRef]
  12. Kumar, A.; Samadder, S.R. Performance evaluation of anaerobic digestion technology for energy recovery from organic fraction of municipal solid waste: A review. Energy 2020, 197, 117253. [Google Scholar] [CrossRef]
  13. Lissens, G.; Vandevivere, P.; De Baere, L.; Biey, E.M.; Verstraete, W. Solid waste digestors: Process performance and practice for municipal solid waste digestion. Water Sci. Technol. 2001, 44, 91–102. [Google Scholar] [CrossRef]
  14. Rapport, J.L.; Zhang, R.; Williams, R.B.; Jenkins, B.M. Anaerobic digestion technologies for the treatment of municipal solid waste. Int. J. Environ. Waste Manag. 2012, 9, 100–122. [Google Scholar] [CrossRef]
  15. Cesaro, A.; Belgiorno, V.; Naddeo, V. Comparative technology assessment of anaerobic digestion of organic fraction of MSW. Trans. Ecol. Environ. 2010, 142, 355–366. [Google Scholar] [CrossRef] [Green Version]
  16. Angelonidi, E.; Smith, S.R. A comparison of wet and dry anaerobic digestion processes for the treatment of municipal solid waste and food waste. Water Environ. J. 2015, 29, 549–557. [Google Scholar] [CrossRef]
  17. Orhorhoro, E.K.; Ebunilo, P.O.; Sadjere, G.E. Experimental determination of effect of total solid (TS) and volatile solid (VS) on biogas yield. Am. J. Mod. Energy 2017, 3, 131–135. [Google Scholar] [CrossRef] [Green Version]
  18. Motte, J.-C.; Trably, E.; Escudié, R.; Hamelin, J.; Steyer, J.-P.; Bernet, N.; Delgenes, J.-P.; Dumas, C. Total solids content: A key parameter of metabolic pathways in dry anaerobic digestion. Biotechnol. Biofuels 2013, 6, 164. [Google Scholar] [CrossRef] [PubMed] [Green Version]
  19. Pastor-Poquet, V.; Papirio, S.; Trably, E.; Rintala, J.; Escudié, R.; Esposito, G. High-solids anaerobic digestion requires a trade-off between total solids, inoculum-to-substrate ratio and ammonia inhibition. Int. J. Environ. Sci. Technol. 2019, 16, 7011–7024. [Google Scholar] [CrossRef]
  20. Wang, A.; Jiang, Y.; Wang, S.; Zhang, Y.; Hu, Y.; Hu, Z.; Wu, G.; Zhan, X. Impact of total solids content on anaerobic co-digestion of pig manure and food waste: Insights into shifting of the methanogenic pathway. Waste Manag. 2020, 114, 96–106. [Google Scholar] [CrossRef] [PubMed]
  21. Jansson, A.T.; Patinvoh, R.J.; Horváth, I.S.; Taherzadeh, M.J. Dry anaerobic digestion of food and paper industry wastes at different solid contents. Fermentation 2019, 5, 40. [Google Scholar] [CrossRef] [Green Version]
  22. Cho, S.-K.; Im, W.T.; Kim, D.H.; Kim, M.H.; Shin, H.S.; Oh, S.E. Dry anaerobic digestion of food waste under mesophilic conditions: Performance and methanogenic community analysis. Bioresour. Technol. 2013, 131, 210–217. [Google Scholar] [CrossRef]
  23. Forster-Carneiro, T.; Pérez, M.; Romero, L. Influence of total solid and inoculum contents on performance of anaerobic reactors treating food waste. Bioresour. Technol. 2008, 99, 6994–7002. [Google Scholar] [CrossRef]
  24. Kim, M.-S.; Kim, D.-H.; Yun, Y.-M. Effect of operation temperature on anaerobic digestion of food waste: Performance and microbial analysis. Fuel 2017, 209, 598–605. [Google Scholar] [CrossRef]
  25. Singh, G.; Jain, V.K.; Singh, A. Effect of temperature and other factors on anaerobic digestion process, responsible for bio gas production. Int. J. Theor. Appl. Mech. 2017, 12, 637–657. [Google Scholar]
  26. Paramaguru, G.; Kannan, M.; Senthilkumar, N.; Lawrence, P. Effect of temperature on biogas production from food waste through anaerobic digestion. Desalin. Water Treat. 2017, 85, 68–72. [Google Scholar] [CrossRef]
  27. Mata-Alvarez, J. Biomethanization of the Organic Fraction of Municipal Solid Wastes, 1st ed.; IWA Publishing: London, UK, 2002. [Google Scholar] [CrossRef]
  28. He, M.; Sun, Y.; Zou, D.; Yuan, H.; Zhu, B.; Li, X.; Pang, Y. Influence of temperature on hydrolysis acidification of food waste. Procedia Environ. Sci. 2012, 16, 85–94. [Google Scholar] [CrossRef] [Green Version]
  29. Jiang, J.; He, S.; Kang, X.; Sun, Y.; Yuan, Z.; Xing, T.; Guo, Y.; Li, L. Effect of Organic Loading Rate and Temperature on the anaerobic digestion of municipal solid waste: Process performance and energy recovery. Front. Energy Res. 2020, 8, 89. [Google Scholar] [CrossRef]
  30. Christensen, T.H. Anaerobic Digestion: Process. In Solid Waste Technology & Management, 1st ed.; Blackwell Publishing Ltd.: Chichester, UK, 2011; p. 596. [Google Scholar] [CrossRef]
  31. Neshat, S.A.; Mohammadi, M.; Najafpour, G.D.; Lahijani, P. Anaerobic co-digestion of animal manures and lignocellulosic residues as a potent approach for sustainable biogas production. Renew. Sustain. Energy Rev. 2017, 79, 308–322. [Google Scholar] [CrossRef]
  32. Riggio, S.; Hernandéz-Shek, M.A.; Torrijos, M.; Vives, G.; Esposito, G.; van Hullebusch, E.D.; Steyer, J.P.; Escudié, R. Comparison of the mesophilic and thermophilic anaerobic digestion of spent cow bedding in leach-bed reactors. Bioresour. Technol. 2017, 234, 466–471. [Google Scholar] [CrossRef] [PubMed]
  33. Chen, Y.; Cheng, J.J.; Creamer, K.S. Inhibition of anaerobic digestion process: A review. Bioresour. Technol. 2008, 99, 4044–4064. [Google Scholar] [CrossRef]
  34. Chen, J.L.; Ortiz, R.; Steele, T.W.J.; Stuckey, D.C. Toxicants inhibiting anaerobic digestion: A review. Biotechnol. Adv. 2014, 32, 1523–1534. [Google Scholar] [CrossRef]
  35. Czatzkowska, M.; Harnisz, M.; Korzeniewska, E.; Koniuszewska, I. Inhibitors of the methane fermentation process with particular emphasis on the microbiological aspect: A review. Energy Sci. Eng. 2020, 8, 1880–1897. [Google Scholar] [CrossRef] [Green Version]
  36. Ryue, J.; Lin, L.; Kakar, F.L.; Elbeshbishy, E.; Al-Mamun, A.; Dhar, B.R. A critical review of conventional and emerging methods for improving process stability in thermophilic anaerobic digestion. Energy Sustain. Dev. 2020, 54, 72–84. [Google Scholar] [CrossRef]
  37. Goux, X.; Calusinska, M.; Lemaigre, S.; Marynowska, M.; Klocke, M.; Udelhoven, T.; Benizri, E.; Delfosse, P. Microbial community dynamics in replicate anaerobic digesters exposed sequentially to increasing organic loading rate, acidosis, and process recovery. Biotechnol. Biofuels 2015, 8, 122. [Google Scholar] [CrossRef] [Green Version]
  38. Yuan, H.; Zhu, N. Progress in inhibition mechanisms and process control of intermediates and by-products in sewage sludge anaerobic digestion. Renew. Sustain. Energy Rev. 2016, 58, 429–438. [Google Scholar] [CrossRef]
  39. Vavilin, V.A.; Qu, X.; Mazéas, L.; Lemunier, M.; Duquennoi, C.; He, P.; Bouch, T. Methanosarcina as the dominant aceticlastic methanogens during mesophilic anaerobic digestion of putrescible waste. Antonie van Leeuwenhoek 2008, 94, 593–605. [Google Scholar] [CrossRef] [PubMed]
  40. Rattanapan, C.; Sinchai, L.; Suksaroj, T.T.; Kantachote, D.; Ounsaneha, W. Biogas production by co-digestion of canteen food waste and domestic wastewater under organic loading rate and temperature optimization. Environments 2019, 6, 16. [Google Scholar] [CrossRef] [Green Version]
  41. Grangeiro, L.C.; de Almeida1, S.G.C.; de Mello, B.S.; Fuess, L.T.; Sarti, A.; Dussan, K.J. New trends in biogas production and utilization. In Sustainable Bioenergy, 1st ed.; Rai, M., Ingle, A.P., Eds.; Elsevier Inc.: Amsterdam, The Netherlands, 2019; pp. 199–223. [Google Scholar] [CrossRef]
  42. Moestedt, J.; Müller, B.; Westerholm, M.; Schnürer, A. Ammonia threshold for inhibition of anaerobic digestion of thin stillage and the importance of organic loading rate. Microb. Biotechnol. 2016, 9, 180–194. [Google Scholar] [CrossRef] [PubMed]
  43. Ward, A.J.; Hobbs, P.J.; Holliman, P.J.; Jones, D.L. Optimisation of the anaerobic digestion of agricultural resources. Bioresour. Technol. 2008, 99, 7928–7940. [Google Scholar] [CrossRef] [PubMed]
  44. Bouallagui, H.; Touhami, Y.; Cheikh, R.B.; Hamdi, M. Bioreactor performance in anaerobic digestion of fruit and vegetable wastes. Process Biochem. 2005, 40, 989–995. [Google Scholar] [CrossRef]
  45. Jiang, Y.; McAdam, E.; Zhang, Y.; Heaven, S.; Banks, C.; Longhurst, P. Ammonia inhibition and toxicity in anaerobic digestion: A critical review. J. Water Process Eng. 2019, 32, 100899. [Google Scholar] [CrossRef]
  46. Belmonte, M.; Hsieh, C.-F.; Figueroa, C.; Campos, J.L.; Vidal, G. Effect of free ammonia nitrogen on the methanogenic activity of swine wastewater. Electron. J. Biotechnol. 2011, 14, 2. [Google Scholar] [CrossRef]
  47. Liu, Y.; Ngo, H.H.; Guo, W.; Peng, L.; Wang, D.; Ni, B. The roles of free ammonia (FA) in biological wastewater treatment processes: A review. Environ. Int. 2019, 123, 10–19. [Google Scholar] [CrossRef]
  48. Capson-Tojo, G.; Moscoviz, R.; Astals, S.; Robles, A.; Steyer, J.P. Unraveling the literature chaos around free ammonia inhibition in anaerobic digestion. Renew. Sustain. Energy Rev. 2020, 117, 109487. [Google Scholar] [CrossRef]
  49. Westerholm, M.; Liu, T.; Schnürer, A. Comparative study of industrial-scale high-solid biogas production from food waste: Process operation and microbiology. Bioresour. Technol. 2020, 304, 122981. [Google Scholar] [CrossRef]
  50. Sarker, S.; Lamb, J.J.; Hjelme, D.R.; Lien, K.M. A review of the role of critical parameters in the design and operation of biogas production plants. Appl. Sci. 2019, 9, 1915. [Google Scholar] [CrossRef] [Green Version]
  51. Wu, D.; Li, L.; Zhao, X.; Peng, Y.Y. Anaerobic digestion: A review on process monitoring. Renew. Sustain. Energy Rev. 2019, 103, 1–12. [Google Scholar] [CrossRef]
  52. Kumar, S. Biogas, 1st ed.; InTech: Rijeka, Crotia, 2012; p. 158. [Google Scholar] [CrossRef]
  53. Charles, W.; Carnaje, N.P.; Cord-Ruwisch, R. Methane conversion efficiency as a simple control parameter for an anaerobic digester at high loading rates. Water Sci. Technol. 2011, 64, 534–540. [Google Scholar] [CrossRef] [PubMed]
  54. Jimenez, J.; Latrille, E.; Harmand, J.; Robles, A.; Ferrer, J.; Gaida, D.; Wolf, C.; Mairet, F.; Bernard, O.; Alcaraz-Gonzalez, V.; et al. Instrumentation and control of anaerobic digestion processes: A review and some research challenges. Rev. Environ. Sci. Bio/Technol. 2015, 14, 615–648. [Google Scholar] [CrossRef]
  55. Migliori, M.; Catizzone, E.; Giordano, G.; Le Pera, A.; Sellaro, M.; Lista, A.; Zanardi, G.; Zoia, L. Pilot plant data assessment in anaerobic digestion of organic fraction of municipal waste solids. Processes 2019, 7, 54. [Google Scholar] [CrossRef] [Green Version]
  56. Ministero delle Politiche Agricole, Alimentari e Forestali. Available online: https://www.politicheagricole.it/flex/cm/pages/ServeBLOB.php/L/IT/IDPagina/10087 (accessed on 21 December 2020).
  57. Ministero dello Sviluppo Economico. Available online: https://www.mise.gov.it/images/stories/normativa/decreto_ministeriale_18_maggio_2018_gas_aggiornamento_%20regola_tecnica.pdf (accessed on 21 December 2020).
  58. Baird, R.B.; Eaton, A.D.; Rice, E.W. (Eds.) Standard Methods for the Examination of Water and Wastewater, 23rd ed.; American Public Health Association: Washington, DC, USA, 2017. [Google Scholar]
  59. Hach. Available online: https://www.hach.com/asset-get.download.jsa?id=29641556309 (accessed on 21 December 2020).
  60. Campuzano, R.; González-Martínez, S. Characteristics of the organic fraction of municipal solid waste and methane production: A review. Waste Manag. 2016, 54, 3–12. [Google Scholar] [CrossRef]
  61. Fisgativa, H.; Tremier, A.; Dabert, P. Characterizing the variability of food waste quality: A need for efficient valorisation through anaerobic digestion. Waste Manag. 2016, 50, 264–274. [Google Scholar] [CrossRef]
  62. Tyagi, V.K.; Fdez-Güelfo, L.A.; Zhou, Y.; Álvarez-Gallego, C.J.; Romero Garcia, L.I.; Ng, W.J. Anaerobic co-digestion of organic fraction of municipal solid waste (OFMSW): Progress and challenges. Renew. Sustain. Energy Rev. 2018, 93, 380–399. [Google Scholar] [CrossRef]
  63. Esposito, G.; Frunzo, L.; Giordano, A.; Liotta, F.; Panico, A.; Pirozzi, F. Anaerobic co-digestion of organic wastes. Rev. Environ. Sci. Bio/Technol. 2012, 11, 325–341. [Google Scholar] [CrossRef]
  64. Mata-Alvarez, J.; Dosta, J.; Macé, S.; Astals, S. Codigestion of solid wastes: A review of its uses and perspectives including modeling. Crit. Rev. Biotechnol. 2011, 31, 99–111. [Google Scholar] [CrossRef]
  65. Westerholm, M.; Castillo, M.d.P.; Andersson, A.C.; Nilsen, P.J.; Schnürer, A. Effects of thermal hydrolytic pre-treatment on biogas process efficiency and microbial community structure in industrial- and laboratory-scale digesters. Waste Manag. 2019, 95, 150–160. [Google Scholar] [CrossRef] [PubMed]
  66. Pognani, M.; Barrena, R.; Font, X.; Sánchez, A. A complete mass balance of a complex combined anaerobic/aerobic municipal source-separated waste treatment plant. Waste Manag. 2012, 32, 799–805. [Google Scholar] [CrossRef] [Green Version]
  67. Seruga, P.; Krzywonos, M.; Wilk, M. Thermophilic co-digestion of the organic fraction of municipal solid wastes—The influence of food industry wastes addition on biogas production in full-scale operation. Molecules 2018, 23, 3146. [Google Scholar] [CrossRef] [PubMed] [Green Version]
  68. Kübler, H.; Hoppenheidt, K.; Hirsch, P.; Kottmair, A.; Nimmrichter, R.; Nordsieck, H.; Mücke, W.; Swerev, M. Full scale co-digestion of organic waste. Water Sci. Technol. 2000, 41, 195–202. [Google Scholar] [CrossRef] [PubMed]
  69. Banks, C.J.; Chesshire, M.; Heaven, S.; Arnold, R. Anaerobic digestion of source-segregated domestic food waste: Performance assessment by mass and energy balance. Bioresour, Technol. 2011, 102, 612–620. [Google Scholar] [CrossRef] [PubMed] [Green Version]
  70. de Laclos, H.F.; Desbois, S.; Saint-Joly, C. Anaerobic digestion of municipal solid organic waste: Valorga full-scale plant in Tilburg, the Netherlands. Water Sci. Tech. 1997, 36, 457–462. [Google Scholar] [CrossRef]
  71. Sposob, M.; Moon, H.-S.; Lee, D.; Kim, T.-H.; Yun, Y.-M. Comprehensive analysis of the microbial communities and operational parameters of two full-scale anaerobic digestion plants treating food waste in South Korea: Seasonal variation and effect of ammonia. J. Hazard. Mater. 2020, 398, 122975. [Google Scholar] [CrossRef]
  72. Seruga, P.; Krzywonos, M.; Seruga, A.; Niedźwiecki, Ł.; Pawlak-Kruczek, H.; Urbanowska, A. Anaerobic Digestion Performance: Separate Collected vs. Mechanical Segregated Organic Fractions of Municipal Solid Waste as Feedstock. Energies 2020, 13, 3768. [Google Scholar] [CrossRef]
  73. Gallert, C.; Henning, A.; Winter, J. Scale-up of anaerobic digestion of the biowaste fraction from domestic wastes. Water Res. 2003, 37, 1433–1441. [Google Scholar] [CrossRef]
  74. Bolzonella, D.; Pavan, P.; Mace, S.; Cecchi, F. Dry anaerobic digestion of differently sorted organic municipal solid waste: A full-scale experience. Water Sci. Technol. 2006, 53, 23–32. [Google Scholar] [CrossRef]
  75. de Laclos, H.F.; Thiebaut, E.; Saint-Joly, C. Anaerobic digestion of residual municipal solid waste using biological–mechanical pre-treatment: The plant of Varennes Jarcy. Water Sci. Technol. 2008, 58, 1447–1452. [Google Scholar] [CrossRef] [PubMed]
  76. Saint-Joly, C.; Desbois, S.; Lotti, J.-P. Determinant impact of waste collection and composition on anaerobic digestion performance: Industrial results. Water Sci. Technol. 2000, 41, 291–297. [Google Scholar] [CrossRef] [PubMed]
  77. Christensen, T.H. Anaerobic Digestion: Mass Balances and Products. In Solid Waste Technology & Management, 1st ed.; Blackwell Publishing Ltd.: Chichester, UK, 2011; p. 623. [Google Scholar] [CrossRef]
  78. Romero-Guiza, M.S.; Peces, M.; Astals, S.; Benavent, J.; Valls, J.; Mata-Alvarez, J. Implementation of a prototypal optical sorter as core of the new pre-treatment configuration of a mechanical–biological treatment plant treating OFMSW through anaerobic digestion. Appl. Energy 2014, 135, 63–70. [Google Scholar] [CrossRef]
  79. Challen Urbanic, J.M.; VanOpstal, B.; Parker, W. Anaerobic digestion of the organic fraction of municipal solid waste (OFMSW)—full scale vs laboratory results. J. Solid Waste Technol. Manag. 2011, 37, 33–39. [Google Scholar] [CrossRef]
  80. Qian, M.Y.; Li, R.H.; Li, J.; Wedwitschka, H.; Nelles, M.; Stinner, W.; Zhou, H.J. Industrial scale garage-type dry fermentation of municipal solid waste to biogas. Bioresour. Technol. 2016, 217, 82–89. [Google Scholar] [CrossRef]
  81. Zhang, Y.; Banks, C.J.; Heaven, S. Anaerobic digestion of two biodegradable municipal waste streams. J. Environ. Manag. 2012, 104, 166–174. [Google Scholar] [CrossRef] [Green Version]
  82. Hartmann, H.; Ahring, B.K. Strategies for the anaerobic digestion of the organic fraction of municipal solid waste: An overview. Water Sci. Technol. 2006, 53, 7–22. [Google Scholar] [CrossRef]
  83. Menardo, S.; Airoldi, G.; Balsari, P. The effect of particle size and thermal pre-treatment on the methane yield of four agricultural by-products. Bioresour. Technol. 2012, 104, 708–714. [Google Scholar] [CrossRef]
  84. Dai, X.; Hua, Y.; Dai, L.; Cai, C. Particle size reduction of rice straw enhances methane production under anaerobic digestion. Bioresour. Technol. 2019, 293, 122043. [Google Scholar] [CrossRef]
  85. Armah, E.K.; Chetty, M.; Deenadayalu, N. Effect of particle size on biogas generation from sugarcane bagasse and corn silage. Chem. Eng. Trans. 2019, 76, 1471–1476. [Google Scholar] [CrossRef]
  86. Sharma, S.K.; Mishra, I.M.; Sharma, M.P.; Saini, J.S. Effect of particle size on biogas generation from biomass residues. Biomass 1988, 17, 251–263. [Google Scholar] [CrossRef]
  87. Vigueras-Carmona, S.E.; Trujillo, M.A.M.; Rivero, M.G.; Venegas, I.M.; Jiménez, G.Z. Effect of particle size on mesophilic anaerobic digestion of thermally pre-treated waste activated sludge. J. Biotech. Res. 2016, 7, 11–19. [Google Scholar]
  88. Silvestre, G.; Bonmatí, A.; Fernández, B. Optimisation of sewage sludge anaerobic digestion through co-digestion with OFMSW: Effect of collection system and particle size. Waste Manag. 2015, 43, 137–143. [Google Scholar] [CrossRef]
  89. Zhang, Y.; Banks, C.J. Impact of different particle size distributions on anaerobic digestion of the organic fraction of municipal solid waste. Waste Manag. 2013, 33, 297–307. [Google Scholar] [CrossRef] [PubMed] [Green Version]
  90. Izumi, K.; Okishio, Y.-K.; Nagao, N.; Niwa, C.; Yamamoto, S.; Toda, T.T. Effects of particle size on anaerobic digestion of food waste. Int. Biodeterior. Biodegrad. 2010, 64, 601–608. [Google Scholar] [CrossRef]
  91. Rosato, M.A. Managing Biogas Plants; CRC Press: Boca Raton, FL, USA, 2018; pp. 1–48. [Google Scholar] [CrossRef]
  92. Yan, M.; Fotidis, I.A.; Tian, H.; Khoshnevisan, B.; Treu, L.; Tsapekos, P.; Angelidaki, I. Acclimatization contributes to stable anaerobic digestion of organic fraction of municipal solid waste under extreme ammonia levels: Focusing on microbial community dynamics. Bioresour. Technol. 2019, 286, 121376. [Google Scholar] [CrossRef]
Figure 1. Schematic diagram of Rende AD plant.
Processes 09 00213 g001
Figure 2. pH variation of pretreated SC-OFMSW from September 2018 to September 2020.
Processes 09 00213 g002
Figure 3. Total solids—TS (blue line) and total volatile solids—TVS (red line) variation and TVS/TS ratio variation of pretreated SC-OFMSW from September 2018 to September 2020.
Processes 09 00213 g003
Table 1. Types and characteristics of commercial organic fraction of municipal solid waste (OFMSW) anaerobic digestion (AD) technologies. HRT—hydraulic retention time.
Process TypeProcess Characteristics
BTA®One- or two-stage, wet (TS = 10%), mesophilic (35 °C) or thermophilic (55 °C) continuous process able to producing biogas volumes of around 150 m3/t of input waste or 511 m3/t TVS and methane volumes of 332 m3/t TVS.
Dranco®Single-stage, dry (TS = 20–50%), thermophilic (50–58 °C) continuous process able to achieve biogas productions between 100 and 200 m3/t of input materials or 468–622 m3/t TVS and biogas production rate between 4–9.2 m3/m3 in around 14–20 days.
Kompogas®Single-stage, dry (TS = 23–30%), thermophilic (55–60 °C) continuous process able to reach biogas yield of 130–150 m3/t of input waste and methane yield 390–580 m3/t TVS operating at a 15–29 days HRT.
Valorga®Single-stage, dry (TS = 25–35%), mesophilic continuous process able to producing biogas volumes between 80–180 m3/t of input waste and methane volumes of 220–300 m3/t TVS operating at 18–23 days HRT.
Waasa®Single-stage, wet (TS = 10–15%), mesophilic or thermophilic continuous process able to generating a biogas production of 100–150 m3/t of input materials or also a methane production of 170–320 Nm3/t TVS with a retention time of 10–20 days.
Garage-type (Bekon®, Gicon®)Wet or dry, thermophilic or mesophilic (37–55 °C), batch process able to achieve methane productions between 170–370 m3/t TVS in around 28–35 days.
BioFerm®Dry (TS = 25%), mesophilic (37 °C), batch process able to achieve methane productions of 210–350 Nm3/t TVS in 28 days.
Biocel®Dry (TS = 35–40%), mesophilic (35–40 °C), batch process producing 50 m3 of biogas every t of input materials in 21 days.
Sebac®Dry (TS = 30%), thermophilic (55 °C), batch process running 25–40 days and producing 220–530 m3 of methane every t of TVS.
Table 2. Rende AD plant average performances from September 2018 to September 2020.
Reactor 1Reactor 2
BiogasMethaneBiogasMethane
CH4 (%)59.22 58.96
Yield (Sm3/d) 19661570998655829
Specific production (Sm3/t TVS) 1798.5471.9815.4481.8
Specific production (Sm3/t input material) 1177.3104.8181.0107.0
Production rate (Sm3/m3) 1,28.054.768.224.86
1 The International Standard Metric Conditions (S) are 288.15 K and 101.325 kPa. 2 Production rate refers to the useful volume of the reactor. CH4 content in the biomethane before injection in the natural gas grid is 98.5–99.0%.
Table 3. Reported literature data of industrial biogas plants treating OFMSW.
Plant LocationProcess CharacteristicsOperating ParametersBiogas YieldMethane YieldRef.
South Shropshire
(UK)
Wet42 °C; OLR = 2.7 kg TVS/m3 d; HRT = 80 d156 m3/t TS;
642 m3/t TVS;
1.59 m3/m3
98 m3/t TS;
402 m3/t TVS;
1.00 m3/m3
[69]
Tilburg
(NL)
Semicontinous one-stage, dry (Valorga)40 °C; HRT = 20–55d; TS = 30% 210–290 m3/t TVS[70]
(KR)Wet(a) mesophilic; OLR = 3.9–5.4 kg TVS/m3 d
(b) mesophilic; OLR = 5.3–6.1 kg TVS/m3 d
(a) 340–430 m3/t TVS
(b) 220–310 m3/t TVS
[71]
Oława
(PL)
Dry (Kompogas)54 °C;
(a) HRT = 32.2 d;
(b) HRT = 31; TS = 32–35%
(a) 102.3 m3/t
w; 2.79 m3/m3
(feed = 30 t w, operating vol. = 1,100 m3)
(b) 111.1 m3/t w
(a) 53.2 m3/t w d (calc.CH4 = 52%);
(b) 66.7 m3/t w d (calc.CH4 = 60%)
[72]
Karlsruhe
(DE)
Wet (BTA)37 °C; OLR = 8.3–8.5 kg COD/m3 d; HRT = 12 d511 m3/t TVS;
2.6 m3/m3
332.2 m3/t TVS (calc., CH4 = 65%)[73]
Bassano
(I)
Dry (Valorga)36.7 °C; OLR = 4–6 kg TVS/m3 d; HRT = 40–60 d; TS = 30% 400 m3/t TVS; 3.2 m3/m3[74]
Varennes Jarcy
(FR)
One-stage, dry, (Valorga)TS = 30%140 Sm3/t w240 Sm3/t TVS[75]
Amiens
(FR)
One-stage, dry, (Valorga)37 °C; TS = 30%145 m3/t w205 m3/t TVS[76]
Engelskirchen
(DE)
One-stage, dry, (Valorga)37 °C; TS = 30%126 m3/t w280 m3/t TVS[76]
Müster
(DE)
One-step, wetthermophilic90 Nm3/t w40.5–58.5 m3/t w (calc. CH4 = 45–65%)[77]
Kirchstockach
(DE)
Two-step, wetmesophilic60–100 Nm3/t
w
36–60 m3/t w (calc. CH4 = 60–65%)[77]
Barcelona
(ES)
Wet37 °C; OLR = 0.8–1.7 kg TVS/m3 d; HRT = 20–40 d 440–580 m3/t TVS[78]
Toronto
(CA)
Wet37 °C; OLR = 5 kg TVS/m3 d; HRT = 17 d 377 m3/t TVS[79]
Berlin
(DE)
Semidrymesophilic; OLR = 3–7 kg TVS/m3 d; HRT = 15–17 d; TS = 10–15%100–150 m3/t TVS50–105 m3/t TVS (calc. CH4 = 50–70%)[15]
Harbin
(CN)
Batch, dry (garage-type)37 °C; RT = 35 d; TS = 43.5%411 m3/t TVS; 0.72–2.22 m3/m3270 m3/t TVS[80]
w = waste; calc. = methane yield calculated using the declared CH4 percentage in the biogas.
Table 4. Monitored parameters data of internal material of the two reactors (IR1 and IR2) and digestate (D1 and D2) from September 2018 to September 2020.
pH
Mean (Min–Max)
VFA/TA
Mean (Min–Max)
TVS
%Mean (Min–Max)
TAN g/L
Mean (Min–Max)
IR17.90 (7.40–8.13)0.381 (0.295–0.452)8.99 (6.78–9.95)3.79 (2.55–4.51)
IR27.89 (7.38–8.15)0.388 (0.292–0.449)8.98 (7.24–9.97)3.76 (2.78–4.39)
D18.01 (7.81–8.28)0.319 (0.232–0.358)8.38 (6.20–9.09)3.55 (2.02–4.27)
D28.02 (7.78–8.37)0.314 (0.249–0.350)8.42 (6.92–8.98)3.44 (2.18–4.16)
Publisher’s Note: MDPI stays neutral with regard to jurisdictional claims in published maps and institutional affiliations.

