Article

Stabilization of Anaerobic Co-Digestion Process via Constant the Digestate Solids Content

1
Graduate School of Agriculture, Hokkaido University, Sapporo 060-8589, Japan
2
Research Faculty of Agriculture, Hokkaido University, Sapporo 060-8589, Japan
3
Field Science Center for Northern Biosphere, Hokkaido University, Sapporo 060-0811, Japan
*
Author to whom correspondence should be addressed.
Processes 2021, 9(2), 197; https://doi.org/10.3390/pr9020197
Submission received: 9 December 2020 / Revised: 15 January 2021 / Accepted: 19 January 2021 / Published: 21 January 2021
(This article belongs to the Special Issue Current Trends in Anaerobic Digestion Processes)

Abstract

:
The process instability of anaerobic digestion (AD) is a common issue and may result in underperformance or short-term process failure. Extensive research has shown that total solids (TS) content in AD has a significant impact on system stability and performance. However, no study has examined the feasibility of stabilizing the AD process by maintaining constant TS content in the digestate. In this study, an innovative control approach based on constant TS content in the digestate during AD was developed using a mass balance equation. Two levels of TS content (desired values of 4% wet basis (w.b.) and 6% w.b.) were compared with conventional control. The process stability was examined by monitoring digestate components and pH. Substrate-specific methane yield (m3 CH4/kg VS) was used to assess the effectiveness of the controlled conditions. The results showed that the digestate TS content during AD can be controlled and that the digestion process can be stabilized by controlled conditions. In addition, constant TS in the digestate (within 1% w.b. of the desired level) gave increased levels of biogas production (10.2%), methane (13.5%), and substrate-specific methane yield (43.3%) at 4% TS, and respective increases of 16.6%, 21.2%, and 20.8% at 6% TS when compared with standard operation.

1. Introduction

With the development of global industrialization and urbanization, the output of municipal solid waste (MSW) is increasing at an alarming rate. According to World Bank statistics, the world generates 2.01 billion tons of MSW in 2016, which is expected to grow to 3.40 billion tons by the year 2050 [1]. The two major components of MSW are food waste (FW, 44%) and paper waste (PW, 17%) [2]. Considering the negative environmental impacts of landfilling and incineration of MSW [3], sustainable management of MSW is becoming an imminent global issue.
Anaerobic digestion (AD) is the process by which various microorganisms decompose organic matter in the absence of oxygen to produce biogas, which is primarily composed of methane and carbon dioxide and may have small amounts of hydrogen sulfide, and siloxanes [4]. AD has received increased attention in recent years because it is widely used on a global scale and can simultaneously achieve waste treatment and energy recovery [5]. It is estimated that 40–45% of MSW is organic matter that can be valorized by AD [6]. Unlike the use of coal and natural gas, AD using MSW as a raw material would be a sustainable process that decreases the environmental burden of waste and allows energy to be recovered. However, because of the sensitivity of microorganisms to changes in environmental conditions, such as pH and temperature, underperformance and short-term failures caused by process instability are common issues in AD.
Volatile fatty acids (VFAs) include fatty acids having six or fewer carbon atoms, with representative substances including acetic acid, propionic acid, and butyric acid. During the AD process, VFAs are important intermediate products of methane production. One common system instability in the AD of FW is caused by the rapid conversion of easily degradable components in food waste to VFAs at an early stage of the digestion process, resulting in a decrease in pH and leading to reactor failure [7,8]. As a result, AD of FW often must be performed at a low organic loading rate (OLR) of 2–3 to prevent process failure [9].
Based on such a background, one of the major topics to be investigated in this field is the stability of the digestion process. Co-digestion, which is the simultaneous digestion of two or more substrates [10], exhibits better efficiency than mono-digestion because it offers an enhanced balance of nutrients and benefits from the synergistic effect of microorganisms. Therefore, co-digestion is widely considered as a good way to optimize the AD process [11]. There are many reports on the successful performance of co-digestion of FW with different substrates [12,13]. Furthermore, the addition of micronutrients and the use of multi-stage systems are gaining increased attention as methods to improve the stability and performance of AD [14,15,16,17,18]. Other emerging approaches include the application of microbial electrochemical systems and conductive additives within AD to enhance electric syntropy between bacteria and methanogens [19]. Microbial electrolysis cells (MECs) can provide various benefits over conventional AD. Such as enhanced VFA and recalcitrant organics degradation [20,21] thereby improved the stability and performance of AD. In addition to the enhanced degradation efficiencies and biogas production, conductive additives also reduce the accumulation of inhibitors, representing a high potential to improve stability in AD [20]. However, most of the related research on these approaches is still on the batch-type operation and regarding techno-economic challenges. Therefore, developing a more practical approach can have a considerable impact in this field.
It is widely reported that total solids (TS) content in AD has a significant impact on system stability and performance. Most of the theories of TS content in AD systems are, however, focused on explaining the mechanism. For example, decreased mass transfer at high TS content is considered to reduce the accessibility of microbes to the substrate [22], the AD metabolic pathway may change with TS content [23], and diffusion limitation at high TS content causes sugar accumulation and inhibits the hydrolysis of substrates [24], while reduced water availability to microbes at high TS content reduces microbial activity [25].
The aim of this study was therefore to develop a new approach to maintain constant digestate TS during AD using a mass balance equation and examine the feasibility of stabilizing the AD process by maintaining constant TS content in the digestate. AD using FW and PW was carried out under thermophilic conditions (53 ± 2 °C) in a semi-continuous-type reactor with a working volume of 235 L. The adjustment of digestate TS content was applied by adding tap water, and two levels of controlled conditions (desired values of 4% w.b. and 6% w.b.) were compared with conventional control over an experimental period of 64 days.

2. Materials and Methods

2.1. Raw Materials

The characteristics of the raw materials used in this study are shown in Table 1. The initial inoculum was obtained from a biogas plant operated by the Hokkaido University farm at mesophilic conditions treating livestock manure. Food waste collected from the Hokkaido University central restaurant was ground using a food processor (Conair Japan G.K., Tokyo, Japan). Paper waste produced from the laboratory was shredded to give pieces measuring around 4 × 40 mm.

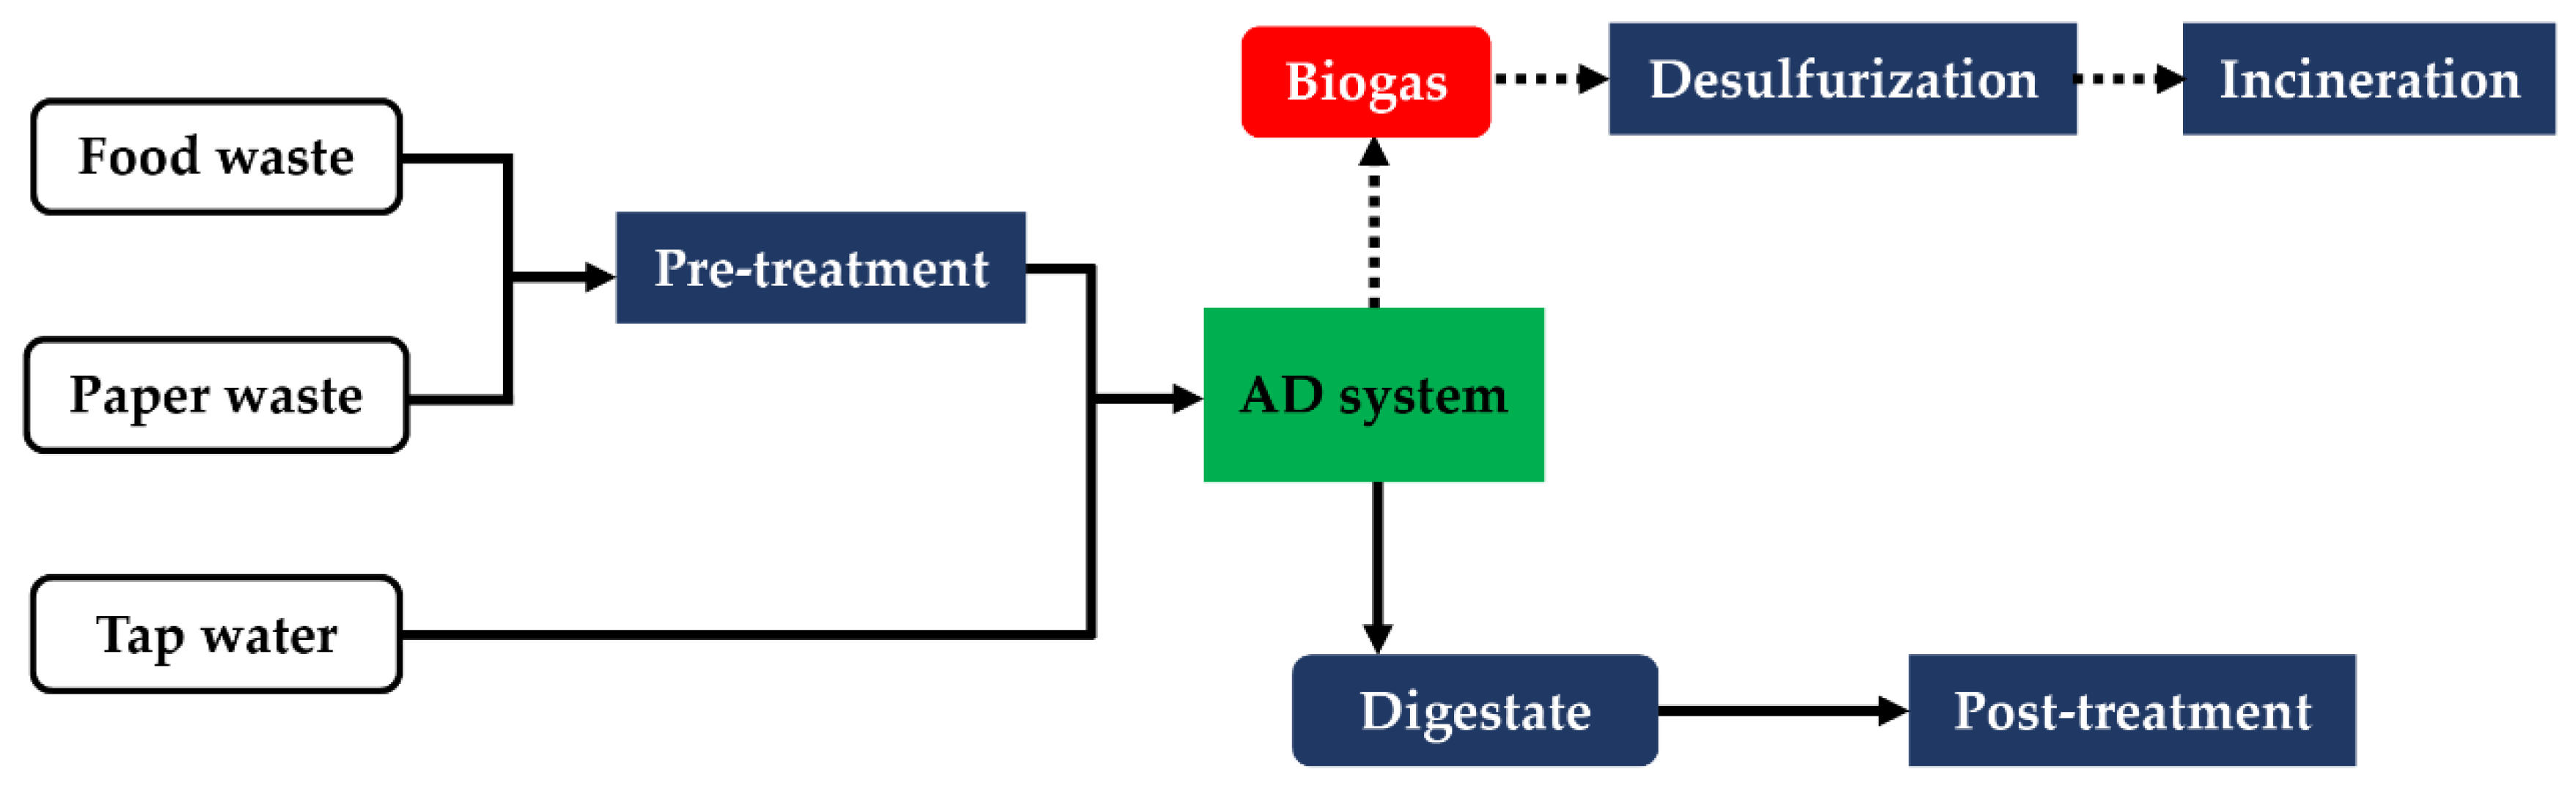
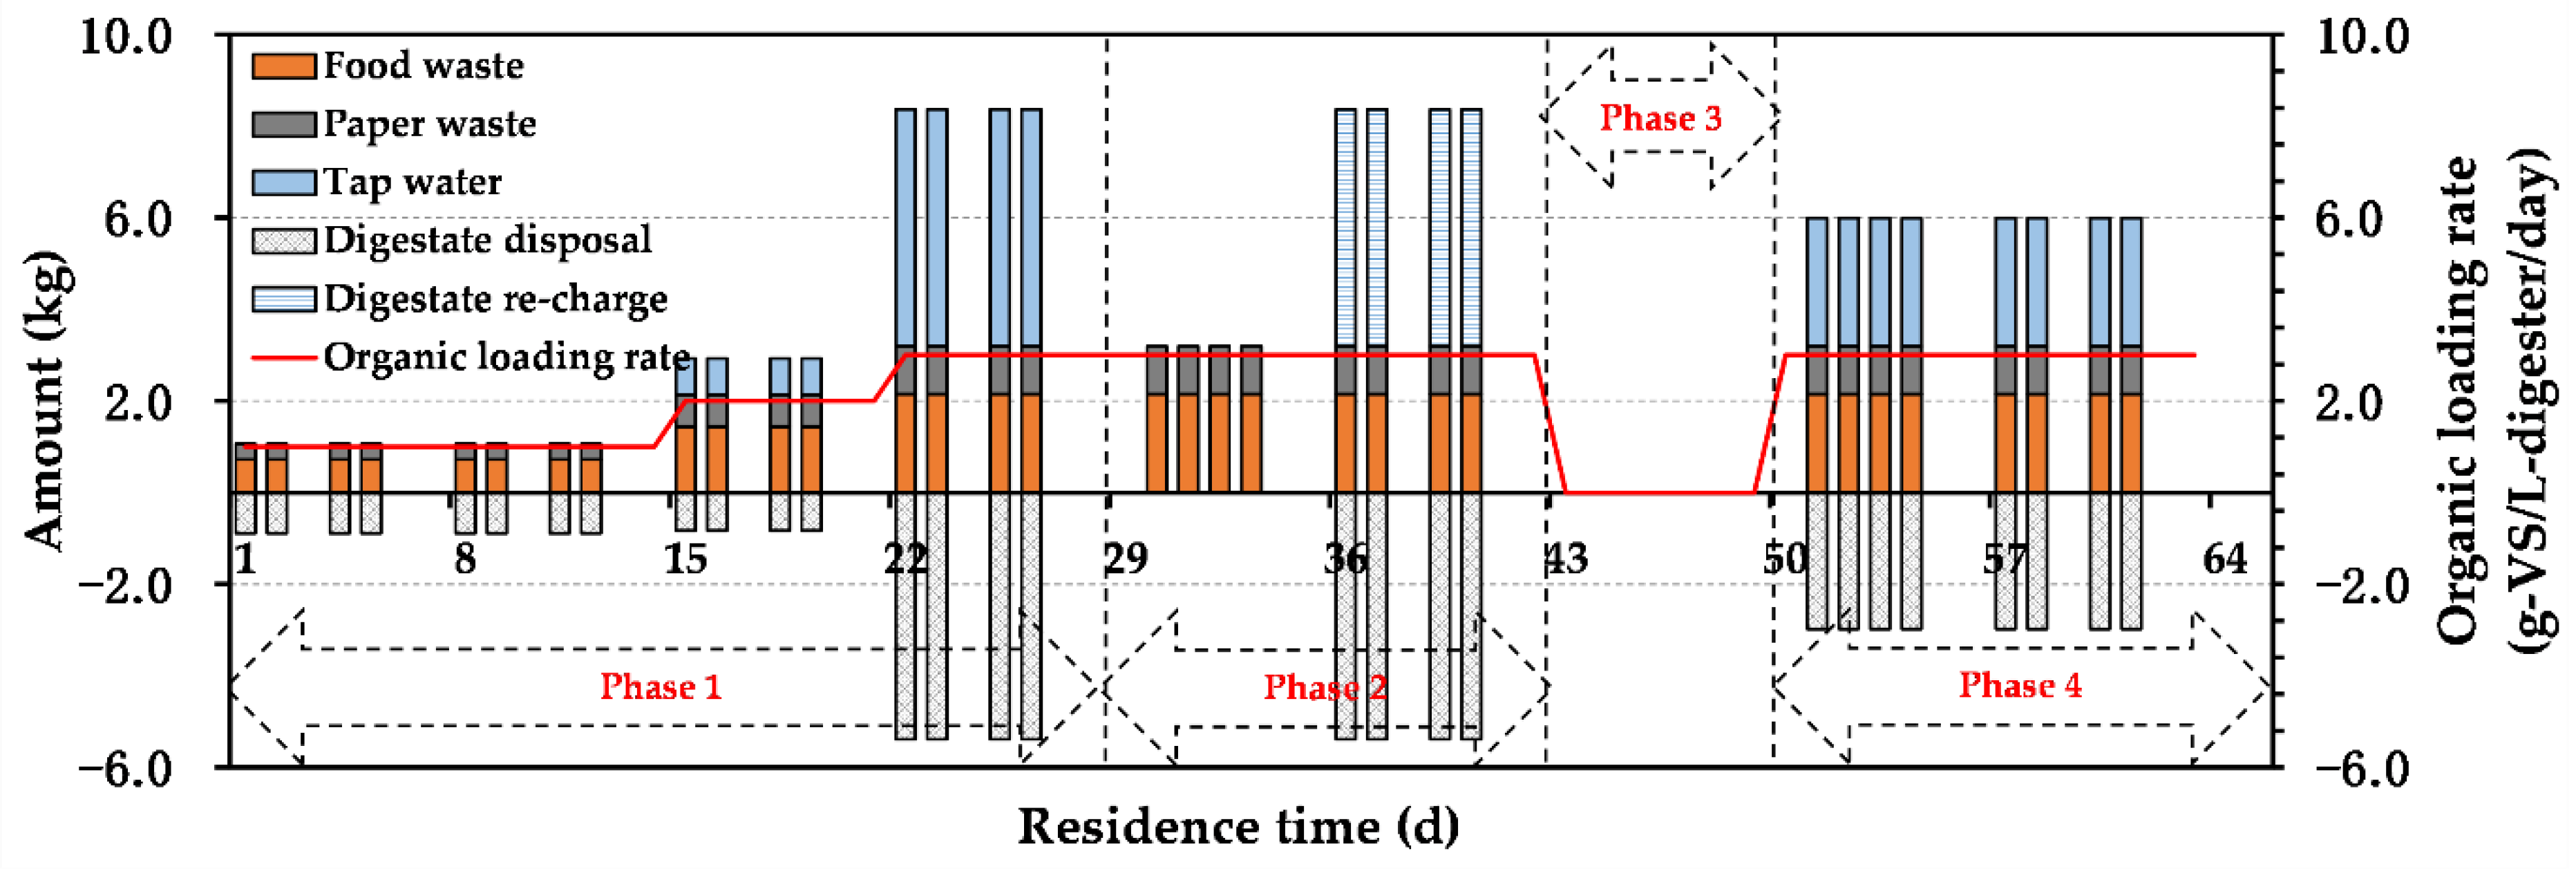
2.2. Experimental Set-up

The AD experiment was carried out in thermophilic conditions (53 ± 2 °C) using a semi-continuous, horizontal cylindrical reactor with a mechanical mixer (235 L working volume) developed by our university [5] for 64 days. The organic loading rate (see Equation (1)) and C/N ratio (Equation (2)) are key operating factors in anaerobic digestion. In this study, the C/N ratio (Equation (2)) was 40 (to minimize ammonia production) [26], and three levels of OLR were used. The amount of raw material added was calculated using Equations (1) and (2). The flow chart illustrating the AD process is shown in Figure 1. The reactor was equipped with a side port for material charging, a top port for gas collection, and a bottom port for digestate sampling. Pre-treated raw materials were added four times each week (on Monday, Tuesday, Thursday, and Friday). To obtain a homogeneous mixture in the system, the mixing time of the mechanical mixer was set to 10 min with a 20 min rest interval. Anaerobic conditions were maintained by supplying nitrogen gas to the reactor after material was added. Generated biogas was collected in a gas bag for desulfurization before further utilization, and digestates were collected for component and stability analyses.
OLR = Volatile   solids   in   feedstock ( kg ) Volume   ( L   digester ) × Residence   time   ( d )
C / N = Carbon   content   of   feedstock   ( kg ) Nitrogen   content   of   feedstock   ( kg )
The entire experiment was divided into four phases. Phase 1 (weeks 1–4) was the period when the steady condition (TS content of 4% w.b.) was adopted, and the OLR was gradually increased from 1 to 3. The effects of the steady conditions were assessed. Phase 2 (weeks 5, 6) acted as the control condition, corresponding to the period without steady TS control, and the OLR was fixed to 3. Raw material was added without adding tap water in week 5, and liquid fraction from the disposed digestate was then added instead of raw material in week 6. Phase 3 (week 7) was the period without feeding, designed to stabilize the digestate solids content and VFA concentration under the influence of raw material charging in the previous week. The constant condition (6% w.b.) was adopted again in Phase 4 (weeks 8, 9) with a fixed OLR of 3 to further assess the effectiveness of the stable conditions. The materials charging plan and operating factors of this study are shown in Figure 2.

2.3. Constant Condition Derivation of Digestate TS Content

The adjustment of digestate TS content was applied by adding tap water. The mass of tap water to be added was calculated according to the mass balance of the AD system. The solids content km of digestate during the AD process is expressed by the following expression:
k m = m 1 s m 1 = m 0 s + f s + p s b s d s m 0 + f + p + w b d
where m1s is the mass of TS in the digestate during the AD process (kg), m1 is the mass of digestate (kg), m0s is the mass of TS in the inoculum (kg), m0 is the mass of inoculum (kg), fs is the mass of TS in FW (kg), f is the mass of FW (kg), ps is the mass of TS in PW (kg), p is the mass of PW (kg), w is the mass of tap water to be added (kg), bs is the generated biogas derived from TS (kg), b is the generated biogas (kg), ds the mass of TS in disposed digestate (kg), and d is the mass of disposed digestate (kg).
When the solids content k of each raw material is substituted into Equation (3) and expanded, the following formula applies:
k m ( m 0 + f + p + w b d ) = k m m 0 + k f f + k p p k b b k m d
where kf is the TS content (% w.b.) of FW, kp is the TS content (% w.b.) of PW, and kb is the ratio of the amount of biogas derived from TS to the amount of generated biogas. The TS content of digestate mainly depends on the initial TS content of the raw material [27]. The mass of total solids in each raw material added was determined, and the TS in PW accounted for 70.2% of the TS in added raw materials. Previous research has established that paper waste mainly consists of cellulose fiber [28,29].To simplify the calculation, it was assumed that the TS of the input raw material was carbohydrates. This allowed the reaction in which the input raw material was decomposed to generate methane gas to be expressed as:
n ( C 6 H 10 O 5 ) + n H 2 O 3 n CH 4 + 3 n CO 2
It was considered that the reaction between the added raw material and water caused a reaction in which methane and carbon dioxide were generated. With respective molar masses of carbohydrate and water of 162 and 18, the mass ratio from this chemical reaction was:
b s : b w = 162 n : 18 n = 9 : 1
k b = b s b s + b w = 0.90
Furthermore, by introducing the mass reduction rate α shown in Equation (8) and rearranging the equation, the mass of tap water added (w) can be obtained from Equation (9):
α = b f + p
Here, f and p are the actual masses of FW and PW to be added to the reactor. However, it is necessary to derive estimated values for the mass reduction rate. The estimated value of the mass reduction rate was obtained by performing linear regression analysis from the previous work (data from 10 April to 19 June 2017) carried out under thermophilic conditions to treating FW and PW [5]. The mass reduction rate was calculated by performing a linear regression analysis with the organic matter load on the horizontal axis and the weight loss rate on the vertical axis. The result is shown in Figure 3.
w = 1 k m ( ( k f ( 1 α ) k m α k b ) f + ( k p ( 1 α ) k m α k b ) p )
For the solids content of FW and PW, the value of the TS content was actually measured. The TS content of the digestate was initially calculated assuming a level of 5% w.b., and after the experiment was started, the value was then changed according to the measured value of the digestate sample. Therefore, the following values were obtained by summarizing the concentrations of each solids content.
{ k f = 0.20 k p = 0.95 k b = 0.90 k m = 0.05

2.4. Analytical Methods

The biogas production rate was determined using a wet gas meter (Shinagawa Corp., Tokyo, Japan) and recorded using a HIOKI LR5000 data logger (HIOKI E.E. Corp., Nagano, Japan). The biogas composition was determined using a Geotech BIOGAS 5000 gas monitor (QED Environmental Systems, Dexter, MI, USA) focusing on the methane and carbon dioxide concentrations. The amount of biogas generated was determined every 12 h, and the methane ratio in the biogas was determined twice each day (10:00 and 14:00) to calculate the amount of methane generated.
The digestion process was assessed by measuring the digestate components twice (on Monday and Thursday) each week using a BUCHI Distillation Unit Type B-323 (BUCHI Corp., Tokyo, Japan) with a titration method, focusing on the VFA, total ammonia nitrogen (TAN), and free ammonia (FA) contents. FA concentration was calculated using Equation (11), where [NH3] is the free ammonia concentration, and Kb the dissociation constant (34.4 × 10⁻¹⁰ at 52 °C).
[ NH 3 ] = [ TAN ] 1 + [ H + ] K b
Total solid (TS) and volatile solids (VS) were determined by drying wet samples at 105 °C for 24 h, followed by incineration at 600 °C for 3 h. The pH of each sample was determined with a pH meter. Each measurement was made in triplicate, and the mean result was calculated. The substrate-specific methane yield (SMY) indicated the amount of methane generated per unit of volatile solids added using Equation (12) and was used to assess the effectiveness.
SMY = Methane   gas   yield   ( m 3 ) Volatile   solids   of   added   feedstock   ( kg )

3. Results and Discussion

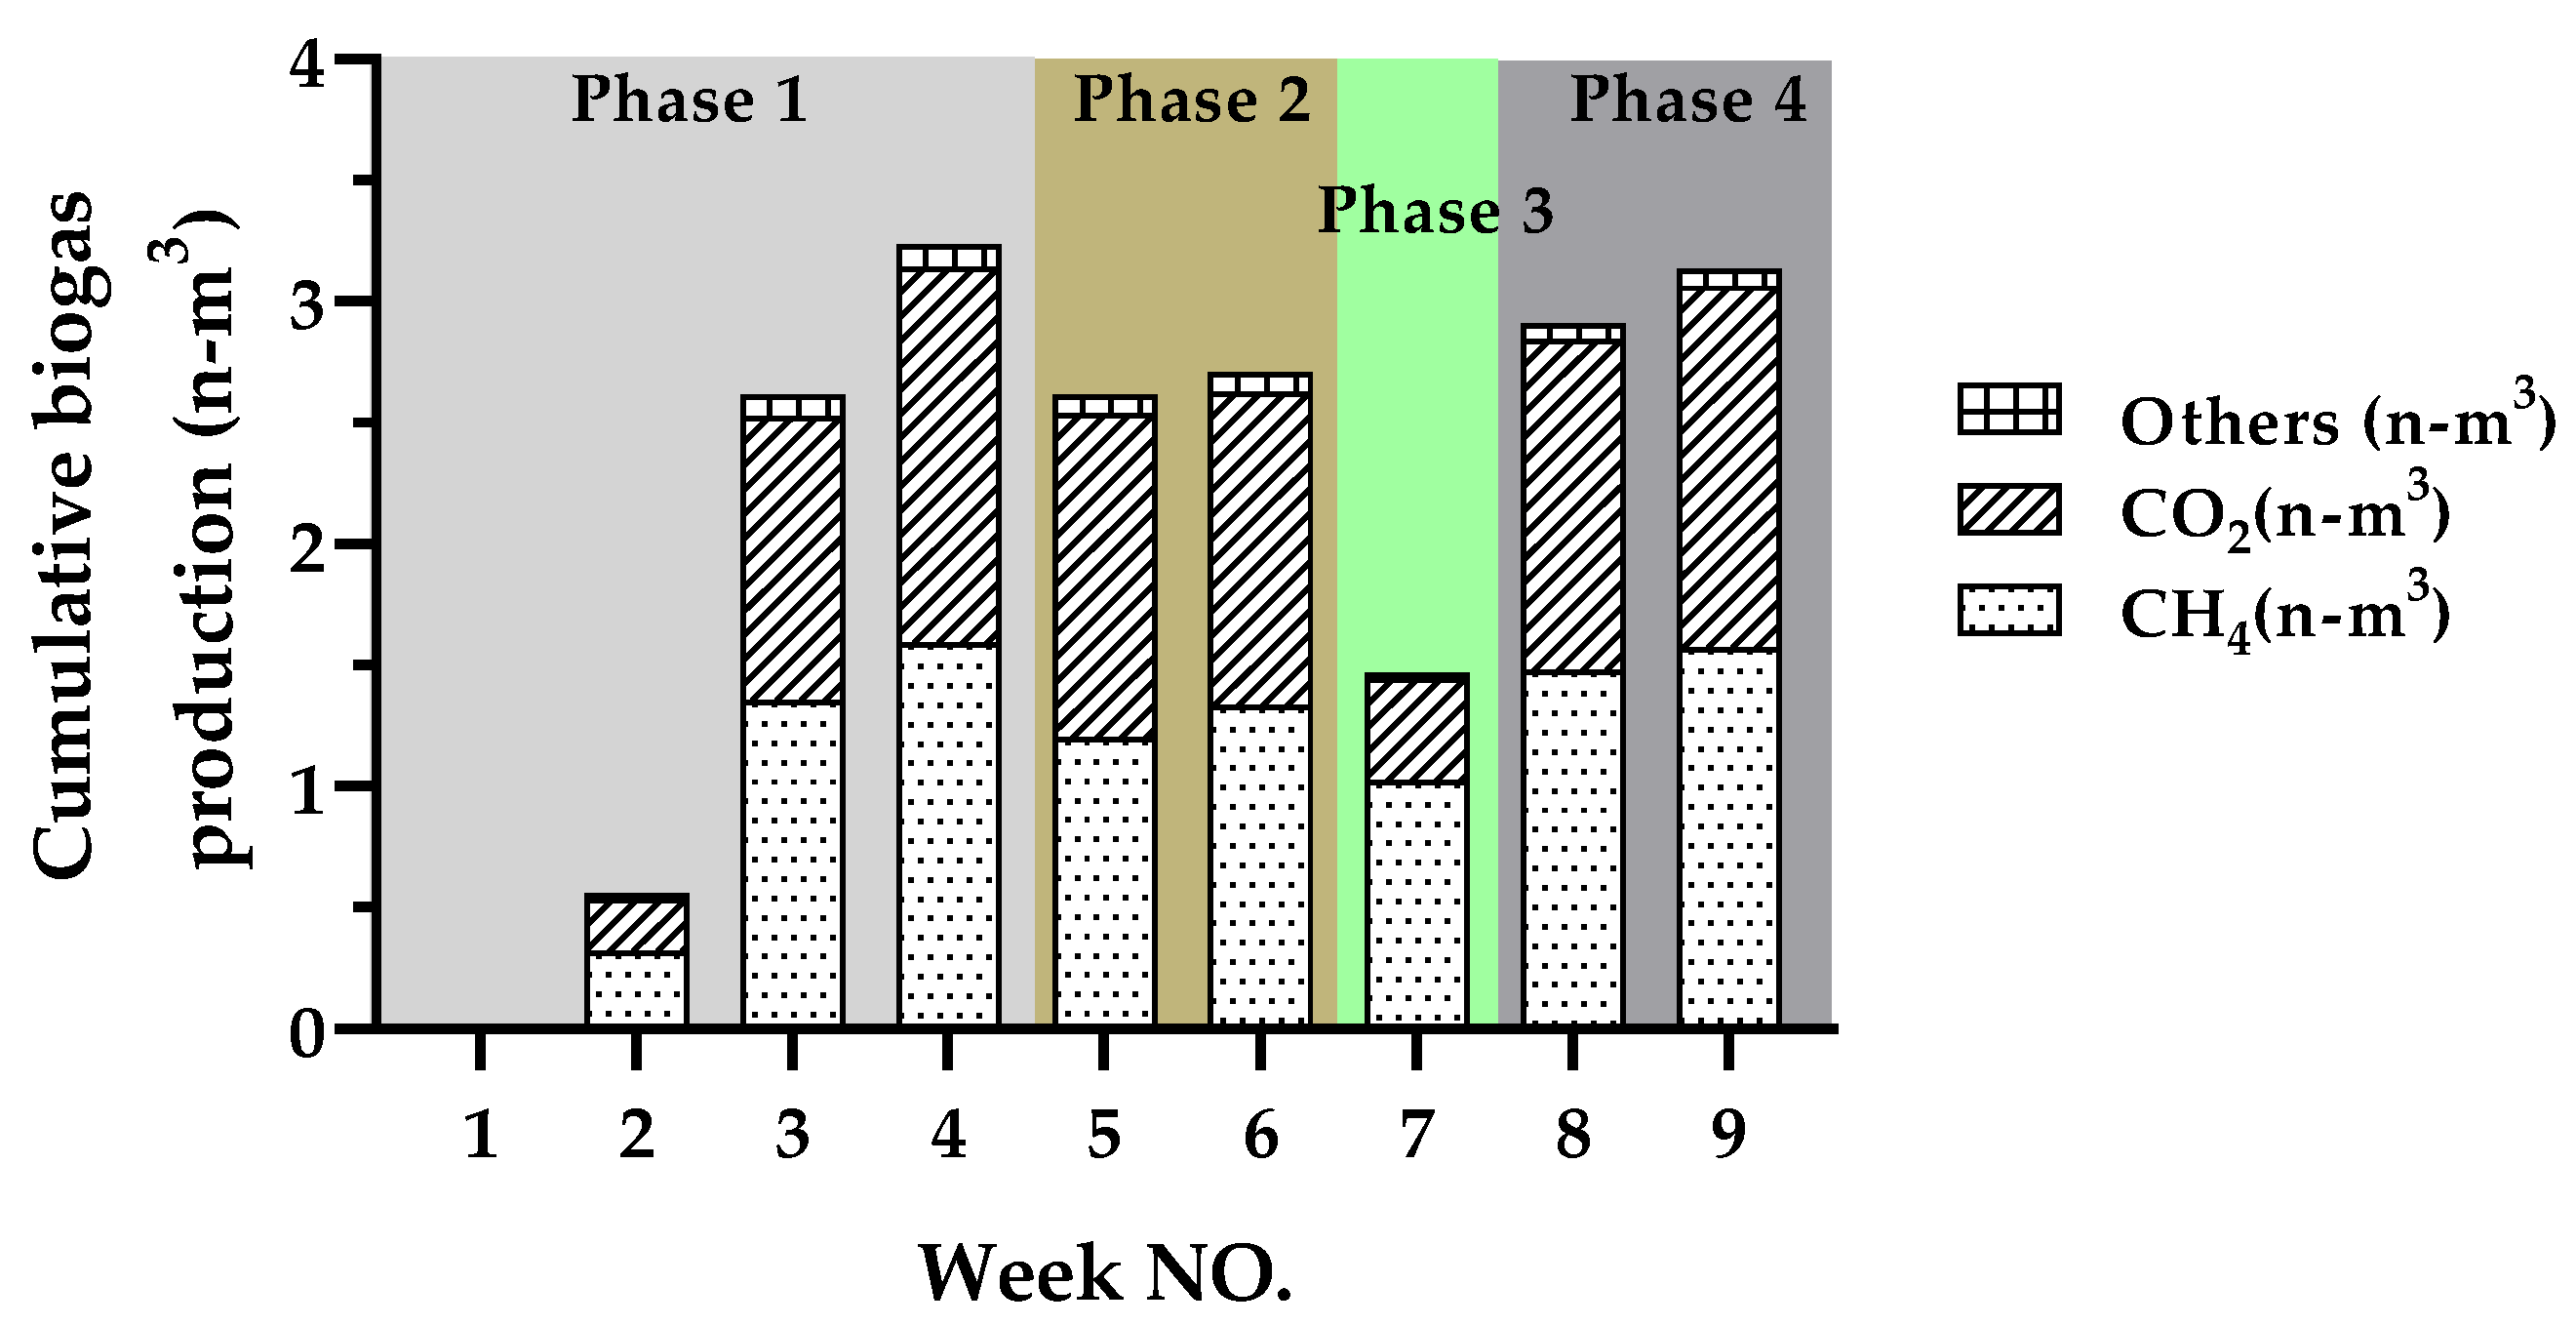
3.1. Cumulative Biogas Production and Methane Concentration

The weekly cumulative biogas production and methane concentration of each phase are shown in Figure 4. Generated biogas was not completely measured in the first 2 weeks because of equipment failure. The cumulative biogas production of week 3 (Phase 1) was 2.62 n-m3, which was almost the same as the amount generated in weeks 5 and 6 in Phase 2. In weeks 4, 8, and 9, the amount of gas generated ranged from 2.91 to 3.24 n-m3. The amount of biogas generated in week 7 when no raw material was added was about 1.5 n-m3, which was much less than the other phases in which measurement was possible. Except for the period when the raw materials were not added in week 7, when comparing the phase that adopted constant conditions (Phases 1 and 4) and the phase that was performed under conventional conditions (Phase 2), the biogas production and methane concentration were increased by 10.2% and 13.5%, respectively, in Phase 1, and by 16.6% and 21.2%, respectively, in Phase 4. These results suggest that maintaining constant TS content in the digestate during the AD process can improve the digestion efficiency and the amount of biogas produced. It seems possible that these results are due to the addition of tap water, which aids in the diffusion of substrates to bacterial sites and microbial metabolism and allowed greater participation of microorganisms in methane production, thus increasing the volume of biogas [24,30].

3.2. Anaerobic Digestion of Liquid Fraction

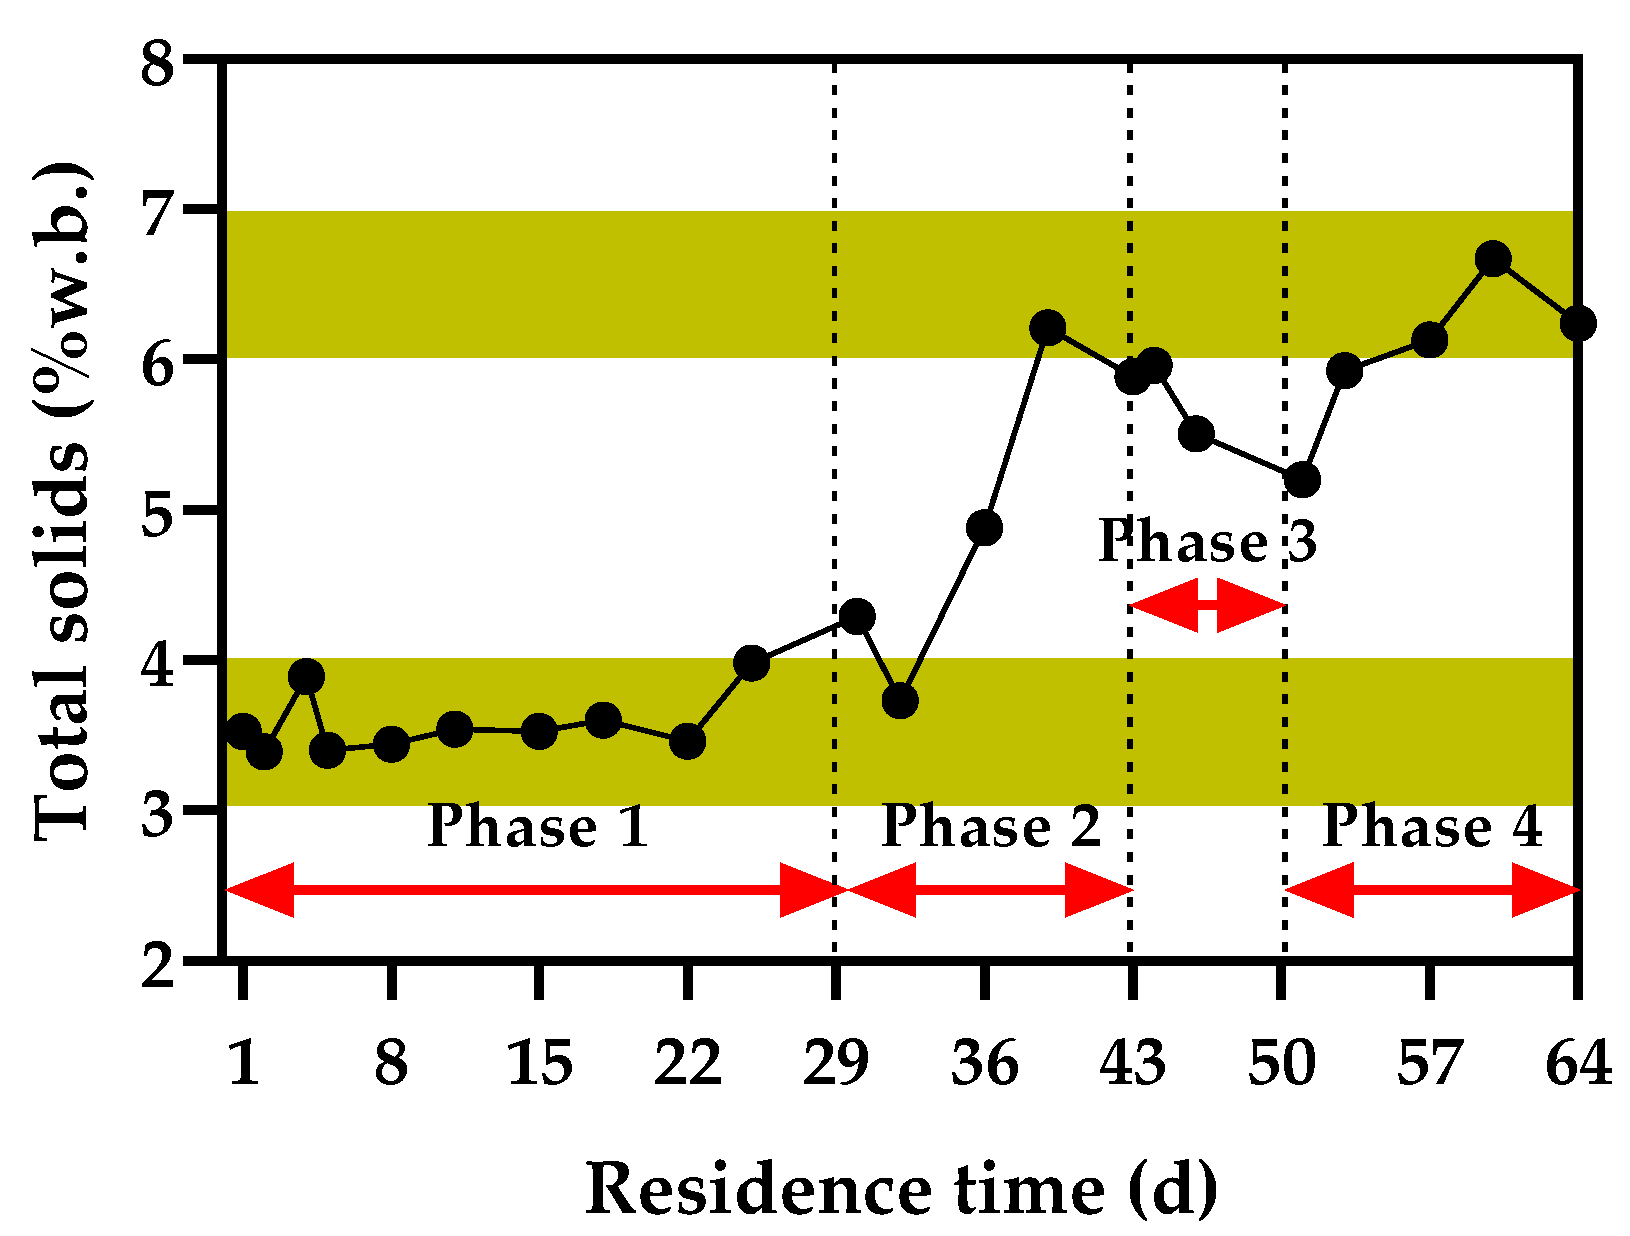
3.2.1. TS Content of Digestate during AD

The results of TS content of digestate during the AD process are shown in Figure 5. For the phases adopting constant conditions (Phases 1 and 4), the TS content tended to be in the range of 3.0–4.0% w.b. and 6.0–7.0% w.b., respectively. In Phase 2 (conventional method), TS content was increased and ranged from 3.7 to 6.2% w.b. The TS content decreased in Phase 3 without feeding. These results suggest that when adopting the controlled constant condition, TS content during AD was able to be maintained within 1.0% w.b. of the desired level, indicating TS content during AD can be controlled by adopting the control condition newly introduced in this study.

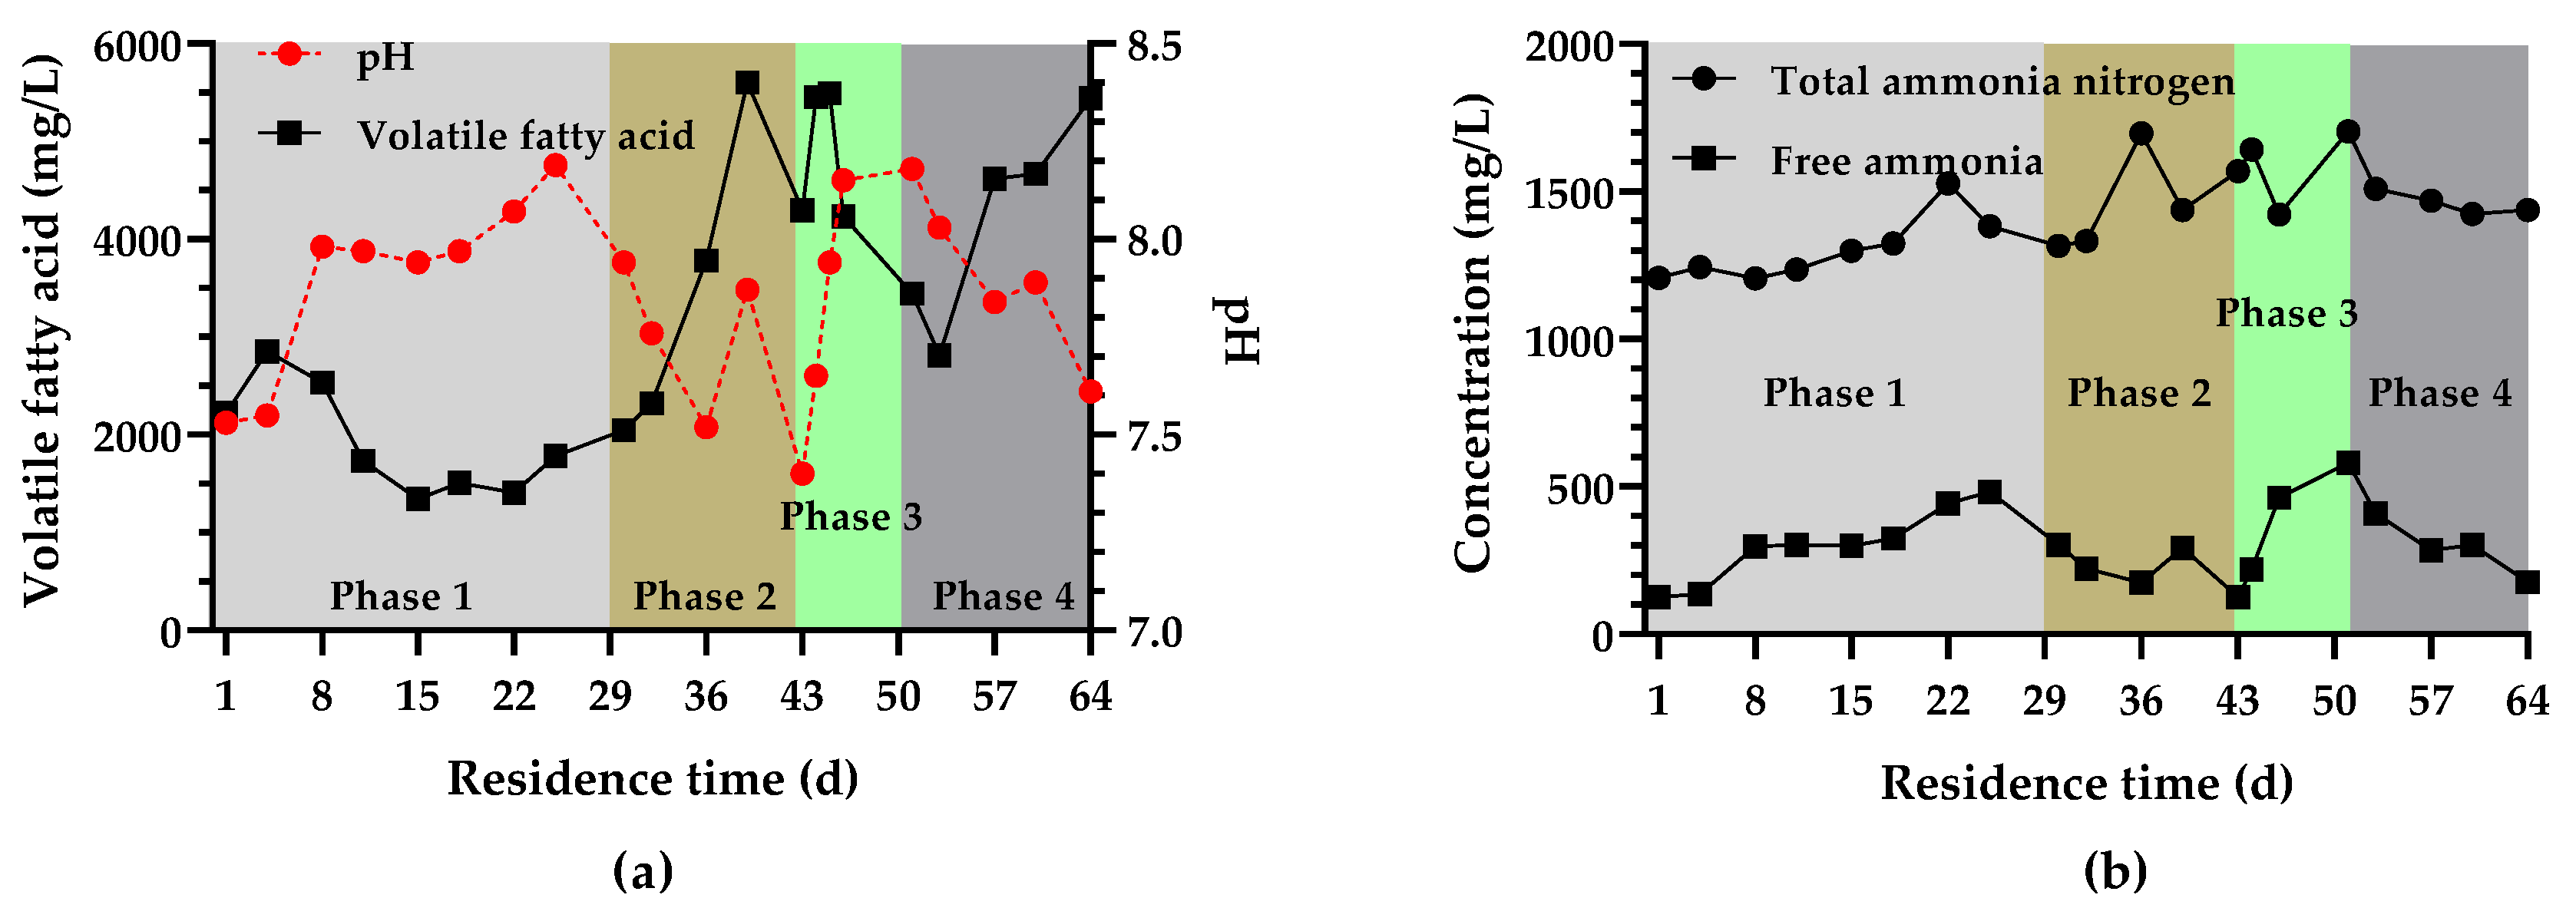
3.2.2. VFA, TAN Concentration, and pH

The results of VFA, pH, TAN, and FA contents of the digestate during the AD process are shown in Figure 6. The VFA concentration during the AD process remained below 3000 mg/L in Phase 1, and it increased sharply up to 5600 mg/L from the latter half of Phase 2 when liquid fraction of disposed digestate was added. VFA then started to decrease in Phase 3 without feeding. The VFA concentration increased again from week 8 (Phase 4) when feeding resumed, and the upward trend continued until the end of the experimental period.
It is well known that VFAs are intermediate products of methane production during the AD process. Assessment of VFAs along with biogas production and methane concentration showed that VFA accumulation occurred in Phase 2, and larger amounts of volatile fatty acids were produced in the initial hydrolysis phase during anaerobic digestion when conventional conditions were performed. This was shown by a strong increase in the volatile fatty acid concentration in Phase 2, which caused an imbalance in the process. Similar conclusions were drawn in previous studies [31,32,33,34]. In Phase 4, although a huge increase in VFA concentration was observed, the yields of biogas and methane remained high. Therefore, we considered that water addition caused greater distribution of VFAs, and assisted in the diffusion of VFAs (particularly acetic acid) to the microbial cells [6].
The TAN concentration showed a gradual upward trend; however, no significant fluctuation was observed until the end of the experiment. Because TAN is produced by the biological decomposition of proteins and amino acids in the input material, it is affected by the nitrogen concentration in the input material [26]. In this study, the C/N ratio in the input raw material was set to 40, which is the optimum value for methane fermentation, and this is considered to be the reason that the large fluctuation of TAN concentration was suppressed.
FA concentration fluctuated more than TAN concentration. This was because the concentration of FA was obtained by substituting the TAN concentration and pH into the chemical equilibrium equation for ammonia, which is affected by fluctuations in pH. A literature study [26] suggested that when the FA concentration exceeds 500 mg/L, the amount of generated gas decreases. In this study, the FA concentration did not exceed 500 mg/L, and it is considered that the inhibition by ammonia was suppressed.
The pH ranged between 7.4 and 8.2 throughout the process, which is within the range required for a well-operated AD system. This suggests that the microorganisms of the AD system were not disturbed by changes in pH in this study. Values were obtained from day 8 to 25 (phase 1) and day 45 to 46 (phase 3), varying between 8.0 to 8.2 and 7.9 to 8.2, respectively. A possible explanation for this might be that, in order to maintain the TS within the desired level (4% w.b.), relatively few raw materials were fed in phase 1, which resulted in fewer nutrients being converted into VFA, and a higher pH was then obtained. Similarly, phase 3 was the period without feeding, the increased pH was observed with decreased VFA production.
These results suggest that a stable AD process was achieved by adopting steady conditions. Considering the imbalance of the digestion process that occurred under standard operation (phase 2), we considered that maintaining constant TS content in the digestate by adding tap water may not only aid in the bacterial movement and diffusion of substrates to bacterial sites but also aid the balance between VFA production and the conversion of acids to methane gas [30,35].

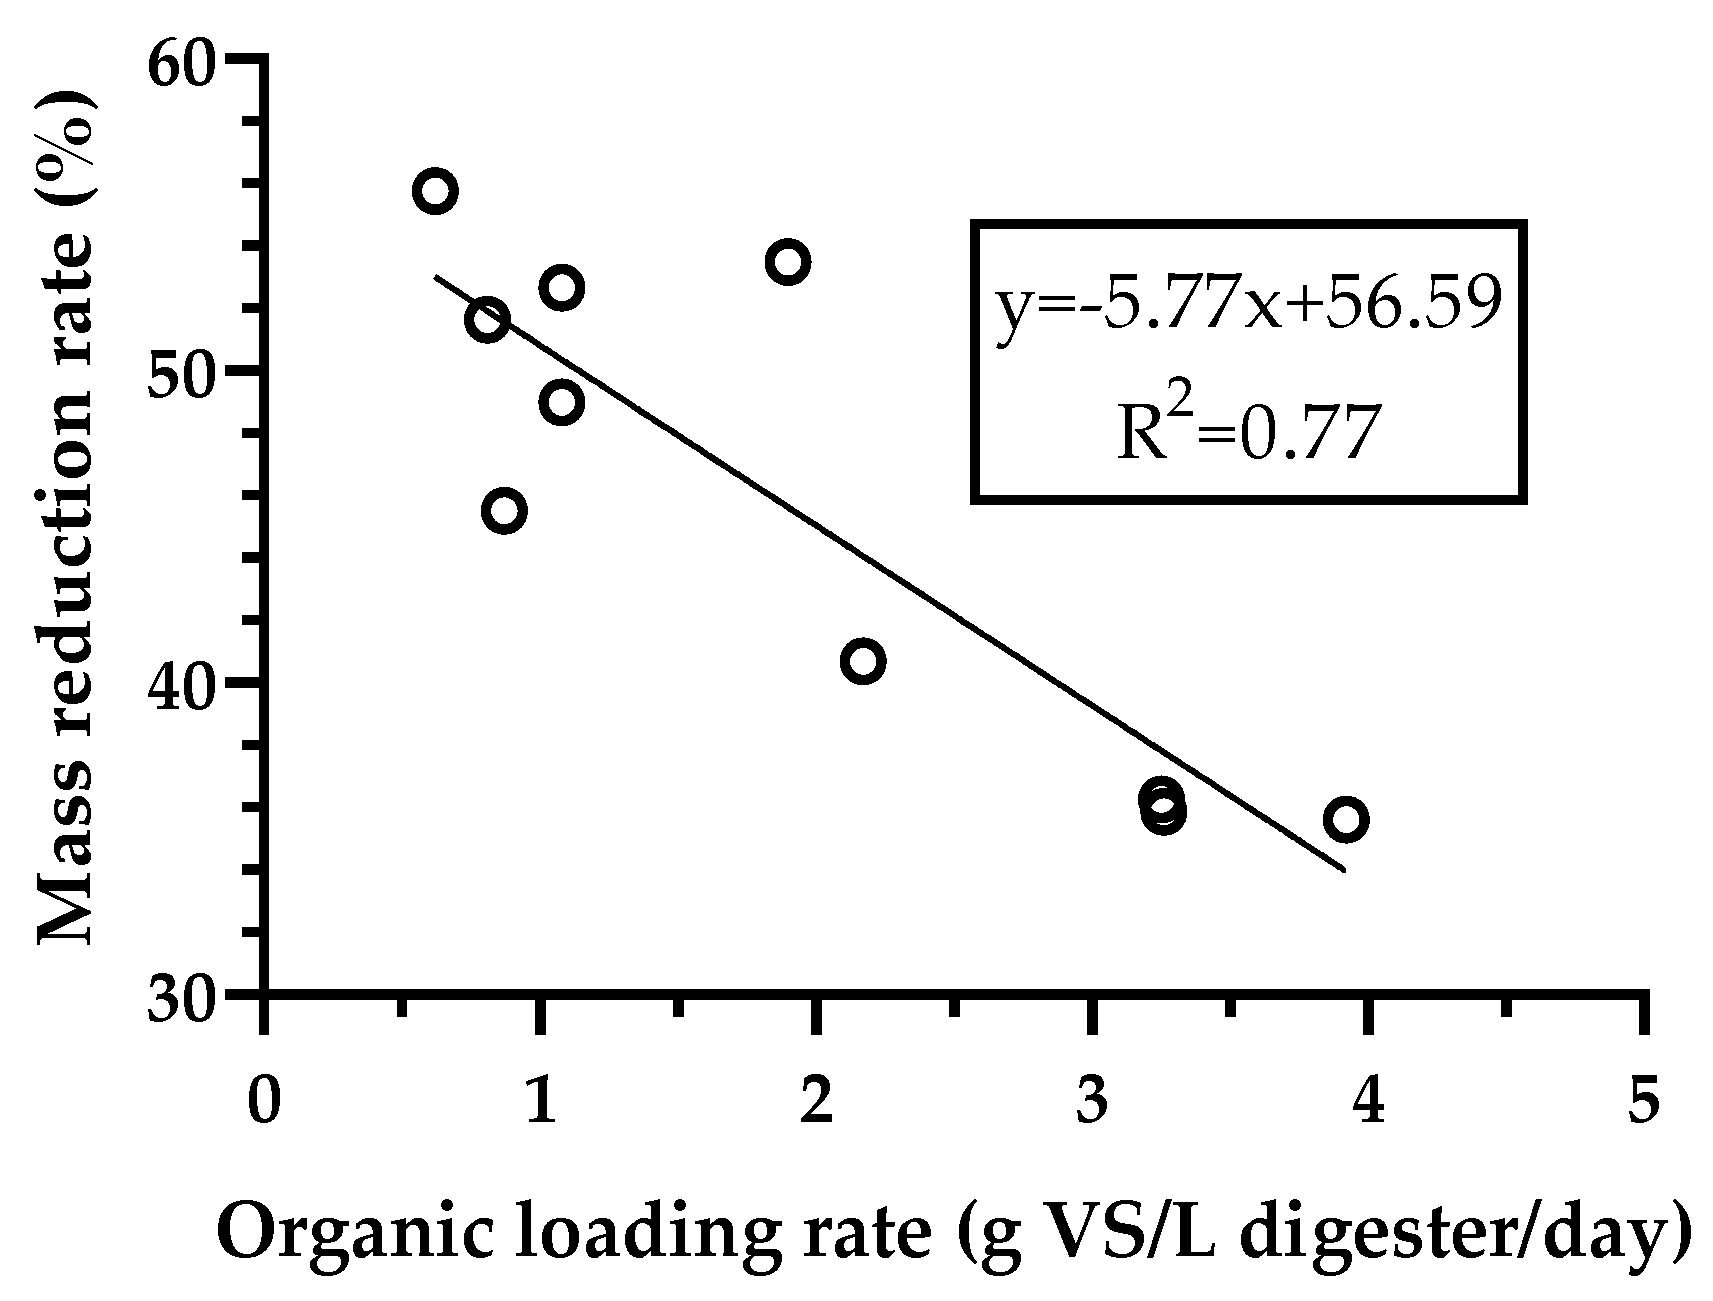
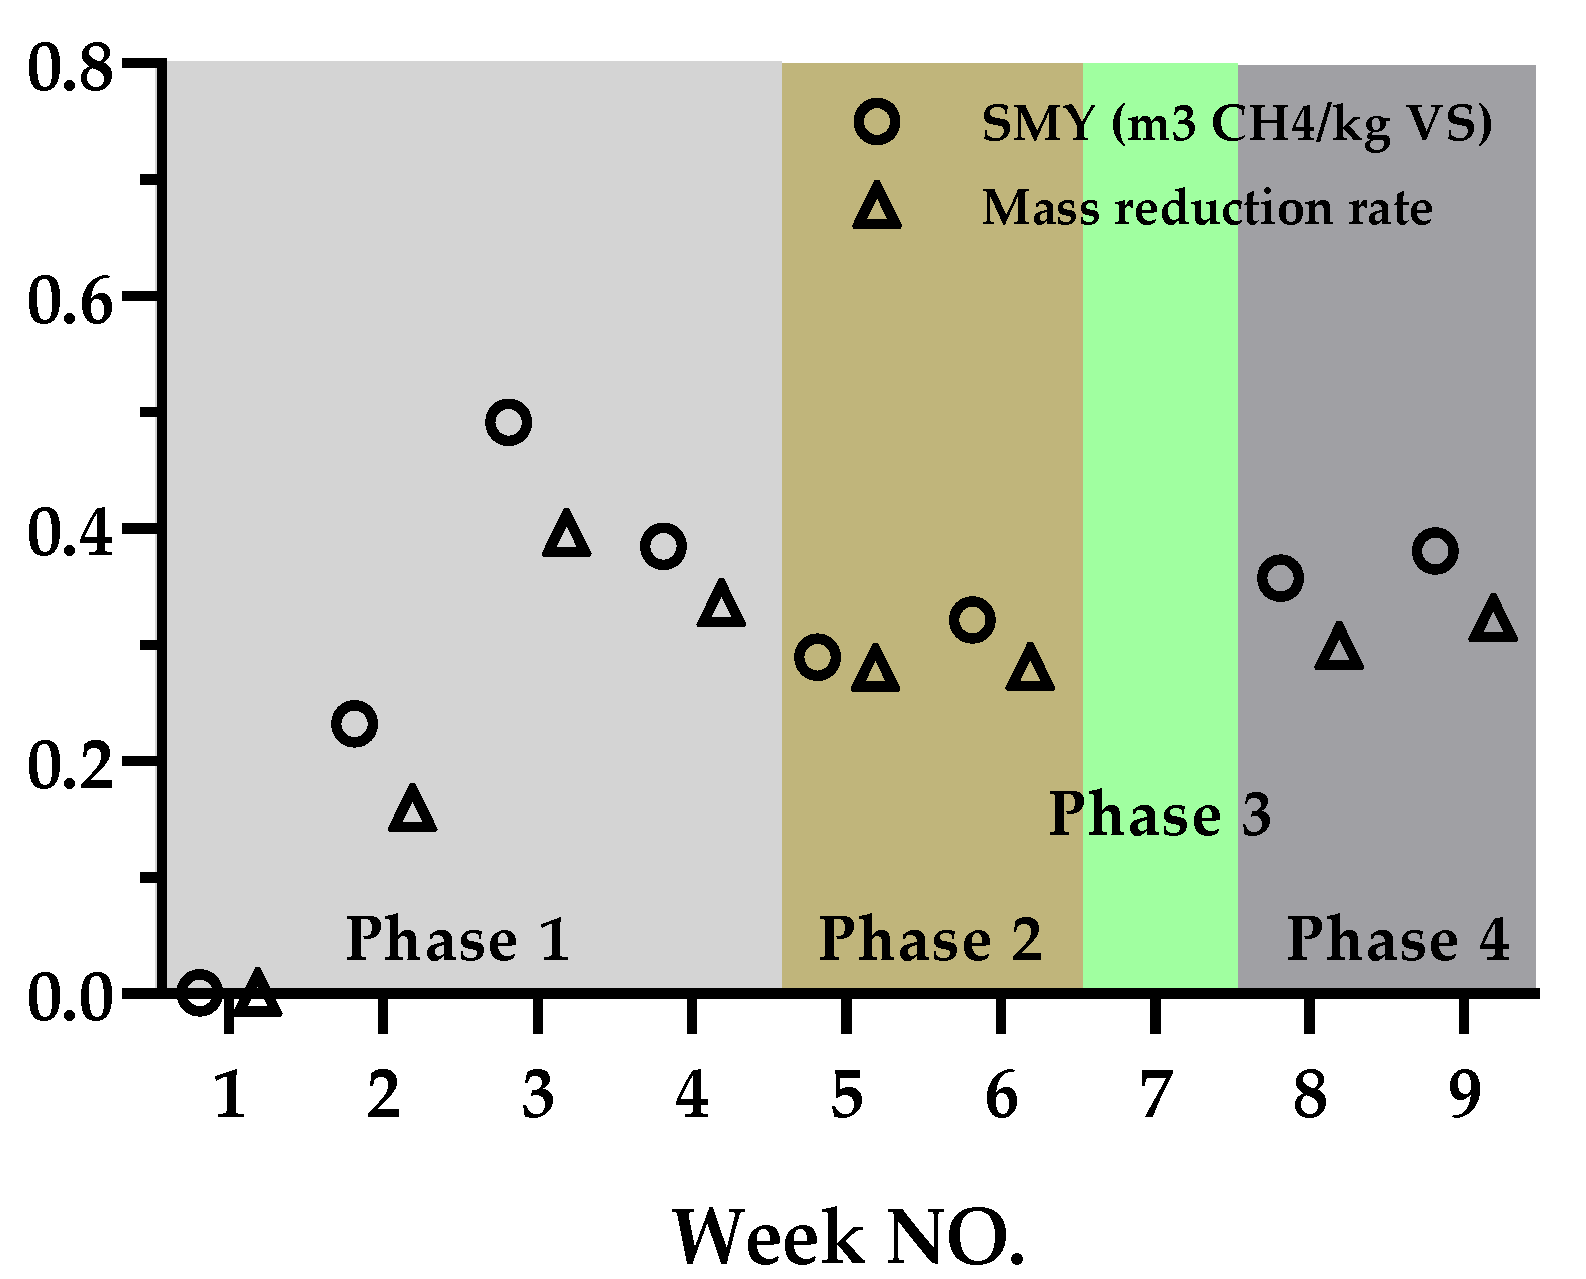
3.3. Mass Reduction Rate and SMY

Weekly SMY and mass reduction rate in AD process are shown in Figure 7. The biogas generated in the first 2 weeks of Phase 1 was not completely measured because of equipment failure. Therefore, the results from weeks 3 and 4 in Phase 1 were further analyzed. Similar to the response of generated biogas, in the phases (Phases 1 and 4) adopting stable conditions, the mass reduction rate and SMY were greater than those for the phase performed under conventional conditions (Phase 2). Phase 1 showed an increase in mass reduction rate of 30.5% and a 43.3% increase in SMY when compared with Phase 2, while Phase 4 showed respective increases of 10.9% and 20.8%. It can thus be suggested that maintaining constant digestate TS during AD by adding tap water using a mass balance equation caused the greater distribution of VFAs and aided the balance between VFA production and the conversion of acids to methane gas, thereby, improving the digestion activity and waste treatment capacity of the AD system compared to the standard operation.

4. Conclusions

AD using FW and PW was carried out under thermophilic conditions in a semi-continuous-type reactor to examine the feasibility of stabilizing the AD process by maintaining constant TS content in the digestate. Two levels of controlled conditions (desired values of 4% w.b. and 6% w.b.) were compared with conventional control over an experimental period of 64 days. The results identified that by applying stable digestate conditions newly developed using a mass balance equation during the AD process, the TS content of the digestate was maintained within 1% w.b. of the desired level. Considering the increase of digestate TS and the system imbalance caused by VFA accumulation during the conventional control phase, it was apparent that the digestate TS content during AD can be controlled and the digestion process can be stabilized by adopting steady conditions. In addition, the biogas production and methane concentration were increased over the levels for conventional control by 10.2% and 13.5%, respectively, with steady control in Phase 1, and by 16.6% and 21.2%, respectively, when using steady control in Phase 4. Therefore, we consider that AD performance can be improved by controlling the digestate TS to a steady level during AD. This study, for the first time, examined the feasibility of stabilizing the AD process by maintaining constant TS content in the digestate, which has provided a breath of fresh air into this field. In future work, considerably more work will need to be done to determine the behavior of microbial communities when adopting steady conditions.

Author Contributions

Conception of experiment, project administration, writing and review, N.S.; methodology, data analysis, writing, R.N.; experiment design, experimental work, K.U. and K.Y. All authors have read and agreed to the published version of the manuscript.

Funding

This research received no external funding.

Institutional Review Board Statement

Not applicable.

Informed Consent Statement

Not applicable.

Data Availability Statement

Date available on request due to restrictions eg privacy or ethical.

Acknowledgments

The authors thank Nishimatsu Construction Co., Ltd. for their support.

Conflicts of Interest

The authors declare no conflict of interest.

References

  1. World Bank. What A Waste 2.0. Available online: https://datatopics.worldbank.org/what-a-waste/index.html (accessed on 12 November 2020).
  2. Kaza, S.; Lisa, Y.; Perinaz, B.-T.; Frank, V.W. What a Waste 2.0: A global Snapshot of Solid Waste Management to 2050; Urban Development Series; License: Creative Commons Attribution CC BY 3.0 IGO; World Bank: Washington, DC, USA, 2018; p. 29. [Google Scholar] [CrossRef]
  3. Xu, F.; Li, Y.; Ge, X.; Yang, L.; Li, Y. Anaerobic digestion of food waste–Challenges and opportunities. Bioresour. Technol. 2018, 247, 1047–1058. [Google Scholar] [CrossRef] [PubMed]
  4. United Nations Development Program. Goal 7 Targets. Available online: https://www.undp.org/content/undp/en/home/sustainable-development-goals/goal-7-affordable-and-clean-energy/targets.html (accessed on 28 April 2020).
  5. Yoshida, K.; Kametani, K.; Shimizu, N. Adaptive identification of anaerobic digestion process for biogas production management systems. Bioprocess Biosyst. Eng. 2019, 43, 45–54. [Google Scholar] [CrossRef] [PubMed]
  6. Fernández-Rodríguez, J.; Pérez, M.; Romero-García, L.I. Dry thermophilic anaerobic digestion of the organic fraction of municipal solid wastes: Solid retention time optimization. Chem. Eng. J. 2014, 251, 435–440. [Google Scholar] [CrossRef]
  7. Banks, C.J.; Chesshire, M.; Heaven, S.; Arnold, R. Anaerobic digestion of source-segregated domestic food waste: Performance assessment by mass and energy balance. Bioresour. Technol. 2011, 102, 612–620. [Google Scholar] [CrossRef] [Green Version]
  8. Zhang, L.; Jahng, D. Long-term anaerobic digestion of food waste stabilized by trace elements. Waste Manag. 2012, 32, 1509–1515. [Google Scholar] [CrossRef] [PubMed]
  9. Hecht, C.; Griehl, C. Investigation of the accumulation of aromatic compounds during biogas production from kitchen waste. Bioresour. Technol. 2009, 100, 654–658. [Google Scholar] [CrossRef] [PubMed]
  10. Yao, Y.; Huang, G.; An, C.; Chen, X.; Zhang, P.; Xin, X.; Shen, J.; Agnew, J. Anaerobic digestion of livestock manure in cold regions: Technological advancements and global impacts. Renew. Sustain. Energy Rev. 2020, 119, 109494. [Google Scholar] [CrossRef]
  11. Zhang, C.; Su, H.; Baeyens, J.; Tan, T. Reviewing the anaerobic digestion of food waste for biogas production. Renew. Sustain. Energy Rev. 2014, 38, 383–392. [Google Scholar] [CrossRef]
  12. Kim, S.-H.; Han, S.-K.; Shin, H.-S. Feasibility of biohydrogen production by anaerobic co-digestion of food waste and sewage sludge. Int. J. Hydrog. Energy 2004, 29, 1607–1616. [Google Scholar] [CrossRef]
  13. Yong, Z.; Dong, Y.; Zhang, X.; Tan, T. Anaerobic co-digestion of food waste and straw for biogas production. Renew. Energy 2015, 78, 527–530. [Google Scholar] [CrossRef]
  14. Qiang, H.; Lang, D.-L.; Li, Y.-Y. High-solid mesophilic methane fermentation of food waste with an emphasis on Iron, Cobalt, and Nickel requirements. Bioresour. Technol. 2012, 103, 21–27. [Google Scholar] [CrossRef]
  15. Banks, C.J.; Zhang, Y.; Jiang, Y.; Heaven, S. Trace element requirements for stable food waste digestion at elevated ammonia concentrations. Bioresour. Technol. 2012, 104, 127–135. [Google Scholar] [CrossRef] [Green Version]
  16. Grimberg, S.; Hilderbrandt, D.; Kinnunen, M.; Rogers, S. Anaerobic digestion of food waste through the operation of a mesophilic two-phase pilot scale digester–Assessment of variable loadings on system performance. Bioresour. Technol. 2015, 178, 226–229. [Google Scholar] [CrossRef]
  17. Zhang, J.; Loh, K.-C.; Lee, J.; Wang, C.-H.; Dai, Y.; Tong, Y.W. Three-stage anaerobic co-digestion of food waste and horse manure. Sci. Rep. 2017, 7, 1–10. [Google Scholar] [CrossRef]
  18. Zhang, J.; Loh, K.-C.; Li, W.; Lim, J.W.; Dai, Y.; Tong, Y.W. Three-stage anaerobic digester for food waste. Appl. Energy 2017, 194, 287–295. [Google Scholar] [CrossRef]
  19. Ryue, J.; Lin, L.; Kakar, F.L.; Elbeshbishy, E.; Al-Mamun, A.; Dhar, B.R. A critical review of conventional and emerging methods for improving process stability in thermophilic anaerobic digestion. Energy Sustain. Dev. 2020, 54, 72–84. [Google Scholar] [CrossRef]
  20. Cerrillo, M.; Viñas, M.; Bonmatí, A. Overcoming organic and nitrogen overload in thermophilic anaerobic digestion of pig slurry by coupling a microbial electrolysis cell. Bioresour. Technol. 2016, 216, 362–372. [Google Scholar] [CrossRef]
  21. Marone, A.; Carmona-Martínez, A.; Sire, Y.; Meudec, E.; Steyer, J.-P.; Bernet, N.; Trably, E. Bioelectrochemical treatment of table olive brine processing wastewater for biogas production and phenolic compounds removal. Water Res. 2016, 100, 316–325. [Google Scholar] [CrossRef]
  22. Pommier, S.; Chenu, D.; Quintard, M.; Lefebvre, X. A logistic model for the prediction of the influence of water on the solid waste methanization in landfills. Biotechnol. Bioeng. 2007, 97, 473–482. [Google Scholar] [CrossRef]
  23. Motte, J.-C.; Trably, E.; Escudié, R.; Hamelin, J.; Steyer, J.-P.; Bernet, N.; Delgenes, J.-P.; Dumas, C. Total solids content: A key parameter of metabolic pathways in dry anaerobic digestion. Biotechnol. Biofuels 2013, 6, 164. [Google Scholar] [CrossRef] [Green Version]
  24. Xu, F.; Wang, Z.-W.; Tang, L.; Li, Y. A mass diffusion-based interpretation of the effect of total solids content on solid-state anaerobic digestion of cellulosic biomass. Bioresour. Technol. 2014, 167, 178–185. [Google Scholar] [CrossRef] [PubMed]
  25. Bollon, J.; Le-Hyaric, R.; Benbelkacem, H.; Buffière, P. Development of a kinetic model for anaerobic dry digestion processes: Focus on acetate degradation and moisture content. Biochem. Eng. J. 2011, 56, 212–218. [Google Scholar] [CrossRef]
  26. Nakajima, S.; Shimizu, N.; Ishiwata, H.; Ito, T. The start-up of thermophilic anaerobic digestion of municipal solid waste. J. Jpn. Inst. Energy 2016, 95, 645–647. [Google Scholar] [CrossRef] [Green Version]
  27. IEA Bioenergy. Nutrient Recovery by Biogas Digestate Processing. Available online: https://www.ieabioenergy.com/blog/publications/nutrient-recovery-by-biogas-digestate-processing/ (accessed on 7 January 2021).
  28. Kim, D.-Y.; Yang, J.; Shinde, S.S.; Mistry, B.M.; Kim, D.-Y.; Sung, J.-S.; Kadam, A.A. Paper waste extracted α-cellulose fibers super-magnetized and chitosan-functionalized for covalent laccase immobilization. Bioresour. Technol. 2018, 261, 420–427. [Google Scholar] [CrossRef]
  29. Byadgi, S.A.; Kalburgi, P. Production of bioethanol from waste newspaper. Procedia Environ. Sci. 2016, 35, 555–562. [Google Scholar] [CrossRef]
  30. Liao, X.; Li, H.; Cheng, Y.; Chen, N.; Li, C.; Yang, Y. Process performance of high-solids batch anaerobic digestion of sewage sludge. Environ. Technol. 2014, 35, 2652–2659. [Google Scholar] [CrossRef] [PubMed]
  31. Mshandete, A.; Murto, M.; Kivaisi, A.; Rubindamayugi, M.; Mattiasson, B. Influence of recirculation flow rate on the performance of anaerobic packed-bed bioreactors treating potato-waste leachate. Environ. Technol. 2004, 25, 929–936. [Google Scholar] [CrossRef]
  32. Nagao, N.; Tajima, N.; Kawai, M.; Niwa, C.; Kurosawa, N.; Matsuyama, T.; Yusoff, F.M.; Toda, T. Maximum organic loading rate for the single-stage wet anaerobic digestion of food waste. Bioresour. Technol. 2012, 118, 210–218. [Google Scholar] [CrossRef]
  33. Wu, D.; Lü, F.; Shao, L.; He, P. Effect of cycle digestion time and solid-liquid separation on digestate recirculated one-stage dry anaerobic digestion: Use of intact polar lipid analysis for microbes monitoring to enhance process evaluation. Renew. Energy 2017, 103, 38–48. [Google Scholar] [CrossRef]
  34. Zhong, W.; Zhang, Z.; Luo, Y.; Sun, S.; Qiao, W.; Xiao, M. Effect of biological pretreatments in enhancing corn straw biogas production. Bioresour. Technol. 2011, 102, 11177–11182. [Google Scholar] [CrossRef]
  35. Deepanraj, B.; Sivasubramanian, V.; Jayaraj, S. Experimental and kinetic study on anaerobic digestion of food waste: The effect of total solids and pH. J. Renew. Sustain. Energy 2015, 7, 063104. [Google Scholar] [CrossRef]
Figure 1. Anaerobic digestion process flow chart.
Processes 09 00197 g001
Figure 2. Materials charging plan and operating factors of this study.
Processes 09 00197 g002
Figure 3. Linear relationship between mass reduction rate and organic loading rate based on previous data.
Processes 09 00197 g003
Figure 4. Weekly cumulative biogas production and methane concentration.
Processes 09 00197 g004
Figure 5. Total solids (TS) content of digestate during anaerobic digestion process.
Processes 09 00197 g005
Figure 6. Volatile fatty acid (VFA), pH value (a) and total ammonia nitrogen (TAN) and free ammonia contents (b) of digestate during anaerobic digestion process.
Processes 09 00197 g006
Figure 7. Weekly mass reduction rate and substrate-specific methane yield (SMY) in the anaerobic digestion (AD) process.
Processes 09 00197 g007
Table 1. Characteristics of the raw materials used in the study (FW = food waste, PW = paper waste, TS = total solid content, VS = volatile solid content, VFA = volatile fatty acid content, TAN = total ammonia nitrogen content, FA= free ammonia, C = carbon content, N = nitrogen content, w.b. = wet basis, d.b. = dry basis, nd = not determined).
TS (%w.b.)VS (%w.b.)VFA (mg/L)TAN (mg/L)C (%d.b.)N (%d.b.)
Inoculum3.53 ± 0.032.51 ± 0.042.22 × 103 ± 64.112.1 × 103 ± 60.1ndnd
FW19.7 ± 0.1717.5 ± 0.16ndnd30.03.00
PW94.9 ± 0.0582.0 ± 0.05ndnd38.40.00
Publisher’s Note: MDPI stays neutral with regard to jurisdictional claims in published maps and institutional affiliations.

