Article

Construction of an Artificial Cell Capable of Protein Expression at Low Temperatures Using a Cell Extract Derived from Pseudomonas fluorescens

1
Division of Mechanophysics, Graduate School of Science and Technology, Kyoto Institute of Technology, Matsugasaki, Sakyo-ku, Kyoto 606-8585, Japan
2
Faculty of Mechanical Engineering, Kyoto Institute of Technology, Matsugasaki, Sakyo-ku, Kyoto 606-8585, Japan
*
Author to whom correspondence should be addressed.
Processes 2021, 9(2), 212; https://doi.org/10.3390/pr9020212
Submission received: 30 December 2020 / Revised: 17 January 2021 / Accepted: 21 January 2021 / Published: 24 January 2021
(This article belongs to the Special Issue Study on Bio-Thermofluid Dynamics)

Abstract

:
A liposome-based artificial cell (LBAC) consists of a liposome encapsulating a cell-free protein expression system (CFPES) and protein-encoding DNA. It is surrounded by a lipid bilayer membrane and synthesizes proteins that resemble actual cells. Hence, they have been one of the most studied artificial cells. According to recent studies, they have been able to sense bio-functional molecules by synthesizing fluorescent proteins in response to target molecules. Therefore, they are expected to be used as biosensors. However, previously reported LBACs encapsulated the CFPES derived from Escherichia coli, resulting in the most productive protein expression at 20–40 °C. To broaden the range of their working temperatures to lower temperatures, in this study, we constructed LBACs using a CFPES derived from Pseudomonas fluorescens that grows at a temperature range of 4 °C to 30 °C. We then demonstrated that the constructed LBAC expressed proteins at 8 °C and that, the protein expression capability of the LBAC derived from P. fluorescens was four-fold higher than that derived from E. coli at 8 °C. This study will pave the way for the development of artificial cell-based biosensors that work in cold environments or for the synthesis of heat-labile proteins in LBACs.

1. Introduction

An artificial cell is a cell mimic that acts like a natural cell. There are several types of artificial cells. Among them, liposome-based artificial cells (LBACs) have been one of the most commonly studied artificial cells. An LBAC consists of a liposome (small capsule made from a lipid bilayer membrane), a cell-free protein expression system (CFPES), and DNA(s) encoding proteins of interest [1]. They express proteins which perform the designated functions. For example, some LBACs can sense signals such as a bacterial quorum sensing molecule [2,3], a light with a specific wavelength [4], and others [5,6,7]. Furthermore, another type of LBAC was able to communicate with one another by encoding proteins for communication [8,9].
Previous studies on LBACs have used cell extracts derived from Escherichia coli to prepare CFPES [2,3,4,5,6,7,8,9]. Thus, the operating temperatures of these LBACs have been limited to the optimal growth temperature range of E. coli, which is approximately 20–40 °C [10]. However, for using LBACs at temperatures lower than 20 °C, such as for a sensor, LBACs that can operate at lower temperatures are required. In this study, we constructed an LBAC capable of protein expression at temperatures as low as to 8 °C.
To achieve this, we first prepared a CFPES that functions at low temperatures using the cell extract from a cold-adapted bacterium, Pseudomonas fluorescens, as it grows at 4–30 °C [11]. However, optimization of the procedures for preparing the CFPES derived from P. fluorescens has not been performed to date, which we have reported in this study. The CFPES derived from P. fluorescens was then compared with that derived from E. coli in terms of protein expression capability at various temperatures, including at temperatures as low as 16 °C and 8 °C. Finally, we encapsulated the optimized CFPES derived from P. fluorescens in the liposome to obtain a LBAC. We demonstrated that the constructed LBAC expressed proteins at 8 °C. The protein expression capability of the LBAC derived from P. fluorescens was compared with that derived from E. coli to indicate that it was more suitable for applications at low temperatures than that derived from E. coli.

2. Materials and Methods

2.1. Preparation of CFPES

2.1.1. CFPES Derived from P. fluorescens

The CFPES derived from P. fluorescens consisted of the cell extracts from P. fluorescens, T7 RNA polymerase, tRNA, and nutrients called Premix. The procedures used were from literature [11] with modifications.
All procedures were performed on ice unless otherwise stated. P. fluorescens (Pseudomonas fluorescens Migula, #13525; ATCC, Manassas, VA, USA) was incubated in 4 mL of 2 × Yeast Extract Tryptone (2 × YT) medium (Sigma-Aldrich, St. Louis, MO, USA) in a 15 mL culture tube for 1 d at 23 °C using an incubator shaker (Innova 4000; New Brunswick Scientific, Enfield, CT, USA). Thereafter, 1 mL of the cell culture was added to 100 mL of 2 × YT medium in a 500 mL Erlenmeyer flask and incubated at 23 °C. The cell culture was harvested after a pre-determined period of incubation (6–12 h) and centrifuged at 4000 rpm at 4 °C for 15 min using a centrifuge (Model 2800; Kubota, Tokyo, Japan). The supernatant was discarded. A total of 6mL of Buffer A (10 mM Tris-acetate (pH 7.4), 1 mM (+/-)-dithiothreitol (DTT; Fujifilm Wako Pure Chemical, Osaka, Japan), 14 mM magnesium acetate (Fujifilm Wako Pure Chemical), 60 mM potassium acetate (Fujifilm Wako Pure Chemical), and 0.5 µL/mL 2-mercaptoethanol (Sigma-Aldrich)) was added to resuspend the cell pellet. The suspension was centrifuged again under the same conditions, and the supernatant was discarded. Next, 3 mL of Buffer B (10 mM Tris-acetate (pH 7.4), 1 mM DTT, 14 mM magnesium acetate, 60 mM potassium acetate, and 0.067 μL/mL 2-mercaptoethanol) was added to resuspend the cell pellet. The resuspended solution was centrifuged under the same conditions as described above. After discarding the supernatant, 1.27 mL of Buffer C (10 mM Tris-acetate (pH 7.4), 1 mM DTT, 14 mM magnesium acetate, and 60 mM potassium acetate) was added to 1 g of the cell pellet to resuspend it. The resuspended cell solution was poured into a tube for bead-beating (bacteria-lysing CK01; MS Equipment, Osaka, Japan). Before bead-beating, the tube was vortexed using a vortex mixer (Vortex-Genie 2; Scientific Industries, Bohemia, NY, USA) to mix the cell solution and the beads well for efficient cell lysis. The cells were then lysed in a bead-beater (Precellys 24; Bertin Technologies, Paris, France) for 10 s × 2 at 6800 rpm at 4 °C. After bead-beating, the tube was centrifuged at 4 °C and 20,000× g for 30 min. The supernatant was transferred into a clean tube. Next, 300 μL of PI mixture (0.3 M Tris-acetate (pH 7.4), 4.4 mM DTT, 9.4 mM magnesium acetate, 13.2 mM adenosine triphosphate (ATP; Sigma-Aldrich), 84 mM phosphoenolpyruvate (Sigma-Aldrich), 0.044 mM 20 amino acids (Fujifilm Wako Pure Chemical), and 13 U/mL pyruvate kinase (Sigma-Aldrich)) was added to the supernatant, and the suspension was incubated in a shaker incubator at 23 °C for 90 min. The solution was then dialyzed twice for 1 h against 150 mL of Buffer C using a dialysis membrane (Float-A-Lyzer G2, MWCO: 8–10 kD; Repligen, Boston, MA, USA). After dialysis, the solution was centrifuged at 4000× g for 10 min, and the supernatant was used as the cell extract of P. fluorescens. The cell extract was stored at −80 °C until use.
Premix was prepared so that the components were magnesium acetate (concentration varies, therefore, this is denoted as a concentration of Mg in each experiment), polyethylene glycol 6000 (PEG; Sigma-Aldrich; concentration varies, therefore, denoted as a concentration of PEG in each experiment), 30 mM lithium potassium acetyl phosphate (Sigma-Aldrich), 56.5 mM Tris-acetate (pH 7.4), 1.25 mM ATP, 0.85 mM guanosine triphosphate (GTP; sodium salt; Sigma-Aldrich), 0.85 mM cytidine triphosphate (sodium salt; CTP; Funakoshi), 0.85 mM uridine triphosphate (UTP; sodium salt; Fujifilm Wako Pure Chemical), 40 mM creatine phosphate (Sigma-Aldrich), 0.16 mg/mL creatine kinase (Boeringer Manheim, Stuttgart, Germany), 20 amino acids (0.5 mM each; Wako Pure Chemical), 0.04 mg/mL N5-formyl-5, 6, 8-tetrahydrofolic acid (Folinic acid calcium salt hydrate; Sigma-Aldrich), potassium acetate (Concentration varies, therefore, denoted as a concentration of K in each experiment), and 36 mM ammonium acetate (Fujifilm Wako Pure Chemical).
For protein synthesis in 10 μL of the CFPES, 4.0 μL of Premix, 3.6 μL of the cell extract from P. fluorescens, 1.0 μL of DNA encoding a protein of interest, 1.0 μL of 50 U/μL T7 RNA polymerase (Takara, Kusatsu, Shiga, Japan), and 0.4 μL of 1670 ng/μL tRNA (tRNA from E. coli Mre 600; Sigma-Aldrich) were mixed.

2.1.2. CFPES Derived from E. coli

Two types of CFPES derived from E. coli were used in this study. One is a commercially available CFPES (S30 T7 High-Yield Protein Expression System; Promega, Madison, WI, USA). The other is a CFPES obtained from the cell extract of the LacZ gene-deficient BL21-Gold (DE3) strain (#99247; Addgene, Watertown, MA, USA). This strain does not have the LacZ gene encoding β-galactosidase; therefore, it can be used for experiments using an exogenous β-galactosidase.
The CFPES derived from the LacZ gene-deficient BL21-Gold (DE3) strain consisted of the cell extract from the LacZ gene-deficient BL21-Gold (DE3) strain, T7 RNA polymerase, tRNA, and Premix.
The method for preparing the cell extract derived from the LacZ gene-deficient BL21-Gold (DE3) strain is described below. The E. coli strain was incubated in 4 mL of LB medium (Sigma-Aldrich) in a 15 mL culture tube for 1 d at 37 °C in an incubator shaker. Thereafter, 1 mL of the cell culture was added to 100 mL of LB medium in a 500 mL Erlenmeyer flask and incubated at 37 °C. The cell culture was harvested after 5 h of incubation and centrifuged at 4 °C and 4000 rpm for 15 min using a centrifuge. The supernatant was discarded. A total of 6 mL of Buffer D (14 mM magnesium acetate, 60 mM potassium acetate, 50 mM Tris-acetate (pH 7.4), 50 μM 2-mercaptoethanol, 1 mM DTT) was added to resuspend the cell pellet. The suspension was centrifuged again under the same conditions, and the supernatant was discarded. Next, 3 mL of Buffer E (14 mM magnesium acetate, 60 mM potassium acetate, 50 mM Tris-acetate (pH 7.4), 1 mM DTT) was added to resuspend the cell pellet. The resuspended solution was then centrifuged under the same conditions. After discarding the supernatant, 1.27 mL of Buffer C was added to 1 g of the cell pellet to resuspend it. The resuspended cell solution was poured into a tube for bead-beating (bacteria-lysing CK01; MS Equipment). Before bead-beating, the tube was vortexed using a vortex mixer to mix the cell solution and beads well for efficient cell lysis. The cells were then lysed in a bead-beater (Precellys 24; Bertin Technologies) for 10 s × 2 at 6800 rpm. After bead-beating, the tube was centrifuged at 4 °C and 20,000× g for 10 min. After centrifugation, the supernatant had three layers. The top layer was transferred to another clean tube and incubated at 37 °C for 70 min. The solution was then centrifuged at 20,000× g for 10 min, and the supernatant was used as the cell extract of E. coli. The cell extract was stored at −80 °C until use.
For protein synthesis in 10 μL of the CFPES derived from the LacZ gene-deficient BL21-Gold (DE3) strain, 4.0 μL of Premix (S30 Premix Plus in S30 T7 High-Yield Protein Expression System purchased from Promega), 3.6 μL of the cell extract from the LacZ gene-deficient BL21-Gold (DE3) strain, 1.0 μL of DNA encoding a protein of interest, 1.0 μL of 50 U/μL T7 RNA polymerase (Takara), and 0.4 μL of 1670 ng/μL tRNA (tRNA from E. coli Mre 600; Sigma-Aldrich) were mixed.
For protein synthesis in 10 μL of the commercially available CFPES, 4.0 μL of Premix (S30 Premix Plus in S30 T7 High-Yield Protein Expression System), 3.6 μL of the E. coli cell extract in the S30 T7 High-Yield Protein Expression System, 1.0 μL of DNA encoding a protein of interest, and 1.4 μL of Deionized (DI) water were mixed.

2.2. Measurement of Total Protein Concentration in the Cell Extract

The Bradford method [12] was employed for measurement of a total protein concentration in the cell extract. For the Bradford assay, a protein quantification kit (Protein Quantification Kit-Rapid; Dojindo, Mashiki, Kumamoto, Japan) was used. The absorbance at 595 nm of 1.0 mL of the solution (Mixture of the cell extract and Coomassie Brilliant Blue (CBB) solution) placed in a 10 mm cuvette (As One, Osaka, Japan) was measured with a spectrophotometer (NanoDrop 2000c; Thermo Scientific, Waltham, MA, USA). Calibration curve was prepared using the bovine serum albumin (BSA) solutions with the designated concentrations. The total protein concentration of the cell extract was calculated based on the calibration curve.

2.3. Luciferase Assay of the CFPES

Protein expression in the CFPES was measured using a luciferase assay. The CFPES was incubated at a pre-determined temperature with a final concentration of 51.8 ng/μL DNA encoding Luciferase after T7 promoter (S30 T7 Control DNA in S30 T7 High-Yield Protein Expression System; Promega). The emission intensity of the CFPES was measured just after the addition of 1.0 μL of 20 μM coelenterazine-h (Fujifilm Wako Pure Chemical) to 10 μL of the CFPES with the DNA using a plate reader (Infinite F200; Tecan, Männedorf, Switzerland) at room temperature.

2.4. Formation of the LBACs

The liposome encapsulating the CFPES was constructed using the procedures reported in the literature [13] with some modifications. The procedures used in this study are as follows: 10 μL of the CFPES containing 2 M sucrose (Sigma-Aldrich) was vortexed for 30 s in 20 μL of mineral oil (Sigma-Aldrich) containing 10 mg/mL of L-α-phosphatidylcholine (Avanti Polar Lipids, Alabaster, AL, USA) and 10 mg/mL cholesterol (Sigma-Aldrich) to form water-in-oil microdroplets. At this time, lipid molecules self-assembled to form a lipid monolayer at the interface between the water and oil. The water-in-oil solution was then added to 44 μL of an outer solution in a 1.5 mL tube, forming another lipid monolayer at the interface between the outer solution and the oil of the water-in-oil solution. The outer solution consisted of Premix 16 μL, 2 M sucrose 9.4 μL, 4 M sodium chloride (Fujifilm Wako Pure Chemical) 4.5 μL, 2 M HEPES buffer (pH 7.7) (Sigma-Aldrich) 12.5 μL and DI water 1.6 μL. To prepare LBACs derived from P. fluorescens, Premix prepared for the CFPES derived from P. fluorescens was used. To prepare the LBACs derived from E. coli, S30 Premix Plus in the S30 T7 High-Yield Protein Expression System was used. The tube was then centrifuged at 5000× g at 4 °C for 1 min. This process forced the microdroplets to pass through the interface between the outer solution and the oil, forming liposomes encapsulating the CFPES. We denoted this as a LBAC.

2.5. Fluorescent Imaging of the LBACs

Protein expression in the LBACs was observed via fluorescence measurement. The fluorescence intensity was measured under a fluorescent microscope (Ti2-E; Nikon, Tokyo, Japan) after incubation for a pre-determined time with or without DNA encoding LacZ after T7 promoter. β-Galactosidase fluoresces when it reacts with fluorescein-di-β-galactopyranoside (FDG; Sigma-Aldrich); 30 μM FDG was added to the CFPES when forming the LBACs. A fluorescent filter unit for GFP (GFP HQ; Nikon) and a monochromic CCD camera (CoolSNAP HQ2; Teledyne Technologies, CA, USA) were used for fluorescence observation.
When observing for protein expression in the LBACs at 8 °C, the liposomes were incubated at 8 °C, except during observation using a microscope.
The obtained fluorescent images were analyzed using image processing software (ImageJ; NIH, Bethesda, MD, USA). The relative fluorescence intensity (∆F/F0) was calculated using Equation (1). In the equation, F0 represents the fluorescence intensity of the LBAC at the start of observation, F represents the fluorescence intensity of the artificial cell after the pre-determined time, and FBG represents the background fluorescence intensity.
Δ F / F 0 = F F 0 F BG F 0 F BG

3. Results

3.1. Optimization of the Cell Extract Derived from P. fluorescens for High-Yield Protein Expression

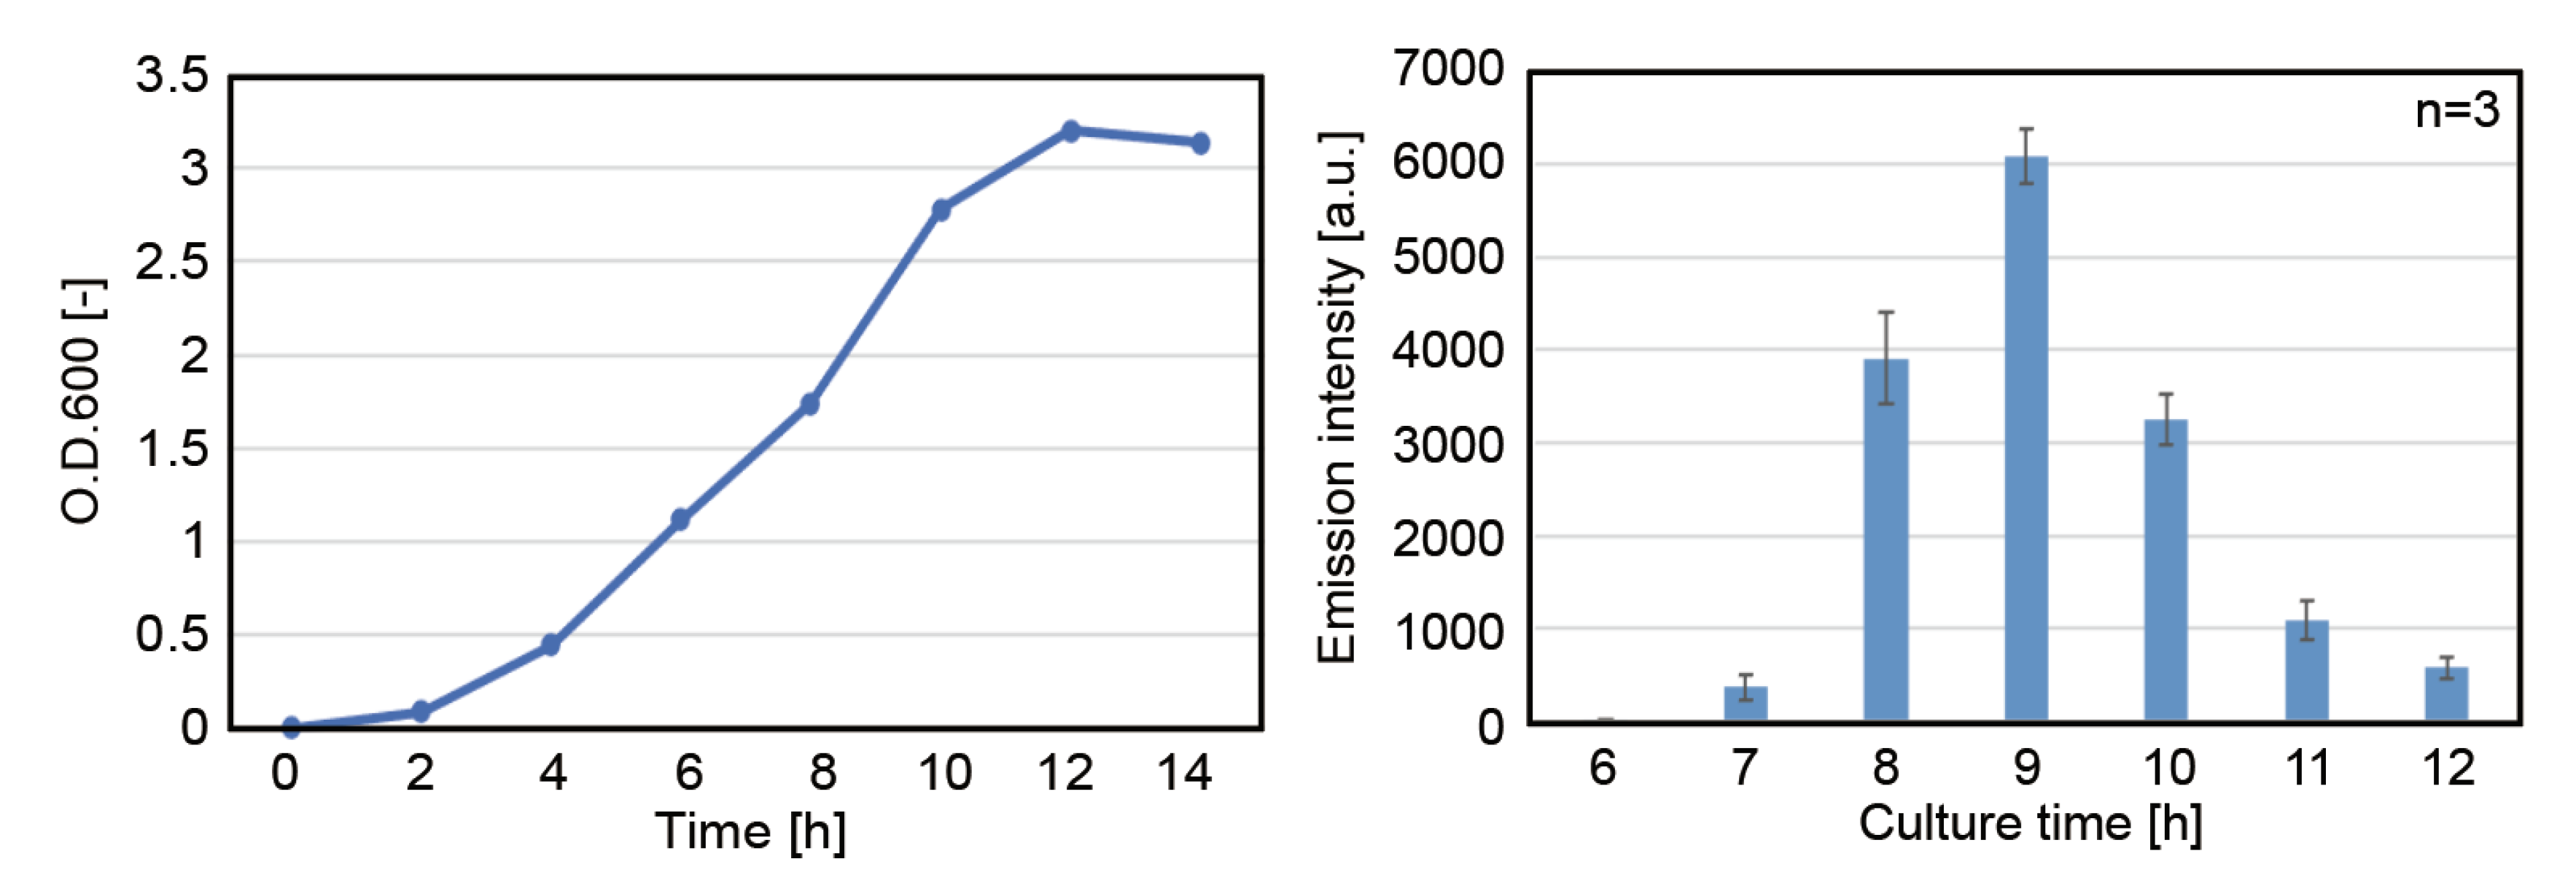
3.1.1. Effect of Incubation Period before Cell Harvest

We investigated the influence of incubation period before harvesting P. fluorescens cells on the protein expression activity of the CFPES made from the harvested cells. The reasons behind this are described below. In cell culture, it is known that culture time has a great influence on the activity of the cell extract [14]. There are four stages in cell culture: the induction phase, logarithmic phase, quiescent phase, and death phase. The healthiest and most active bacteria can be obtained during the logarithmic phase, when the bacteria begin to divide and grow logarithmically. However, the duration of the logarithmic period suitable for preparing cell extracts enabling high-yield protein expression depends on the bacterium, which has not yet been ascertained for P. fluorescens; thus, we investigated it.
Figure 1a shows the growth curve of P. fluorescens. From this growth curve, it was found that the logarithmic phase in the cell culture of P. fluorescens was approximately between 4 and 10 h after the start of culture. Next, we investigated the appropriate incubation period in the logarithmic phase to prepare the most active cell extract. Figure 1b shows the results of the luciferase assay of the CFPES obtained from P. fluorescens cells incubated for various periods. These results indicate that the emission intensity gradually increased as the incubation period increased until 9 h, and then decreased gradually after 10 h. Therefore, it was found that the optimal time for culturing P. fluorescens was 9 h after the start of culture. In the subsequent experiments, the cell extracts of P. fluorescens were prepared after harvesting the cells 9 h after the start of the culture.

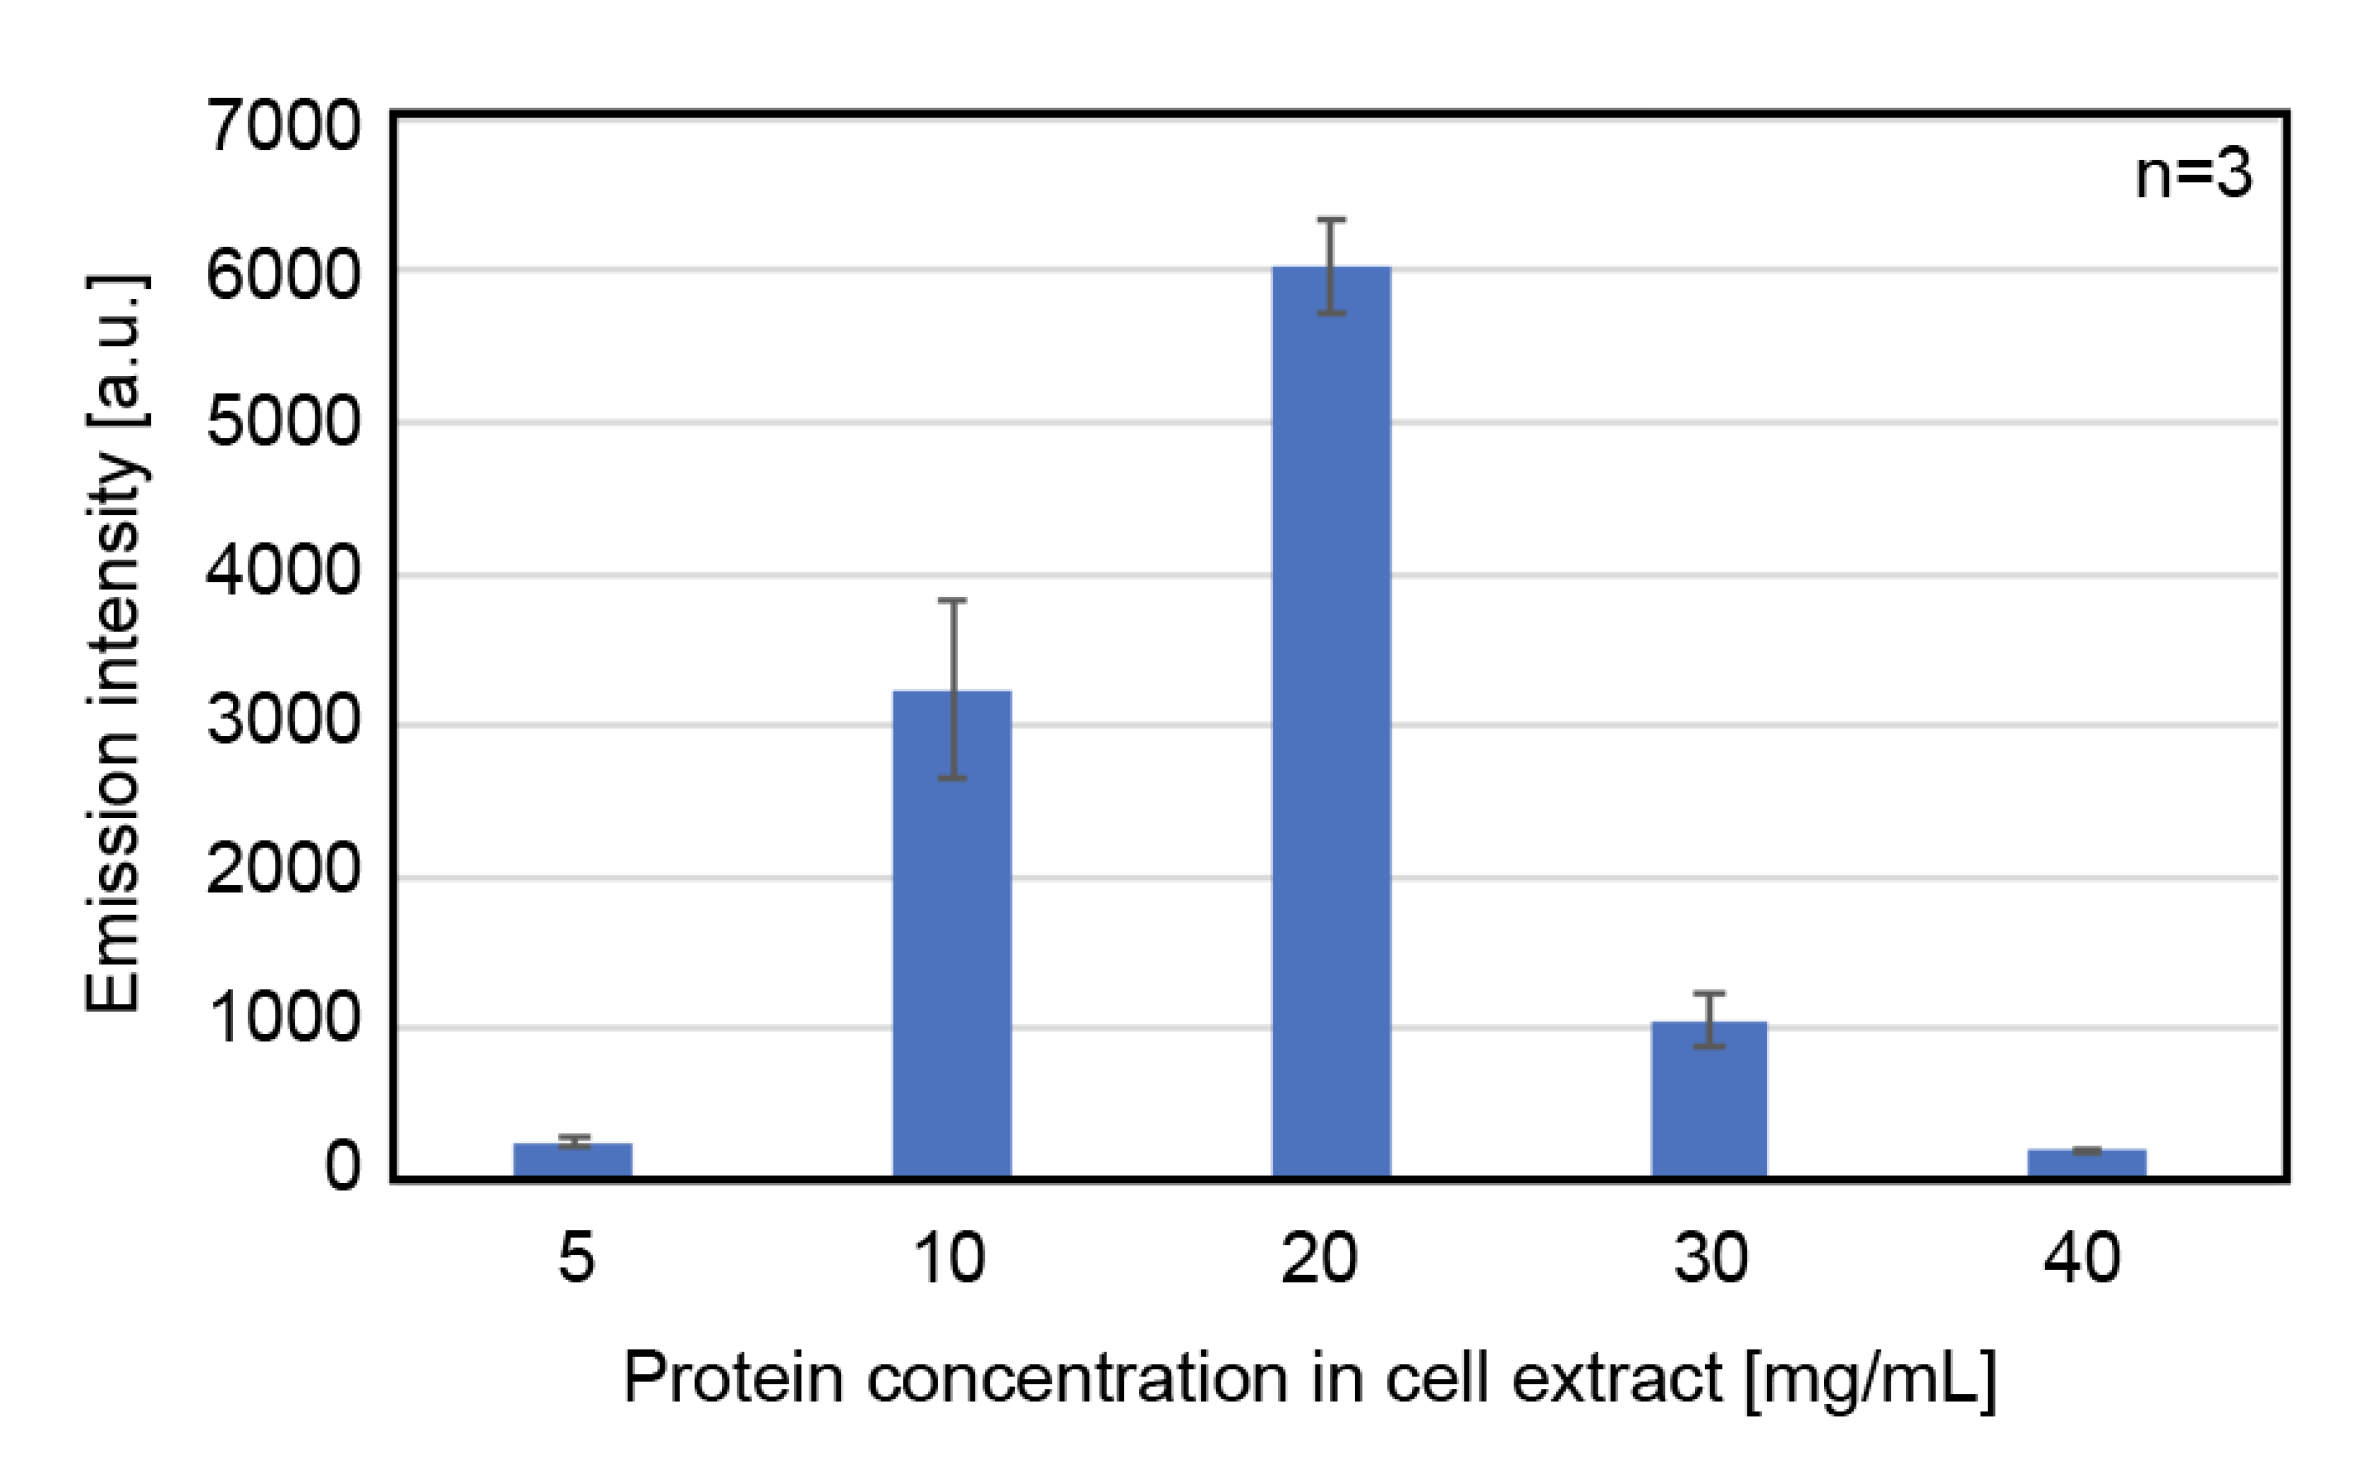
3.1.2. Effect of Total Protein Concentration of the Cell Extract on Protein Expression Activity

We investigated the influence of the total protein concentration of the cell extract of P. fluorescens on protein expression activity. It is known that the total protein concentration of the cell extract obtained from E. coli affects the protein expression efficiency [10]. The optimal total protein concentration in cell extracts derived from E. coli for high-yield protein expression has been reported. However, those derived from P. fluorescens have not been investigated to date. To investigate this, in this study, a cell extract with a low protein concentration was prepared in advance, and cell extracts with higher protein concentrations were prepared by condensing the initial cell extract using an ultrafiltration membrane (Amicon Ultra-0.5 mL, MWCO: 3 kDa; Merck-Millipore, Burlington, MA, USA). After that, luciferase was expressed in each of the CFPES obtained from the cell extracts with different total protein concentrations. Figure 2 shows the relationship between the total protein concentration in the cell extract and emission intensity. The graph indicates that the emission intensity increases as the total protein concentration in the cell extract increases to 20 mg/mL, and then decreases after 20 mg/mL. From this result, it was found that the optimal total protein concentration in the cell extract of P. fluorescens was 20 mg/mL. All cell extracts used in subsequent experiments had a total protein concentration of 20 mg/mL.

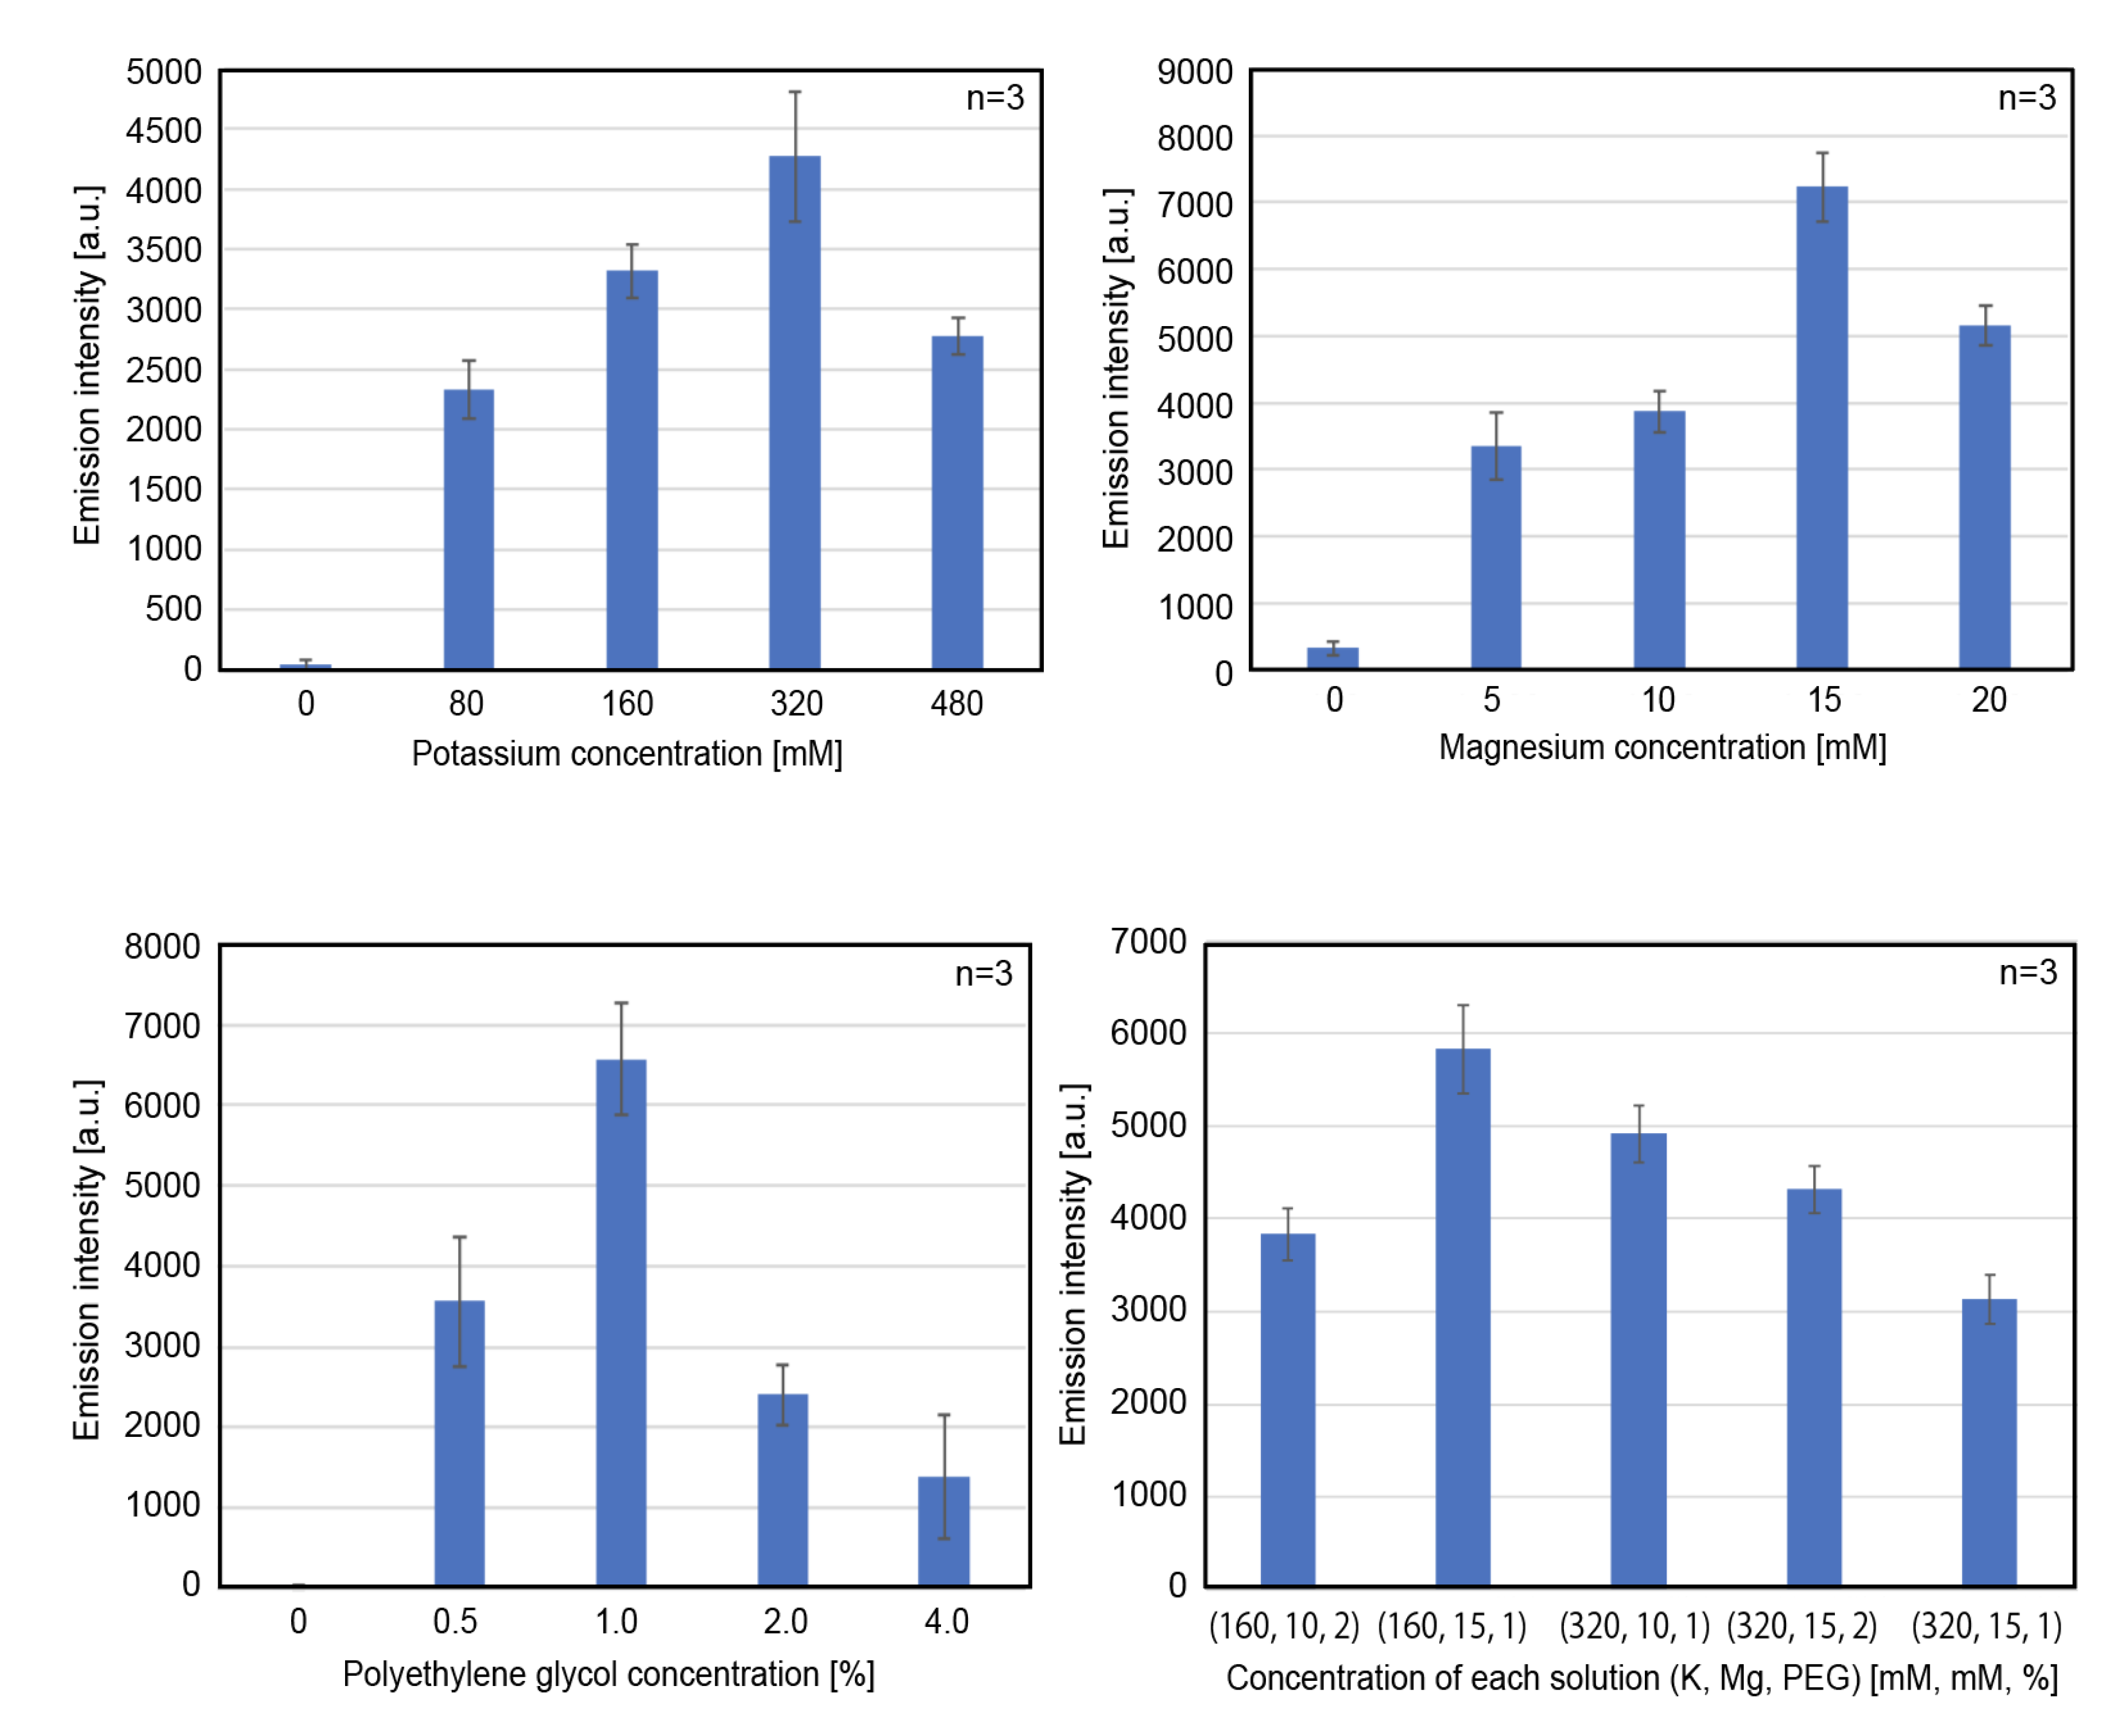
3.2. Optimization of Other Components in the CFPES for High-yield Protein Expression

In addition to the cell extract, protein expression using CFPES requires DNA and nutrients called Premix. Protein expression efficiency varies depending on the composition of Premix and the activity of the cell extract [15]. Therefore, we aimed to further improve protein expression efficiency by optimizing the Premix composition. We optimized the concentrations of magnesium, potassium, and PEG because these components are known to exert a considerable effect on protein expression in a CFPES derived from E. coli [16].
First, we conducted a luciferase assay of the cell-free protein expression with five different concentrations of potassium in Premix: 0, 80, 160, 320, and 480 mM (Figure 3a). From the result, it was observed that 320 mM potassium had the highest protein expression activity.
Second, we conducted the same experiment with five different concentrations of magnesium: 0, 5, 10, 15, and 20 mM (Figure 3b). From the result, it was observed that 15 mM magnesium had the highest protein expression activity.
Third, we conducted the same experiment with five different concentrations of PEG: 0 %, 0.5 %, 1.0 %, 2.0 %, and 4.0 % (Figure 3c). From the result, it was observed that 1.0 % PEG had the highest protein expression.
Finally, we conducted the same experiment with five different types of Premixes with the concentration of each component that resulted in the highest protein expression activity in each composition optimization to obtain the optimized Premix. Figure 3d shows the results of the luciferase assay of the CFPES with the five types of Premixes. The results indicate that the optimal concentrations of potassium, magnesium, and PEG in Premix were 160 mM, 15 mM, and 1.0 %, respectively. In addition, the emission intensity with this optimized Premix was approximately 1.5 times higher than that of the previously reported Premix (160 mM potassium, 10 mM magnesium, and 2.0 % PEG [11]). All the premixes used in the subsequent experiments were prepared with this optimized composition.

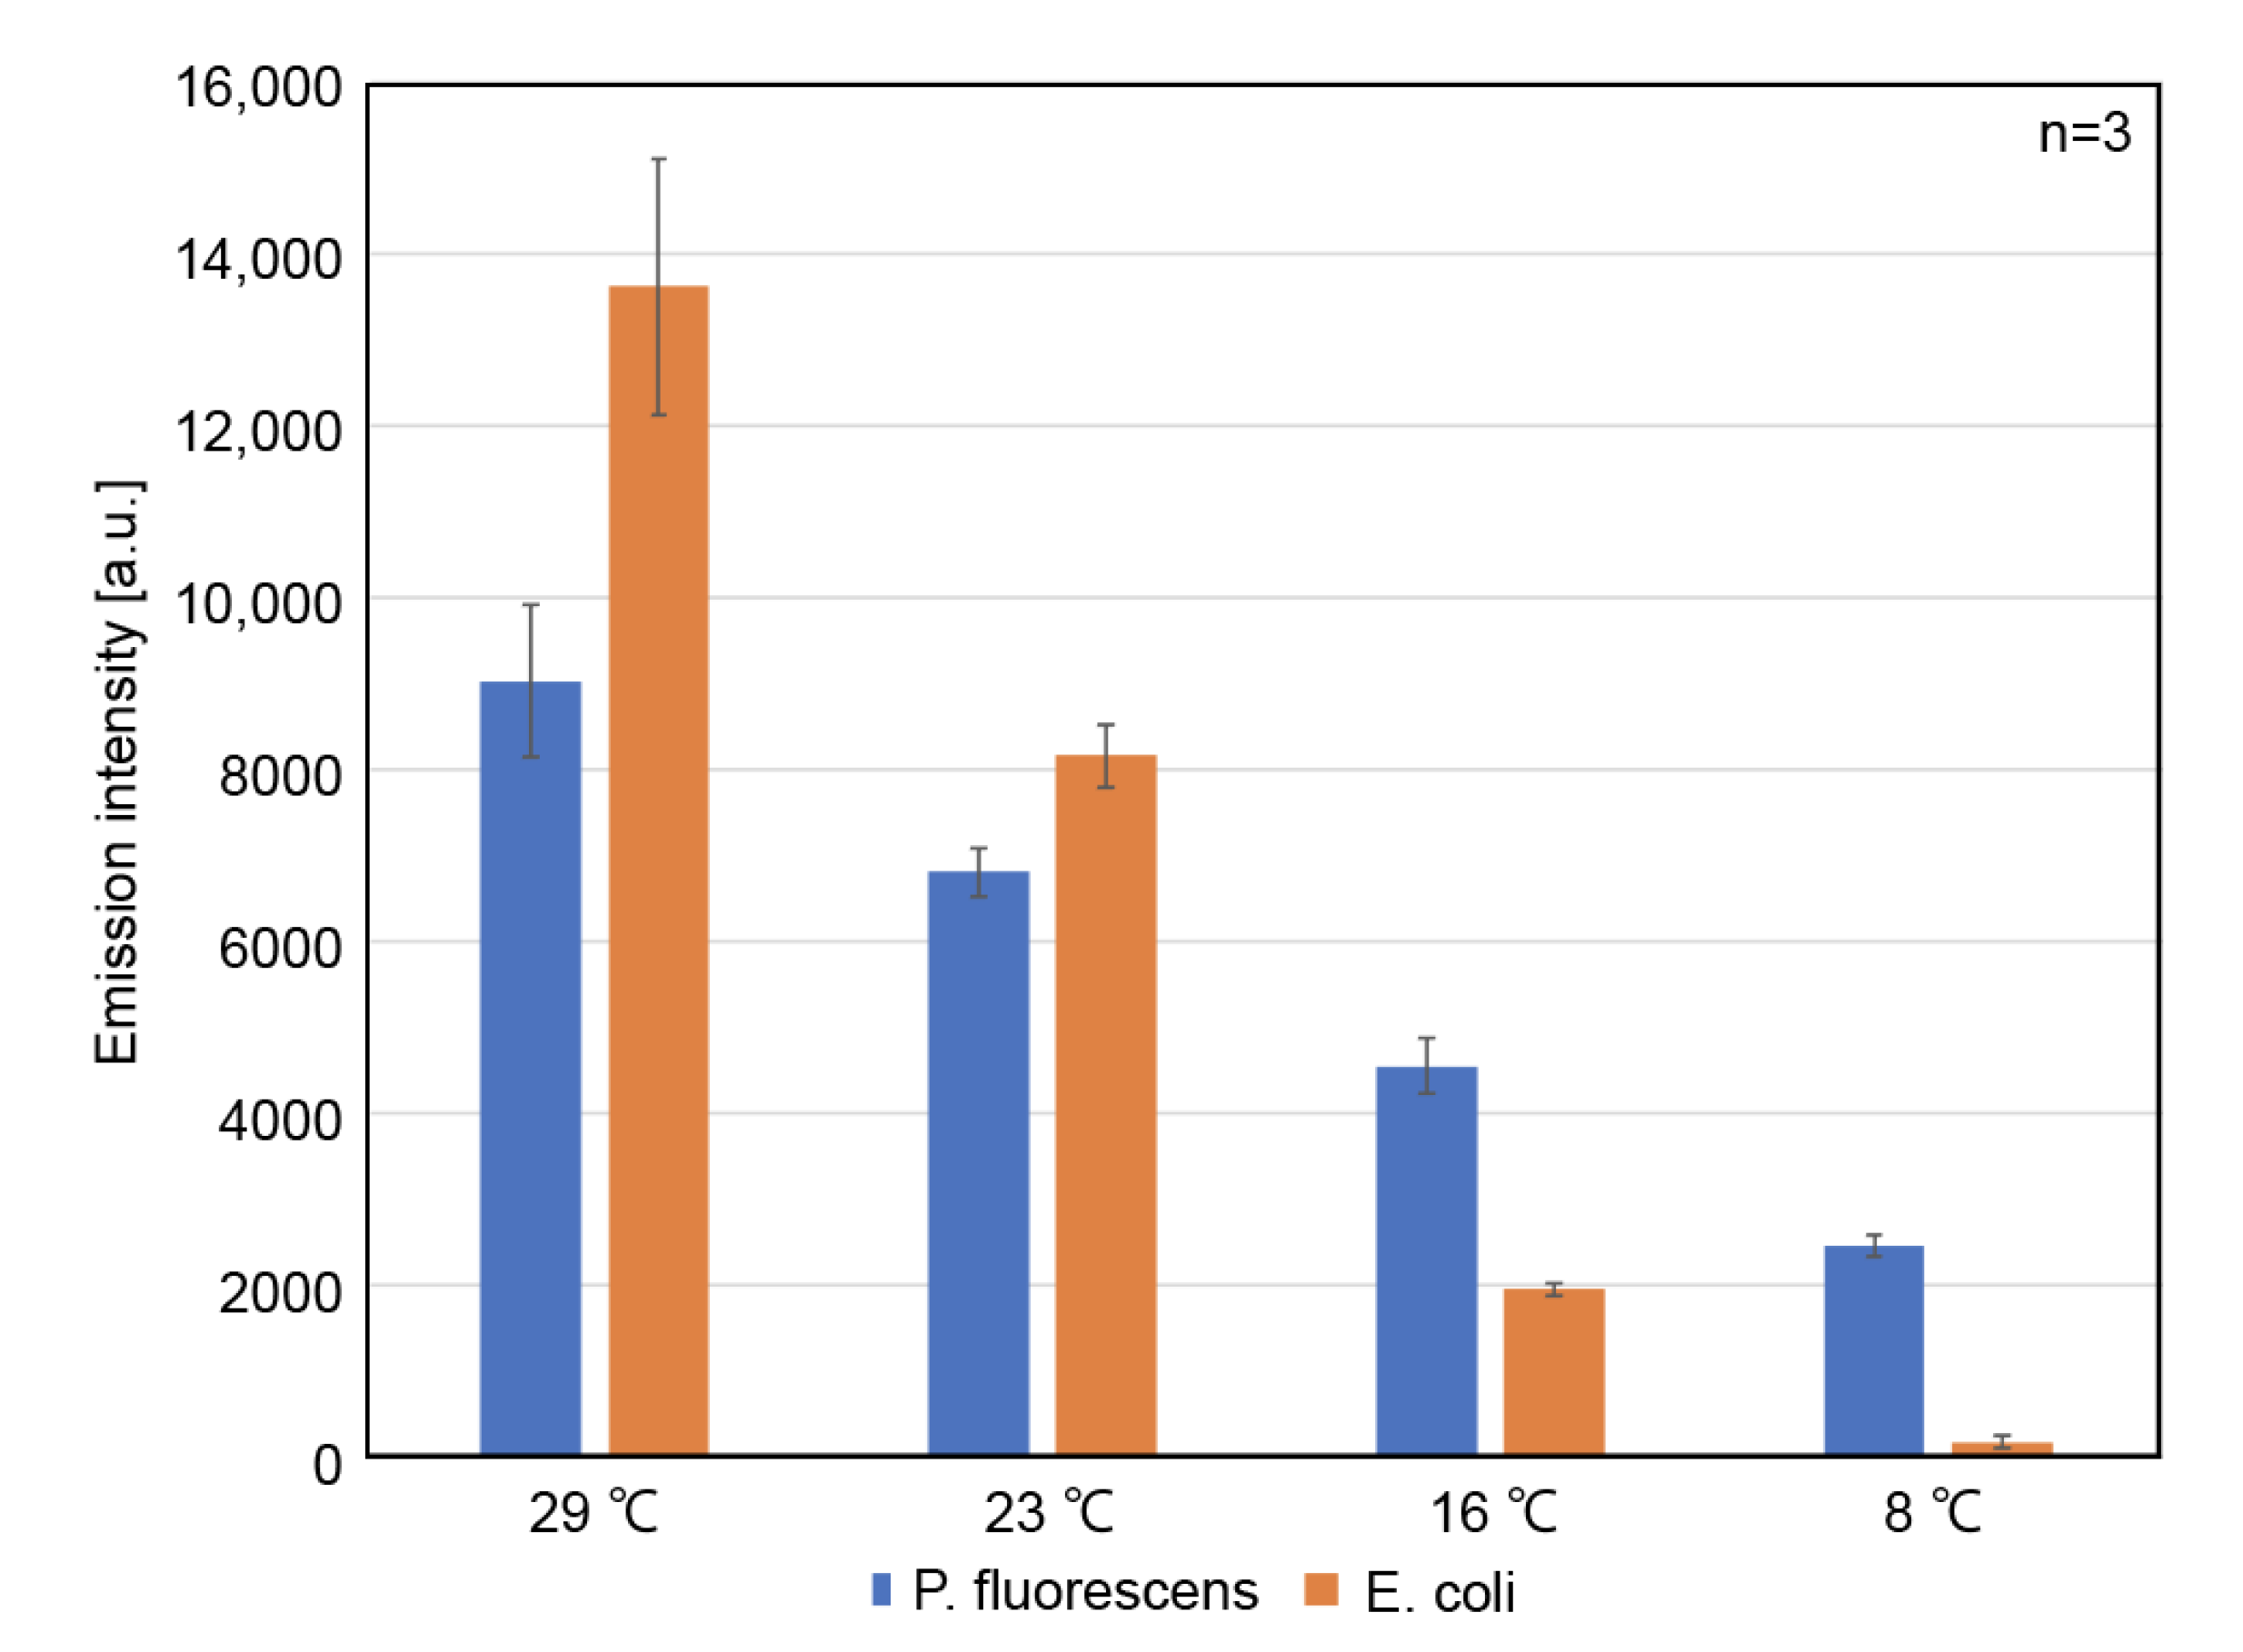
3.3. Protein Expression Capability of the Optimized CFPES at Various Temperatures

A luciferase assay was conducted for the CFPES obtained from the cell extract of P. fluorescens at 29 °C, 23 °C, 16 °C, and 8 °C. This was performed using the optimized CFPES derived from P. fluorescens. Simultaneously, the same experiment was conducted for the CFPES derived from E. coli to compare protein expression capabilities. The CFPES derived from E. coli in this experiment was commercially available one described in Section 2.1.2. Figure 4 indicates that the CFPES from E. coli had higher emission intensity than that from P. fluorescens at 29 °C and 23 °C, whereas the CFPES from P. fluorescens had a higher emission intensity than that from E. coli at 16 °C and 8 °C. In other words, the CFPES derived from P. fluorescens had 2.1-fold and 20-fold higher protein expression capability at 16 °C and 8 °C, respectively, than the one derived from E. coli. From this result, it can be concluded that the CFPES derived from P. fluorescens had a higher capability for protein expression than that from E. coli at a low temperature environment of 16 °C or lower.

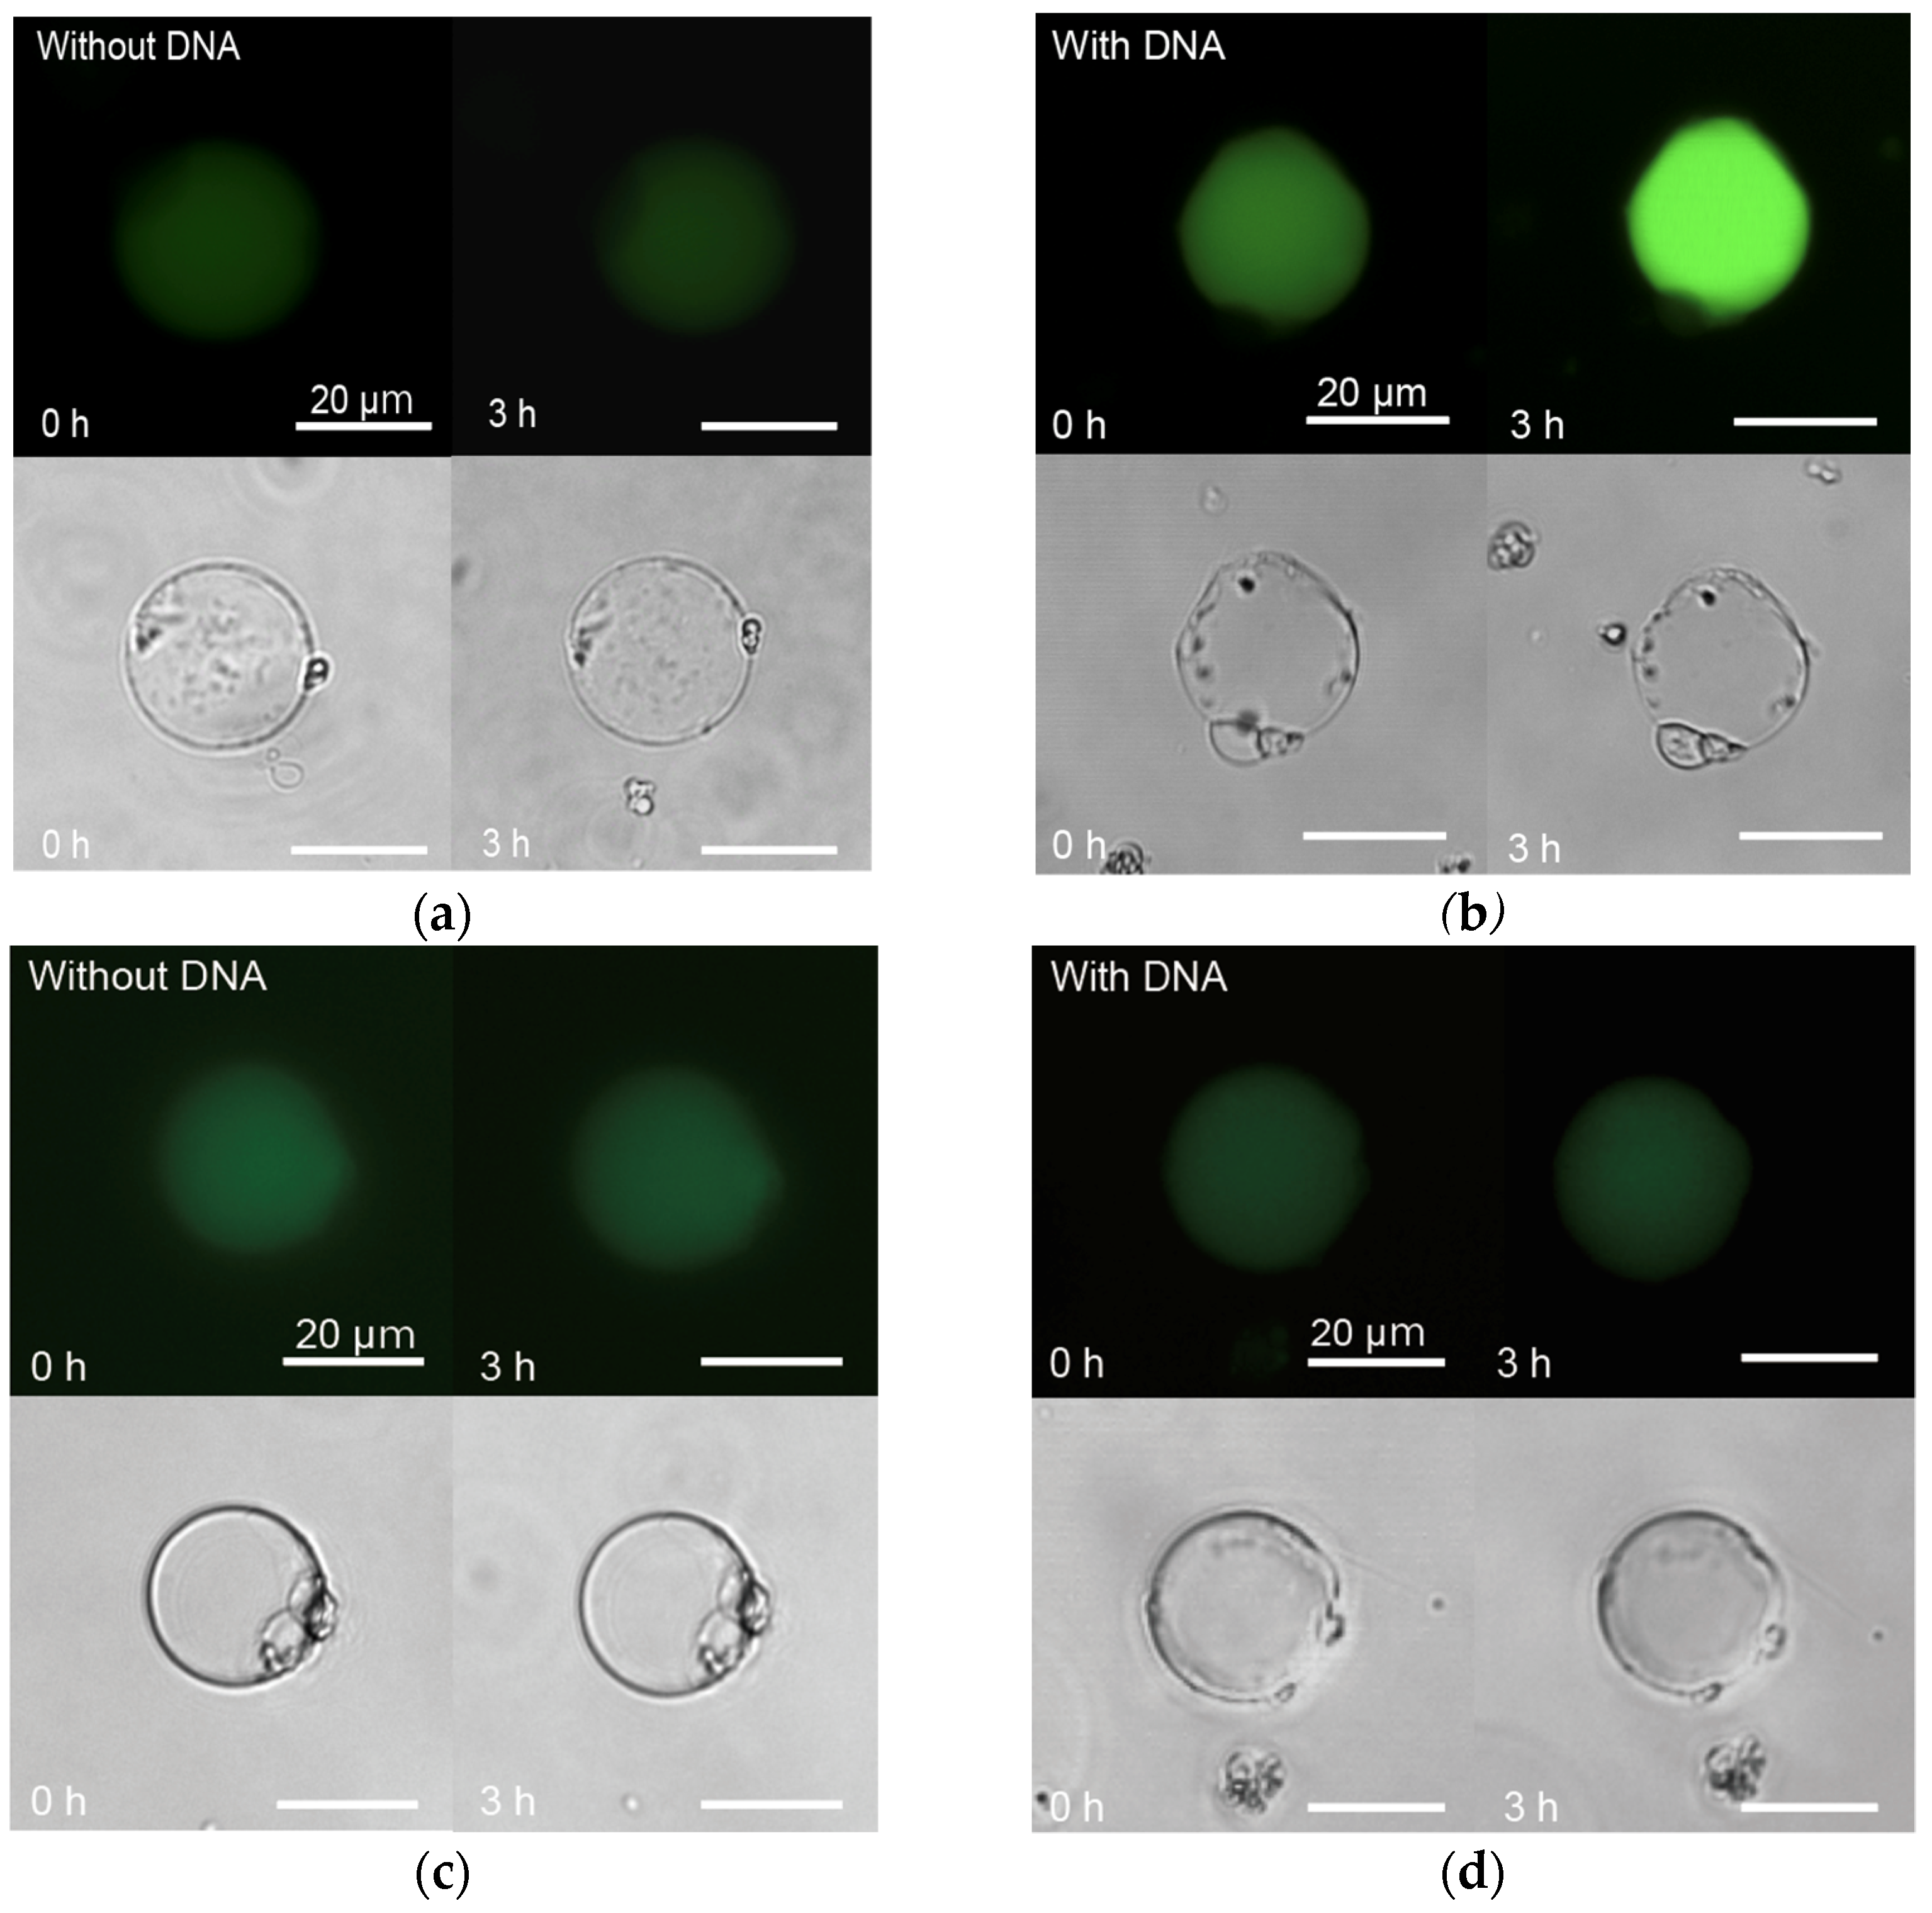
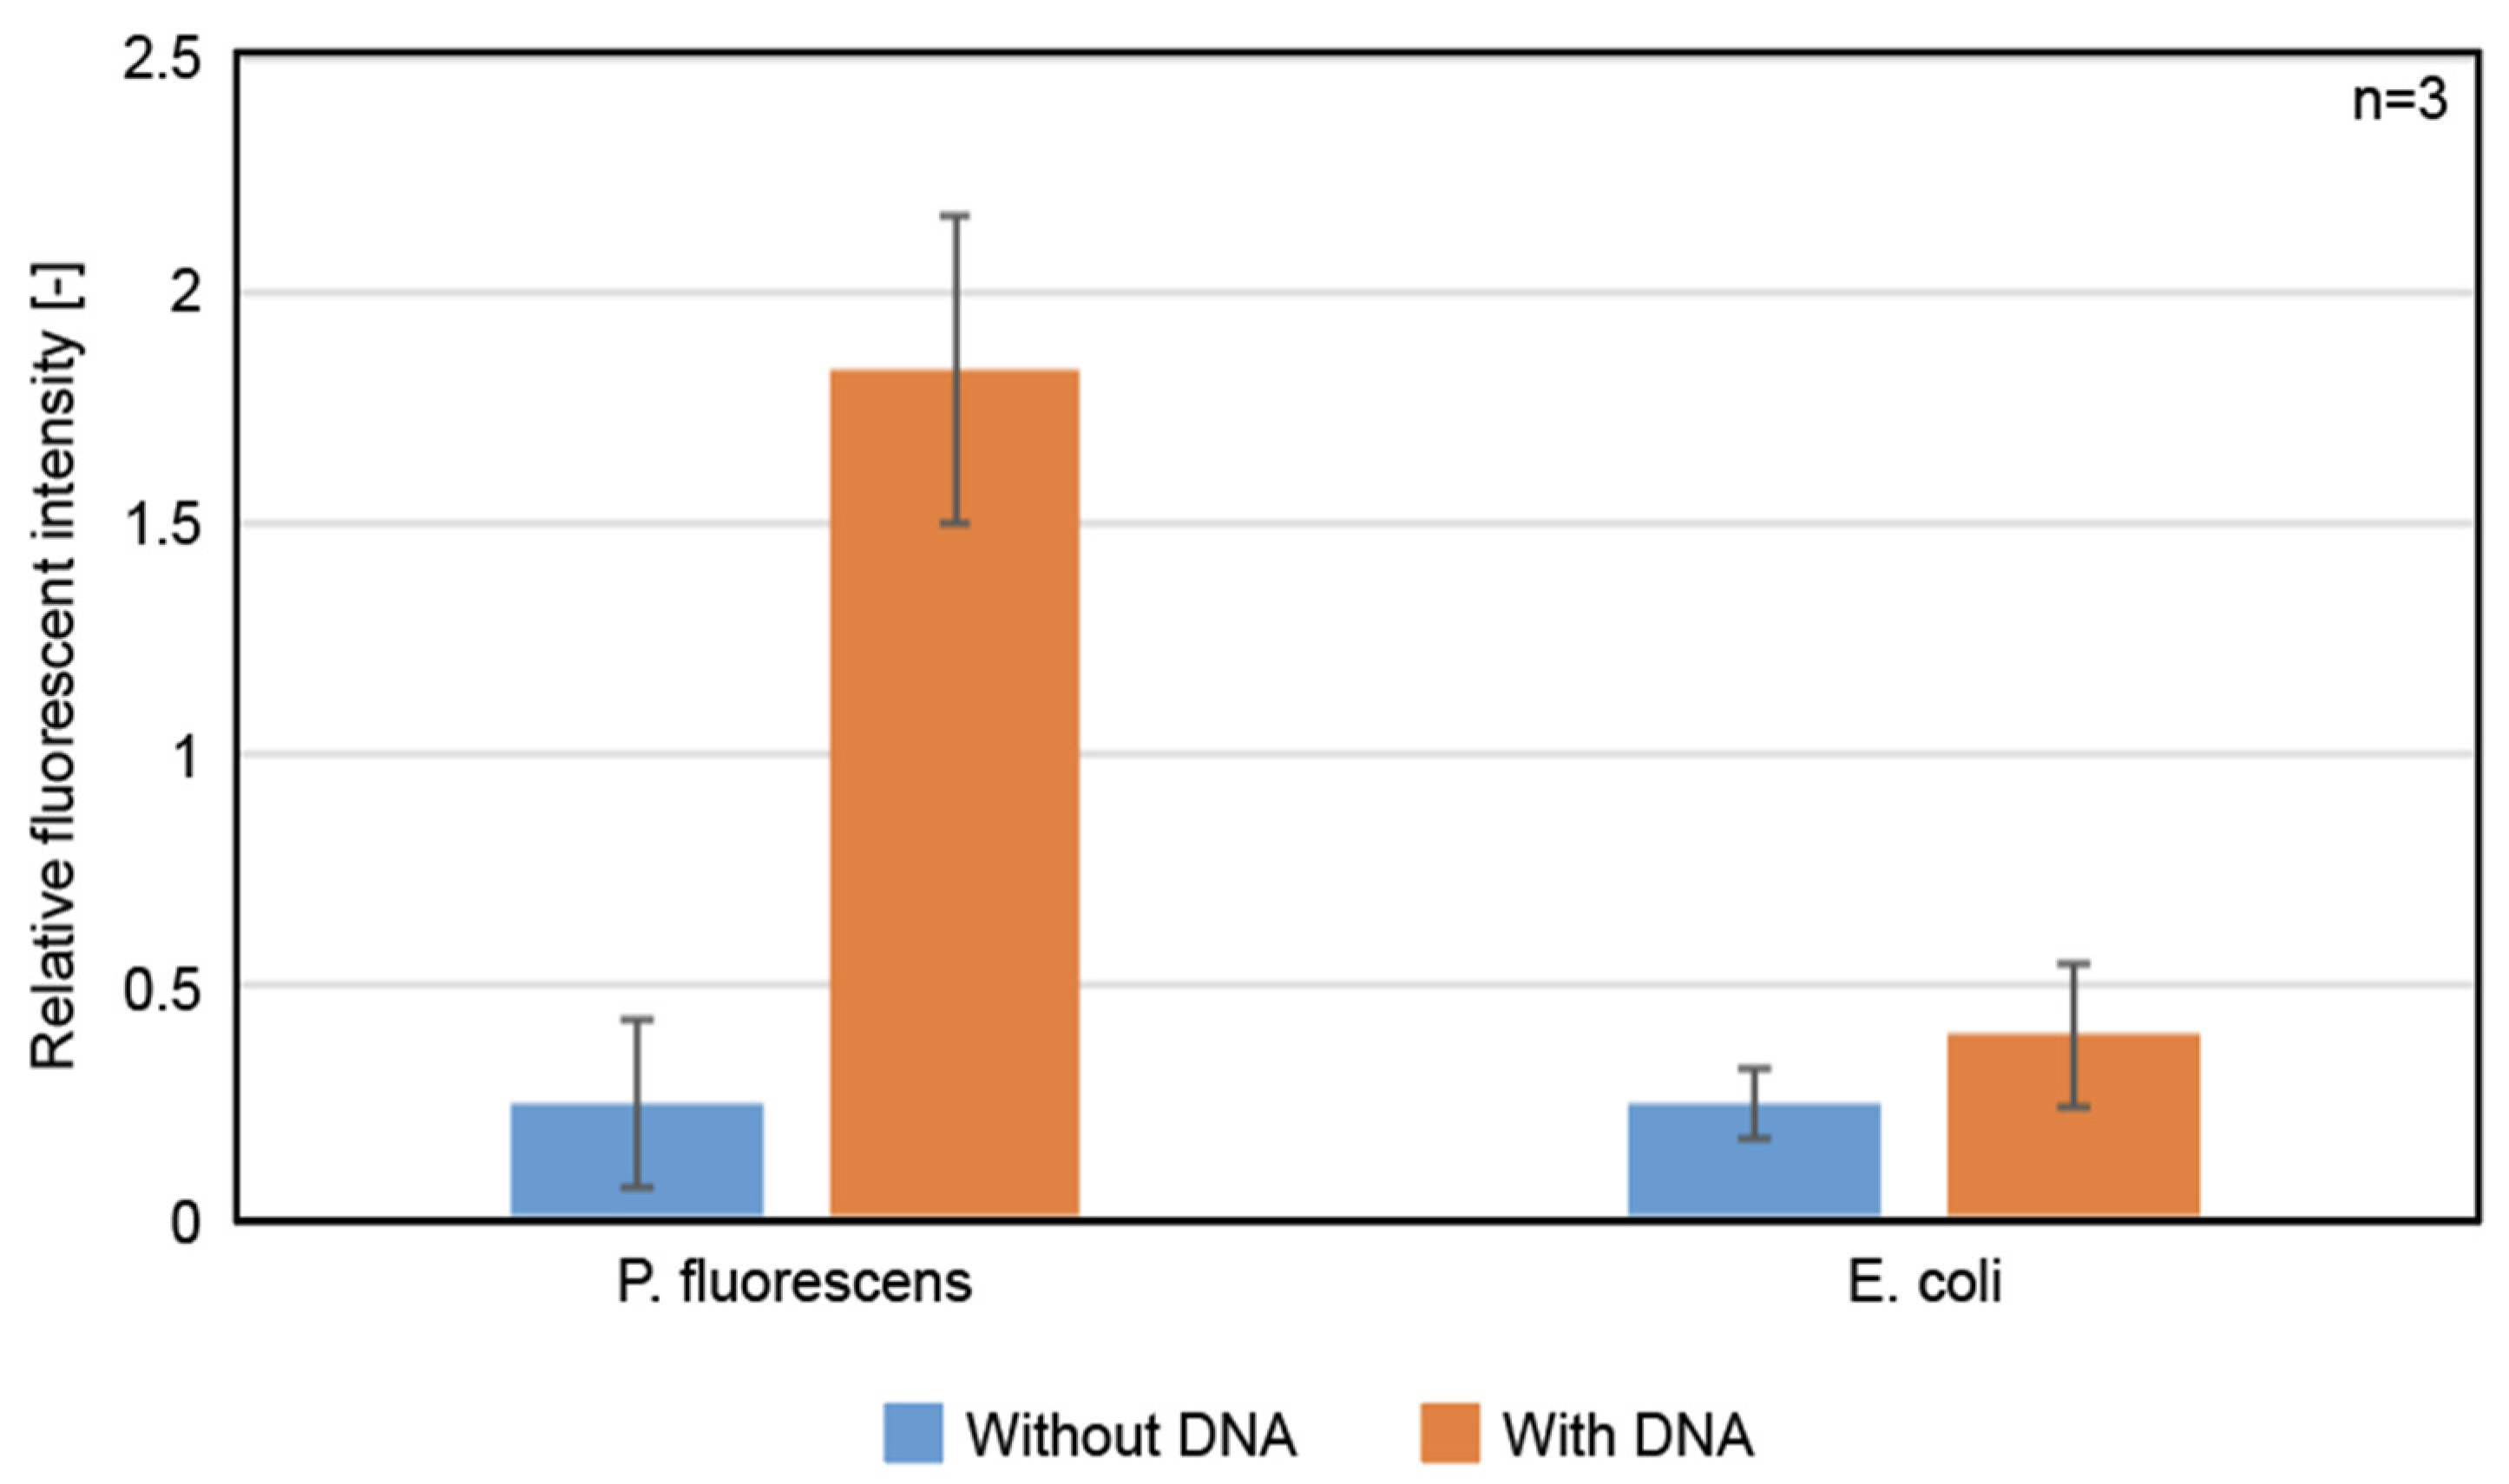
3.4. Protein Expression at 8 °C, in the LBAC Derived from P. fluorescens

We investigated the protein expression activity at 8 °C in a LBAC derived from P. fluorescens. In addition, we compared the protein expression activity of the LBACs at 8 °C with that derived from E. coli. To do so, we constructed a LBAC that fluoresces when expressing β-galactosidase. This was performed by encapsulating the optimized CFPES derived from P. fluorescens or E. coli with DNA encoding β-galactosidase and its substrate, FDG. The CFPES derived from E. coli used in this experiment was the one made from the LacZ-deficient strain, and it was validated to have protein expression capability comparable to the literature [10] in advance (data shown in Supplementary Material).
The constructed LBAC was observed at 8 °C using a fluorescent microscope. Figure 5 shows microscopic images of LBACs derived from P. fluorescens or E. coli, with or without DNA. The DNA-free LBAC derived from P. fluorescens shown in Figure 5a did not show a significant increase in fluorescence intensity after 3 h, whereas the DNA-containing LBAC derived from P. fluorescens shown in Figure 5b showed an increase in fluorescence intensity after 3 h. From this result, it is concluded that the LBAC derived from P. fluorescens has protein expression capability at 8 °C. As for the LBACs derived from E. coli, both the DNA-free LBAC shown in Figure 5c and the DNA-containing LBAC shown in Figure 5d did not show significant increases in fluorescence intensity after 3 h. Fluorescence signals were observed in the LBACs to some extent even without the DNA at 0 h. This is because the CFPES has self-fluorescence in this experimental condition.
Next, we compared the protein expression activity of the LBACs derived from P. fluorescens at 8 °C with that derived from E. coli. Figure 6 shows the relative fluorescence intensities of the LBACs derived from P. fluorescens or E. coli after 3 h with or without DNA. This graph indicates that the fluorescence intensity of the artificial cells derived from P. fluorescens was approximately four-fold higher than that of the artificial cells derived from E. coli. From this result, it is concluded that LBACs derived from P. fluorescens are preferable for protein expression at low temperatures, such as 8 °C.

4. Conclusions

We aimed to construct a LBAC that expresses proteins at temperatures below 20 °C. To realize such a LBAC, we prepared a CFPES using the cell extract derived from the cold-adapted bacterium P. fluorescens. We then optimized the procedures for creating a CFPES for high-yield protein expression. We found that the optimal procedure is as follows. 1: The best incubation period of the cells before harvesting was 9 h; 2: The best total protein concentration in the extract was 20 mg/mL; 3: The best Premix condition was 160 mM potassium, 15 mM magnesium, and 1 % PEG. We observed that the optimized CFPES had 2.1-fold and 20-fold higher protein expression capability at 16 °C and 8 °C, respectively, compared to that derived from E. coli. We constructed an LBAC by encapsulating the optimized CFPES derived from P. fluorescens and indicated that the constructed LBAC expresses proteins at temperatures as low as 8 °C. We further indicated that the protein expression capability at 8 °C, of the LBAC derived from P. fluorescens is four-fold higher than that derived from E. coli. The LBAC proposed in this study expands the application of such cells in terms of operational temperature. This study will be useful for the production of heat-labile proteins in the LBAC. In addition, this study will be an important step for the development of artificial cell-based biosensors that work in cold environments. In this study, we used P. fluorescens as an organism for constructing a LBAC, resulting in an operational temperature of 8 °C. By using other cold-adapted organisms such as Shewanella sp. [17] and P. putida [18], it may be possible to create artificial cells that can express proteins at temperatures lower than 8 °C or even in a frozen environment. Such LBACs could be applied to a biosensor that reports an abnormality in a product such as a reagent, food, or drink being transported in a chilled or frozen environment.

Supplementary Materials

The following are available online at https://www.mdpi.com/2227-9717/9/2/212/s1, Figure S1: Relationship between concentration of eGFP and fluorescence intensity, Figure S2: Time-course of fluorescence intensity of the GFP-expressing cell-free protein expression system derived from LacZ-deficient E. coli strain.

Author Contributions

Conceptualization, M.F. and T.T.; methodology, M.F. and T.T.; validation, M.F. and T.T.; investigation, M.F. and T.T.; resources, T.T.; data curation, M.F. and T.T.; writing—original draft preparation, M.F. and T.T.; writing—review and editing, T.T.; visualization, M.F. and T.T.; supervision, T.T.; project administration, T.T.; funding acquisition, T.T. All authors have read and agreed to the published version of the manuscript.

Funding

This work was partly supported by the Leading Initiative for Excellent Young Researchers, MEXT, Japan and Kyoto funding for Innovation in Health-related R&D Fields, Kyoto Lifetech Innovation Support Center (KLISC), Japan.

Institutional Review Board Statement

Not applicable.

Informed Consent Statement

Not applicable.

Data Availability Statement

The data presented in this study are available on request from the corresponding author.

Acknowledgments

The authors thank Jeff Hasty for providing LacZ-deficient (lac operon deletion) BL21-Gold-dLac (DE3) strain (Addgene plasmid # 99247), Yoshimichi Hagiwara for helpful discussion, and all the lab members for their help.

Conflicts of Interest

The authors declare no conflict of interest.

References

  1. Garamella, J.; Garenne, D.; Noireaux, V. TXTL-based approach to synthetic cells. Methods Enzymol. 2019, 617, 217–239. [Google Scholar] [PubMed]
  2. Lentini, R.; Martín, Y.N.; Forlin, M.; Belmonte, L.; Fontana, J.; Cornella, M.; Martini, L.; Tamburini, S.; Bentley, E.W.; Jousson, O.; et al. Two-way chemical communication between artificial and natural cells. ACS Cent. Sci. 2017, 3, 117–123. [Google Scholar] [CrossRef] [PubMed]
  3. Rampioni, G.; D’Angelo, F.; Messina, M.; Zennaro, A.; Kuruma, Y.; Tofani, D.; Leoni, T.; Stano, P. Synthetic cells produce a quorum sensing chemical signal perceived by Pseudomonas aeruginosa. Chem. Commun. 2018, 54, 2090–2093. [Google Scholar] [CrossRef] [PubMed]
  4. Berhanu, S.; Ueda, T.; Kuruma, Y. Artificial photosynthetic cell producing energy for protein synthesis. Nat. Commun. 2019, 10, 1325. [Google Scholar] [CrossRef] [PubMed]
  5. Seike, Y.; Kobori, S.; Whitaker, C.; Matsuura, T.; Yokobayashi, Y. Programmable artificial cells using histamine-responsive synthetic riboswitch. J. Am. Chem. Soc. 2019, 141, 11103–11114. [Google Scholar]
  6. Hindley, W.J.; Zheleva, G.D.; Elani, Y.; Charalambous, K.; Barter, C.L.M.; Booth, J.P.; Bevan, L.C.; Law, V.R.; Ces, O. Building a synthetic mechanosensitive signaling pathway in compartmentalized artificial cells. Proc. Natl. Acad. Sci. USA 2019, 116, 16711–16716. [Google Scholar] [CrossRef] [PubMed] [Green Version]
  7. Garamella, J.; Majumder, S.; Liu, P.A.; Noireaux, V. An adaptive synthetic cell based on mechanosensing, biosensing, and inducible gene circuits. ACS Synth. Biol. 2019, 16, 1913–1920. [Google Scholar] [CrossRef] [PubMed]
  8. Adamala, P.K.; Martin-Alarcon, A.D.; Guthrie-Honea, R.K.; Boyden, S.E. Engineering genetic circuit interactions within and between synthetic minimal cells. Nat. Chem. 2017, 9, 431–439. [Google Scholar] [CrossRef] [PubMed] [Green Version]
  9. Ding, Y.; Contreras-Llano, E.L.; Morris, E.; Mao, M.; Tan, C. Minimizing context dependency of gene networks using artificial cells. ACS Appl. Mater. Interfaces 2018, 10, 30137–30146. [Google Scholar] [CrossRef] [PubMed]
  10. Sun, Z.Z.; Hayes, A.C.; Shin, J.; Caschera, F.; Murray, M.R. Protocols for implementing an Escherichia Coli based TX-TL cell-free expression system for synthetic biology. J. Vis. Exp. 2013, 79, e50762. [Google Scholar] [CrossRef] [PubMed] [Green Version]
  11. Nakashima, N.; Tamura, T. Cell-free protein synthesis using cell extract of Pseudomonas fluorescens and CspA promoter. Biochem. Biophys. Res. Commun. 2004, 319, 671–676. [Google Scholar] [CrossRef] [PubMed]
  12. Bradford, M.M. A rapid and sensitive method for the quantitation of microgram quantities of protein utilizing the principle of protein-dye binding. Anal. Biochem. 1976, 72, 248–254. [Google Scholar] [CrossRef]
  13. Noireaux, V.; Libchaber, A. A vesicle bioreactor as a step toward an artificial cell assembly. Proc. Natl. Acad. Sci. USA 2004, 101, 17669–17674. [Google Scholar] [CrossRef] [PubMed] [Green Version]
  14. Kim, J.; Copeland, E.C.; Padumane, R.S.; Yong-Chan, K. A crude extract preparation and optimization from a genomically engineered Escherichia coli for the cell-free protein synthesis system. Methods Protoc. 2019, 2, 68. [Google Scholar] [CrossRef] [PubMed] [Green Version]
  15. Caschera, F.; Noireaux, V. A cost-effective polyphosphate-based metabolism fuels an all E. coli cell-free expression system. Metab. Eng. 2015, 27, 29–37. [Google Scholar] [CrossRef] [PubMed]
  16. Köhler, T.; Heida, T.; Hoefgen, S.; Weigel, N.; Valiante, V.; Thiele, J. Cell-free protein synthesis and in Situ immobilization of deGFP-MatB in polymer microgels for malonate-to-malonyl CoA conversion. RSC Adv. 2020, 10, 40588–40596. [Google Scholar] [CrossRef]
  17. Miyake, R.; Kawamoto, J.; Wei, L.Y.; Kitagawa, M.; Kato, I.; Kurihara, T.; Esaki, N. Construction of a low-temperature protein expression system using a cold-adapted bacterium, Shewanella sp. strain Ac10, as the host. Appl. Environ. Microbiol. 2007, 73, 4849–4856. [Google Scholar] [CrossRef] [PubMed] [Green Version]
  18. Wang, H.; Li, J.; Jewett, C.M. Development of a Pseudomonas putida cell-free protein synthesis platform for rapid screening of gene regulatory elements. Synth. Biol. 2018, 3, ysy003. [Google Scholar] [CrossRef] [PubMed]
Figure 1. (a) The growth curve of P. fluorescens in 2× YT medium at 23 °C. (b) Comparison of protein expression activity of the CFPES obtained from the cells harvested after varying periods of culture time. The cell-free protein expression system (CFPES) was incubated at 29 °C for 2 h with 51.8 ng/μL of DNA encoding Luciferase under T7 promoter. Premix contained K: 160 mM, Mg: 15 mM, polyethylene glycol (PEG): 1 %. Error bars represent standard deviations (n = 3).
Processes 09 00212 g001
Figure 2. Protein expression activity of the CFPES obtained from the cell extract having various total protein concentrations. The CFPES was incubated at 29 °C for 2 h with 51.8 ng/μL of DNA encoding Luciferase under T7 promoter. Premix contained K: 160 mM, Mg: 15 mM, PEG: 1 %. Error bars represent standard deviations (n = 3).
Processes 09 00212 g002
Figure 3. Luciferase assay of the CFPES obtained from Premixes containing different concentrations of potassium, magnesium, and PEG. (a) Premixes with different potassium concentrations. (Mg: 10 mM, PEG: 2 %) (b) Premixes with different magnesium concentrations. (K: 160 mM, PEG: 2 %) (c) Premixes with different PEG concentrations. (K: 160 mM, Mg: 10 mM) (d) Premixes with different concentrations of potassium, magnesium, and PEG. The leftmost bar (K: 160 mM, Mg: 10 mM, PEG: 2 %) represents the data with the Premix condition used in the previous study [11]. The CFPES was incubated at 29 °C for 2 h with 51.8 ng/μL of DNA encoding Luciferase under T7 promoter. Error bars represent standard deviations (n = 3).
Processes 09 00212 g003
Figure 4. Luciferase assay of the CFPES obtained from the cell extract of P. fluorescens or E. coli at 29 °C, 23 °C, 16 °C, and 8 °C. The CFPES was incubated at each temperature for 2 h with 51.8 ng/μL of DNA encoding Luciferase under T7 promoter. Error bars represent standard deviations (n = 3).
Processes 09 00212 g004
Figure 5. Microscopic images of the liposome-based artificial cell (LBACs) at 8 ℃ containing the CFPES and FDG with or without DNA encoding β-galactosidase. Upper row: Fluorescent images. Lower row: Bright-field images. 0 h represents the beginning of the observation. (a) CFPES was derived from P. fluorescens. Without DNA. (b) CFPES was derived from P. fluorescens. With DNA. (c) CFPES was derived from E. coli. Without DNA. (d) CFPES was derived from E. coli. With DNA.
Processes 09 00212 g005
Figure 6. Relative fluorescent intensity of the LBACs encapsulating the CFPES derived from P. fluorescens and E. coli. With DNA: DNA encoding β-galactosidase was encapsulated. Without DNA: No DNA was encapsulated. Error bars represent standard deviations (n = 3).
Processes 09 00212 g006
Publisher’s Note: MDPI stays neutral with regard to jurisdictional claims in published maps and institutional affiliations.

