1. Introduction
SBGPs are widely used in the main reducer of helicopters due to their excellent transmission performance. When the transmission system is running, it will not only produce engagement power loss and churning loss but also windage power loss. When the linear velocity of the gear is greater than 45 m/s [
1,
2], the high-speed rotating gear teeth will form high swirl, high velocity field and centrifugal force field in the fluid domain of the reduction gearbox and then generate pressure and viscous force on the gear surface. The windage power loss is as high as 50% of the total transmission power loss. Sufficient attention must be paid to the power loss caused by aerodynamic performance [
3,
4]. Installing the windshield can dramatically reduce the windage power loss, thereby significantly improving the transmission efficiency of the main reducer. The reduction of the windage is the reduction of the heat generation power, which allows the design of smaller fuel tanks, fuel pumps and radiators, so that the efficiency of the helicopter can be further improved indirectly [
5].
In 1984, Dawson, P.H. measured the windage power loss of a spur gear with a speed of 1500 rpm and a diameter range of 300 to 1600 mm through physical experiments. He proposed some measures to reduce the windage power loss of the gear and put forward the law that the windage power loss changes with the change of gear geometric parameters. The results showed that blocking the radial entrance of the gear slot could reduce the windage power loss by 22% to 44%; shielding the gear with a windshield could also significantly reduce the windage loss [
6]. Lord designed a test bench for measuring the windage power loss of spur gears. The diameter of the spur gears ranged from 90 to 200 mm and the speed was 25,000 rpm. The conclusion showed that when the clearance was 1 mm, the windage power loss of the spur gear would be reduced to the lowest level. Compared with the spur gear without the windshield, the windage loss would be reduced by 75% [
7]. Winfree [
8] installed a single spiral bevel gear with a windshield on a test bench and conducted experimental analyses on its windage power loss. The windage characteristics of a single spiral bevel gear under different windshield configurations were studied to optimize the effect of the windshield on the windage power loss. Michal Ruzek and Fabrice Ville [
9] measured the windage power loss of the spur gear pair and the helical gear pair in the case of a disc and a single gear by building a simple test bench. The interference of engagement loss was avoided during the test, so only the influence of air pressure and viscous force on the windage of the tooth surface and end face of the gear was considered. Anderson and Loewenthal [
10] established an equation for estimating the windage power loss of the spur gear pair. Factors such as the gear size, working conditions and fluid characteristics were considered in the test. The maximum linear speed of the gear was 40 m/s. Graham Johnson [
11] tested the windage loss of non-engagement spiral bevel gears under different working conditions in air single-phase flow. The results showed that the windshield could reduce the windage power consumption by about 70%, and the characteristics of the spiral bevel gear were similar to the centrifugal fan in many ways.
Due to the continuous maturity of the CFD numerical simulation technology, it has developed into an effective tool for describing fluid characteristics in windage phenomena. Al-Shibl and Simmons et al. [
12] employed Fluent to study the windage power loss of a single spur gear rotating in the air. To simplify the calculation, a two-dimensional plane model was established. The windage power loss of the gear at different speeds was analyzed and compared with the published experimental data. The windage power loss of the gear with the windshield installed was also analyzed. Steve Rapley [
13,
14] employed CFD to study the influence of windshields with different geometric characteristics on the single-phase fluid of spiral bevel gears. Webb [
15,
16] employed CFD to simulate the windage loss of the single gear with the windshield in the single-phase flow. He pointed out that as the number of teeth increased, the non-dimensional torque coefficient decreased. Carlo and Franco et al. conducted experiments and simulations to determine the oil-throwing loss efficiency of the gear pair in the gearbox in 2013. The simulation adopted VOF (volume of fluid) model and dynamic mesh technique. The final simulation result differed by 8% from the experimental result, which proved the correctness of the fluid simulation [
17]. Jia Qingjian, Zhao Ning, and Liang Zuobin, et al. [
18,
19,
20] employed the rotation period boundary model to simulate the windage of spur gears, face gears and bevel gears. Zhu [
21] studied the influencing factors of the windage power loss of spiral bevel gears but did not quantify the influence of the windshield clearance value on the windage. The interaction of the clearance value was also not considered, which means the influence of the shape of the windshield on the windage power loss was not considered.
In summary, related studies have shown that the windshield has a great effect on reducing windage loss, which is more than 70%. However, the current related research mostly focuses on the single non-engagement spur gear. For spiral bevel gears, only a few scholars have studied its single-gear windage effect, not to mention engagement of double-gears. This is mainly because the experimental design of the windage loss for engagement gear pair is more complicated. There are many experimental influence factors on the windage, and it is difficult to accurately calculate the value of the windage power loss. In addition, to simplify the model and improve the calculation efficiency during the CFD numerical simulation analysis, most researchers adopted a two-dimensional plane model. However, for SBGP, three-dimensional modeling must be employed to accurately express the calculation domain, and transient analysis models must be adopted for the calculation of engagement gear pairs. In this case, the number of calculations has increased dramatically, and traditional computers can hardly complete this work. Even for workstations with high computing performance, it takes more than two weeks to complete the calculation of a model.
Therefore, with the help of the powerful parallel computing capabilities of the Super Cloud Computing Center, this paper performed transient simulation calculations on the windage power loss of SBGP. It studied the mechanism of the windshield to reduce the windage power loss of the gear pair and proposed a gear windshield structure. Meanwhile, this paper also studied the windage loss of SBGP with and without a windshield, as well as the corresponding flow field pressure, velocity, turbulence energy and tooth surface viscous force. For the gear with the windshield installed, it analyzed the influence of different windshield configurations on the windage loss of the gear pair, and finally achieved the most optimized windshield configuration.
3. Numerical Simulation Calculation Model of SBGP
3.1. CFD Calculation Model
The basic parameters of SBGP are shown in
Table 1.
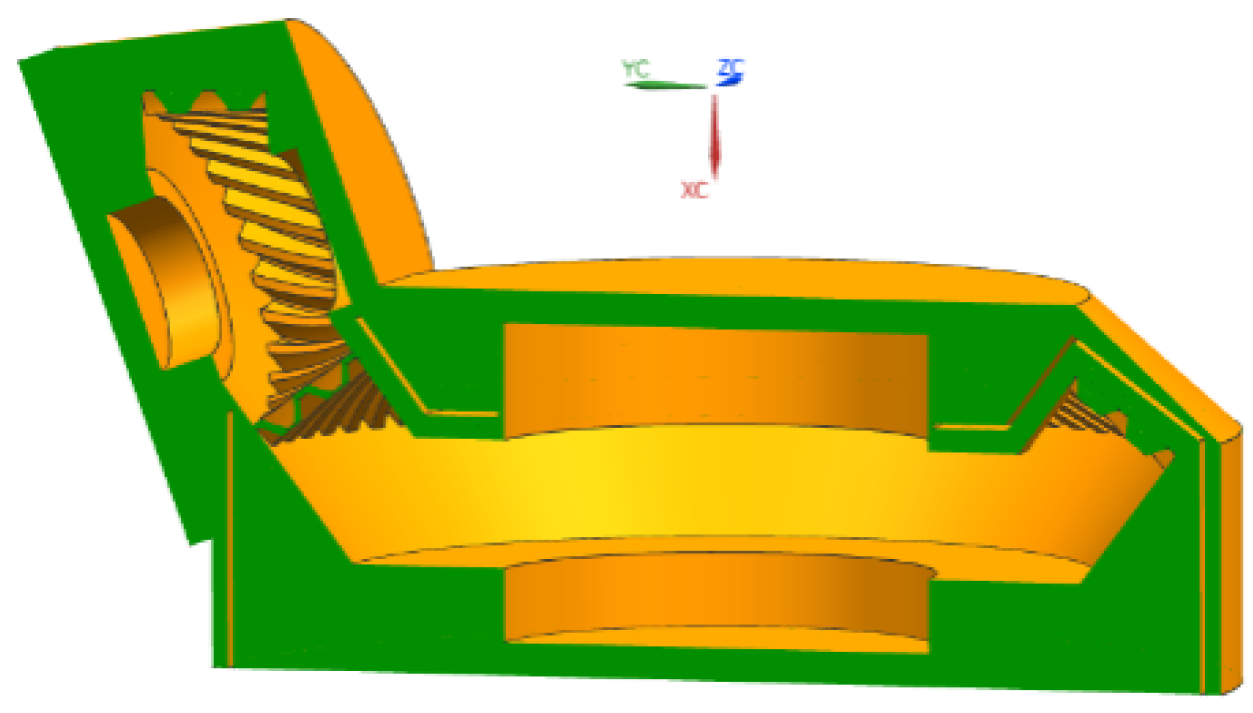
The high-speed gearbox of the aeroengine has a complicated structure. To avoid the interference of other parts in the gearbox, the study of the windage loss of SBGP and the design of the windshield are performed in the closed gearbox. To simplify the complexity of the numerical simulation of windage loss and improve the efficiency of the simulation, the model needs to be simplified, ignoring bearings, fixings, etc. In UG (Unigraphics), a top-down method is employed for parametric modeling, and the simplified three-dimensional model of the gearbox is shown in
Figure 2.
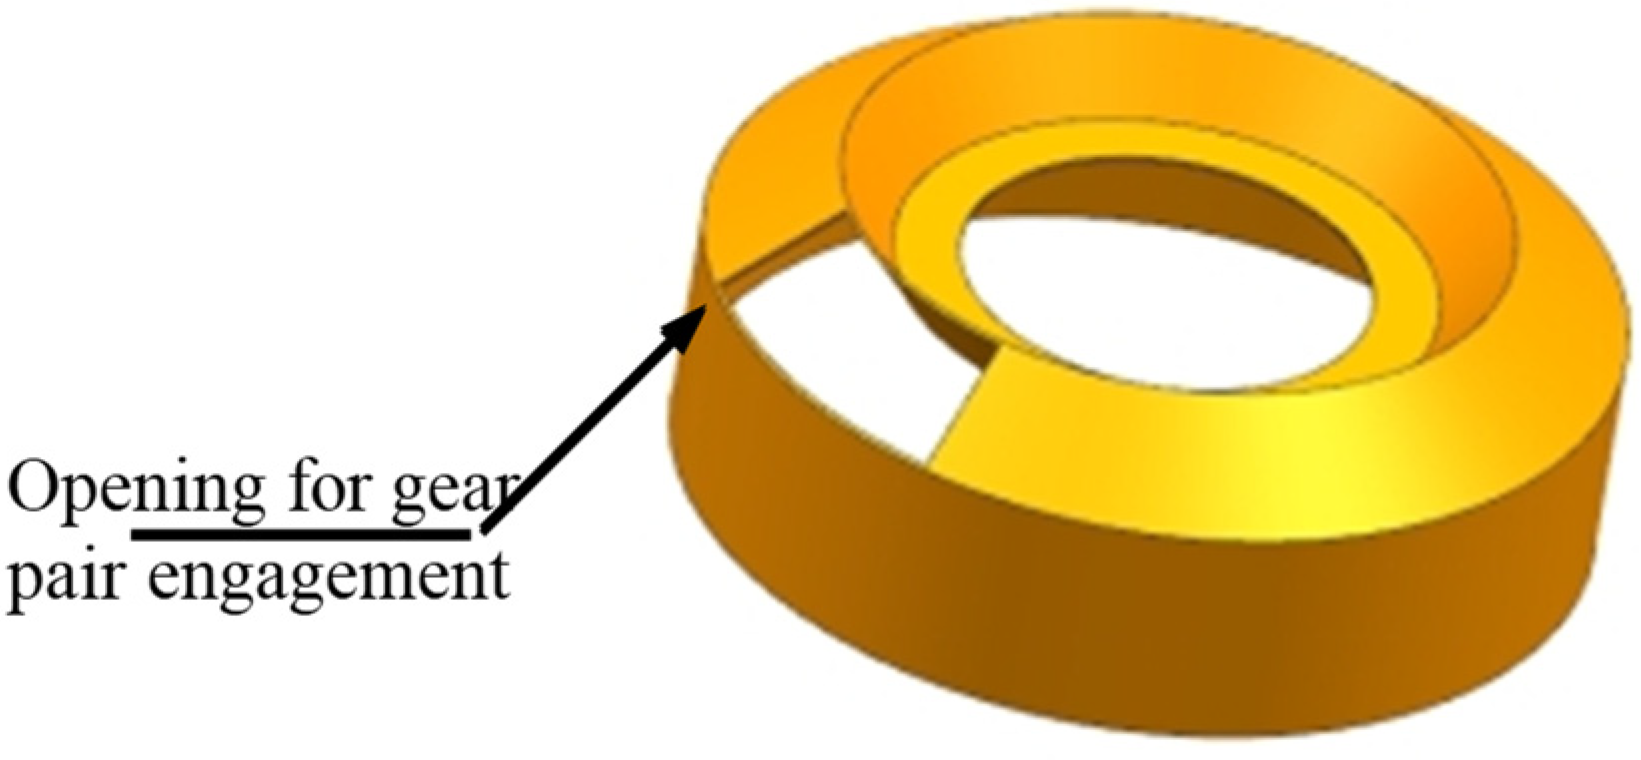
The structure design of the windshield is shown in
Figure 3. The windshield is installed between the driven gear and the gearbox, covering the driven gear completely. The opening area of the windshield is the engagement area of the gear pair.
3.2. Mesh Generation
Due to the complex tooth profile of the spiral bevel gear, there is a large fluid deformation at the tooth surface. To reconstruct the flow field mesh and make the mesh better adapt to the geometric shape, the initial model was discretized with unstructured tetrahedral mesh based on the finite volume method to obtain the fluid dynamics analysis model. The mesh was divided in the ANSYS-ICEM CFD (The Integrated Computer Engineering and Manufacturing code for Computational Fluid Dynamics) software. To prevent the mesh from being too dense and increasing the amount of calculation, or to avoid the mesh being too sparse and reducing the accuracy, local refinement was performed on the meshes near the tooth surface, the large end surface, the small end surface and the gear shaft surface. The maximum mesh size of the fluid domain is 4 mm, the boundary layer size of the tooth surface, large and small end faces and windshield is 0.5 mm, and the boundary layer thickness is five layers. To improve the accuracy and reliability of the simulation results, the calculation model was verified for mesh independence and convergence. When the number of meshes in the entire fluid domain of a single calculation model was about 6.3 million, the total number of nodes was about 940,000, and the calculation exceeded 500 iterations, the model can reach the convergence standard.
3.3. Boundary Conditions and Solution Settings
Boundary conditions were imposed on the CFD model according to the actual physical meaning, regardless of the influence of the small parts in the gearbox, the flow field model of the gearbox and the gear pair could be obtained through Boolean operations, as shown in the solid area in
Figure 4.
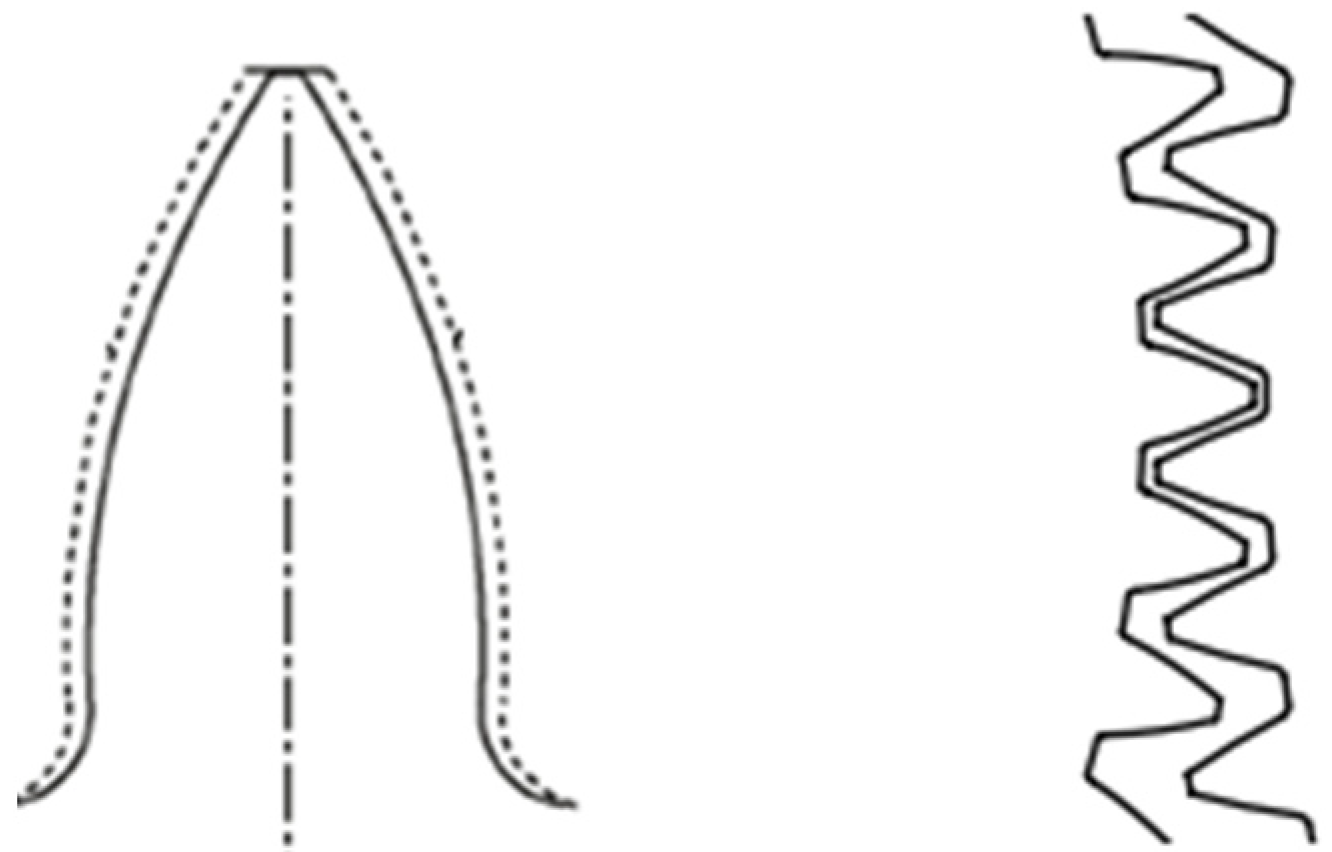
Assuming that the air was an incompressible fluid, the pressure-based solver coupling algorithm under transient analysis was selected. The backlash of the gear pair is extremely small, and when the dynamic mesh technology is used for mesh reconstruction, the engagement area is very likely to form a negative volume, which leads to calculation errors. Therefore, the teeth-face-moving method was adopted to thin the gear teeth, and the obtained clearance ensured that the center distance remained unchanged while the gear pair was engaged. The dynamic mesh item was activated, the boundary movement mode was defined through the UDF file, and the mesh update process was automatically completed by Fluent according to the change of the boundary in each iteration step. Due to the large deformation of the fluid space in the engagement area, the spring smoothing and the local reconstruction were employed to update the fluid domain mesh. In the size function of the mesh reconstruction, the minimum reconstruction size was set as the minimum mesh size of the gearbox. Considering the meshes on the deformed boundary surface, the rest of the items were set as default in the Local Face. To improve the calculation speed and accuracy, the momentum equation chose the second-order upwind discrete format, and the turbulent kinetic energy and turbulent dissipation chose the first-order upwind discrete format. At the same time, to improve the convergence, the relaxation factor was adjusted appropriately. The time step of transient analysis was set to 2 × 10⁻⁶, the number of steps was 6000, and the iterative solution was performed after initialization.
5. Windshield Design to Reduce Windage Loss of Gear Pair
5.1. The Mechanism of the Windshield to Reduce the Windage Loss of the Gear Pair
According to the research of Dawson, P.H., Lord, Diab, Winfree, Johnson, Simmons, etc., shielding high-speed rotation gears with a windshield could significantly reduce the windage power loss. Studies have shown that the geometry (clearance and shape) of the windshield is the main factor affecting its performance. This section studies the design principles and influence mechanism of the windshield.
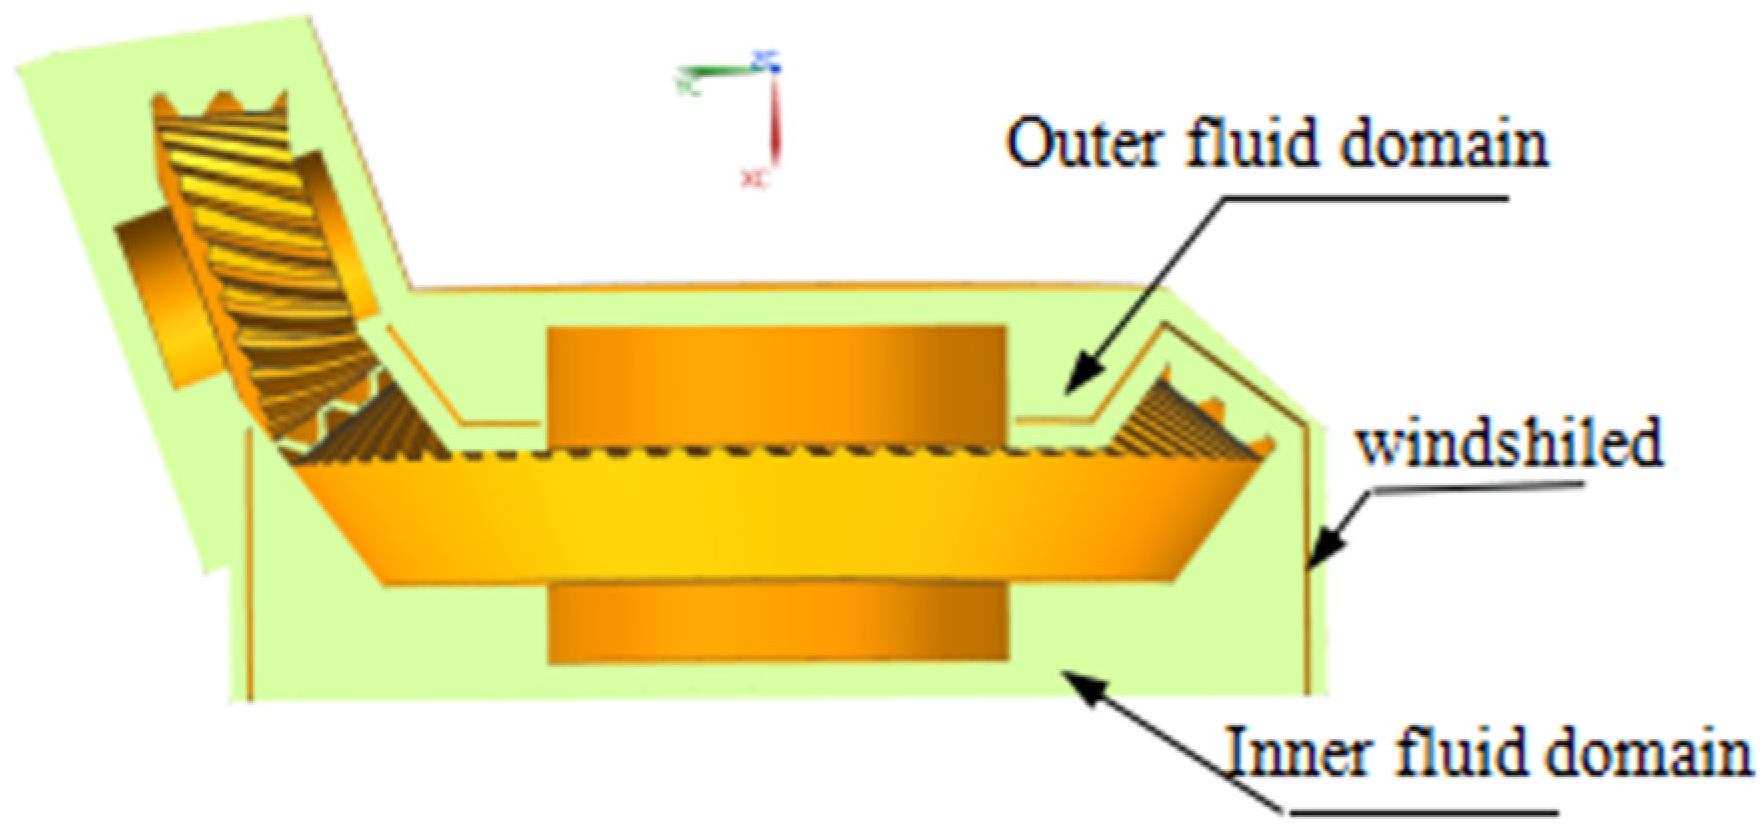
The windshield divides the fluid domain inside the gearbox into two fluid domains, as shown in
Figure 9, where the inner fluid domain is the fluid domain directly affected by the gear, and the outer fluid domain is the fluid domain indirectly affected by the gear. In the simulation, these two fluid domains are connected through the opening of the windshield (that is, the engagement area of the gear pair) and the clearance between the windshield and the driven/driving gear shaft. The fluid can flow between the two fluid domains to exchange matter and energy.
When the air in the inner fluid domain obtains kinetic energy from the gear under the action of pressure and viscous force, due to the existence of the windshield, the turbulent energy of the air in the inner fluid domain decreases, and the turbulent motion becomes mild. Therefore, for the air in the inner fluid domain, the ability to retain kinetic energy is improved, the kinetic energy that the gear provides to the air is reduced, then the pressure and viscous force acting on each surface of the gear are reduced, and finally the windage loss of the gear is reduced. There is a connecting surface between the two fluid domains near the engagement area, where the velocity directions of the two fluid domains are opposite. When the air flows out of the inner fluid domain through the engagement area and enters the outer fluid domain, there is violent turbulence in the driving gear chamber. The turbulent kinetic energy cloud diagram of the fluid domain is shown in
Figure 10.
5.2. Design of Numerical Simulation Experimental Scheme
The main factors that affect the windshield to reduce the power loss of the gear pair are the clearance value between the windshield and the gear face, the clearance value between the tooth surface and the shaft surface, and the opening size of the gear pair engagement area on the windshield. This section verifies the influence rule of each factor through a numerical simulation experiment. The clearance between the windshield and the gear, namely the large end clearance (B), the small end clearance (C) and the tooth surface clearance (D) are the main factors affecting the performance of the windshield. The specific meanings of these three structural parameters are shown in
Figure 11.
In this experimental design, the windage torque of the gear pair is the experimental index, and its value was extracted in the post-processing software. The large end clearance (B), the small end clearance (C), the tooth surface clearance (D) and the opening of the engagement area (A) are the experimental factors. The level of each experimental factor was set to four, and the factor level is shown in
Table 3. The standard orthogonal table
was selected to perform the numerical calculation of 16 sets of factor combinations. The final numerical simulation experimental scheme and the windage torque value of the gear are shown in
Table 4.
5.3. Variance Analysis of Experimental Results
Variance analysis was performed according to the simulation analysis results of the experimental scheme in
Table 4. The windage torque values of the gear pairs of each factor at each level were added and recorded as
yi. The average value of the windage torque of each factor at each level was recorded as
. The range of each factor was calculated and recorded as
Rj. The sequence of the range of each factor at each level was arranged to obtain the sequence of the influence of each factor on the experimental results, as shown in
Table 5.
From the values of the range in
Table 5, it can be seen that the influence degree of each factor on the experimental results is B > D > A > C, that is, the most significant factor is B and the least is C. When the level value is 1, the average value of the significant factors is the smallest in
Table 5, and the optimal level combination of the experimental results is A
1B
1C
1D
1.
The results of the variance analysis show that the large end clearance has the greatest influence on the windage torque of the gear pair, followed by the tooth surface clearance, and the small end clearance has less influence. When the values of the clearance between the windshield and the tooth surface, as well as the large end surface and the small end surface are all 1 mm, and the opening of the engagement area is 30°, the windage torque is the smallest. That is, the smaller the volume of the space enclosed by the windshield and the gear, the smaller the interaction area between the inner and outer fluid domains, and the smaller the windage power loss.
According to the CFD principles, the structure of the windshield makes the outer volume of the rotating gear smaller and the clearance between the windshield and the gear smaller. At the same time, the smaller the opening of the windshield, the less the air flow into the gear teeth. There is less energy exchange between the inner and outer fluid domains, and the turbulent kinetic energy of the fluid is less, resulting in less energy dissipation, that is, less windage power loss.
5.4. Numerical Simulation Analysis Results
Based on CFD simulation software, with the help of the powerful parallel computing capability of a supercomputer, this paper performed single-phase flow transient simulation calculation on the windage power loss of engagement SBGP. Due to the small size of the driving gear, the corresponding windage loss is less. Considering actual manufacturing and installation, the driving gear is not equipped with a windshield. In all experiments, the windshield was installed at the driven gear to reduce its windage power loss. In the simulation analysis, each structural parameter value of the windshield (that is, the large end clearance, the small end clearance, the tooth surface clearance, etc.) was set to the same value.
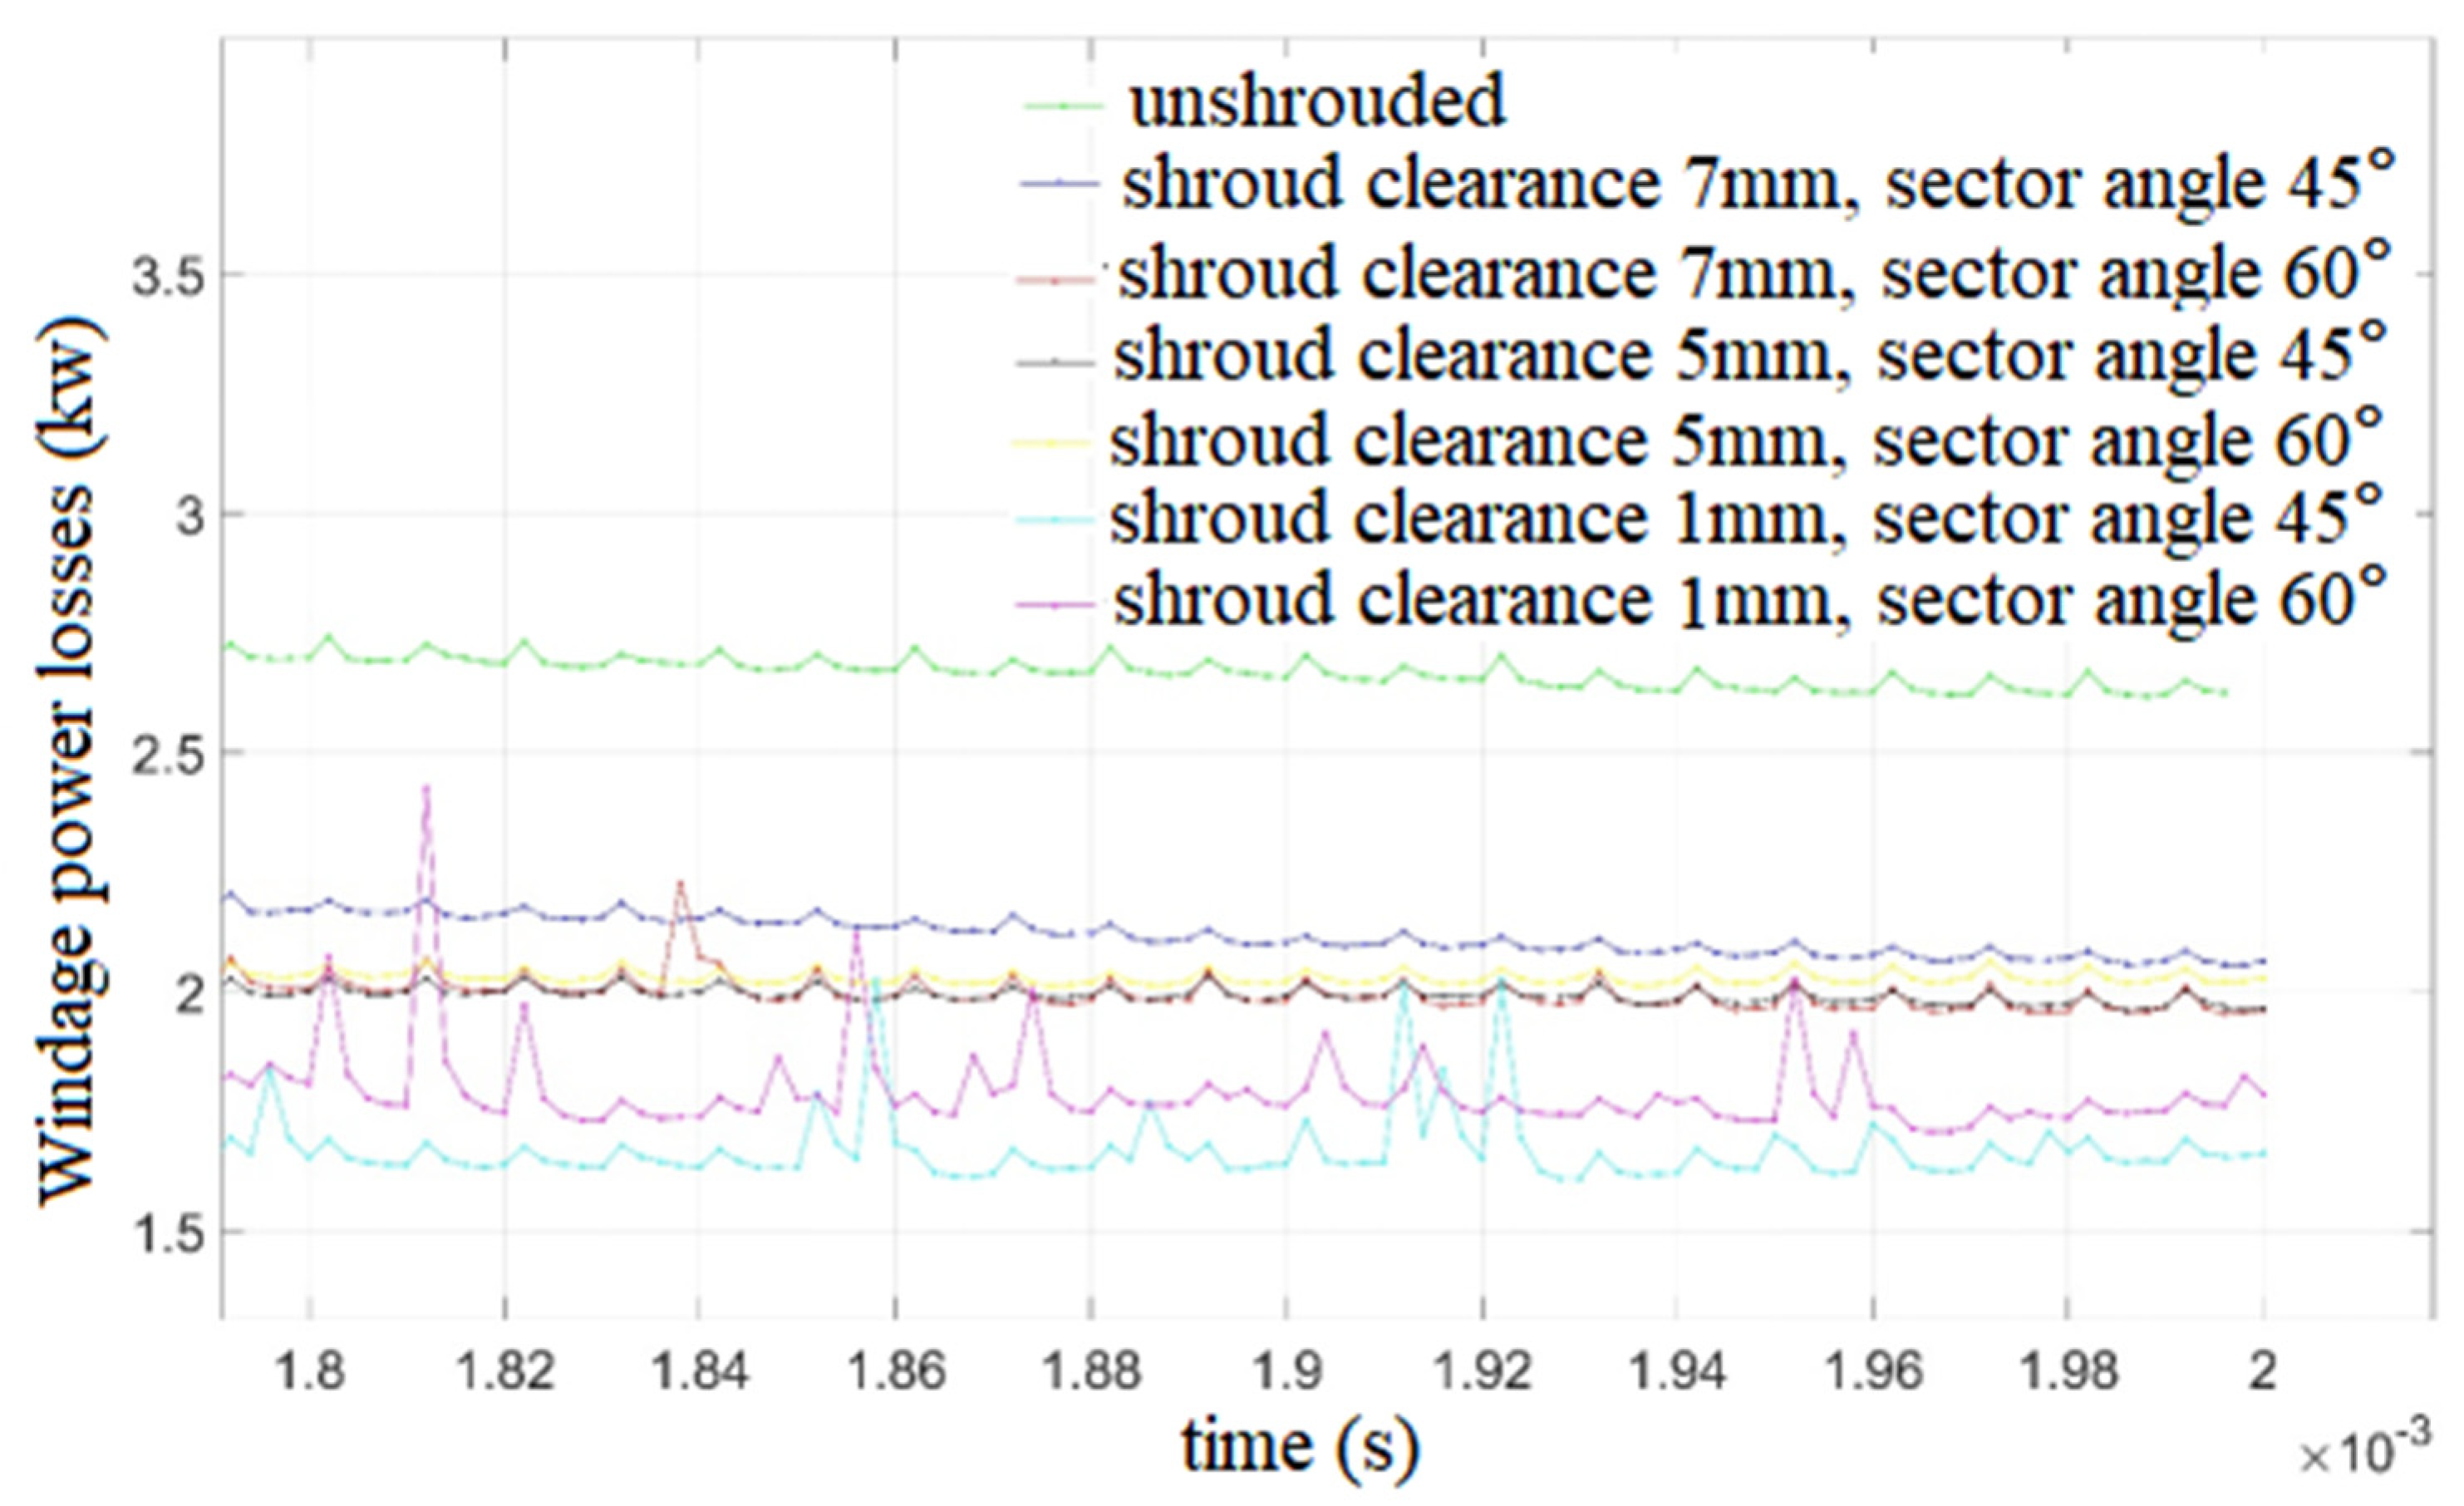
Figure 12 shows the curve of the windage power loss of SBGP varying with time. Existing research data show that the windage power loss can be reduced by 70% to 75% after the windshield is installed [
18]. The windshield with the best effect in the simulation (the clearance is 1mm, the engagement opening is 30°) can reduce 55.3% of the windage power loss. At this time, from the perspective of actual installation, it is no longer possible to further reduce the windage loss by reducing the clearance between the windshield and the gear.
The actual windage of the gear pair may be different from the simulation results. This is because when there is lubricating oil inside the gearbox, the internal flow field of the gearbox is actually a two-phase mixture of oil and gas, and its density and viscosity are higher than that of air. The kinetic energy dissipation of the flow field is also relatively high. The case where the main reducer is not sealed should also be considered. When the main reducer is connecting with the outside (other components or the atmosphere), the fluid in the main reducer can exchange mass and energy with the outside, which means that the mass of the fluid involved in dissipating the kinetic energy of the fluid in the gearbox increases, therefore, the windage power loss of the spiral bevel gear can be greater.
Known from CFD, turbulent kinetic energy is an index to measure the development or decline of turbulence, and it is a sign of turbulence stability. The turbulent kinetic energy can be estimated by the turbulence intensity and average velocity, and its calculation method is shown in the following equation:
where
k is the turbulent kinetic energy,
I is the turbulence intensity,
U is the average velocity, and Re is the Reynolds number.
The energy loss caused by the windage of the gear pair would be dissipated as the turbulent motion of the fluid in the gearbox. The windage power loss represents the kinetic energy loss per unit time caused by the windage torque when the gear rotates. When the gearbox is closed, the lost kinetic energy is converted into heat energy through the viscous force between the fluid clusters, resulting in an increase in the turbulent kinetic energy of the fluid.
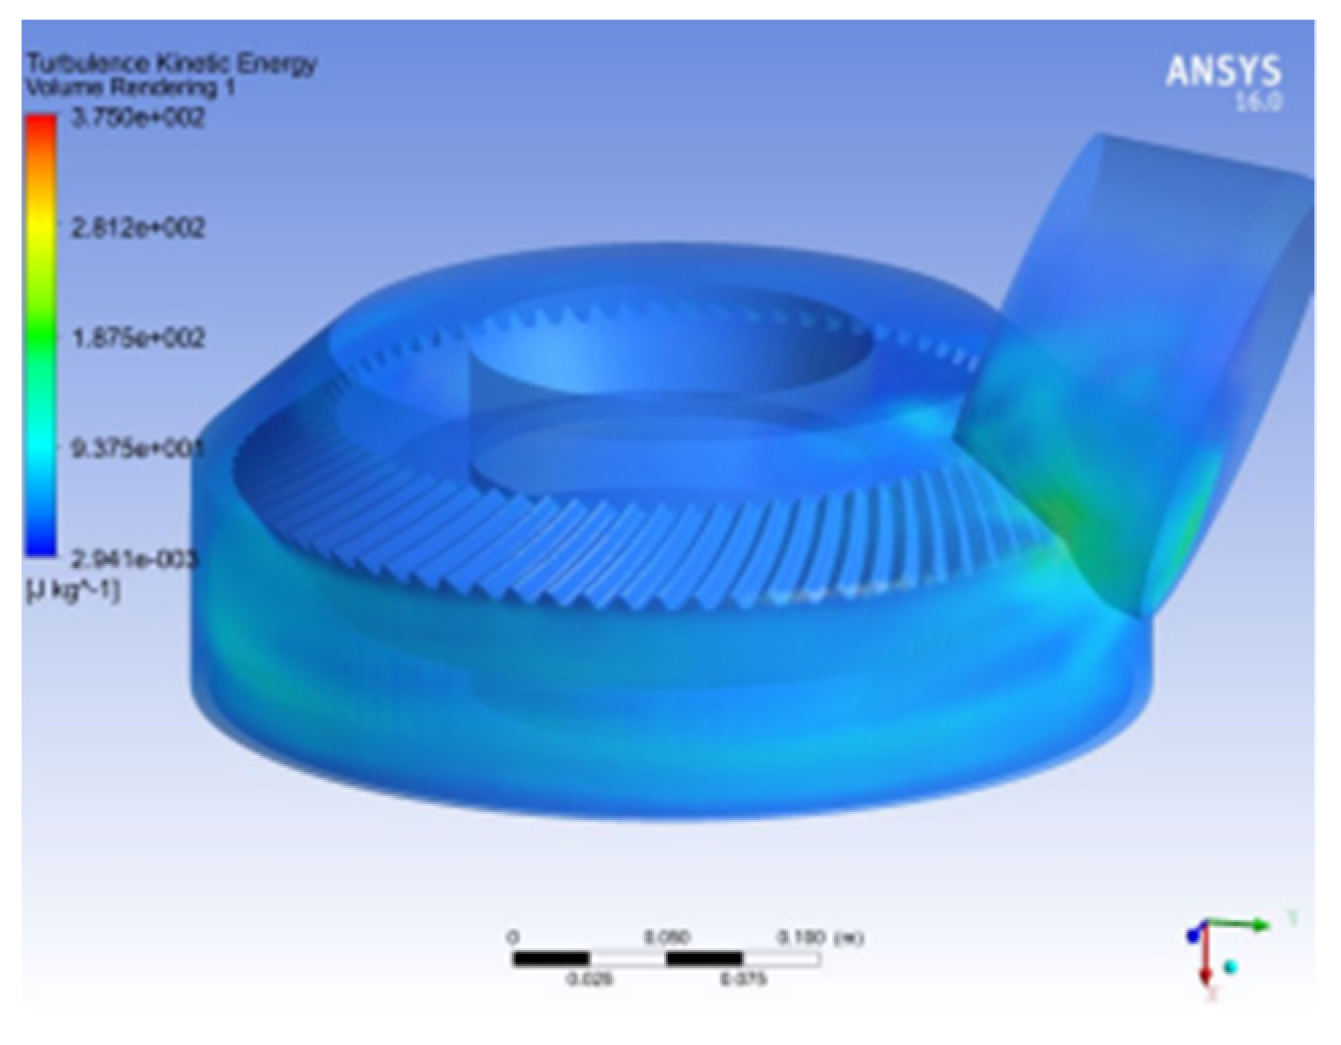
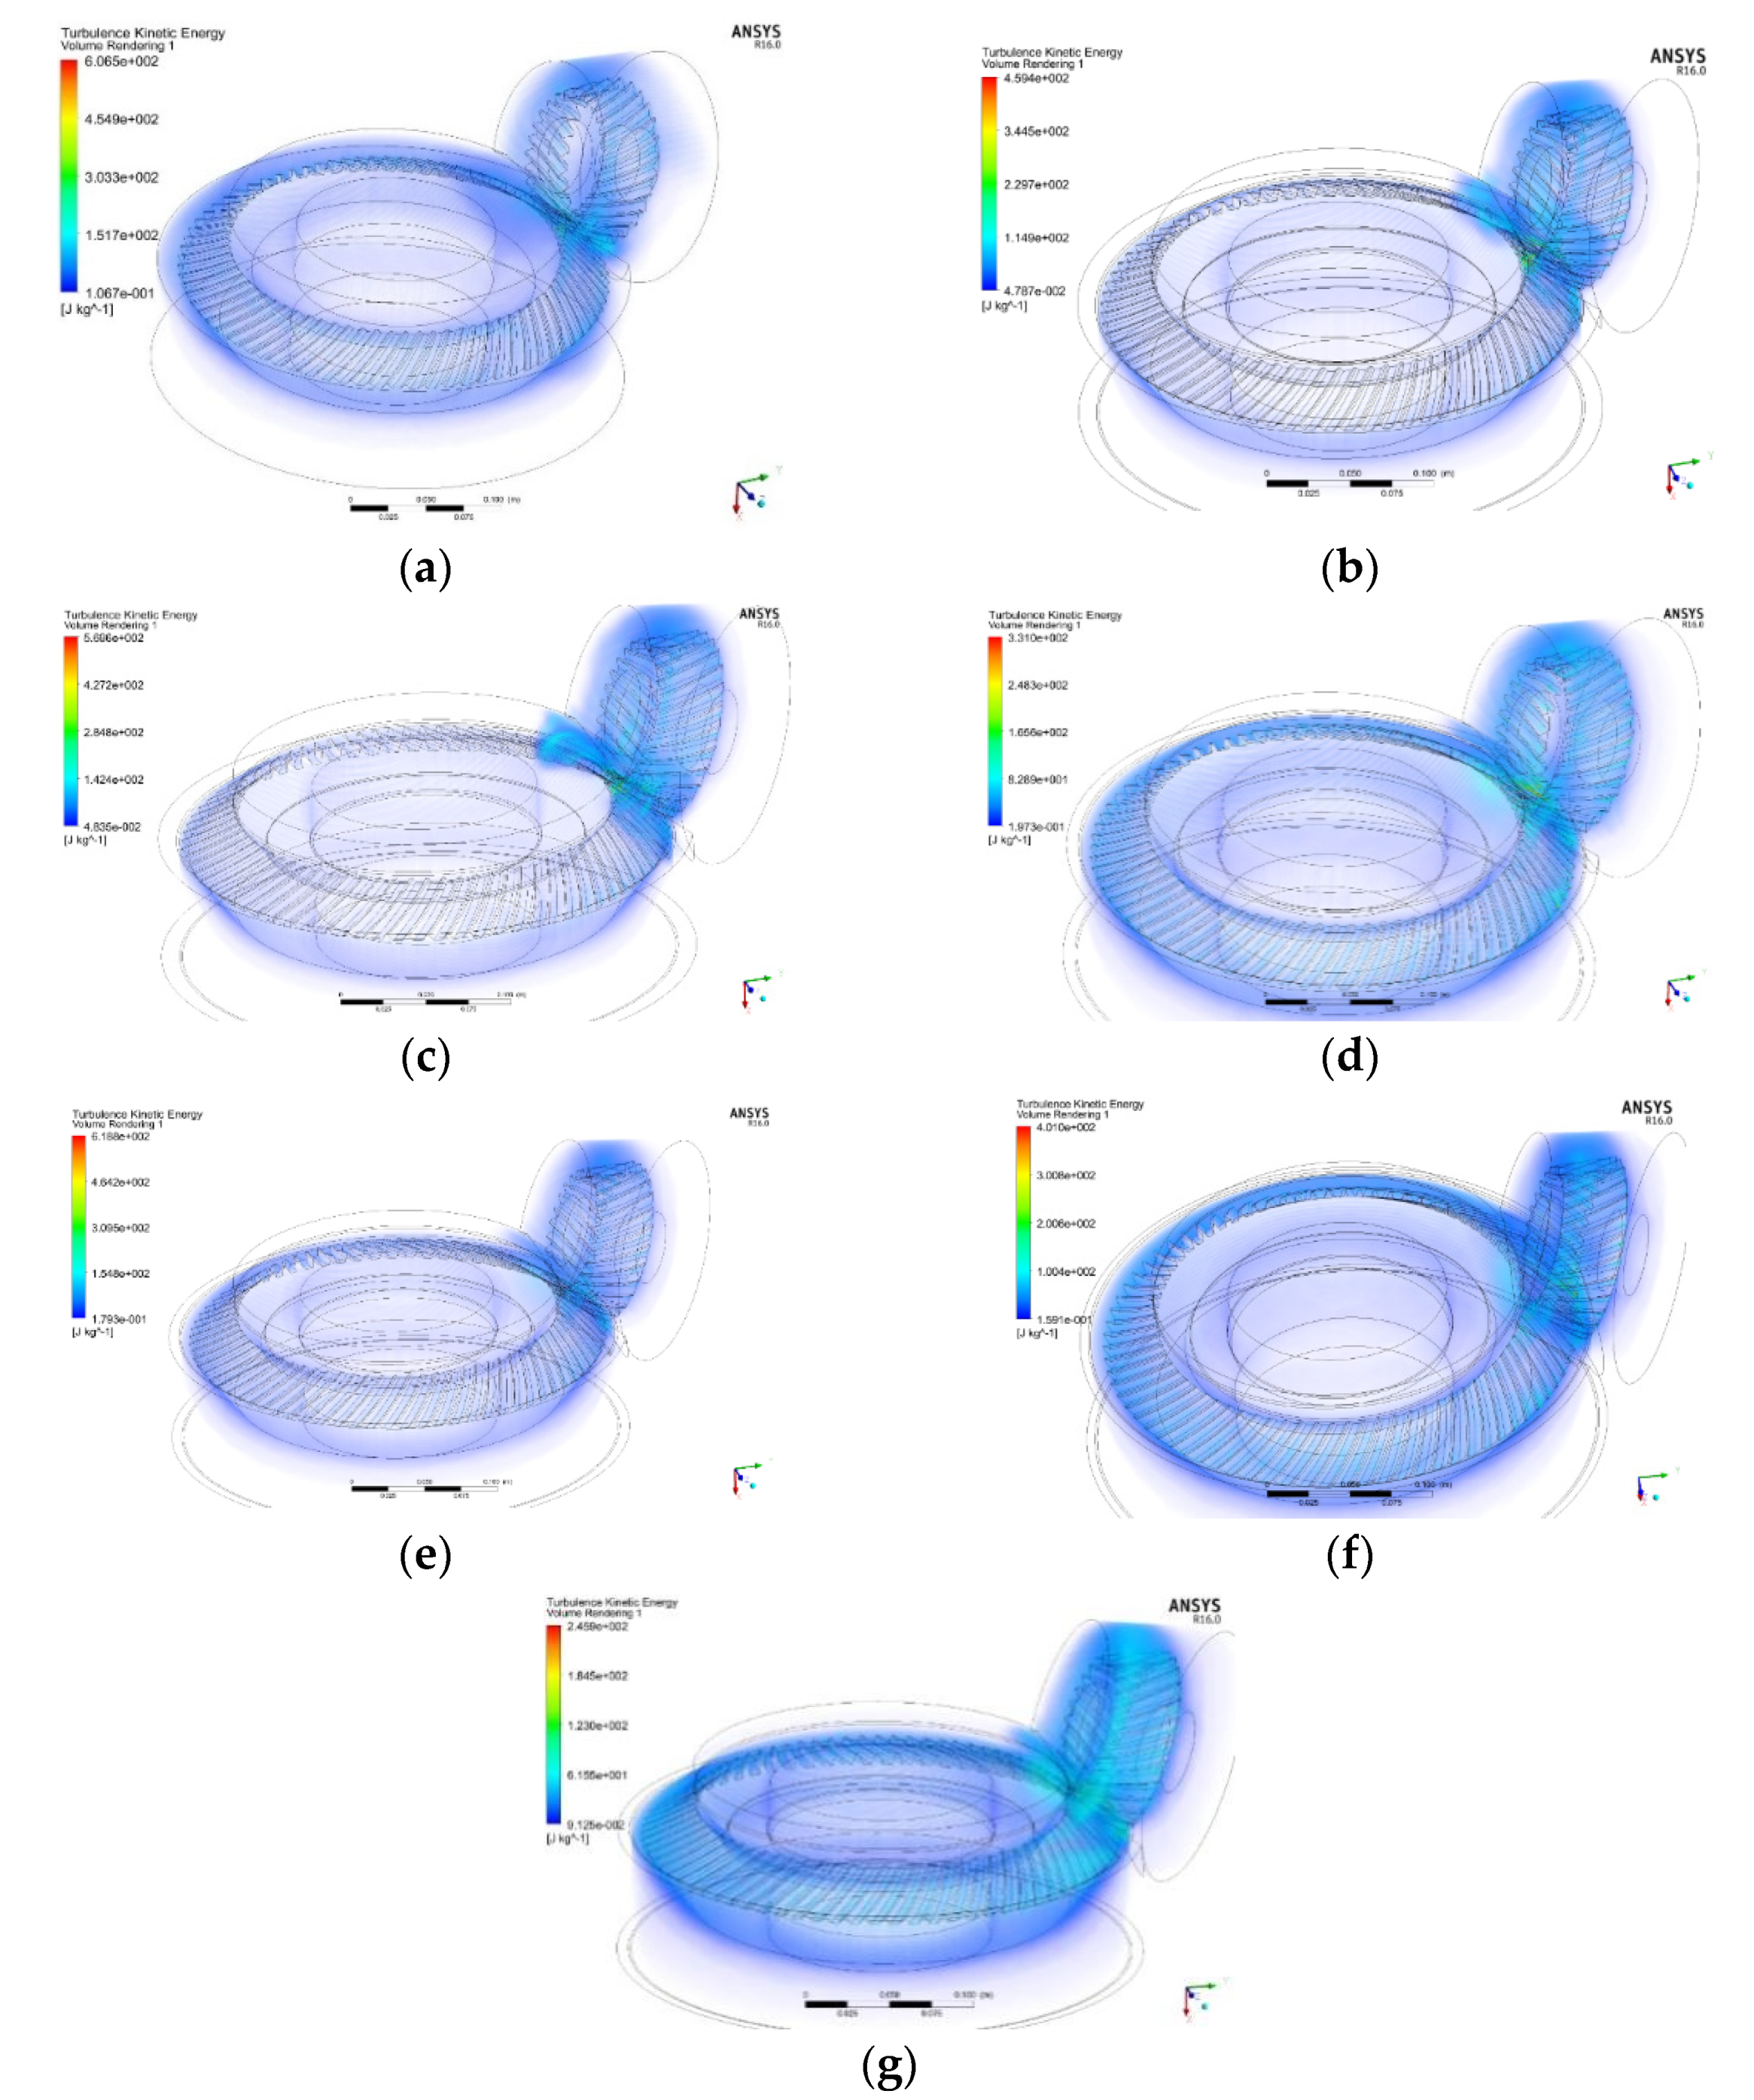
Figure 13 shows the turbulent kinetic energy cloud diagram of the gear pair flow field.
It can be seen from
Figure 13 that the average turbulent kinetic energy of the flow field under the 7 mm windshield clearance is greater than that without the windshield, and the magnitude of the turbulent kinetic energy reflects the intensity of the turbulence in the flow field. The larger the value, the greater the windage loss. Therefore, the above results show that the excessive clearance between the windshield and the gear has a negative effect on reducing the windage loss. As the clearance decreases, the average turbulent kinetic energy of the flow field near the gear tooth surface drops. Comparing the diagrams b and c or d and e in
Figure 13, it can be seen that the engagement opening angle has little influence on the turbulent kinetic energy. At the same time, it can be seen that regardless of the configuration, the turbulent kinetic energy near the engagement area is the largest in the entire flow field, which is caused by the complex boundary motion and energy exchange in the engagement area.
6. Conclusions
Based on the CFD theory, this paper adopted the CFD software and the powerful parallel computing capabilities of super cloud computers to analyze the windage power loss of SBGP under single-phase flow.
For the driven gear, the windage power loss corresponding to different windshield configurations was studied, and the changes of the turbulent kinetic energy cloud diagram of the reduction gearbox under multiple experiment configurations were analyzed. The results show that the local optimal configuration of the windshield is that the value of the windshield and the tooth surface, the large end face and the small end face are all 1 mm and the meshing opening size is 30°. In this case, the wind resistance loss of the gear pair is small.
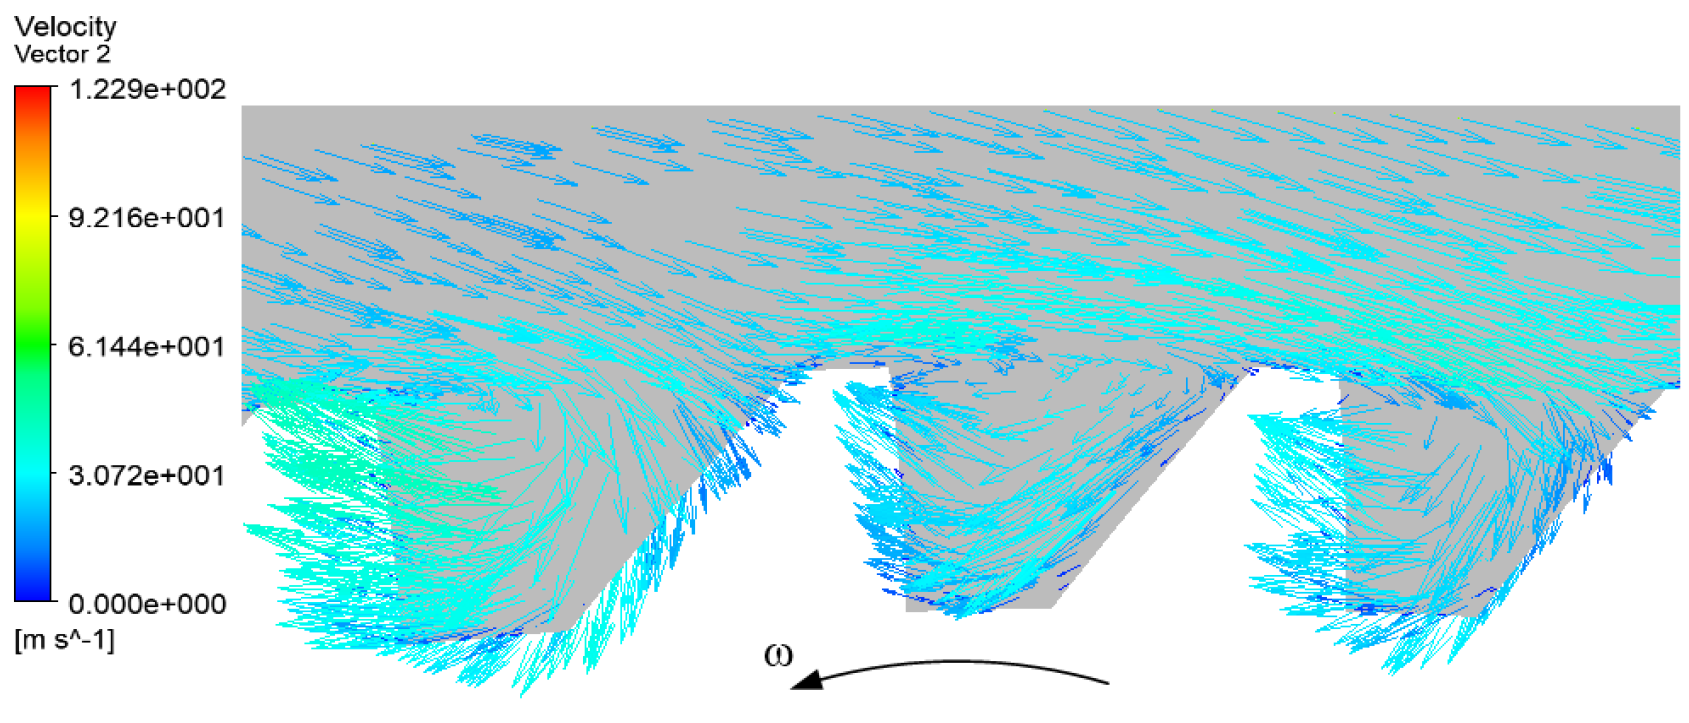
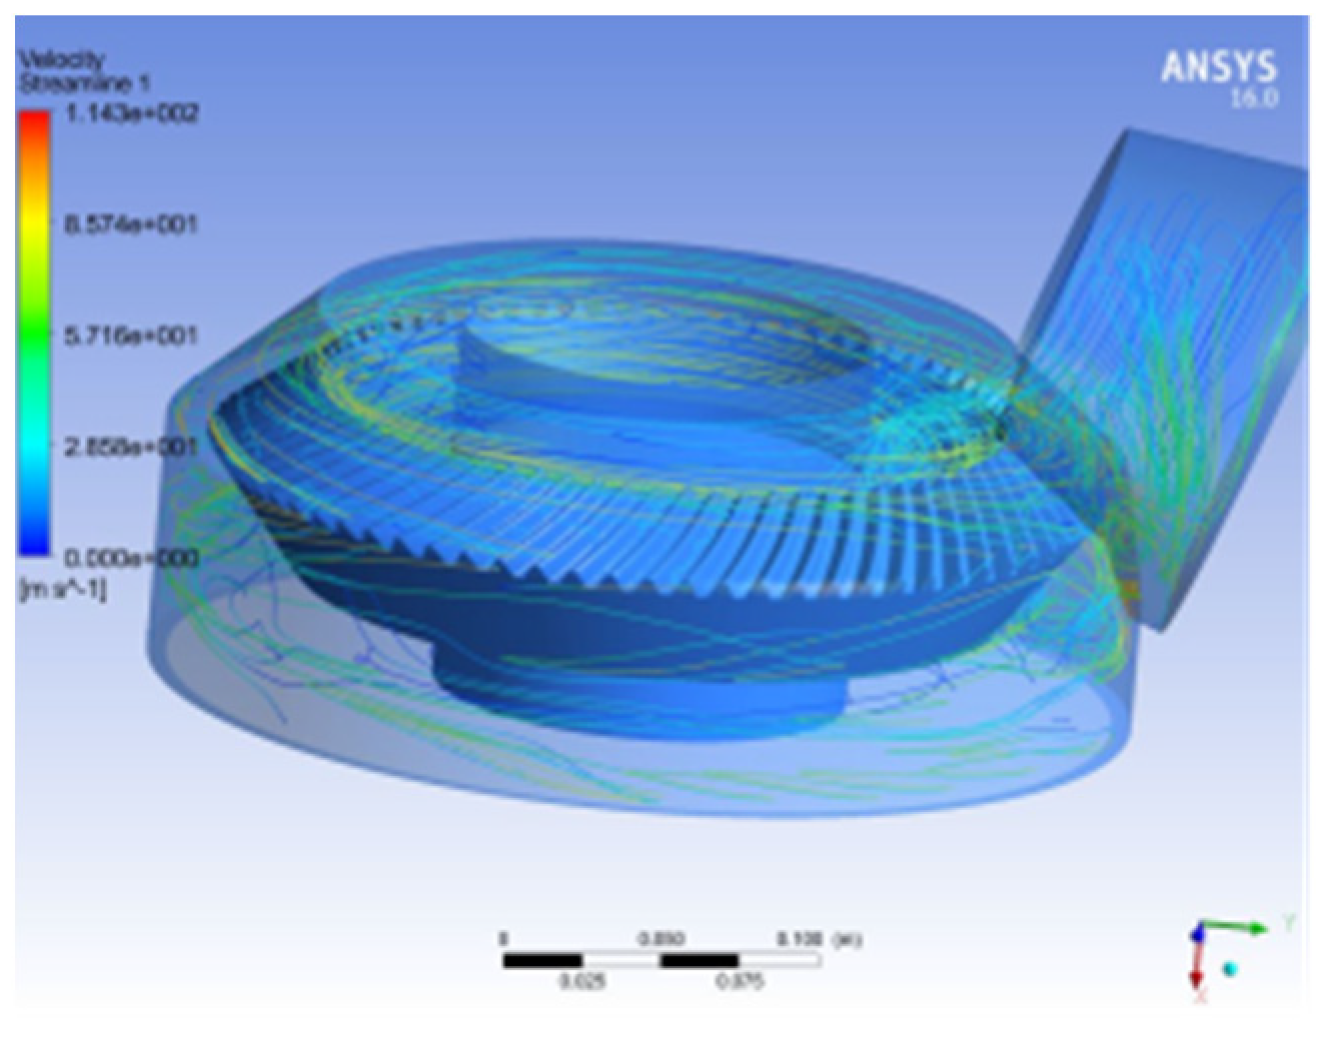
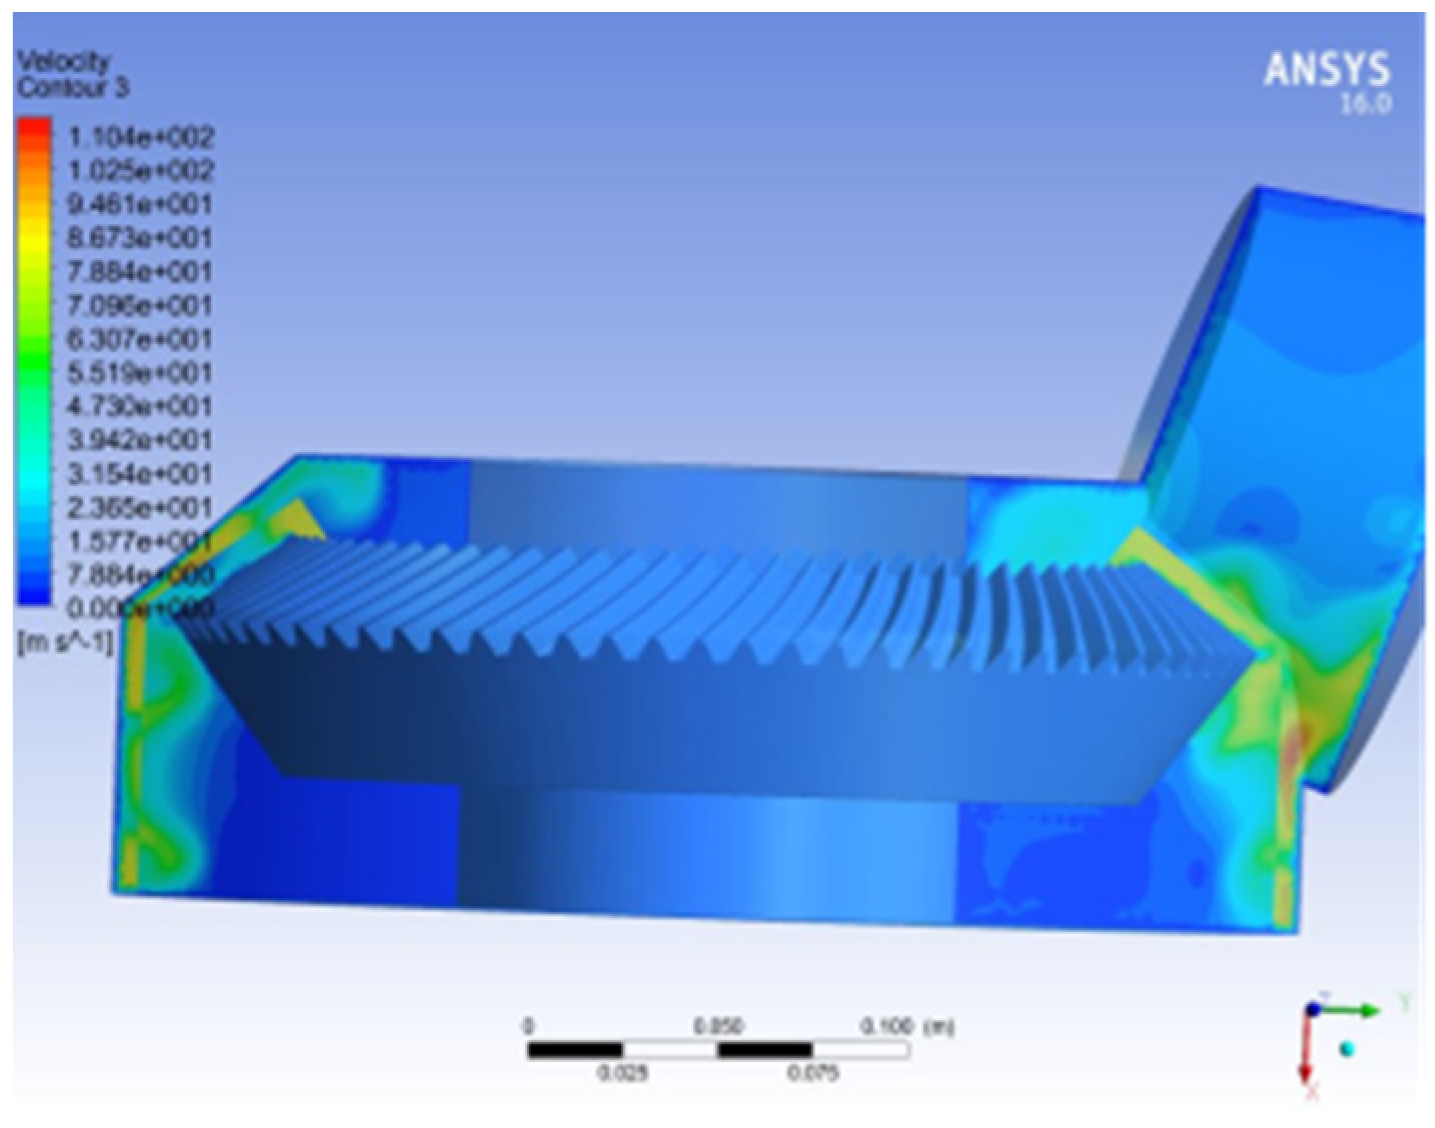
After the driven gear is equipped with a windshield, the air velocity in the fluid domain between the windshield and the gearbox is significantly reduced. As the clearance between the windshield and the gear continues to shrink, the peak velocity of the air in the flow field between the windshield and the gear increases, but the flow field area with a higher flow rate becomes smaller.
Excessive clearance between the windshield and gear has a negative effect on reducing the windage loss. As the clearance decreases, the average turbulent kinetic energy of the flow field near the gear tooth surface would decrease. Regardless of the configuration of the windshield, the turbulent kinetic energy near the engagement area is the largest in the entire flow field.
The clearance value between the windshield and the gear (including tooth surface clearance, large and small end surface clearance) and the opening of the engagement area are the key parameters that affect the windage loss. The large end clearance has the greatest influence on the windage loss, followed by the tooth surface gap, and the engagement opening and the small end clearance have the least influence. The smaller the clearance, the more obvious the effect of reducing the windage loss. Combined with the actual operating conditions, when the clearance value is about 1mm, the wind resistance loss is the minimum.


