Article

Efficient Video-based Vehicle Queue Length Estimation using Computer Vision and Deep Learning for an Urban Traffic Scenario

1
Department of Electronics and Power Engineering, Pakistan Navy Engineering College (PNEC), National University of Sciences and Technology (NUST), Karachi 75350, Pakistan
2
Division of Engineering Science, University of Toronto, Toronto, ON M5S 2E4, Canada
3
Department of Civil Engineering, University of Toronto, Toronto, ON M5S 1A4, Canada
*
Author to whom correspondence should be addressed.
Processes 2021, 9(10), 1786; https://doi.org/10.3390/pr9101786
Submission received: 2 September 2021 / Revised: 17 September 2021 / Accepted: 19 September 2021 / Published: 8 October 2021
(This article belongs to the Special Issue Advance in Machine Learning)

Abstract

:
In the Intelligent Transportation System (ITS) realm, queue length estimation is one of an essential yet a challenging task. Queue lengths are important for determining traffic density in traffic lanes so that possible congestion in any lane can be minimized. Smart roadside sensors such as loop detectors, radars and pneumatic road tubes etc. are promising for such tasks though they have a very high installation and maintenance cost. Large scale deployment of surveillance cameras have shown a great potential in the collection of vehicular data in a flexible way and are also cost effective. Similarly, vision-based sensors can be used independently or if required can also augment the functionality of other roadside sensors to effectively process queue length at prescribed traffic lanes. In this research, a CNN-based approach for estimation of vehicle queue length in an urban traffic scenario using low-resolution traffic videos is proposed. The queue length is estimated based on count of total vehicles waiting on a signal. The proposed approach calculates queue length without the knowledge of any onsite camera calibration information. Average vehicle length is approximated to be 5 m. This caters for the vehicles at the far end of the traffic lane that appear smaller in the camera view. Identification of stopped vehicles is done using Deep SORT based object tracking. Due to robust and accurate CNN-based detection and tracking, the queue length estimated by using only the cameras has been very effective. This mostly eliminates the need for fusion with any roadside or in-vehicle sensors. A detailed comparative analysis of vehicle detection models including YOLOv3, YOLOv4, YOLOv5, SSD, ResNet101, and InceptionV3 was performed. Based on this analysis, YOLOv4 was selected as a baseline model for queue length estimation. Using the pre-trained 80-classes YOLOv4 model, an overall accuracy of 73% and 88% was achieved for vehicle count and vehicle count-based queue length estimation, respectively. After fine-tuning of model and narrowing the output classes to vehicle class only, an average accuracy of 83% and 93% was achieved, respectively. This shows the efficiency and robustness of the proposed approach.

1. Introduction

The increase in road traffic due to urbanization has led to several transportation and traffic management issues, such as frequent traffic congestions and traffic accidents etc. [1,2,3]. Related research conducted under Intelligent Transportation System (ITS) helps deal with such issues and provide solutions for efficient traffic infrastructure planning and reduction in road congestions and road accidents etc. Similarly, road congestions in a city traffic require smart solutions like estimation of vehicle queue length in a traffic lane and prediction of traffic etc. [4,5,6,7,8,9].
Technological advancement in wireless communication and computing power has transformed ITS. For example, development towards connected vehicles is contributing to the implementation of next generation ITS. The connectivity in vehicles enable collection of necessary data for better traffic management and control [10]. Recent advances in computer vision and deep learning have also enabled improved vehicle annotation, detection and classification in traffic surveillance application. Moreover, large-scale deployment of surveillance cameras all over the world has shown a great potential in the collection of vehicular data. Similarly, ITS technologies such as smart roadside sensors and surveillance cameras with enhanced analytics functionalities are widely adapted around the world [3]. These traffic cameras can be used independently or if required can also augment the functionality of other smart roadside sensors to effectively estimate queue length at prescribed traffic lanes.
Vehicle queue length on the signalized intersection is defined as the distance from the stop line to the tail of the last vehicle stopped in any traffic lane while the signal is red during one signal cycle. Vehicle queue length is an important parameter to determine traffic density in traffic lanes so that possible congestion in any lane can be minimized. It is also important for traffic optimization on a signal in terms of prediction of traffic, intersection delay and travel time etc. [11]. Figure 1 shows a random vehicle queue at a traffic intersection. Vehicle queue length information is generally extracted by using fixed roadside sensors like loop detectors, pneumatic road tubes, radars and in-vehicle sensors like GPS etc. The roadside sensors such as loop detectors are promising, however, their installation and maintenance costs are comparatively higher. Their installation also requires a lot of traffic disruption. Similarly, magnetic sensors can easily get affected by temperature and humidity. Radar sensors are very accurate but their main disadvantage is high exposure to electromagnetic interferences. Compared to these sensors, traffic surveillance cameras can be used effectively to determine the presence and location of vehicles, queue length, flow rate and occupancy across several traffic lanes etc.
In this research work, a state-of-the-art CNN-based vehicle detection model is used to estimate the queue lengths of vehicles (particularly cars) in signalized traffic lanes. Using the proposed model, a fairly accurate estimation of vehicle queues for dense urban traffic can be made without any on-site camera calibration. The major contributions of the paper are highlighted as follows:
  • A detailed comparison of deep learning architectures including YOLOv3, YOLOv4, YOLOv5, SSD, ResNet101, and InceptionV3 with inexpensive training dynamics for vehicle detection.
  • Proposed method for estimation of vehicle count-based queue length using images obtained from low-resolution traffic surveillance cameras.
  • Selection of an application specific dataset with a fixed far-field camera view for better estimation of queue lengths while also considering the depth of a queue and camera angles.
The remainder of the paper is organized as follows: Section 2 provides literature review regarding queue length estimation. Section 3 describes the methodology adopted to estimate the queue length. Section 4 provides the implementation of the proposed model in detail. Section 5 discusses and demonstrates the effectiveness of the proposed method. Finally, Section 6 concludes the paper and presents a future research direction related to the proposed research.

2. Literature Review

Several works in the literature are available which present efficient models for queue length estimation. A common approach is to develop a mathematical model using data collected from roadside or in-vehicle sensors. Based on the methodology and type of sensors used, the literature on queue length estimation and related tasks can be categorized broadly into three groups.
  • Estimation using Fixed Location Sensors. These include fixed sensors such as loop detectors etc.
  • Estimation using Mobile Sensors. These include sensors installed in vehicles such as Global Positioning System (GPS) etc.
  • Estimation using Vision based Sensors. These include processing of traffic camera feeds using Computer vision tools.
Lee et al. determined the number of queued vehicles in each lane with the help of loop detectors [12]. The simulations used Kalman filter to find traffic volume in each lane. Wu et al. presented an approach for queue length detection using roadside LiDAR data [13]. The proposed approach achieved an average of 98% accuracy at various sites. Ki An et al. devised a numerical model for queue length estimation at a metering roundabout [14]. The framework used two roadside detectors and traffic signal for estimation of queue lengths. The ground-truth queue length information was obtained from two different drones. The ground truth was then used to calibrate and validate the model. The model performance was analyzed using the R 2 test and achieved an 83% value. Skabardonis et al. proposed an intersection queue length estimation method using loop detector and traffic signal data with 30 s intervals. Using this approach accurate results were reported for travel time estimation [15].
Li et al. proposed a cycle-by-cycle queue length estimation approach using probe data obtained from vehicles participating in traffic flow [16]. The results were benchmarked compared to paper from Ramezani et al. [17] and reported improved accuracy under low penetration rate. Blokpoel et al. compared different queue length estimation approaches based on Cooperative Awareness Messages (CAM) received from vehicles [18]. The GPS information from these vehicles is easily obtained through CAM instead of relying on expensive equipment. The overall approach showed methods to improve queue length detections with this obtained data. Wu et al. proposed queue length estimation based on data obtained from RFID detectors [19]. Instead of relying on incoming traffic flow, the authors exploited the queue delay of individual vehicles to measure queue length at an intersection. Authors reported satisfactory results using this approach. Rompis et al. performed lane identification and queue length estimation using probe vehicle data [20]. Using the optimal Bayes Rule model, promising results were obtained for lane identification which was then used for queue length estimation.
Okaishi et al. proposed a real-time vehicular queue length measurement system for intersections based on camera feeds [21]. The proposed system used frame differencing to analyze motion in focused areas. When no motion is observed, vehicles in that area are detected using CNN based SSD networks. The system works with video feeds obtained from stationary cameras. Similarly, Zanin et al. proposed a system for real-time measurement of vehicle queue parameters [22]. It is based on vehicle presence detection and movement analysis in a set of videos acquired from stationary traffic cameras. The system can then detect queues in lanes of interest. Albiol et al. presented an approach to estimate traffic queue lengths in real time by collecting and evaluating low-level features such as corners to detect the presence of vehicles [23]. After that, features are classified as either moving or static. The algorithm only requires locations of lane masks and starting point of queues etc. Shirazi et al. has also presented a tracking method for estimation of queue lengths and waiting time of vehicles at junctions [11]. Background subtraction technique was used to detect all the moving vehicles in the prescribed motion area. The vehicles were continuously tracked until stopped. The total number of vehicles that cross the motion area helps with estimation of queue length. Though the proposed system is unable to detect queue lengths beyond this motion area. Li et al. collected traffic images from custom-installed cameras, which constitute the training and testing sets for YOLO-based models [24]. The training was performed using transfer learning with initial parameters loaded from a pretrained model followed by fine-tuning on the obtained traffic images. The authors reported network improvements by converting an 80-classes classifier into a binary classifier. The final improved model achieved an average accuracy of 90% in detecting vehicles from traffic flows of different densities.
In summary, there is limited research on deep learning and vision-based queue length estimation at signalized intersections. The reviewed literature presents satisfactory results on a single intersection and is not applicable on large network of intersections. Similarly, vehicle detection and tracking in different conditions such as low-resolution traffic feeds, varying illumination conditions, or loss of tracks for long waiting vehicles still need enhancement.

3. Research Methodology

The overall proposed queue length estimation pipeline is shown in Figure 2. Details of the methodology are provided in ensuing paragraphs.

3.1. Definition of Queue Length

Queue length is the distance from the stop line to the tail of the last vehicle stopped in any traffic lane while the signal is red during one signal cycle. It can be measured using following two approaches:
  • Pixel-based Queue Length. It is based on calculating the actual pixel length of each vehicle detected in a traffic lane. This requires understanding of the varying pixel length of each vehicle as it appears in the frame and looms in towards the stop line. Measurement of this varying pixel length at an arbitrary location in a traffic lane requires knowledge of on-site camera calibration information.
  • Vehicle Count-based Queue Length. It is based on calculating the number of vehicles. The queue length is calculated by multiplying the detected vehicle count with an average vehicle length of approximately 5 m. This estimation is done while keeping in view the different type of vehicles such as cars, trucks, and buses etc. This method doesn’t require camera calibration information.
Due to no requirement of camera calibration, vehicle count-based method is selected for queue length estimation. The ground truth of queue length in each frame was established by manually adding length of all the visible vehicles stopped at a signalized intersection in each traffic lane. Since the location of vehicles is defined by bounding boxes, pixel distance between the front and last stopped vehicle in the queue is therefore used to detect the queue in a traffic lane under consideration. For easy representation, detection of queue is shown as red line in Figure 3. As explained earlier, the queue length is then estimated by multiplying the number of vehicles (in the detected queue) by 5 m. Subsequently, queue length is measured for each traffic lane. Traffic lanes and the stop line are labeled manually and are shown as green lines in Figure 3. Stop line is used as the start of the queue in all traffic lanes. The vehicle that stops after crossing the stop line is not considered in queue length estimation. Identification of stop vehicles on stop lines is performed through Deep Simple Online and Realtime Tracking (Deep SORT) [25]. Deep SORT uses the appearance features to track objects in longer periods of occlusion. It performs tracking by assigning unique tracking ID to each identified vehicle (as shown in Figure 4a). The stopped vehicle in a traffic lane and at a stop line is identified by finding the movement of that unique vehicle across consecutive frames. When any vehicle does not show any motion in two consecutive frames, it is considered as a stopped vehicle. Subsequently, queue is detected, and queue length is calculated (as shown in Figure 4b).

3.2. Identification of Suitable Video Streams and Generation of Dataset

Originally, Toronto traffic camera feeds hosted at Toronto Open Data [26] were selected for this research. The portal includes images from hundreds of traffic cameras in the Toronto city area. Five camera feeds were selected, where each camera has a unique viewing angle to the traffic lanes (see Appendix A Table A1). The purpose of selecting five different cameras was to have unique and varying viewing angle feeds so that there is no bias in the results and the performance of object detection models can be assessed accordingly. However, the camera feeds provided by Toronto Open Data feed were updated after every minute. Due to the missed frames, this data was not sufficient to extract related information for queue length estimation. Moreover, at some places the camera views were also changing overtime. Therefore, training on this data with respect to queue length estimation was not possible. Though the video feeds from this dataset were used for studying performance of vehicle detection (see Appendix A Table A1). Subsequently, we selected hour-long traffic camera feeds from traffic intersections in Burlington, Ontario for queue length estimation. The Burlington data also offers scenes of different depth and provides opportunity to explore the effectiveness of this research in different queue length scenarios. The dataset videos were obtained in the form of frame sequences (.seq file), with a resolution of 320 × 240 pixels. Citilog software was used to open these set of videos. To convert the videos into a format acceptable by the OpenCV framework, videos were captured using a screen capturing software. The converted format has 25 frames/second, which is slightly different from frames/second of the original videos. However, as it is not required to output queue length at very small-time intervals (i.e, fraction of seconds, for instance), using these recorded low frame rate videos is acceptable for evaluating queue length at or within every second. Three videos (i.e., B30S, B20M and B34M with video durations 34 min, 20 min and 30 s respectively) from the pool of videos were selected. Each video represented a unique camera angle or lighting condition at intersections. Some of the cameras are tilted sideways, which gives a tilted view of the driveway. Some videos are captured in winter conditions with snow on the ground. Similarly, queue lengths of upto 25 m, 60 m, and 80 m are observed in these videos respectively. An example frame from a selected video is presented in Figure 5. The left lane shows the longest queue of 5 vehicles in that frame with queue length of 25 m. Camera viewing angle was mostly frontal for all videos, which at times causes complexity in vehicle detection due to partial occlusion etc. Table 1 shows a specification comparison of some Burlington videos.

3.3. Dataset for Transfer Learning

To avoid using identical images in transfer learning, we separated the images which were not used for queue length evaluation. The images had traffic lanes of physical lengths between 30 m to 80 m approximately, which covered different queue length scenarios in final selected videos. A total of 524 frames from Burlington video not used in evaluation of the queue length were then manually picked. Frames were then manually labeled as “vehicle” with their coordinates marked according to the specified format for training of YOLO models. Labeling was done with an open-source tool LabelImg [27]. Figure 6 shows an example of a labeled traffic image where bounding boxes were drawn manually around the vehicles in the image. Coordinates of the bounding boxes can be recorded by the tool and exported to the YOLO labeling format. A python script was written to convert these labels into the format suitable for the YOLO implementation. After this, the YOLOv4 model was trained with a single output class (i.e., vehicle) with these 524 frames. A 9:1 Train-Validation split ratio was selected to maximize learning without risking the overfitting problem.

3.4. Selection of Models

Object detection is one of the fundamental computer vision problems which provides a semantic understanding of sample images. It aims at locating and recognizing the objects in any image and then generates regional proposals with a confidence of existence [28]. There are several CNN-based object detection architectures available off the shelf that are used for object detection and have very high reported accuracies. In [29], the authors have implemented three detection architectures Faster R-CNN, R-FCN, and SSD, to compare the accuracy, speed, and memory utilization for any given application. The results revealed that, for fewer proposals, Faster R-CNN had the highest speed, with less inaccuracy. Another popular object detection architecture proposed by authors in [30] is You Only Look Once (YOLO). The authors have proved that YOLO was the latest approach for object detection, which has outperformed various architectures. YOLO uses only one evaluation to predict the bounding boxes and class probabilities. YOLO has so far received five upgradations, with YOLOv5 being the latest one and having best performance. YOLO is often used for various vehicle related recognition tasks and has shown significant improvements in terms of processing time and accuracies [31,32,33,34].
In this paper YOLOv3, YOLOv4, YOLOv5, SSD, ResNet101, and InceptionV3 were used for evaluating object detection performance on selected images from Toronto Open data. YOLO models implemented in Keras with TensorFlow backend were used to detect vehicles in the selected traffic camera images. A pre-trained object detection model has the capacity to predict 80 Common Objects in Context (COCO) classes in one image that is passed through the model pipeline. All non-vehicle classes being irrelevant to the research were not considered i.e., only the prediction classes of interest were selected to be displayed in output images. Moreover, the confidence level of predictions was also lowered to show maximum vehicle detection results. Appendix A Table A1 shows the output of a pre-trained YOLO model on selected traffic camera images. The other models were also pre-trained on the same selected camera images. The model and inference pipeline are available from an official TensorFlow open-source repository. Appendix A Table A2 shows the comparison of all these models. A YOLO model clearly performed better than other object detection models of choice. The SSD model failed to recognize most of the vehicles in the images, while ResNet and Inception performed either equal to or less accurately than the YOLO models. Though time required to perform single image inference is much longer for the ResNet and Inception models. Since faster inference speed is an important design criterion in real-time queue length detection, therefore it was decided to choose YOLO as the object detection model in our research.
The inference was then performed on the images from Burlington traffic videos using the same 80-classes pretrained YOLOv3, YOLOv4, and YOLOv5 models. While using different YOLO models, vehicle detection performed well under varying camera angle. The same is shown in Appendix A, Table A3, Table A4 and Table A5. However, the pre-trained models failed to recognize vehicles in the far end of traffic lanes. It also failed to recognize vehicles that are stacked between queues of vehicles. Therefore, transfer learning was considered to improve the vehicle detection accuracy for the YOLO models. Both YOLOv4 and YOLOv5 have similar performance (as shown in the tables mentioned above). Similarly, Deep SORT implementation was also compatible with YOLOv4 implementation. Therefore, finally, YOLOv4 was used to perform the experimentation.
Since the object detection predictions for only vehicle classes are being used in queue length calculation, therefore, all vehicle classes were considered as one class during labeling images for transfer learning. Instead of predicting 80-classes in the model, having a single class object detection model simplifies the inference process as there is no need to hide other classes in final output. It is also possible to perform transfer learning on five vehicle classes. However, given the unbalanced image data (i.e., cars appear more often than trucks, buses, or motorcycles in traffic images), training a single-class object-detection model is more reasonable. As shown in Figure 7, significant improvement in vehicle detecting accuracy can be achieved after applying transfer learning for a single-vehicle class to the original object-detection model.

3.5. Performance Evaluation Methods

The final accuracy for queue length estimation in each video segment at every second is calculated while considering following three performance evaluation methods. Let q t i be the prediction for the ith frame within the tth second, and n being the number of frames per second:
  • Queue Length Estimated at Each Second. The first frame at every second is sampled and is an inference for queue length
    Q 1 ( t ) = q t 1
  • Average Queue Length Estimated at Each Second. All frames within a second are inferences, and we calculate the average of queue lengths in all frames
    Q 2 ( t ) = 1 n i = 1 n q t i
  • Maximum Queue Length Estimated at Each Second. All frames within a second are inference, and we choose the longest predicted queue length among all frames
    Q 3 ( t ) = m a x ( q t 1 , q t 2 , , q t n )

4. Implementation

4.1. Hardware and Software Configuration

The experimentation is performed on a laptop with core i5-6300hq CPU, 8 GB of RAM and GTX960M GPU with 2 GB VRAM. The versions of Python and the software framework used are Python 3.5.2, TensorFlow 2.2.0, and OpenCV 3.4.2. Training of YOLO model is done using Google Colab computing platform with Intel Xeon 2 Cores CPU, 12 GB of RAM and Nvidia Tesla K80 GPU with 12 GB of VRAM. The versions of Python and the software framework used are Python 3.6.7 and TensorFlow 2.2.0 respectively.

4.2. Code Implementation

The queue length inference and model training software pipelines are built on top of an open-source YOLOv4 implementation with TensorFlow. To perform the queue length inference, videos are processed using the OpenCV library and are fed to the object detection model frame by frame. Later, these videos are passed through Deep SORT for identification of stopped vehicles on stop lines. Subsequently, queue length for every traffic lane is calculated based on the detection model output and set rules regarding queue length definition. While doing inference using the pre-trained 80-classes YOLOv4 model, the output classes are restricted to show only vehicle classes (i.e car, truck and bus etc). Calculated queue lengths are then exported to Excel.

4.3. Training of a New Object Detection Model

Fine-tuning allows latest object detection models to train new object categories with reduced training data. In this research, the 524 images are used to train a single “vehicle” class. To perform fine-tuning, firstly, the 80-classes COCO pretrained YOLOv4 model was selected as the base model. The fine-tuning process makes use of the features that are already extracted in the pre-trained model. It then modifies the original fully-connected output layers to reflect the result intended for the new network. The training process of a new YOLOv4-based single class object detection model is to unfreeze the weights of all model layers and fine-tune all the weights in the entire YOLOv4 model. After early stopping conditions for training are met, the final model can be obtained and used to perform queue length inference for traffic videos.
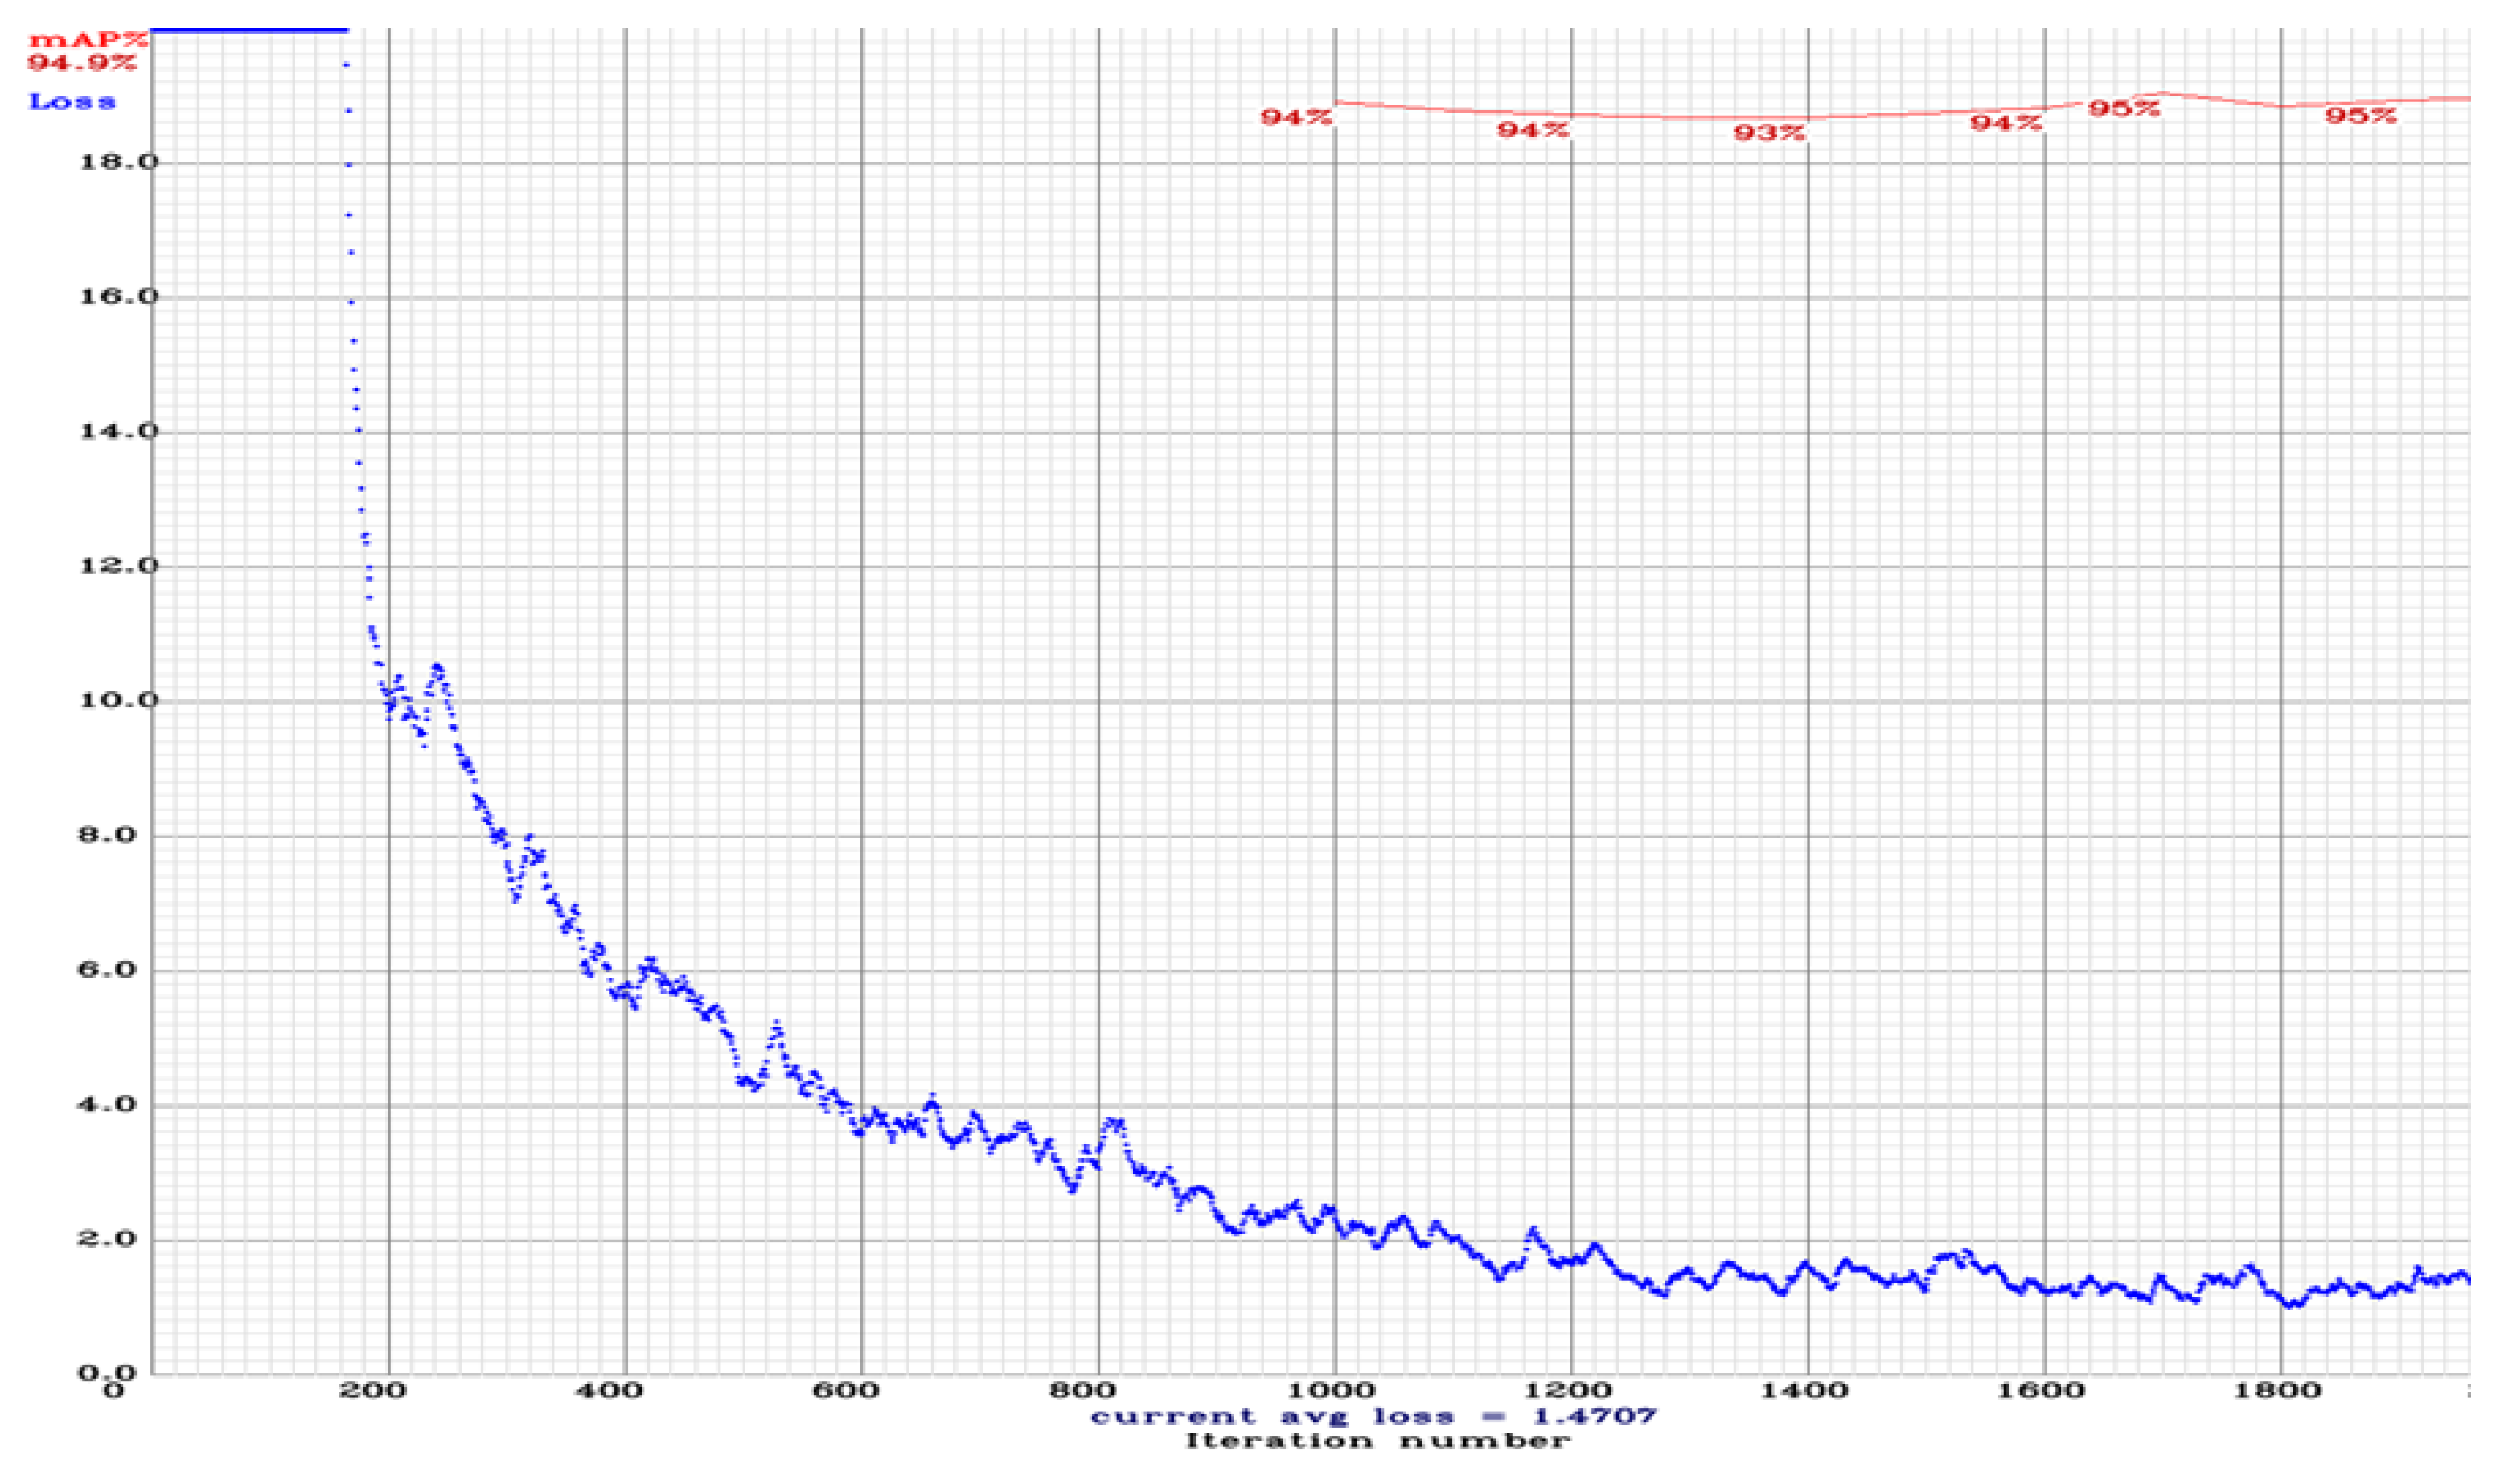
Training records are logged and visualized with a custom python code. The training loss (graph shown at Figure 8) reduced from 20.0 to 1.9 after fine-tuning 1000 iterations of weights. The loss stabilizes at 1400 iterations with slight fluctuations. The Mean Average Precision (mAP) starts at 1000 iterations from 94%. The mAP falls to 93% at 1400 iterations, while achieving the highest mAP of 95% at 1700 iterations. Though the train and test sets are randomly sampled, a slight increase in training loss near the end indicates a possibility for overfitting. However, the object detection model still outperforms the original vehicle detector, as shown in Section 5. Due to no major change in loss or accuracy after 1700 iterations, the model was stopped to avoid further overfitting. The final model used for queue length inference had around 1900 iterations of fine-tuning on all weights of the model, with the mAP fixed around 93% to 95% while the training loss remained at 1.47 on average.

5. Results and Discussion

The accuracies were compared for selected videos both before and after applying fine-tuning. As discussed in Section 3.5, there are three different performance evaluation methods for queue length estimation. The method 1 calculates individual queue length at each frame. While method 2 and 3 takes the average and maximum queue lengths obtained from all frames in a second, respectively. The method 3 is preferred for cases where there is a chance of vehicle misdetection. Figure 9 shows an accuracy comparison (for each selected video ) between three different performance evaluation methods discussed in 
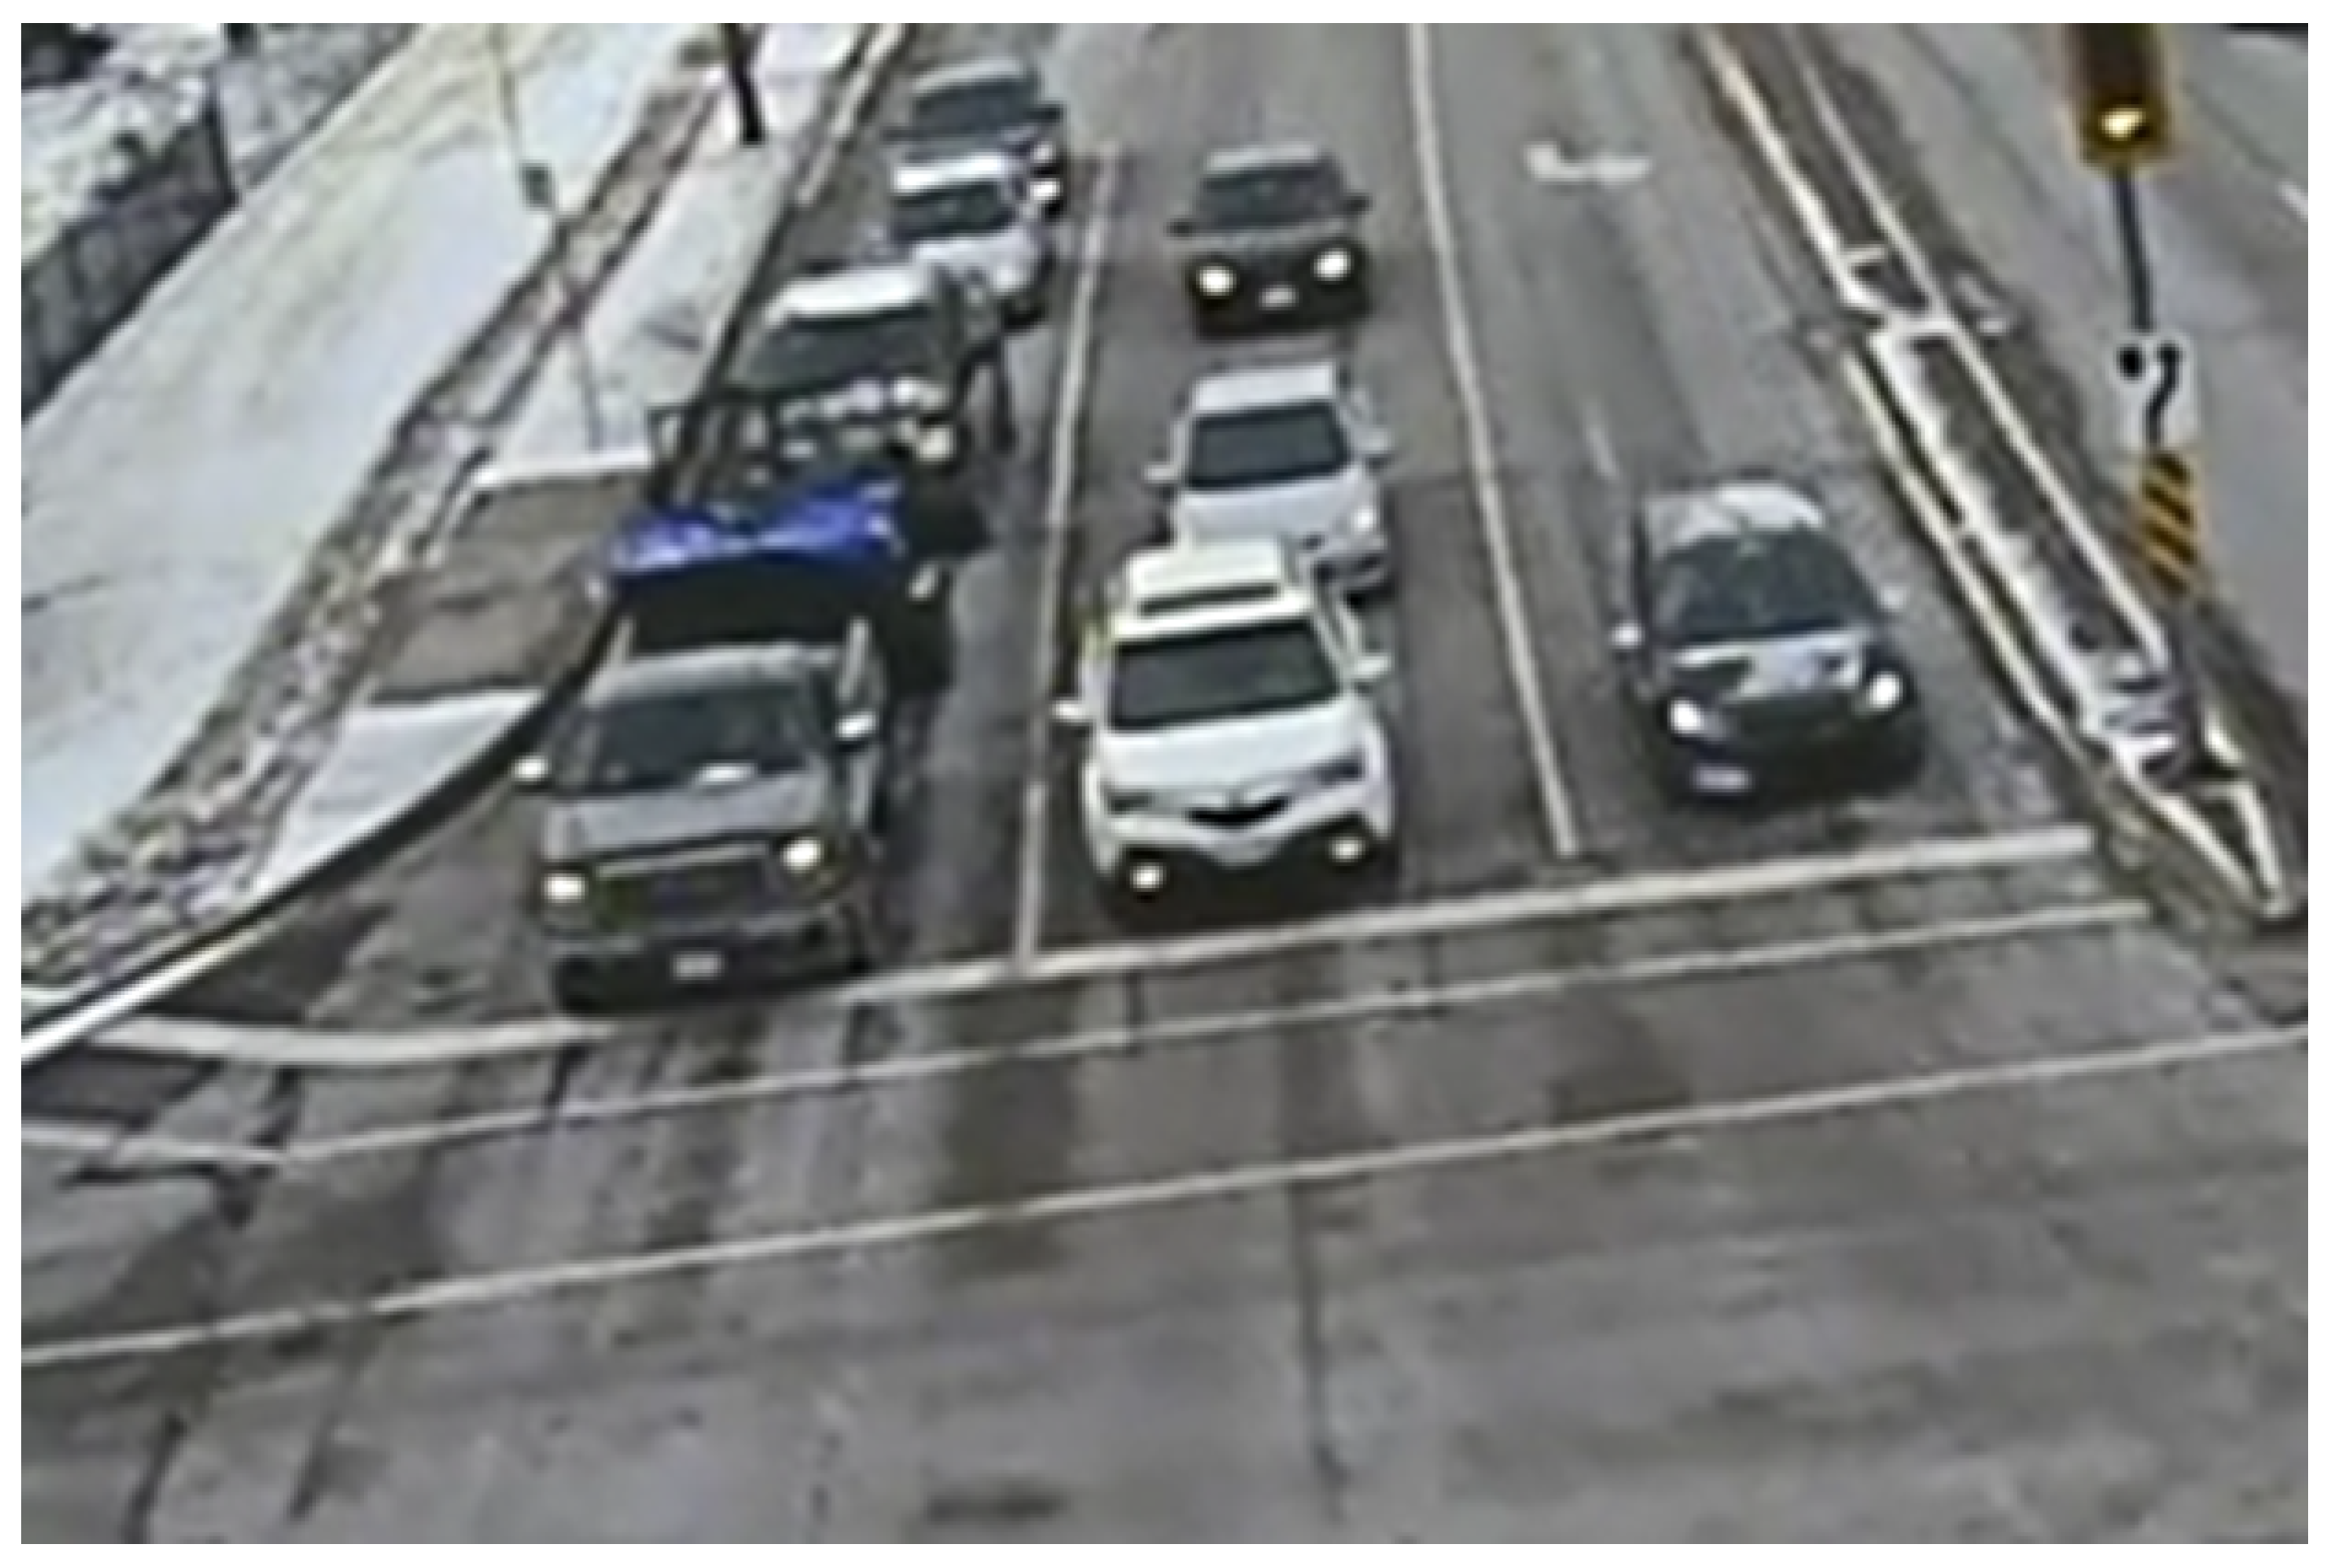
Section 3. The comparatively low performance can be seen in B34M video. The possible reason could be that the pretrained YOLOv4 model sometimes fails to detect vehicles in the far end of a lane or when the vehicles are stacked together. The B20M video has frames where most vehicles are at the far end, which made vehicle recognition harder because of blurry vehicle appearance and background occlusions. Since these vehicles are not always detected, therefore, maximum queue length evaluated using method 3 performed comparatively better than method 1 and 2.
Table 2 and Table 3 show the improvement of queue length accuracies in terms of vehicle count and vehicle count-based queue length estimation. Using a pre-trained 80-classes YOLOv4 model, an overall accuracy of 73% and 88% was achieved for vehicle count and vehicle count-based queue length estimation, respectively. After fine-tuning of model and narrowing the output classes to vehicle class only, an average accuracy of 83% and 93% was achieved, respectively. The results for each video have been averaged across all lanes and all queue length measuring methods. The greatest improvements are seen at 30% after applying fine-tuning implementation on sampled videos. Most of the videos are significantly improved, except for the vehicle count accuracies in B20M video. The improvements are result of enhanced vehicle detection in the traffic videos. Fine-tuning enabled the YOLOv4 network to recognize vehicles which were small or had an appearance which could easily blend into part of the road, as shown in Figure 10. Similarly, the improved model also detects cars stacked in queues that were not picked up by the original network, particularly in B34M and B30S videos. Confidence scores assigned to detected vehicles are also observed to be much higher than before. Nevertheless, there is still room for improvement as the vehicle count accuracies for the B20M video are much lower than the other two videos. If video frames that have the same stacked vehicle density are used in fine-tuning labels, the recognition result can improve.

6. Conclusions and Future Work

In this paper a CNN-based approach for estimation of vehicle queue length in an urban traffic scenario using low-resolution traffic videos is proposed. Queue length is the distance from the stop line to the tail of the last vehicle stopped in any traffic lane while the signal is red during one signal cycle. The queue length is calculated by multiplying the detected vehicle count with an average vehicle length of approximately 5 m. This estimation is done while keeping in view the different type of vehicles such as cars, trucks, and buses etc. The results have shown a decent performance for estimation of vehicle count and queue length based on vehicle count. Identification of the stopped vehicles is performed using Deep SORT which defines the start of a lane. A detailed comparative analysis of different vehicle detection models including YOLOv3, YOLOv4, YOLOv5, SSD, ResNet101, and InceptionV3 was performed. Based on this analysis, YOLOv4 was selected for queue length estimations. It is shown with experimentation that CNN-based architectures are effective in improving vehicle detection accuracies. It is also proved that fine-tuning is highly effective in improving the accuracies even for low-resolution images.
As part of future work, the research can be further improved by development of advanced deep learning architecture capable of performing faster and better inferences using the same low-resolution videos. Super-resolution techniques can also be utilized to improve the image resolution and overall detection accuracies. This will further improve the estimation of vehicle queue lengths at signalized intersections.

Author Contributions

Conceptualization, B.A.; Data curation, Q.C.; Formal analysis, M.U.F.; Investigation, Q.C.; Methodology, M.U.; Project administration, M.U.; Supervision, R.H.R.; Writing—original draft, M.U.; Writing—review and editing, M.U.F. All authors have read and agreed to the published version of the manuscript.

Funding

We acknowledge partial support from National Center of Big Data and Cloud Computing (NCBC) and Higher Education Commission (HEC) of Pakistan for conducting this research.

Institutional Review Board Statement

Not applicable.

Informed Consent Statement

Not applicable.

Data Availability Statement

All the relevant data is publicly available to download and can be accessed at the following link: https://drive.google.com/drive/folders/1DI7-81g92__bdaJrSolHrCVUmBB86wKo?usp=sharing (accessed on 1 September 2021).

Conflicts of Interest

The authors declare no conflict of interest.

Appendix A

Table A1. Output of an original pre-trained YOLO model on selected traffic camera images obtained from Toronto Open Data. Cars, buses and trucks marked as purple, green and red colors respectively.
Video SampleOriginal ImageModel OutputTerminal OutputIncorrect Detections
Loc8004w Processes 09 01786 i004 Processes 09 01786 i005 Processes 09 01786 i006
  • A car and a bus were not detected.
  • Car on the right was also detected as a truck.
  • Three incorrect detections.
Loc8011n Processes 09 01786 i007 Processes 09 01786 i008 Processes 09 01786 i009
  • Smaller cars were not detected.
  • Two incorrect detections.
Loc8018e Processes 09 01786 i010 Processes 09 01786 i011 Processes 09 01786 i012
  • One car in shade was not detected.
Loc8037n Processes 09 01786 i013 Processes 09 01786 i014 Processes 09 01786 i015
  • Two cars were not detected.
Loc8043w Processes 09 01786 i016 Processes 09 01786 i017 Processes 09 01786 i018
  • Some false detections at the end of the queue.
  • Four more cars were detected.
Table A2. Comparison of vehicle detection models on selected traffic camera images obtained from Toronto Open Data. Cars, buses and trucks marked as purple/cyan, green/beige and red colors respectively.
Video SampleYOLO ResultsSSD ResultsResNet ResultsInception Results
Loc8004w Processes 09 01786 i019 Processes 09 01786 i020 Processes 09 01786 i021 Processes 09 01786 i022
Loc8011n Processes 09 01786 i023 Processes 09 01786 i024 Processes 09 01786 i025 Processes 09 01786 i026
Loc8018e Processes 09 01786 i027 Processes 09 01786 i028 Processes 09 01786 i029 Processes 09 01786 i030
Loc8037n Processes 09 01786 i031 Processes 09 01786 i032 Processes 09 01786 i033 Processes 09 01786 i034
Loc8043w Processes 09 01786 i035 Processes 09 01786 i036 Processes 09 01786 i037 Processes 09 01786 i038
Table A3. Vehicle detection accuracies on selected images obtained from Burlington video using YOLOv3. Cars and trucks marked as purple and red colors respectively.
Video SampleOriginal ImageModel OutputGround TruthVehicles DetectedAccuracy
Burlington-WL-HV-SYNC-11090E0000000AB4-2015-01-08 Processes 09 01786 i039 Processes 09 01786 i0409555.60%
Burlington-HV-SSR-SYNC-0A090E0000000A8D-2015-01-08 Processes 09 01786 i041 Processes 09 01786 i0425360.0%
Burlington-WL-HV-0A090E0000000A87-2015-01-08 Processes 09 01786 i043 Processes 09 01786 i0441212100.0%
Burlington-HV-SSR-SYNC-0A090E0000000A8C-2015-01-08 Processes 09 01786 i045 Processes 09 01786 i04655100.0%
Burlington-Queue-Mask3- new zones-11090E0000000AB6-2015-01-08 Processes 09 01786 i047 Processes 09 01786 i048262076.90%
574578.90% *
* Accuracy = (Total Ground Truth/Total Detected)×100%
Table A4. Vehicle detection accuracies on selected images obtained from Burlington video using YOLOv4. Cars and buses marked as red/green/blue/purple and light green colors respectively.
Video SampleOriginal ImageModel OutputGround TruthVehicles DetectedAccuracy
Burlington-WL-HV-SYNC-11090E0000000AB4-2015-01-08 Processes 09 01786 i049 Processes 09 01786 i0509777.78%
Burlington-HV-SSR-SYNC-0A090E0000000A8D-2015-01-08 Processes 09 01786 i051 Processes 09 01786 i0525480.0%
Burlington-WL-HV-0A090E0000000A87-2015-01-08 Processes 09 01786 i053 Processes 09 01786 i054121083.33%
Burlington-HV-SSR-SYNC-0A090E0000000A8C-2015-01-08 Processes 09 01786 i055 Processes 09 01786 i05655100.0%
Burlington-Queue-Mask3- new zones-11090E0000000AB6-2015-01-08 Processes 09 01786 i057 Processes 09 01786 i058261869.23%
574477.19% *
* Accuracy = (Total Ground Truth/Total Detected)×100%.
Table A5. Vehicle detection accuracies on selected images obtained from Burlington video using YOLOv5. Cars, buses and trucks marked as orange, neon green and light green colors respectively.
Video SampleOriginal ImageModel OutputGround TruthVehicles DetectedAccuracy
Burlington-WL-HV-SYNC-11090E0000000AB4-2015-01-08 Processes 09 01786 i059 Processes 09 01786 i0609777.78%
Burlington-HV-SSR-SYNC-0A090E0000000A8D-2015-01-08 Processes 09 01786 i061 Processes 09 01786 i0625480.0%
Burlington-WL-HV-0A090E0000000A87-2015-01-08 Processes 09 01786 i063 Processes 09 01786 i064121083.33%
Burlington-HV-SSR-SYNC-0A090E0000000A8C-2015-01-08 Processes 09 01786 i065 Processes 09 01786 i06655100.0%
Burlington-Queue-Mask3- new zones-11090E0000000AB6-2015-01-08 Processes 09 01786 i067 Processes 09 01786 i068262284.61%
574885.14% *
* Accuracy = (Total Ground Truth/Total Detected)×100%.

References

  1. Urbanization. Available online: https://www.unfpa.org/urbanization (accessed on 1 September 2021).
  2. Directive 2010/40/EU of the European Parliament and of the Council of 7 July 2010. Available online: https://eur-lex.europa.eu/LexUriServ/LexUriServ.do?uri=OJ:L:2010:207:0001:0013:EN:PDF (accessed on 1 September 2021).
  3. Makino, H.; Tamada, K.; Sakai, K.; Kamijo, S. Solutions for Urban Traffic Issues by ITS Technologies. IATSS Res. 2018, 42, 49–60. [Google Scholar] [CrossRef]
  4. Shafiq, M.; Tian, Z.; Bashir, A.K.; Jolfaei, A.; Yu, X. Data Mining and Machine Learning Methods for Sustainable Smart Cities Traffic Classification: A Survey. Sustain. Cities Soc. 2020, 60, 102177. [Google Scholar] [CrossRef]
  5. Lan, C.-L.; Chang, G.-L. Empirical Observations and Formulations of Tri-Class Traffic Flow Properties for Design of Traffic Signals. IEEE Trans. Intell. Transp. Syst. 2019, 20, 830–842. [Google Scholar] [CrossRef]
  6. Chen, X.; Li, Z.; Yang, Y.; Qi, L.; Ke, R. High-Resolution Vehicle Trajectory Extraction and Denoising from Aerial Videos. IEEE Trans. Intell. Transp. Syst. 2021, 22, 3190–3202. [Google Scholar] [CrossRef]
  7. Huang, Y.-Q.; Zheng, J.-C.; Sun, S.-D.; Yang, C.-F.; Liu, J. Optimized YOLOv3 Algorithm and Its Application in Traffic Flow Detections. Appl. Sci. 2020, 10, 3079. [Google Scholar] [CrossRef]
  8. Li, J.-Q.; Zhou, K.; Shladover, S.E.; Skabardonis, A. Estimating Queue Length under Connected Vehicle Technology. Transp. Res. Rec. J. Transp. Res. Board 2013, 2356, 17–22. [Google Scholar] [CrossRef]
  9. Kalamaras, I.; Zamichos, A.; Salamanis, A.; Drosou, A.; Kehagias, D.D.; Margaritis, G.; Papadopoulos, S.; Tzovaras, D. An Interactive Visual Analytics Platform for Smart Intelligent Transportation Systems Management. IEEE Trans. Intell. Transp. Syst. 2018, 19, 487–496. [Google Scholar] [CrossRef]
  10. Lu, N.; Cheng, N.; Zhang, N.; Shen, X.; Mark, J.W. Connected Vehicles: Solutions and Challenges. IEEE Internet Things J. 2014, 1, 289–299. [Google Scholar] [CrossRef]
  11. Shirazi, M.S.; Morris, B. Vision-Based Vehicle Queue Analysis at Junctions. In Proceedings of the 2015 12th IEEE International Conference on Advanced Video and Signal Based Surveillance (AVSS), Karlsruhe, Germany, 25–28 August 2015. [Google Scholar] [CrossRef]
  12. Lee, S.; Wong, S.C.; Li, Y.C. Real-Time Estimation of Lane-Based Queue Lengths at Isolated Signalized Junctions. Transp. Res. Part C Emerg. Technol. 2015, 56, 1–17. [Google Scholar] [CrossRef] [Green Version]
  13. Wu, J.; Xu, H.; Zhang, Y.; Tian, Y.; Song, X. Real-Time Queue Length Detection with Roadside LiDAR Data. Sensors 2020, 20, 2342. [Google Scholar] [CrossRef]
  14. An, H.K.; Yue, W.L.; Stazic, B. Estimation of Vehicle Queuing Lengths at Metering Roundabouts. J. Traffic Transp. Eng. 2017, 4, 545–554. [Google Scholar] [CrossRef]
  15. Skabardonis, A.; Geroliminis, N. Real-Time Monitoring and Control on Signalized Arterials. J. Intell. Transp. Syst. 2008, 12(2), 64–74. [Google Scholar] [CrossRef]
  16. Li, F.; Tang, K.; Yao, J.; Li, K. Real-Time Queue Length Estimation for Signalized Intersections Using Vehicle Trajectory Data. Transp. Res. Rec. J. Transp. Res. Board 2017, 2623, 49–59. [Google Scholar] [CrossRef]
  17. Ramezani, M.; Geroliminis, N. Queue Profile Estimation in Congested Urban Networks with Probe Data. Comput.-Aided Civ. Infrastruct. Eng. 2015, 30, 414–432. [Google Scholar] [CrossRef]
  18. Blokpoel, R.; Vreeswijk, J. Uses of Probe Vehicle Data in Traffic Light Control. Transp. Res. Procedia 2016, 14, 4572–4581. [Google Scholar] [CrossRef] [Green Version]
  19. Wu, A.; Yang, X. Real-Time Queue Length Estimation of Signalized Intersections Based on RFID Data. Procedia Soc. Behav. Sci. 2013, 96, 1477–1484. [Google Scholar] [CrossRef] [Green Version]
  20. Rompis, S.Y.R.; Cetin, M.; Habtemichael, F. Probe Vehicle Lane Identification for Queue Length Estimation at Intersections. J. Intell. Transp. Syst. 2017, 22, 10–25. [Google Scholar] [CrossRef]
  21. Okaishi, W.A.; Zaarane, A.; Slimani, I.; Atouf, I.; Benrabh, M. A Vehicular Queue Length Measurement System in Real-Time Based on SSD Network. Transp. Telecommun. J. 2021, 22, 29–38. [Google Scholar] [CrossRef]
  22. Zanin, M.; Messelodi, S.; Modena, C.M. An Efficient Vehicle Queue Detection System Based on Image Processing. Available online: https://ieeexplore.ieee.org/document/1234055 (accessed on 26 July 2020).
  23. Albiol, A.; Albiol, A.; Mossi, J.M. Video-Based Traffic Queue Length Estimation. In Proceedings of the 2011 IEEE International Conference on Computer Vision Workshops (ICCV Workshops), Barcelona, Spain, 6–13 November 2011. [Google Scholar] [CrossRef]
  24. Li, X.; Liu, Y.; Zhao, Z.; Zhang, Y.; He, L. A Deep Learning Approach of Vehicle Multitarget Detection from Traffic Video. J. Adv. Transp. 2018, 2018, 7075814. [Google Scholar] [CrossRef]
  25. Wojke, N.; Bewley, A.; Paulus, D. Simple online and realtime tracking with a deep association metric. In Proceedings of the 2017 IEEE International Conference on Image Processing (ICIP), Beijing, China, 17–20 September 2017. [Google Scholar] [CrossRef] [Green Version]
  26. Open Data Dataset. Available online: https://open.toronto.ca/dataset/traffic-cameras/ (accessed on 1 September 2021).
  27. LabelImg. Available online: https://github.com/tzutalin/labelImg (accessed on 1 September 2021).
  28. Huang, L.; Yang, Y.; Deng, Y.; Yu, Y. DenseBox: Unifying Landmark Localization with End to End Object Detection. arXiv 2015, arXiv:1509.04874. [Google Scholar]
  29. Huang, J.; Rathod, V.; Sun, C.; Zhu, M.; Korattikara, A.; Fathi, A.; Fischer, I.; Wojna, Z.; Song, Y.; Guadarrama, S.; et al. Speed/Accuracy Trade-Offs for Modern Convolutional Object Detectors. In Proceedings of the 2017 IEEE Conference on Computer Vision and Pattern Recognition (CVPR), Honolulu, HI, USA, 21–26 July 2017. [Google Scholar] [CrossRef] [Green Version]
  30. Redmon, J.; Divvala, S.; Girshick, R.; Farhadi, A. You Only Look Once: Unified, Real-Time Object Detection. In Proceedings of the 2016 IEEE Conference on Computer Vision and Pattern Recognition (CVPR), Las Vegas, NV, USA, 26 June–1 July 2016. [Google Scholar] [CrossRef] [Green Version]
  31. Fachrie, M. A Simple Vehicle Counting System Using Deep Learning with YOLOv3 Model. J. Resti (Rekayasa Sist. Dan Teknol. Inf.) 2020, 4, 462–468. [Google Scholar] [CrossRef]
  32. Song, H.; Liang, H.; Li, H.; Dai, Z.; Yun, X. Vision-Based Vehicle Detection and Counting System Using Deep Learning in Highway Scenes. Eur. Transp. Res. Rev. 2019, 11, 51. [Google Scholar] [CrossRef] [Green Version]
  33. Alghyaline, S.; El-Omari, N.; Al-Khatib, R.M.; Al-Kharbshh, H. RT-VC: An Efficient Real-Time Vehicle Counting Approach. J. Theor. Appl. Inf. Technol. 2019, 97, 2062–2075. [Google Scholar]
  34. Ding, X.; Yang, R. Vehicle and Parking Space Detection Based on Improved YOLO Network Model. In Journal of Physics: Conference Series 2019; IOP Publishing: Bristol, UK, 2019; Volume 1325, p. 012084. [Google Scholar] [CrossRef]
Figure 1. Vehicle queue at an intersection.
Processes 09 01786 g001
Figure 2. Proposed queue length estimation method.
Processes 09 01786 g002
Figure 3. Queue length definition.
Processes 09 01786 g003
Figure 4. (a) Unique tracking ID assignment and identification of stopped vehicles, (b) Estimation of queue lengths after identification of stopped vehicles.
Processes 09 01786 g004
Figure 5. Queue length calculation.
Processes 09 01786 g005
Figure 6. Labeled image for transfer learning.
Processes 09 01786 g006
Figure 7. Inference with (a) original pre-trained COCO model (cars and trucks marked as blue and red colors respectively) and (b) improved model with transfer learning (vehicles marked as red).
Processes 09 01786 g007
Figure 8. Model training loss graph.
Processes 09 01786 g008
Figure 9. Queue length performance evaluation results (with original pretrained 80-classes model).
Processes 09 01786 g009
Figure 10. Difference of vehicle detection in Video B34M (a) before fine-tuning (cars and buses marked as purple and green colors respectively) (b) after fine-tuning (vehicles marked as yellow).
Processes 09 01786 g010
Table 1. Burlington video specifications.
B30SB20MB34M
Video SampleBurlington 30 sBurlington 20 minBurlington 34 min
Video Queue Length Range25 m60 m80 m
Video Duration49 s20 min34 min
Sampled Segment Duration30 s2 min1 min 48 s
Original FPS4–51–21–2
Number of Lanes344
Number of Signal Cycles22138
Video Frame   Processes 09 01786 i001 Processes 09 01786 i002 Processes 09 01786 i003
Table 2. Vehicle count improvements.
Video SampleVideo B34MVideo B20MVideo B30SAverage
Original model57.78%76.50%85.50%73.26%
Fine-tuned model87.50%74.32%86.00%82.60%
Table 3. Vehicle count-based queue length improvements.
Video SampleVideo B34MVideo B20MVideo B30SAverage
Original model86.70%82.50%95.00%88%
Fine-tuned model95.00%90.50%92.50%92.67%
Publisher’s Note: MDPI stays neutral with regard to jurisdictional claims in published maps and institutional affiliations.

