Article

Integrating FMEA and the Kano Model to Improve the Service Quality of Logistics Centers

1
College of Management, Yuan Ze University, Taoyuan 32003, Taiwan
2
Department of Marketing & Distribution Management, Oriental Institute of Technology, New Taipei 22061, Taiwan
*
Author to whom correspondence should be addressed.
Processes 2021, 9(1), 51; https://doi.org/10.3390/pr9010051
Submission received: 3 December 2020 / Revised: 23 December 2020 / Accepted: 25 December 2020 / Published: 29 December 2020

Abstract

:
This study uses the logistics center of a large organic retail store in Taiwan to analyze service blueprint and workflow, identifying the potential points of failure and thus serving as a basis for quality improvement. The failure mode and effect analysis (FMEA) model is an effective problem prevention methodology that can easily interface with many engineering and reliability methods. The utilized method integrates the failure mode and effect analysis (FMEA) and the Kano model to explore the possible occurrence of failures in the internal workflow and services of the studied logistics center. A two-stage survey was conducted. In the first stage, an investigation was conducted by 20 logistics experts on the FMEA’s key service failures. In the second stage, a questionnaire was filled out by 220 store staff to summarize the logistics service quality factors found in the Kano model. The results show that the degree of attention and satisfaction in the priority improvement items when there were service failures vary among the opinions of different internal employees and customers. The participants jointly believed that the items that need improvement are “Damaged incoming goods” and “A shortfall in the quantities of delivered goods”.

1. Introduction

Increasing global consumer awareness has prompted individuals to pay more attention to food safety and health. Therefore, organic agriculture has become a trend in global agricultural development. Specifically, in Taiwan, regardless of the improvement in living standards, there still have been numerous emergencies in food safety since the plasticizer incident in May 2011, thus significantly increasing the demand for organic food in recent years and the revenue of related industries. According to the organics annual report issued by the Research Institute of Organic Agriculture, the global market for organic food (expressed in retail sales) was 96.7 billion euros in 2018. The United States (40.6 billion euros) is the leading market, followed by Germany, France, and China. Consumer demand is increasing, reflected in the significant market growth of 11 percent in the United States, the world’s largest organic market. Organic agricultural land in Asia increased by 8.9%. In 2018, there were at least 2.8 million organic producers in the world, of which 47% were in Asia [1]. Although organic food sales are growing at a healthy rate, developing a strong local market in Asia has been a challenge, especially the logistics management of organic food from source of farmer to the end of market.
Asia’s share of organic food sales continues to rise, and Taiwan also has a large organic product market. Taiwanese organic food logistics and distribution have huge growth potential and can support market sales. Due to the competition in the market, to provide the qualified service and deliver the required products to customer quickly is important for the third-party logistics company. Therefore, developing a systematic approach to investigate logistics services and improve the customer service failure is a critical issue. The production process is also a combination of traditional and innovative approaches. All the products are created in respect to the traditional production means. All businesses do not produce in a traditional way and have introduced new management method to improve service failure [2]. Therefore, to manage and grow some successful competitive businesses, innovation and tradition should coexist. Furthermore, to ensure a sustainable profitable growth, businesses nowadays should be able to take advantage of the current knowledge base and new innovative technology [3]. Although outsourcing more complex business operations can increase the benefits an enterprise receives, it can also bring higher risks [4]. Generally speaking, an average company’s satisfaction with outsourcing operations is only about 50%. If an enterprise can maintain 5% of its original customers, the profits generated by the enterprise can increase by approximately 25–85% [5]. Therefore, when the services provided by the logistics center do not meet expectations, customers will have an adverse reaction to the enterprise, causing a loss in customer loyalty [6]. In the current study, a statistical analysis was conducted after performing a customer service call recording of one logistics center. The focus—and one of the main motivations of the current study—is to identify potential service failures from customer complaints and prevent the occurrence of service failures in advance through process control, thereby improving service quality and reducing customer complaints.
Service failure refers to a failure of the services or products provided by the business operator to meet customer needs, which should be avoided [7]. Service quality is difficult to standardize, and because defining service quality relies on various factors, service failures cannot be avoided [8]. If a failure occurs during the service process, customers will have a negative response toward the product and company [9]. However, enterprises tend to pay less attention to service failures in management, with managers tending to regard the customer complaint rate as a customer dissatisfaction index. Most managers assume that if the customer complaint rate decreases, the overall customer dissatisfaction rate will also decline. Therefore, the real customer dissatisfaction index is often misjudged [10]. To compensate for the negative impacts of service failures, companies often provide remedy measures known as service recovery. When a service failure occurs, remedying the situation will restore or even improve the customer’s trust in the company and increase the customer’s willingness to buy from the company again [11].
The Kano model posits that key product or service attributes are related to customer satisfaction. The centerpiece of this model is to analyze the nature of the product or service attributes and classify these attributes into different categories [12]. The Kano model can be applied to new product development or new service creation [13]. The failure mode and effect analysis (FMEA) is an effective problem prevention methodology that can easily interface with many engineering and reliability methods [14,15]. The FMEA is mainly used for reducing the downtime in a textile share company and in the industrial production of machinery, motor cars industry, mechanical and electronic components, and NASA [16,17,18,19]. The Kano model was then integrated with the FMEA method to categorize service attributes, to improve service failure and to promote customer satisfaction. Despite abundant research on service quality within the logistics industry, few studies have applied the Kano model and FMEA methods to improve service failure; therefore, this study aims to discuss integrating the Kano model and FMEA methods application in service failure improvement. However, using the FMEA to conduct a risk ranking analysis will likely create three issues [20], as follows:
(1)
When calculating the severity (S), occurrence (O), and detection (D) of the three parameters of the risk priority number (RPN), the degree of judgment will tend to be too subjective.
(2)
One must decide whether the three parameters are equally important.
(3)
For the same RPN, the concern regarding the importance of the differences of the parameters.
To improve these three issues, Shahin [21] proposed a method of integrating the Kano model with the FMEA, which is utilized in the present study. In the current study, three important parameters were used by looking at the customers’ perspectives to analyze a simplified approach to improve service failures that require a remedy. Therefore, the integrated method proposed in the current study was applied to a third-party logistics center to calculate the significant service failures that the logistics center must prioritize. The aim was to provide a reference for an early improvement warning in the workflow of the logistics center.
In this study, the third-party logistics (3PL) center of an organic retail store in Taiwan was chosen as the research subject. This study reviewed the company’s service blueprint to analyze the workflow firstly, and then analyzed the potential points of failure of the logistics center furtherly. The purpose was to use the logistics center’s customer service call recordings as the basis for understanding significant service failures that were addressed by the store’s staff. The integrated FMEA and Kano model method was primarily used to explore the internal workflow and various service failures that could arise in the future in the logistics center. An investigation was conducted, and data were collected and analyzed; the results show the failure factors with higher potential risks. Finally, optimized or improvement suggestions are put forward.

2. Materials and Methods

2.1. Service Quality

Customer satisfaction for the quality of a service is the difference between service expectations and actual perceived services [22]. Therefore, to improve service quality, all factors of the service process must be improved. The customers’ expectations and evaluation of the services or products provided by the enterprise is an essential factor in service quality. Because service quality is an abstract concept, it is difficult to understand the actual products directly from the appearance. Coupled with differences in a customer’s subjective perceptions, different judgments of the service’s quality will be generated.
Following the rapid development of global operations and supply chain management concepts in recent years, a 3PL company requires more attention in the area of the quality of logistics services. A 3PL company must continually improve the quality of its logistics services to meet customer service expectations [23]. Therefore, how to help a 3PL company achieve cost reduction and improve performance through cooperation with high-quality professional logistics companies has become an important topic. This vastly contrasts the conventional logistics companies that only pay attention to cost reduction, neglecting the impact of service quality on their operational performance and, even the customers’ perspectives when exploring the pros and cons of logistics services.

2.2. Service Failure

Service failure refers to a consumer’s dissatisfaction or negative, unpleasant feeling related to something in the service process [24]. Specifically, service failure occurs when the services provided by the enterprise fail to meet the standards required by the customers, when there are delays, when the services are not fulfilled, or when the level of services provided is below the customer’s acceptable levels. When faced with a service failure, the customers have several behavioral choices, including switching purchases, protesting directly to the business operator, seeking support from third parties or groups, conducting negative word-of-mouth publicity, or doing nothing and accepting the service quality [25]. In the event of a service failure, although a company can remedy the situation and restore customer satisfaction and loyalty [26], customers may be even more dissatisfied if the enterprise fails to provide subsequent remedies after future failures in service, causing the customer to stop purchasing from the company [27]. Therefore, not correctly handling what occurs after a remedy has been offered is far less effective than actively reducing the occurrence of service failures through preventive measures. To avoid any possibility of causing customers to leave, therefore, the enterprise can achieve sustainable management.
Because service quality is determined by customers and the needs of each customer are different, a service industry cannot rely on operating standards alone; rather, a company in this industry must judge the satisfaction of the customers’ perspectives [9]. Therefore, a service failure will also lead to customer complaints following the customer different needs. When the company does not respond to consumer complaints, the consumer complains more. Customers prefer the enterprise to solve problems in a customized process. However, the enterprise also needs to find standardized processes to reduce the processing costs involved with handling complaints [28]. Here, research conducted by a commercial delivery service provider found that the occurrence of service failures creates the following costs for suppliers [29]:
(1)
Customer departure: The customer not purchasing from the company anymore is the most common cost of service failure.
(2)
Losing potential customers: This is a large cost that cannot be accurately measured.
(3)
Negative word of mouth: This will cause existing customers and potential customers to lose confidence in the company.
(4)
Customer resentment: For customers who are dissatisfied with the company’s services and feel resentful, besides spreading negative word of mouth, these customers will also take revenge on the company.

2.3. Failure Mode and Effect Analysis

The FMEA method is a useful quality management technique that can be applied in various industries for enhancing the reliability and safety of systems, products, processes, and services [30]. It is also a management technology that prevents trouble before it happens, systematically detecting the risk of failure and further generating the RPN through a quantitative evaluation of the severity, occurrence, and detection created by failures [15,31]. The FMEA is also used to measure the budgets that an enterprise should invest in priority improvement and to solve potential failures generated in the workflow through proactive prevention measures to reduce the risk of service failures.
The RPN is composed of three parameters: severity (S), occurrence (O), and detection (D). The calculation formula is RPN = S × O × D. The RPN level that is calculated will determine the budgets that the enterprise should invest. In a FMEA analysis, these three important parameters can give an appropriate measurement and evaluation of the failed operation generated in the workflow and has 10 levels of measurement. If the failed operation has a greater influence on the service or product, the given impact level will also be higher [32]. The FMEA has been widely used in the aerospace, national defense, automotive, electronics, mechanicals, shipbuilding, and medicines industries and has even been applied to the service industry. Liu et al. [30] recommended a new method to integrate the FMEA with the cloud model theory and grey relational analysis (GRA) to solve a risk control problem. Liu et al. [33] suggested merging the quality function deployment (QFD) and FMEA methods to solve packaging test problems in the TFT-LCD industry.

2.4. Kano Model

Kano et al. [34] introduced Herzberg’s work motivation theory to the area of product quality improvement. The Kano model extends traditional service quality thinking; this model is a useful tool to understand customer needs by identifying and classifying the quality attributes. They proposed the concept of Kano’s two-dimensional quality model and further suggested a new idea of attractive quality and must-be quality. The model is divided into the following four quadrant and five categories: attractive quality, one-dimensional quality, must-be quality, indifferent quality and reverse quality. The Kano model has been applied to classify the characteristics of a product or service and is used as a way to satisfy the needs of its customers. Then, it calculates the “increase the value of customer satisfaction” and “eliminate the value of customer satisfaction”, the two mean crossings to distinguish between “height increase satisfaction, low eliminate dissatisfaction” (first quadrant), “low increase satisfaction, high eliminate dissatisfaction” (second quadrant), “low increase satisfaction, low eliminate dissatisfaction” (third quadrant) and “height increase satisfaction, height elimination of dissatisfaction” (fourth quadrant) [34,35]. Thus, the fourth quadrant of the Kano model is the most important indicator for improved efficiency. The description are as follows:
(1)
Attractive quality: These needs are the product/service criteria which have the greatest influence on how satisfied a customer will be with a given product/service. When this criterion is sufficient, customers feel more satisfaction, but it does not bring dissatisfaction if it is insufficient. Attractive needs are neither explicitly expressed nor expected by the customer.
(2)
One-dimensional quality: With regard to these needs, customer satisfaction is proportional to the fulfillment level of this criteria. The higher the level of fulfillment, the higher the customer’s satisfaction and vice versa.
(3)
Must-be quality: This criterion should be readily available. If these needs are fulfilled, that will only lead to a state of “not dissatisfied”. On the other hand, if it is not fulfilled, customers will be extremely dissatisfied. The must-be needs are basic criteria of a product or service.
(4)
Reverse quality: When this criterion is sufficient, customers will be dissatisfied. The higher the level of fulfillment, the higher the customer’s dissatisfaction and vice versa.
(5)
Indifferent quality: Customers are not affected by this criterion, whether it is sufficient or not.
The Kano model offers a better understanding of how customers evaluate products, helping practitioners focus on the most important quality attributes that should be improved [36]. The Kano model can be combined with other research methods and applied to various industrial quality improvements, such as in the case of integrating the Kano model and IPA to investigate the critical service quality attributes in the teaching quality of physical education [35], the chain restaurant industry [37], and the pharmaceutical logistics industry [38]. Integrating the Kano model with the QFD can help solve product development issues in a project management setting [39]. From the above case studies, if each quality factor can be distinguished by its attribution category, this will help improve the quality of the products or services [40]. Thus, this Kano model method was adopted by the current study as the basis for classifying the quality factors.

3. Methodology

3.1. Research Process

A service blueprint was used to find the key points of possible service failures in the studied logistics center; to do this, the current study obtained a better understanding of the service process in each operation (See Figure 1).
Phase one: Identification of service needs and FMEA’s parameters. The potential points of service failure found in the service blueprint were used to analyze the service failures found in customer call recordings. The listed logistics center’s service failures were used to establish a service quality scale for the logistics center through an expert questionnaire that focused on these key points e.g., the major service failures. Phase two: Quality measurement of the Kano questionnaire. The Kano two-dimensional quality measurement table was used to classify the quality factors established by the logistics center, helping better understand the customer’s viewpoint in the logistics center’s service quality factors. After obtaining the Kano two-dimensional quality classification, it was integrated into the FMEA, and the internal staff’s and customers’ ideas were arranged to prioritize the improvement of the logistics center’s service quality. Phase three: Continuous improvement of the logistic center. The research outcomes were then incorporated to serve as a reference point for improving the logistics center’s service failures. This section may be divided by subheadings. It should provide a concise and precise description of the experimental results, their interpretation as well as the experimental conclusions that can be drawn. This methodology can solve the logistics procedures and amend the logistics SOP, strengthen the training of logistics personnels’ skills and import intelligent equipment to assist logistics service.

3.2. Identification of Service Needs

Using a service blueprint was proposed by Shostack [41] as a way to address a service system and its process descriptions. It helps solve incomplete descriptions, oversimplified service process, failures, or other problems during the service delivery process and is regarded as an essential tool for a service process analysis. By visualizing the overall structure of the service delivery process in a diagram, this can be used as one of the means for service design and service quality management, allowing the service participants and personnel to understand the service process objectively. An example is the internal operation flow chart of the enterprise [42].
In the current study, the process generated from the services was viewed through the service blueprint and was employed to disassemble the logistics center’s service workflow. The drawing steps and operation definition were carried out after the service blueprint drawing method, and the logistics center’s customer service call recordings from 2018 were referred to as the key point of failure for the service centers; these calls included 12 types of failures: F1 to F12. Table 1 shows the key points of failure for the potential service failures, which served as a reference for subsequent service quality measurement.
The workflow service blueprint of the logistics center contains points of failure, and each of the 29 positive and reverse items of service failures collected from the logistics center’s 2018 customer service call recordings is shown in Table 1. Four necessary modules, namely logistics support, customer service, warehousing, and transportation/distribution were classified. A 5-point Likert scale was used to rate the options “dislike” to “like”, with “dislike” being 1 and “like” being 5. The higher the score, the higher the store staff’s attention to their failures and vice versa.

3.3. Construction of the Kano Questionnaire

After identifying the needs, this study constructs the Kano questionnaire, which is composed of two parts. For each logistic service feature, a pair of questions is formulated to which the customer can answer in one of five different ways [34]. The first question concerns the reaction of the customer if the product has that feature (functional form of the question), the second concerns his reaction if the product does not have that feature (dysfunctional form of the question). When formulating the questions, the “voice of the customer” is a description of the problem to be solved from the customer’s viewpoint. Next, this study will explain how service requirements can be classified by means of a pair of questions.
Functional form of the question (F1-1):
If the order file appears normal on logistic center, how do you feel?
  • Answer:  □1. I like it that way
  •      □2. It must be that way
  •      □3. I am neutral
  •      □4. I can live with it that way
  •      □5. I dislike it that way
Dysfunctional form of the question (F1-1):
If the order file appears abnormal on logistic center, how do you feel?
  • Answer:  □1. I like it that way
  •      □2. It must be that way
  •      □3. I am neutral
  •      □4. I can live with it that way
  •      □5. I dislike it that way
A 5-point Likert scale was used to rate the options “dislike” to “like”, with “dislike” being 1 and “like” being 5. The higher the score, the higher the store staff’s attention to their failures and vice versa. According to the above process, this study construct 29 pair of questions for 29 service failure needs that are shown in Table 1 (include F1-1 to F12-2). By combining the answers of these two questions in the Kano’s evaluation table [34], the service features can be classified as one of below categories: attractive quality (AQ), one-dimensional quality (OQ), must-be quality (MQ), reverse quality (RQ), and indifferent quality (IQ).

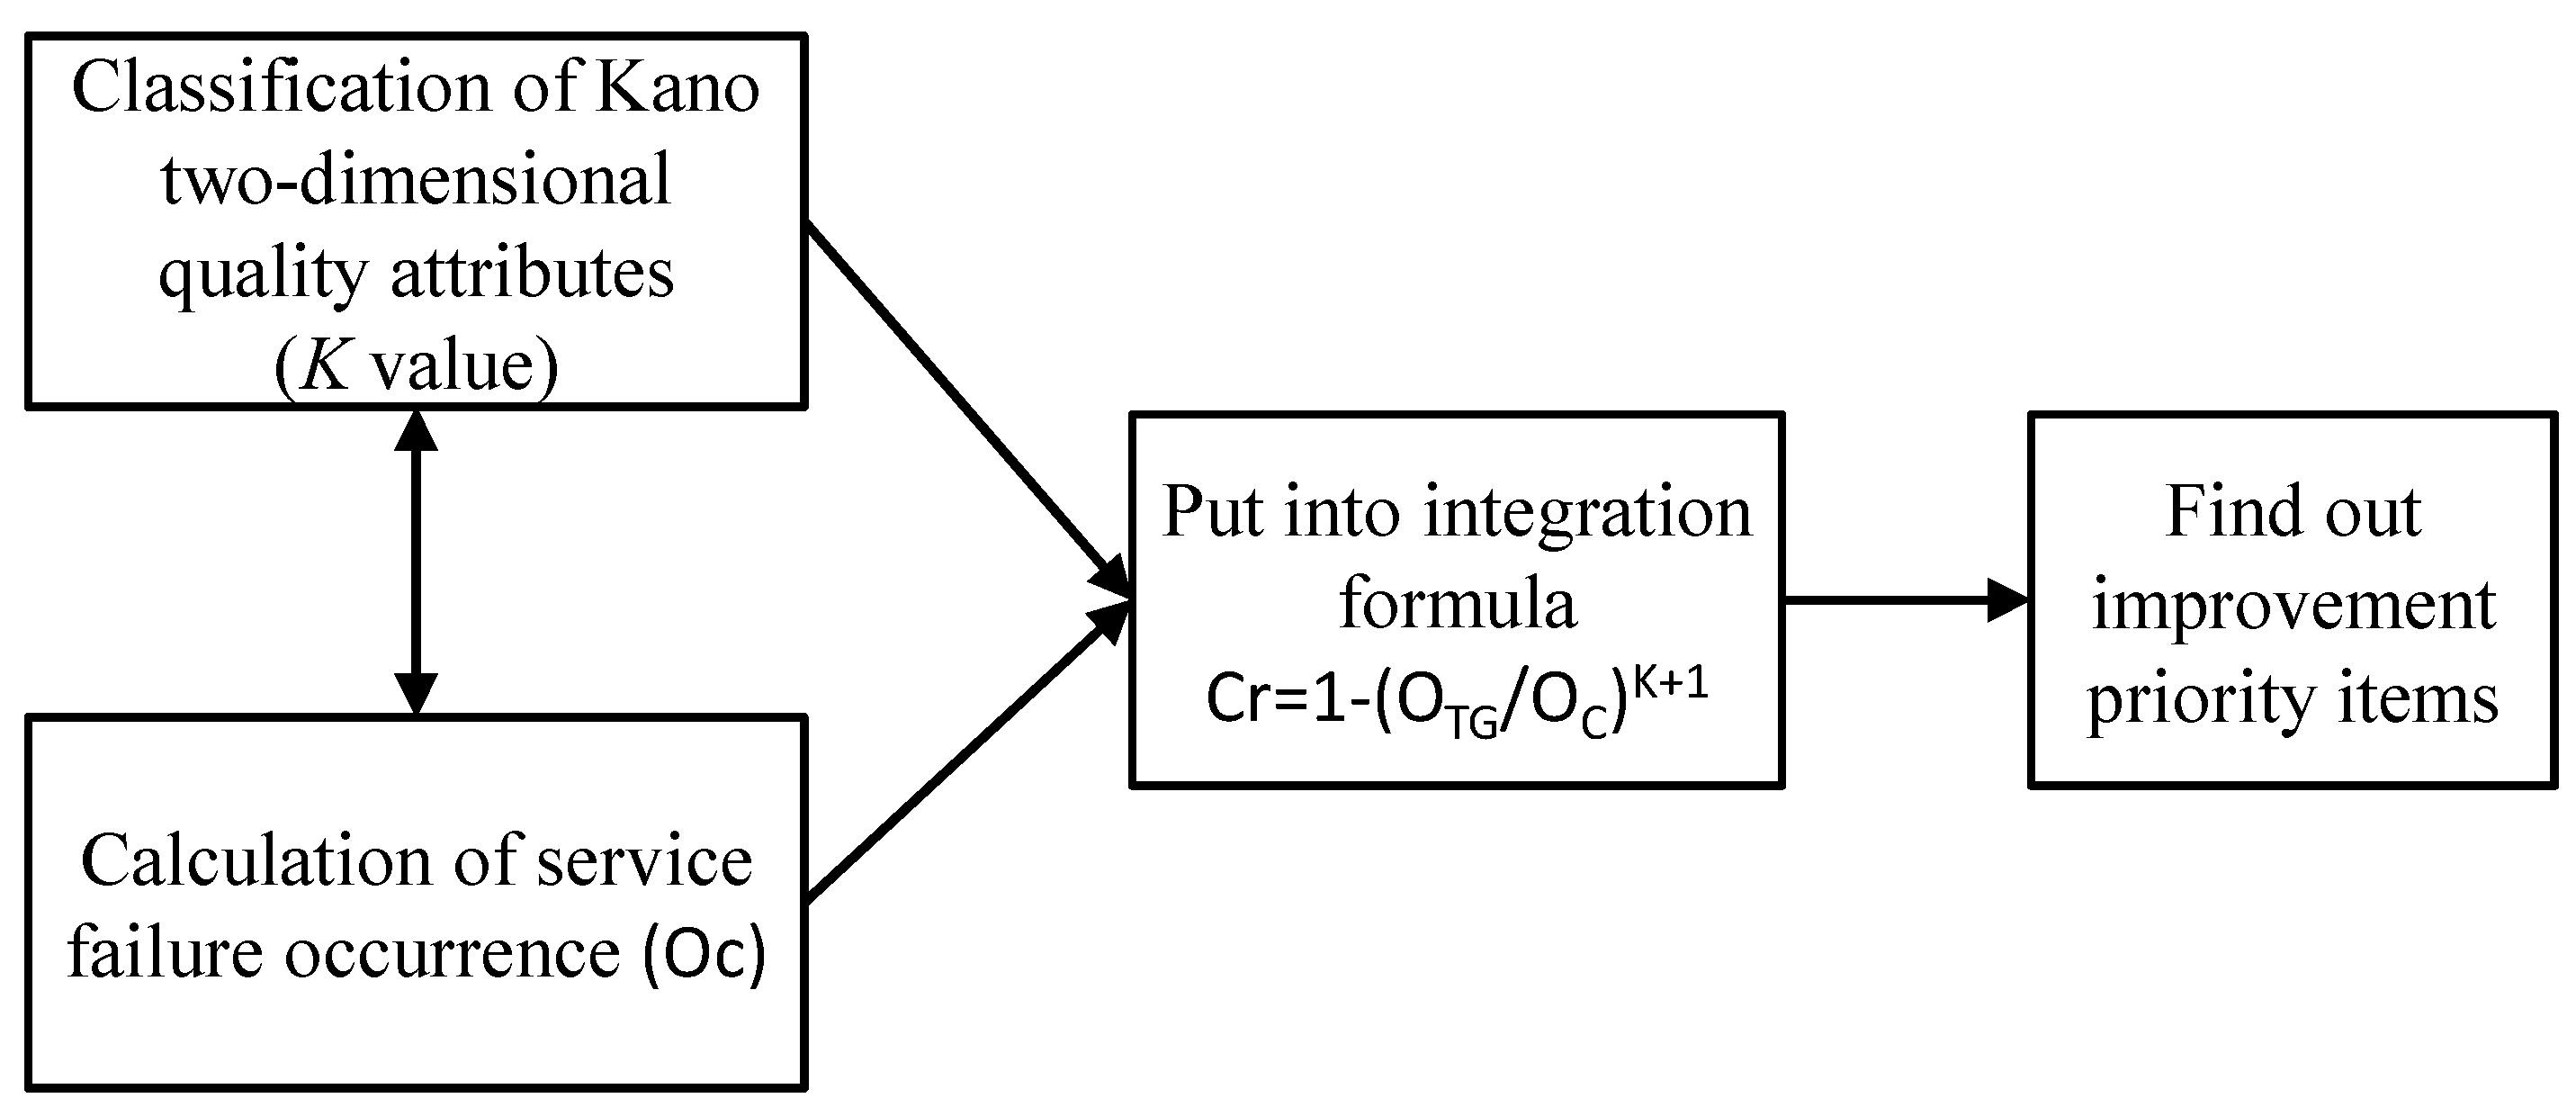
3.4. Integrating the FMEA and Kano Model

The present study was conducted used the combined Kano model and FMEA method proposed by Shahin [21]. A brief description of the operational concept of the integrated model is as follows:
(1)
Integrated concept of the Kano model and FMEA
The current study shows that there is a nonlinear relationship between the number of failures and the severity of the RPN. In other words, the number of failures is not proportional to the severity of the impact of the failures. Each customer has a tolerance curve for service failures, and each tolerance curve has a final critical point [43]. As such, when the severity of service failures reaches this crucial point, it will generally cause most customers to be dissatisfied, complain, and refuse to do business with the company again. The FMEA can solve problems in short-term production technology, providing the necessary quality to meet customer needs [44]. Hence, when using the FMEA, this study must consider the area covered by must-be quality in the Kano model, and based on the above perspective, the customer’s view of the severity of an impact from a service failure [21].
The quality factors are classified as reverse qualities. If the traditional Kano questionnaire method is used, only positive quality factors can be used in the quality attribute classification [40], namely “attractive quality”, “one-dimensional quality”, and “must-be quality”. A reverse quality cannot be accurately measured. Therefore, the Kano positive (functional) and negative (dysfunctional) questionnaire design must also be adjusted. Therefore, “when the products/services provided are sufficient” in the traditional Kano positive (functional) questionnaire design was amended, it became “when the products/services provided are insufficient or do not live up to expectations”, and “when the products/services provided are insufficient” in the traditional Kano negative (dysfunctional) questionnaire design was amended to “when the products/services provided are sufficient or live up to expectations”.
(2)
Integrating the Kano model and FMEA
Many scholars have argued that an increase in the ratio of customer satisfaction is a linear relationship, showing that there is an improvement in service performance [45]. Therefore, increasing the rate of performance can also increase customer satisfaction. In reality, it was found that performance and satisfaction do not have an entirely linear relationship. Therefore, the relationship of customer satisfaction is proposed as s = f (k, p), where s represents customer satisfaction, p represents service quality performance, and k represents Kano quality characteristics.
In the Kano model, the attractive quality is more useful in improving customer satisfaction than must-be quality. Based on this, this study has attractive quality as Δs/s > Δp/p, the one-dimensional quality as Δs/s = Δp/p, and must-be quality as Δs/s < Δp/p. After subsequently introducing the parameter k, we can integrate the satisfaction variation formula as Δs/s = k(Δp/p). Therein, the attractive quality is k > 1, the one-dimensional quality is k = 1, and the must-be quality is 0 < k < 1. It is then further converted into the following (where c is the coefficient):
s = cpk
(3)
Index conversion of the FMEA with Kano
After substituting S in the RPN for customer satisfaction (s) in the Kano method, substituting O in the service performance (p) in the Kano method, and substituting D for constant (c), this study can hence convert the Formula (1) into a traditional calculation formula (RPN = S × O × D), as follows:
S = DOk
Therefore, this study obtains a new calculation formula, as follows:
RPN = S × O × D = DOk × O × D = D2 Ok+1
The qualities of the different factors are defined as RA = −1; RO = 1; RM = 2; I = 0.
(4)
Calculation of Correction Rate (Cr)
To understand the differences between the existing quality and target quality, the proposed correction rate was used for measuring process [20]. Therein, RPNTG indicates the target quality, and RPNO indicates the existing quality. This study then obtains the correction rate, as follows:
Cr = 1 RPN   Tg RPN o = 1 D Tg 2 O Tg k + 1 D o 2 O o k + 1
When calculating Cr, this study assumes that D in the failure mode has remained unchanged; that is, DTg = Do. Therefore, a simplified amended Cr formula can be converted into the following:
Cr = 1 RPN   Tg RPN o = O Tg k + 1 O o k + 1 = 1 O Tg O o k + 1

4. Result

4.1. Sample Narrative Statistical Analysis

There were 220 valid samples in this study. The male respondents were younger than the females (86%), and 75% of the participants were aged 39–49 years old, while 18% were 20–39 years old. The stores were mainly concentrated in northern Taiwan, accounting for 58% of the total respondents. The ratio of store staff was 49% of the total respondents, and their working experience was mostly 5–10 years (52%). For these store staff participants, their actual experience in handling service failures (71%) was far higher than those who had not encountered a service failure (29%).

4.2. FMEA Construction Analysis of the Logistics Center

Phase One: Identification of Product Needs

To confirm the differences between the company’s inner staff and store staff when it comes to service failure perception, a logistics FMEA expert questionnaire was formulated, and 20 valid samples were received. Among the respondents, the largest sample number (60%) was occupational workers and specialists, with a majority with working experience of 5–10 years (45%). The FMEA expert questionnaires were sorted out, and the average of the three parameters, which were calculated by each failure model, was arranged in order. From an internal perspective, the top five priority improvement items were dominated by the transportation/distribution module, as shown in Table 2. The service failures caused by a failure of the logistics staff to comply with the management practices and their occurrences are high, as follows: “F10-4 Missing recovered materials”, “F8-1 Delayed arrival at the store”, “F10-3 Not carrying out the corresponding check with the store” and “F7-2 Distribution items shortage”. Meanwhile, “F7-1 The logistics personnel’s dress and appearance do not conform to the regulations” is a service failure caused by insufficient professional knowledge of logistics staff in store route planning. All these failures will cause customer complaints and dissatisfaction.
For the first five improvement items identified by the FMEA expert questionnaire, one improvement item was picked, and a FMEA template was formulated, as shown in Table 3. While using the FMEA form, each faulty item was analyzed by looking at the potential effects of failure to better understand the root cause and impact, hence allowing managers to review the importance of all the failures clearly. In the future, each company can list the FMEA as a quality management tools for early warning management.

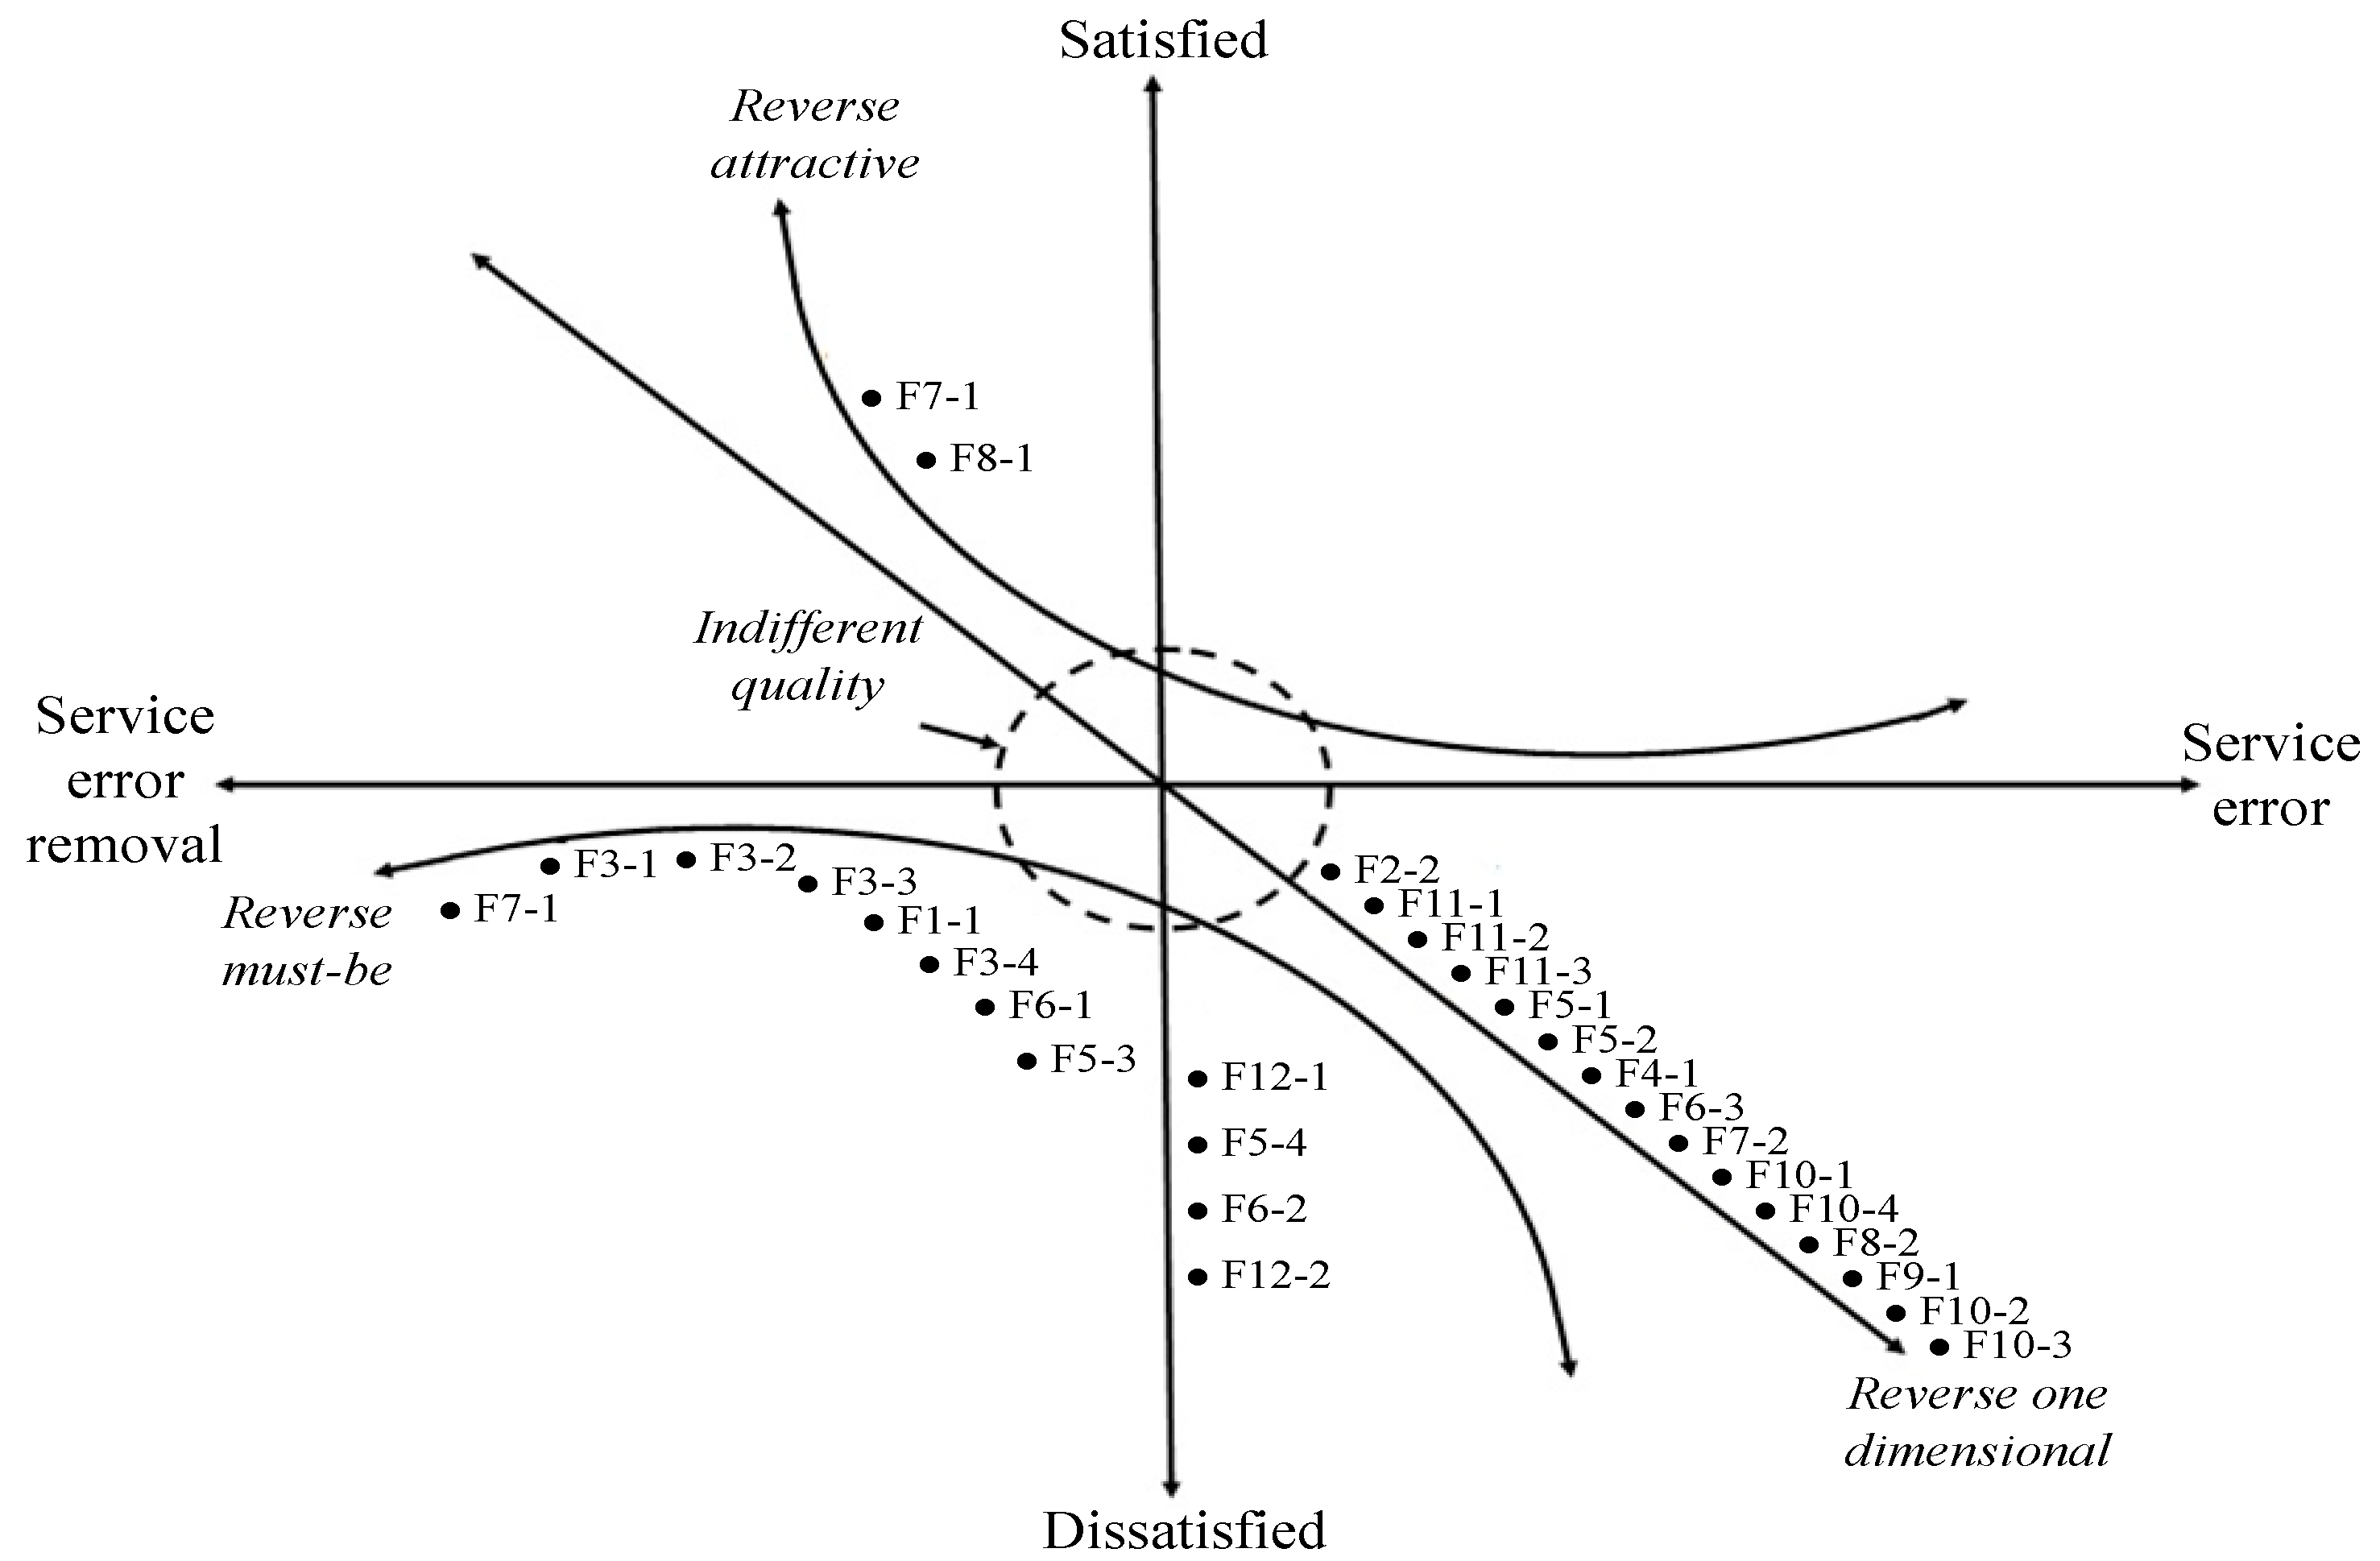
4.3. Kano Two-Dimensional Quality Classification

Phase Two: Quality Measurement of the Kano Questionnaire

The Kano and FMEA integrated method was used, and the reverse quality items were emphasized. If the reverse quality could not be accurately measured using the traditional Kano questionnaire method, the Kano positive and negative questionnaire design had to be revised to adjust the adequacy of the service factors to the possible occurrence of service failures. Therefore, “sufficient service factors” was adjusted to “the occurrence of service failures”, and “insufficient service factors” was adjusted to the “elimination of service failures”. When considering service failures, the Kano method’s quality classification results and classification instructions can also vary greatly. After the collected questionnaire data were serially coded, the data were classified according to the quality factors. The classification results are shown in Figure 2.

4.4. Integrating the FMEA and Kano Model

Based on the integration method of Kano and the FMEA, the occurrence (O) among the three important parameters was proposed as a simplified method for the subsequent priority improvement of service failures, as shown in Figure 3.
Therefore, the service failure occurrence (OC) of the logistics center was integrated, and the call recordings from the logistics center and customer feedback in 2018 were consolidated with the total number of service failures. A separate statistic was made for the number of failures in each service, and the rate of occurrence of each service failure was subsequently calculated based on occurrence. The calculation formula is as follows: the rate of occurrence equals the number of service failures in each service, which is divided by the total number of service failures. This rate was converted into 10 different levels of occurrences (OC). The revised Cr value was calculated from the occurrence level. To understand the differences between the existing service quality and target quality of the logistics center, the correction (Cr) value was calculated to determine the service failures that the logistics center should improve first. When the Kano quality factor classification results were found, this study obtained the reverse attractive quality RA = −1; the reverse one-dimensional quality RO = 1; the reverse must-be quality RM = 2; and the indifferent quality I = 0. Because the target quality (OTG) is the lowest level of service, this study set its value as 1. The top 10 items that need priority improvement were then calculated, as shown in Table 4.
Table 4 shows that the reverse one-dimensional quality item is dominated by the distribution module, and the reverse must-be quality item are dominated by the warehousing operation module. Here, the service quality of the logistics center’s warehousing operation is an essential factor that is considered by the store staff. However, for the service quality of the distribution operations, the store staff members generally believe that correcting the service failures generated during direct contact with end service providers will increase the store staff’s satisfaction with the distribution of the logistics center.

4.5. Continuous Improvement

Phase Three: Continuous Improvement of Logistic Center

Based on the above research conclusions, four suggestions are given; these can serve as an early warning in the organic food’s logistic process and as a reference for continuous improvement of logistic center in the future.
(1)
Re-examine the logistics procedures and amend the logistics SOP
The customer’s service needs will vary, and so will the operation mode of the logistics operations. Regularly re-examining the SOP for service failure improvement is a primary improvement item.
(2)
Strengthen the training of logistics personnel’s skills to continuously improve service quality
Large amounts of money must be invested in a logistics center to construct a reliable system and equipment support, but the main factors causing service failures are still human-induced negligence. From the results of the current study, the priority improvement items are the warehousing operation module and the distribution module, which are based on both internal and external perspectives. Because these types of failures may cause the most direct harm, the following remedies should be enforced: standardize the company’s operations process, enhance the service quality, and internalize the operation process connotations, such as equipment operation and maintenance. This should be carried out through personnel education and training, and after the training, employees should constantly identify the potential problems, allowing all staff to continue using the plan-do-check-action (PDCA), quality improvement technique to form a corporate culture. These are feasible methods that can be used to keep pace with the times and avoid being eliminated by the rapid changes in the market, thereby effectively improving the service quality and achieving the concept of sustainable management.
(3)
Import intelligent equipment to assist logistics service
The result shows that the source of service failure is mainly human errors. Therefore, after improving the service staff by using a lean operation, the management unit should understand the priority of improvement items, replan the design process according to customer needs, import intelligent equipment with professional aids such as IoT, RFID. and AGV [46] to assist on-site operators; this would significantly reduce the failure rate and customer complaint rate, thereby improving the service quality.
(4)
Listen to customer needs and strengthen customer services
For any company, customers are the source of company revenue, yet customer complaints and service failures have continued to occur at higher-than-expected rates. Therefore, listening to the customers’ voices to understand the potential customer needs and analyzing their demand gaps instantly provides the most appropriate services for customers, along with not providing services failure that would generate customer dissatisfaction, and reducing the generation of service gap would all help improve service satisfaction.

5. Conclusions

The case study is mainly responsible for the storage and management of organic food, which is delivered to 91 different specialty stores every day. In addition to paying attention to ingredients and sources, organic food is also needed to take account of warehousing/distribution to stores, so it is necessary to develop a systematic quality control method to ensure the quality of organic foods distributed. In the past, the Kano model mainly used the positive characteristics to measure the product’s quality attributes, and less of the negative characteristics such as customer complaints or abnormal quality. Many customer complaints or returns incidents need to be handled in customer service. The application of this research method to abnormal quality of such products can greatly shorten the cause analysis of product abnormalities and improve them and take precautionary measures in advance to ensure the quality of subsequent organic food distribution and increase customer satisfaction.
In the priority improvement item of “13. Damaged incoming goods”, after implementing a scheduled improvement plan, there is an expected reduction of about 30% in damaged goods and about 40% in return damages. If this method is introduced through a continuous improvement method to improve the problem fundamentally, it can help the enterprise invest its limited resources accurately to maximize the enterprise’s future value and competitiveness. From the internal perspective, it was found that the transportation/distribution module needs direct contact with customers, and this was considered a failure that needs priority improvement. However, from the customer’s perspective, it was found that some items in the transportation/distribution module can improve customer satisfaction, but the priority improvement items in the warehousing operation modules mostly belonged to reverse must-be quality, and the priority improvement items in the warehousing operation area are essential services that the logistics center must provide.
By integrating Kano’s two-dimensional quality and the FMEA, the present study aimed to improve the customer’s actual needs, reducing customer dissatisfaction and extracting the internal and external perspectives, which helps prioritize the improvement of an item’s sequence. The Kano model’s two-dimensional quality is not a traditional positive (functional) attribute classification but rather is an attribute classification focusing on reverse quality. Although it is different from the conventional Kano model’s two-dimensional quality attribute classification, it was found that the service quality factors that were discovered as important still have two-dimensional quality attributes. This is consistent with previous scholars’ suggestions that based on customer influence on the degree of service failures; a comparison with the Kano quality factor shows a reverse quality curve in the third quadrant.
In this study, the 3PL center of one company was used as an example to explore potential failure models. Therefore, it is necessary to find significant failures that arise from customer complaints and establish preventive and post improvement management measures to improve the overall logistics service quality. Six conclusive points were discovered through an analysis and comparison of the perspectives of the internal and customer store staff. They are as follows:
(1)
The traditional Kano model stresses a two-dimensional quality positive classification; however, the FMEA and Kano integrated model proposed by the current study emphasizes the reverse quality of service failures.
(2)
Based on the customer’s perspective, the failure of the warehousing operation module is the priority improvement items.
(3)
Based on the staff internal perspective, the transportation/distribution failure module is the priority improvement item.
(4)
After summarizing the internal and external perspectives, it was found that there are variations in the order of the priority improvement items.
(5)
Identify the services that customers really value and face the service failures objectively.
(6)
Implement improvement plans to enhance corporate value.

Author Contributions

Conceptualization, L.-L.T.; methodology, C.-C.L.; software, C.-C.L.; validation, S.-H.C.; formal analysis, L.-L.T. and S.-H.C.; writing—original draft preparation, S.-H.C.; writing—review and editing, S.-H.C.; supervision, L.-L.T.; project administration, L.-L.T. All authors have read and agreed to the published version of the manuscript.

Funding

This research received no external funding.

Institutional Review Board Statement

Not applicable.

Informed Consent Statement

Not applicable.

Data Availability Statement

The data presented in Section 4.2 and Section 4.4 are available in supplementary material here. Additional data are available from the corresponding author upon request.

Conflicts of Interest

The authors declare no conflict of interest.

References

  1. Willer, H.; Schlatter, B.; Trávníček, J.; Kemper, L.; Lernoud, J. The World of Organic Agriculture-Statistics & Emerging Trends; Research Institute of Organic Agriculture (FiBL and IFOAM): Frick, Switzerland, 2020. [Google Scholar]
  2. Giacosa, E.; Ferraris, A.; Monge, F. How to strengthen the business model of an Italian family food business? Br. Food J. 2017, 119, 2309–2324. [Google Scholar] [CrossRef]
  3. Del Giudice, M.; Della Peruta, M.R. The impact of IT-based knowledge management systems on internal venturing and innovation: A structural equation modeling approach to corporate performance. J. Knowl. Manag. 2016, 20, 484–498. [Google Scholar] [CrossRef]
  4. Sanders, N.R.; Locke, A.; Moore, C.B.; Autry, C.W. A multidimensional framework for understanding outsourcing arrangements. J. Supply Chain Manag. 2007, 43, 3–15. [Google Scholar] [CrossRef]
  5. Reichheld, F.F.; Sasser, W.E., Jr. Zero defections: Quality comes to services. Harv. Bus. Rev. 1989, 68, 105–111. [Google Scholar]
  6. Goodwin, C.; Ross, I. Consumer responses to service failures: Influence of procedural and interactional fairness perceptions. J. Bus. Res. 1992, 25, 149–163. [Google Scholar] [CrossRef]
  7. Kau, A.K.; Loh, E.W.Y. The effects of service recovery on consumer satisfaction: A comparison between complainants and non-complainants. J. Serv. Mark. 2006, 20, 101–111. [Google Scholar] [CrossRef] [Green Version]
  8. Hart, C.W.L.; Heskett, J.L.; Sasser, W.E. The profitable art of service recovery. Harv. Bus. Rev. 1990, 68, 148–156. [Google Scholar]
  9. Bitner, M.J.; Booms, B.H.; Mohr, L.A. Critical service encounters: The employee’s viewpoint. J. Mark. 1994, 58, 95–106. [Google Scholar] [CrossRef]
  10. Richins, M.L. Negative word-of-mouth by dissatisfied consumers: A pilot study. J. Mark. 1983, 47, 68–78. [Google Scholar] [CrossRef] [Green Version]
  11. Bejou, D.; Palmer, A. Service failure and loyalty: An exploratory empirical study of airline customers. J. Serv. Mark. 1998, 12, 7–22. [Google Scholar] [CrossRef]
  12. Kondo, Y. Attractive quality: Its importance and the points of remark. Total Qual. Manag. Bus. Excell. 2000, 11, 647–651. [Google Scholar] [CrossRef]
  13. Chen, K.J.; Yeh, T.M.; Pai, F.Y.; Chen, D.F. Integrating refined Kano Model and QFD for service quality improvement in healthy fast-food chain restaurants. Int. J. Environ. Res. Public Health 2018, 15, 1310. [Google Scholar] [CrossRef] [Green Version]
  14. Tay, K.M.; Lim, C.P. Fuzzy FMEA with a guided rules reduction system for prioritization of failures. Int. J. Qual. Reliab. Manag. 2006, 23, 1047–1066. [Google Scholar]
  15. Chen, S.H. Determining the service demands of an aging population by integrating QFD and FMEA method. Qual. Quant. 2016, 50, 283–298. [Google Scholar] [CrossRef]
  16. Beyene, T.D.; Gebeyehu, S.G.; Mengistu, A.T. Application of Failure Mode Effect Analysis (FMEA) to reduce downtime in a textile share company. J. Eng. Proj. Prod. Manag. 2018, 8, 40–46. [Google Scholar] [CrossRef] [Green Version]
  17. Chin, K.S.; Wang, Y.M.; Poon, G.K.K.; Yang, J.B. Failure mode and effects analysis using a group-based evidential reasoning approach. Comput. Oper. Res. 2009, 36, 1768–1779. [Google Scholar] [CrossRef]
  18. Cicek, K.; Celik, M. Application of failure modes and effects analysis to main engine crankcase explosion failure on-board ship. Saf. Sci. 2013, 51, 6–10. [Google Scholar] [CrossRef]
  19. Jenaba, K.; Pineau, J. Failure mode and effect analysis on safety critical components of space travel. Manag. Sci. Lett. 2015, 5, 669–678. [Google Scholar] [CrossRef]
  20. Sankar, N.R.; Prabhu, B.S. Modified approach for prioritization of failures in a system failure mode and effects analysis. Int. J. Qual. Reliab. Manag. 2001, 18, 324–336. [Google Scholar] [CrossRef]
  21. Shahin, A. Integration of FMEA and the Kano model: An exploratory examination. Int. J. Qual. Reliab. Manag. 2004, 21, 731–746. [Google Scholar] [CrossRef]
  22. Parasuaman, A.; Zeithaml, V.A.; Berry, L.L. A conceptual model of service quality and its implications for future research. J. Mark. 1985, 49, 41–50. [Google Scholar] [CrossRef]
  23. Gibson, B.J.; Sink, H.L.; Mundy, R.A. Shipper-carrier relationships and carrier selection criteria. Logist. Transp. Rev. 1993, 29, 371. [Google Scholar]
  24. Bitner, M.J.; Booms, B.H.; Tetreault, M.S. The service encounter: Diagnosing favorable and unfavorable incidents. J. Mark. 1990, 54, 71–84. [Google Scholar] [CrossRef]
  25. Huppertz, J.W. Firms’ complaint handling policies and consumer complaint voicing. J. Consum. Mark. 2007, 24, 428–437. [Google Scholar] [CrossRef]
  26. Weun, S.; Beatty, S.E.; Jones, M.A. The impact of service failure severity on service recovery evaluations and post-recovery relationships. J. Serv. Mark. 2004, 18, 133–146. [Google Scholar] [CrossRef]
  27. Smith, A.K.; Bolton, R.N.; Wagner, J. A model of customer satisfaction with service encounters involving failure and recovery. J. Mark. Res. 1999, 36, 356–372. [Google Scholar] [CrossRef]
  28. Lin, J.J.; Ling, I.L.; Lai, C.S. Are customers’ complaints the voice of angels? A case study of gas service encounters in Taiwan. J. Qual. 2015, 22, 537–558. [Google Scholar]
  29. Johnston, T.C.; Hewa, M.A. Fixing service failures. Ind. Mark. Manag. 1997, 26, 467–473. [Google Scholar] [CrossRef]
  30. Liu, H.C.; Wang, L.E.; You, X.Y.; Wu, S.M. Failure mode and effect analysis with extended grey relational analysis method in cloud setting. Total Qual. Manag. Bus. Excell. 2018, 29, 1685–1695. [Google Scholar] [CrossRef]
  31. Yang, C.C.; Lin, W.T.; Lin, M.Y.; Huang, J.T. A study on applying FMEA to improving ERP introduction: An example of semiconductor related industry in Taiwan. Int. J. Qual. Reliab. Manag. 2006, 23, 298–322. [Google Scholar] [CrossRef]
  32. Lin, W.T.; Chen, S.C.; Jang, H.F.; Wu, H.H. Performance evaluation of introducing QS-9000 to the Taiwanese semiconductor industry. Int. J. Adv. Manuf. Technol. 2006, 27, 1011–1020. [Google Scholar] [CrossRef]
  33. Liu, S.F.; Cheng, J.H.; Lee, Y.L.; Gau, F.R. A case study on FMEA-based quality improvement of packaging designs in the TFT-LCD industry. Total Qual. Manag. Bus. Excell. 2016, 27, 413–431. [Google Scholar] [CrossRef]
  34. Kano, N.; Seraku, N.; Takahashi, F.; Tsuji, S. Attractive quality and must-be quality. J. Jpn. Soc. Qual. Control 1984, 14, 39–48. [Google Scholar]
  35. Ku, G.C.M.; Shang, I.W. Using the integrated Kano–RIPA Model to explore teaching quality of physical education programs in Taiwan. Int. J. Environ. Res. Public Health 2020, 17, 3954. [Google Scholar] [CrossRef]
  36. Chen, L.S.; Liu, C.H.; Hsu, C.H.; Lin, C.S. C-Kano model: A novel approach for discovering attractive quality elements. Total Qual. Manag. Bus. Excell. 2010, 21, 1189–1214. [Google Scholar] [CrossRef]
  37. Pai, F.Y.; Yeh, T.M.; Tang, C.Y. Classifying restaurant service quality attributes by using Kano model and IPA approach. Total Qual. Manag. Bus. Excell. 2016, 29, 301–328. [Google Scholar] [CrossRef]
  38. Lo, S.M.; Shen, H.P.; Chen, J.C. An integrated approach to project management using the Kano model and QFD: An empirical case study. Total Qual. Manag. Bus. Excell. 2017, 28, 1584–1608. [Google Scholar] [CrossRef]
  39. Chen, M.C.; Hsu, C.L.; Lee, L.H. Service quality and customer satisfaction in pharmaceutical logistics: An analysis based on Kano Model and Importance-Satisfaction Model. Int. J. Environ. Res. Public Health 2019, 16, 4091. [Google Scholar] [CrossRef] [PubMed] [Green Version]
  40. Pouliot, F. Theoretical parallels between Kano’s and Herzberg’s theories. Cent. Qual. Manag. J. 1993, 2, 23–25. [Google Scholar]
  41. Shostack, G.L. Designing services that deliver. Harv. Bus. Rev. 1984, 62, 133–139. [Google Scholar]
  42. Zeithaml, V.A.; Bitner, M.J. Service Marketing; McGraw-Hill: New York, NY, USA, 1996. [Google Scholar]
  43. Limbrick, D. A trivial pursuit? Manag. Serv. Qual. Int. J. 1993, 3, 39–42. [Google Scholar] [CrossRef]
  44. Ginn, D.M.; Jones, D.V.; Rahnejat, H.; Zairi, M. The QFD FMEA interface. Eur. J. Innov. Manag. 1998, 1, 7–20. [Google Scholar] [CrossRef]
  45. Tan, K.C.; Shen, X.X. Integrating Kano’s model in the planning matrix of quality function deployment. Total Qual. Manag. 2000, 11, 1141–1151. [Google Scholar] [CrossRef]
  46. Tang, L.L.; Pan, C.T. The design and application for the expert system of machine breakdown diagnosis. J. Inf. Manag. 1999, 6, 149–161. [Google Scholar]
Figure 1. Research process.
Processes 09 00051 g001
Figure 2. Classification of the Kano two-dimensional quality factors.
Processes 09 00051 g002
Figure 3. Integration of the failure mode and effect analysis (FMEA) and the Kano model.
Processes 09 00051 g003
Table 1. Operation failure mode analysis of logistics center.
Key PointFailure ItemFailure Mode
F1Pull orderF1-1 Order file appears abnormal
F2Order consolidation, inventory allocation F2-1 Main order quantity error
F2-2 Additional order input error
F3Incoming inspectionF3-1 Certification & labeling does not conform to regulations
F3-2 Year & specification inconsistent with main file standards
F3-3 Validity period does not meet acceptable criteria
F3-4 Poor product appearance & quality
F4ReplenishmentF4-1 Not first in, first out with validity period
F5Order pickingF5-1 Dirty logistics box causing defacement of inner goods
F5-2 Damaged incoming goods
F5-3 Outer box stickers and paper cards are marked incorrectly
F5-4 Actual orders mismatched with arrival items
F6ConsolidatingF6-1 Total number of incoming boxes and the number of pieces is incorrectly registered
F6-2 Receipt documents are incorrectly listed
F6-3 Returned & replenishment items do not match with actual returned items
F7Departure check F7-1 The logistics personnel’s dress and appearance do not conform to the regulations
F7-2 Distribution items shortage
F8ArrivalF8-1 Delayed arrival at the store
F8-2 Improper driving causing damage to the goods
F9DischargeF9-1 Toss goods carelessly
F10Check quantity F10-1 Missing or false delivery of goods
F10-2 Poor service attitude
F10-3 Not carrying out the corresponding check with the store
F10-4 Missing recovered materials
F11Abnormal reportF11-1 Failed to respond immediately
F11-2 customer service staff lack of professionalism
F11-3 poor service attitude of customer service staff
F12Account adjustmentF12-1 Adjustment error of over and short accounting
F12-2 Return goods is incorrectly accounted
Table 2. The improvement priority of failure model for transportation/distribution.
Operation ProblemCause of the ProblemSODRPNPriority
F10-4 Missing recovered materialsThe number of materials is not counted indeed.6.308.854.60256.471
F8-1 Delayed arrival at the storeInsufficient professional knowledge, abnormal route planning6.556.555.70244.542
F10-3 Not carrying out the corresponding check with the storeManagement norms are not implemented.6.408.054.45229.263
F7-2 Distribution items shortageThe quantity of goods is not counted indeed.6.007.204.45192.244
F7-1 The logistics personnel’s dress and appearance do not conform to the regulationsManagement norms are not implemented.6.254.906.20189.885
Table 3. Example of abnormal distribution failure mode of logistics (F10-3).
Type of FMEA: Abnormal DistributionDate:
Staff:Page: /
SERVICE ITEMPotential Failure ModePotential Failure EffectPotential Failure CauseCurrent Detection MethodSeverity (S)Occurrence (O)Detection (D)RPNRECOMMENDED Measure
Quantity countFalse hand over1. Wrong distribution or commodity missed
2. Distribtuion delay
3. Customer complaint
4. Subsquent liability
Management norms are not implemented.Return from staff of store6.408.054.45229.261. Enhance training of logistics personnel
2. Listed as appraisal item of logistics performance
3. Cadres randomly truck supervision with the truck
Table 4. Calculation result of correction rate (Cr).
ItemsKanoKOTGOC(OTG/OC)K+1Cr
F3-2 Year & specification inconsistent with main file standardsRM2150.010.99
F3-3 Validity period does not meet acceptable criteriaRM2180.001.00
F3-4 Poor product appearance & qualityRM21100.001.00
F5-2 Damaged incoming goodsRO1190.010.99
F6-1 Total number of incoming boxes and the number of pieces are incorrectly registeredRM2160.001.00
F5-3 Outer box stickers and paper cards are marked incorrectlyRM2180.001.00
F4-1 Not first in, first out with validity periodRO11100.010.99
F7-2 Distribution items shortageRO1140.060.94
F10-4 Missing recovered materialsRO11100.010.99
F10-3 Not carrying out the corresponding check with the storeRO1140.060.94
PS: Top ten items of priority improvement.
Publisher’s Note: MDPI stays neutral with regard to jurisdictional claims in published maps and institutional affiliations.

