Article

Solid Circulating Velocity Measurement in a Liquid–Solid Micro-Circulating Fluidised Bed

by
Orlando L. do Nascimento
,
David A. Reay
and
Vladimir Zivkovic
*
School of Engineering, Newcastle University, Newcastle upon Tyne NE1 7RU, UK
*
Author to whom correspondence should be addressed.
Processes 2020, 8(9), 1159; https://doi.org/10.3390/pr8091159
Submission received: 15 July 2020 / Revised: 4 September 2020 / Accepted: 10 September 2020 / Published: 16 September 2020

Abstract

:
Liquid–solid circulating fluidised beds (CFB) possess many qualities which makes them useful for industrial operations where particle–liquid contact is vital, e.g., improved heat transfer performance, and consequent uniform temperature, limited back mixing, exceptional solid–liquid contact. Despite this, circulating fluidised beds have seen no application in the micro-technology context. Liquid–solid micro circulating fluidised bed (µCFBs), which basically involves micro-particles fluidisation in fluidised beds within the bed of cross-section or inner diameter at the millimetre scale, could find potential applications in the area of micro-process and microfluidics technology. From an engineering standpoint, it is vital to know the solid circulating velocity, since that dictates the bed capability and operability as processing equipment. Albeit there are several studies on solid circulating velocity measurement in CFBs, this article is introducing the first experimental study on solid circulating velocity measurement in a CFB at micro-scale. The experimental studies were done in a novel micro-CFB which was fabricated by micro milling machining 1 mm2 cross-section channels in Perspex and in a 4 mm2 cross-section micro-CFB made by additive manufacturing technology. Soda-lime glass and polymethyl methacrylate (PMMA) micro-particles were employed as solid materials and tap water as the liquid medium. The digital particle image velocimetry (PIV) method was used as a measurement technique to determine the particle velocity in the micro-CFB system and validated by the valve accumulation technique using a novel magnetic micro-valve. The measured critical transition velocity, Ucr, is comparable to the particle terminal velocity, i.e., the normalised transition velocity is approximately 1 in line with macroscopic systems results and our previous study using simple visual observation. As in macroscopic CFB systems, Ucr decreased with solid inventory (1–9%) and finally becomes stable when the solid inventory is high enough (10–25%) and it increases with a reduction in particle size and density.

1. Introduction

Liquid–solid circulating fluidised beds have become the preferred liquid–solid contactors in several industrial processes due to their advantages such as improved heat transfer performance, and consequent uniform temperature, reduced back mixing, good liquid–solid contact, and good control of reaction and regeneration of biosolids or catalyst at the same time [1,2]. They have found applications in biochemical, hydrometallurgy, environmental, wastewater treatment, mineral processing, and petrochemical industries as reactors, bio-reactors, crystallizers, and heat exchangers [3,4]. In spite of this, circulating fluidised beds have not yet been applied in the micro-technology context. On the other hand, there are several studies of a micro-liquid-fluidised beds mainly concerning the hydrodynamics.
Micro-fluidised beds refer to fluidised bed with the bed inner diameter or cross-section at the millimetre scale [5,6,7,8] and find possible applications in a microfluidics and micro-technology context [9,10,11]. These types of bed are considered to be a promising way of achieving high quality fluid and solid mixing and process intensification of heat and mass transfer under a laminar flow regime and could potentially offer novel process opportunities [11,12,13]. Micro-reactors, in general, are considered to be ideal for performing reactions in circumstances which would normally be limited to mass and heat transport and unsafe operations [14]. Micro-fluidised beds combine the advantages of fluidised beds and micro-technology systems such as reduced pollution, waste and by-products, less energy and resources consumption, lower operational and capital cost, increased safety, intensive mass and heat transport, increased chemical reaction conversion rates, and exhibiting good mixing and temperature uniformity. All these important qualities make micro-fluidised beds more efficient and sustainable fluid-solid processing equipment, but the major application so far is in a fast screening of various solid particles chemical processes like solid reaction kinetics measurements, catalyst, and adsorbent screening [15,16,17,18]. Obviously, in some applications, continuous circulation of particles would be required, such as continuous catalyst regeneration where micro-circulating fluidised beds could be a great solid-fluid contactor device [19].
The solid circulating velocity measurement in a liquid-solid circulating fluidised bed has been reported previously by various researchers. Several research groups [20,21,22,23,24] measured the solid circulation rate by using a simple procedure with a measuring valve in the downcomer. The accumulation of particles above the ball valve at a given time interval could be measured by closing the downcomer with a valve; hence, giving the particle circulation rate. They reported an increase in solid circulation rate with liquid velocity and solid feed pipe diameter, but a decrease in solid circulation rate with increasing particle density and size. Roy et al. [25], and Hensler et al. [26] used a radioactive technique to determine the solid circulation rate. The basic theory was to estimate the volumetric flowrate of particles by measuring the particles velocity and volume fraction in the downcomer. Particle volume fraction was obtained by densitometry measurement, while particle velocity was obtained by time of flight measurement. However, this measurement technique is expensive, and requires lots of safety measures. Wu et al. [27] and Masuda and Iinoya [28] employed an impact plate flow meter to estimate the particle circulation rate. In this technique, an impact flow meter installed in the downcomer is employed to estimate the solid circulation rate by measuring the force of re-circulating particles falling onto an inclined plate. The disadvantage of this type of measurement technique is the issues with its breadth measurement range and calibration is very difficult. Rahman et al. [29] and Guío-Pérez et al. [30] used a thermal tracing technique to measure the particle circulation rate. The technique works by inserting cold particles inside a bed of particles at high temperature and then use thermocouples to trace their motion. Their experimental data was validated by the accumulation technique and showed a good agreement.
As follow up to our initial study on mapping regimes of liquid–solid micro-fluidised using visual observation only [31], this article is introducing the first experimental study of solid circulating velocity measurement in a CFB at micro-scale. Particle manipulation and processing in micro-technology devices is still a major challenge impacting the field [32]. Development of a micro circulating fluidised bed is providing one solution to the problem, e.g., for solid catalyst recovery, recycle, and regeneration [33,34]. Measurement of solid circulating velocity in a micro-circulating fluidised bed is extremely hard to be implement using current measurement technology such as butterfly valve, electrical capacitance, X-ray, magnetic resonance imaging, as they are expensive, and it is very difficult to scale down these techniques for application in a microfluidics context [10]. To design a liquid–solid micro-circulating fluidised bed successfully for micro-technology applications, it is important to understand their hydrodynamics such as solid circulating velocity as it determines the bed performance as processing equipment, controlling heat and mass transfer, and dictating mixing in the system [35]. An accurate solid circulating velocity measurement is desirable as it reduces operational and capital cost, increases safety, and provides process stability [30].
A digital PIV technique has been employed previously by researchers for measuring the flow velocity profiles in the granular flow [36,37]. The advantage of this technique over other conventional techniques such as the radioactive and thermal tracing technique is that it is non-invasive and easy to implement in microfluidics setup which is not trivial for the radioactive and thermal tracing. In the current research investigation, particle imaging velocimetry (PIV) software PIVlab [38], was used to determine the solid circulating velocity in the micro-circulating fluidised bed. The PIV measurements were first validated by the valve accumulation technique using a custom made magnetic micro-valve. The effects of operating parameters such as solids inventory, particle property on solid circulating velocity have been carefully studied using PIVlab and MATLAB.

2. Experimental Details

2.1. Experimental Set up

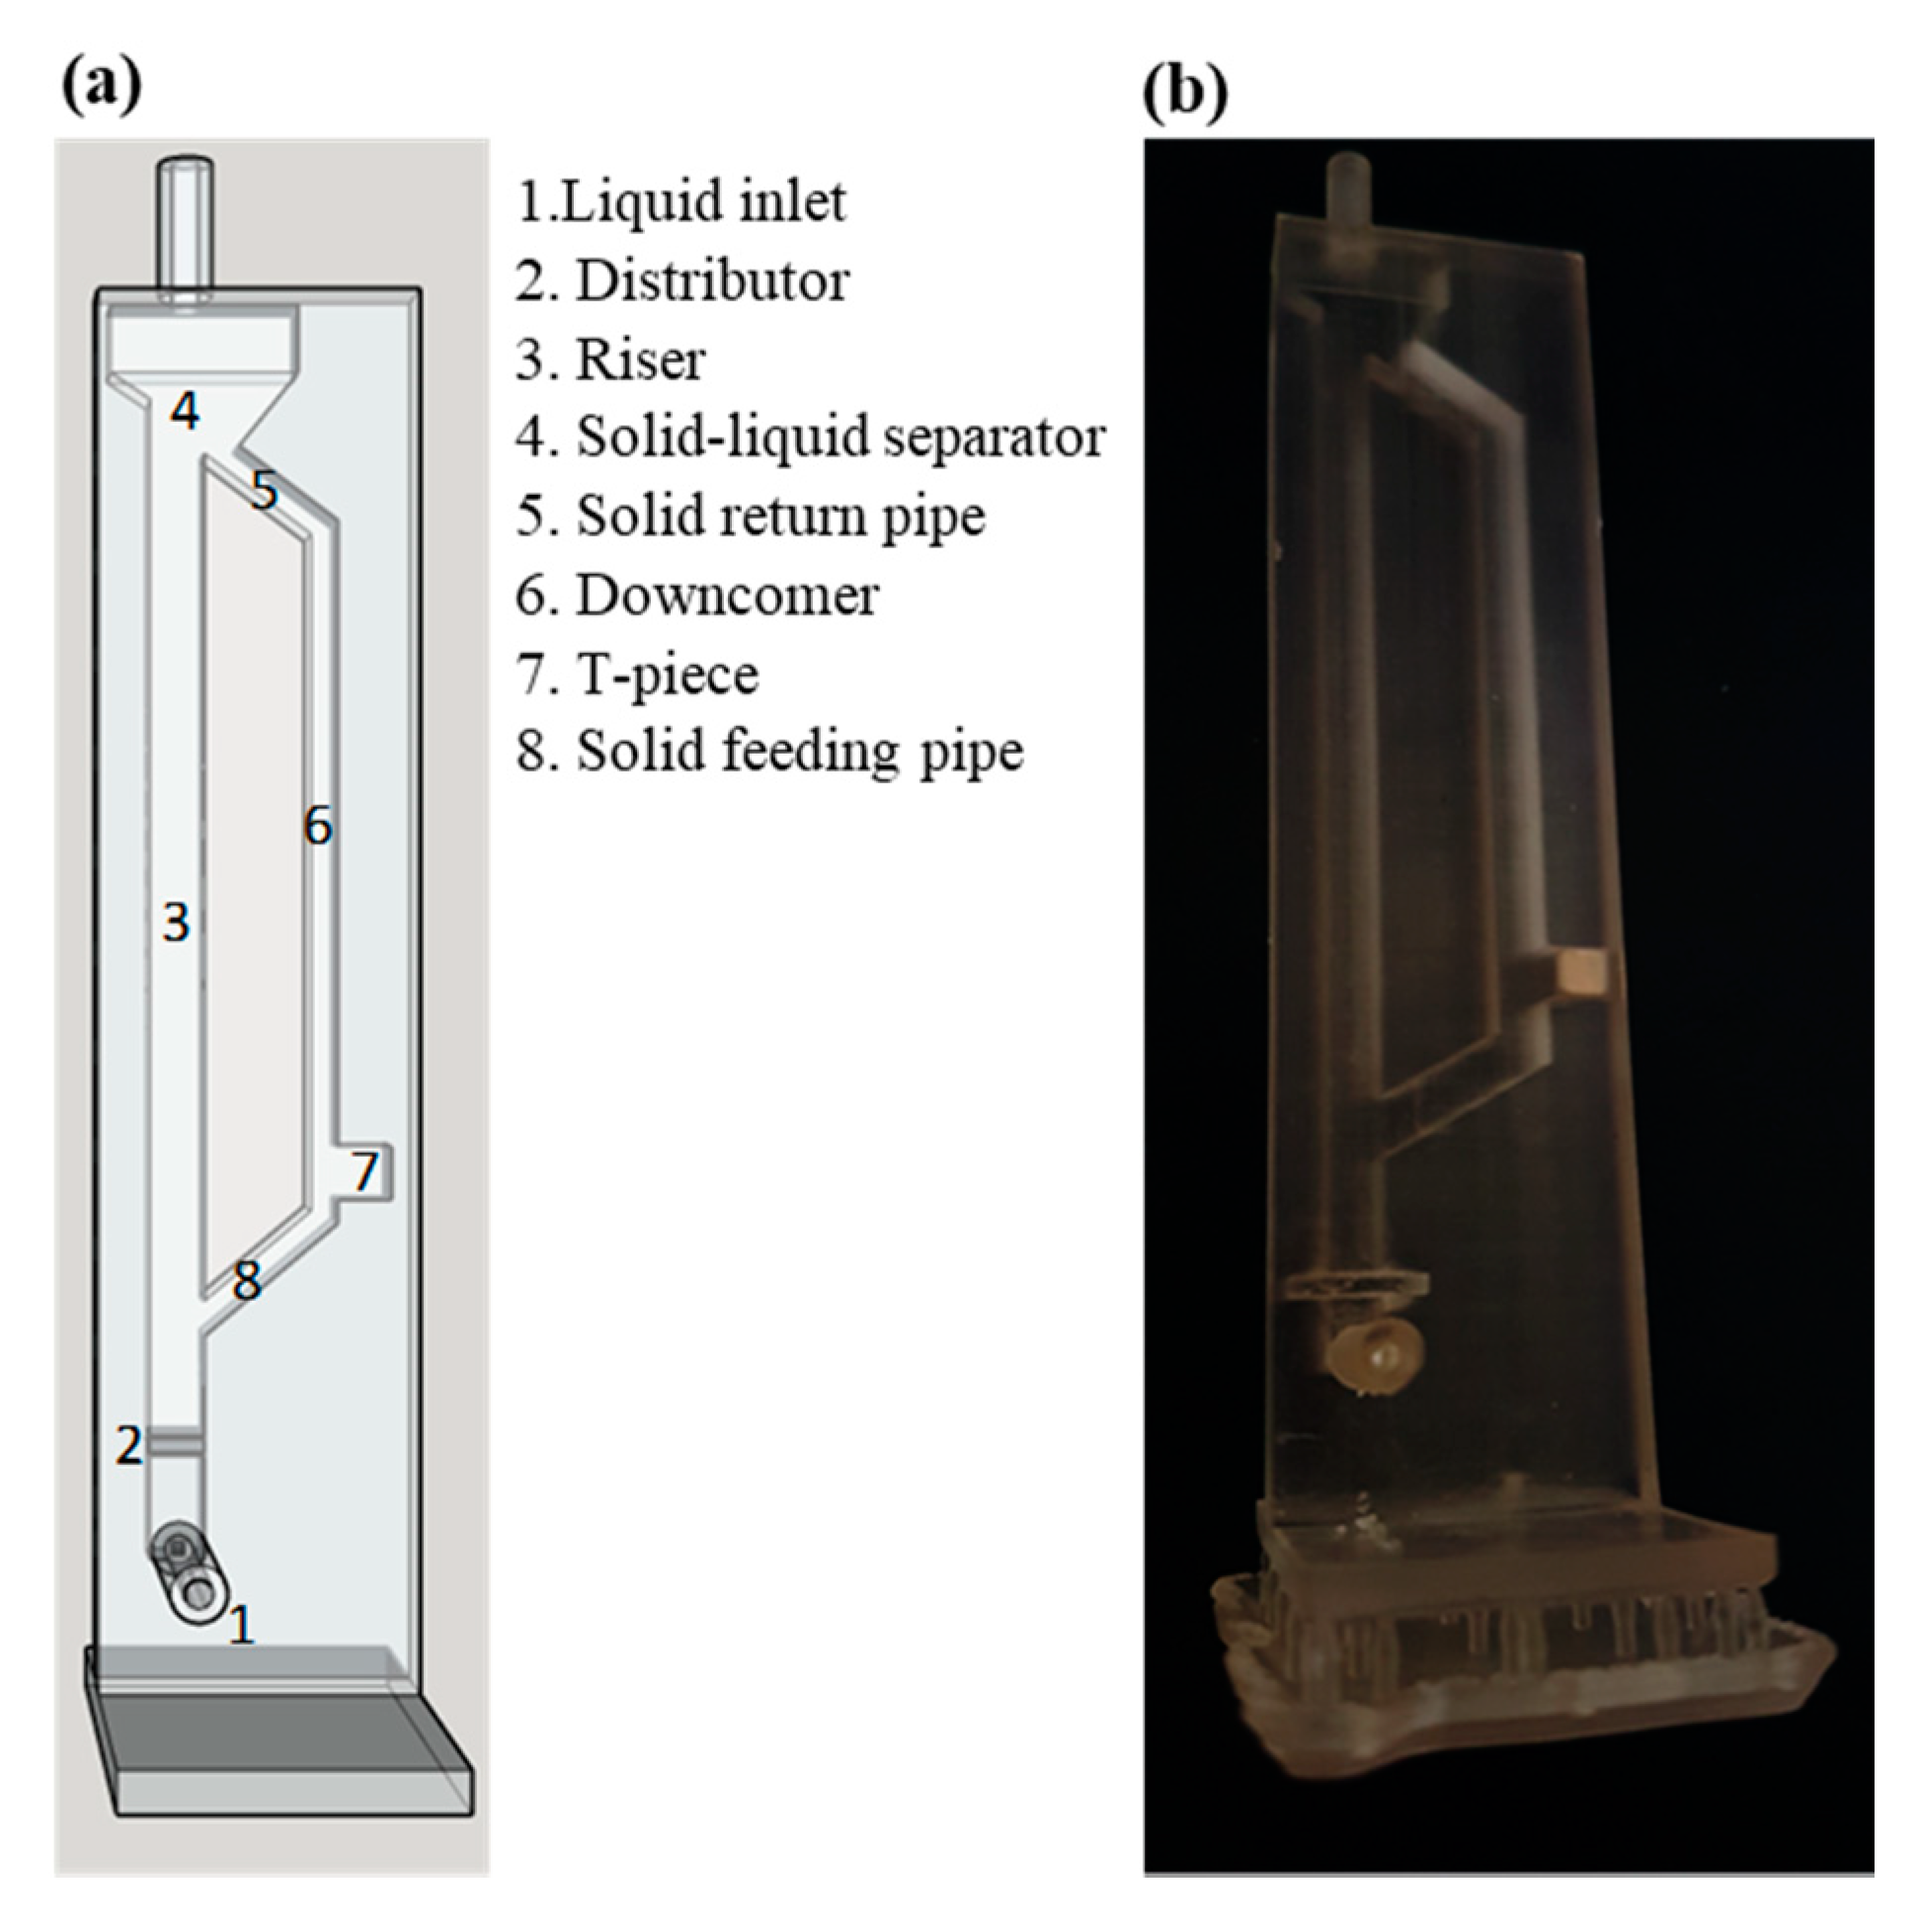
The experimental set up in the present study is schematically illustrated in Figure 1a. A syringe pump (AL-4000, WPI INC., Hertfordshire, UK) was employed to pump the water using 5- or 20-mL B-D Plastipak syringes at the desired velocity, and digital camera (Basler aCA1300-200 uc, Edmund Optics Ltd., York, UK) was used to record the micro fluidisation behaviour. Two different micro-circulating fluidised bed systems were used. The first micro-circulating fluidised bed system used was fabricated by micro-milling channels in Perspex as schematically illustrated in Figure 1b, which was also used in our previous study for mapping flow regimes of micro-circulating fluidised bed [31]. The liquid–solid micro circulating fluidised bed components includes a riser (1 mm2 cross-section, 1 mm width, depth 1 mm, and 100 mm height), downcomer, t-piece, solid–liquid separator, solid feeding pipe, solid return pipe, and a porous plate liquid distributor (1.5 mm thick with 21 µm mean pore size) at the bottom of the bed to give stable and uniform fluidisation across the system and to support the particle bed during the fluidisation experiment.
The second micro circulating fluidised bed system was made by additive manufacturing technology, using digital light processing (Miicraft+ printer, Young Optics Europe GmbH, Jena, Germany) and stereolithography (Form2 printer, Formlabs GmbH, Berlin, Germany). 3D printers as already proven methodology in our group [39,40,41]. In digital light processing (DLP) and stereolithography (SLA) technique, 3D solid objects are created by joining material in a layer upon layer fashion using a liquid photopolymer resin by applying an ultraviolet (UV) light until the physical part is complete [42,43,44]. The Form2 printer employs a UV light (spot size of 140 μm, and laser power of 250 mW) to cure the photopolymer resin, while the Miicraft+ printer employs a digital micromirror device to project the entire layer geometry at once, curing all points simultaneously. The two printers used similar clear photopolymer resin. The clear resins are a mixture of methacrylic acid esters and photo-initiators. The detailed 3D printer specifications are summarised in Table 1. For the MiiCraft+ printer, preliminary tests confirmed that a 50 µm layer thickness with curing time of 8 s was optimal. This was because curing time lower than 8 s caused print deformation, and higher than 8 s resulted in channel blockage by cured resin. These problems were not experienced with the Form2 printer.
The 3D printing fabrication process consisted of four major steps: image design, image post-processing, 3D printing, and post-processing of prints [45,46]. First, 3D modelling computer program SketchUp was used to create a digital image of the structure to be made, which is then converted into the stereolithography file format (.stl files) and transferred to the 3D printer apparatus, which creates the 3D solid structure layer by layer until the desired solid object is completed. For post-processing of printed beds, an isopropyl alcohol ultrasonic bath (FormWash) was employed to clean the CFB for about 30 min to remove the excess/uncured liquid resin. Once washing was completed a 405 nm UV light (FormCure) was used to cure the CFB at 60 °C for 40–60 min. Post-processing was an important step as it enhanced the printed CFB mechanical properties.
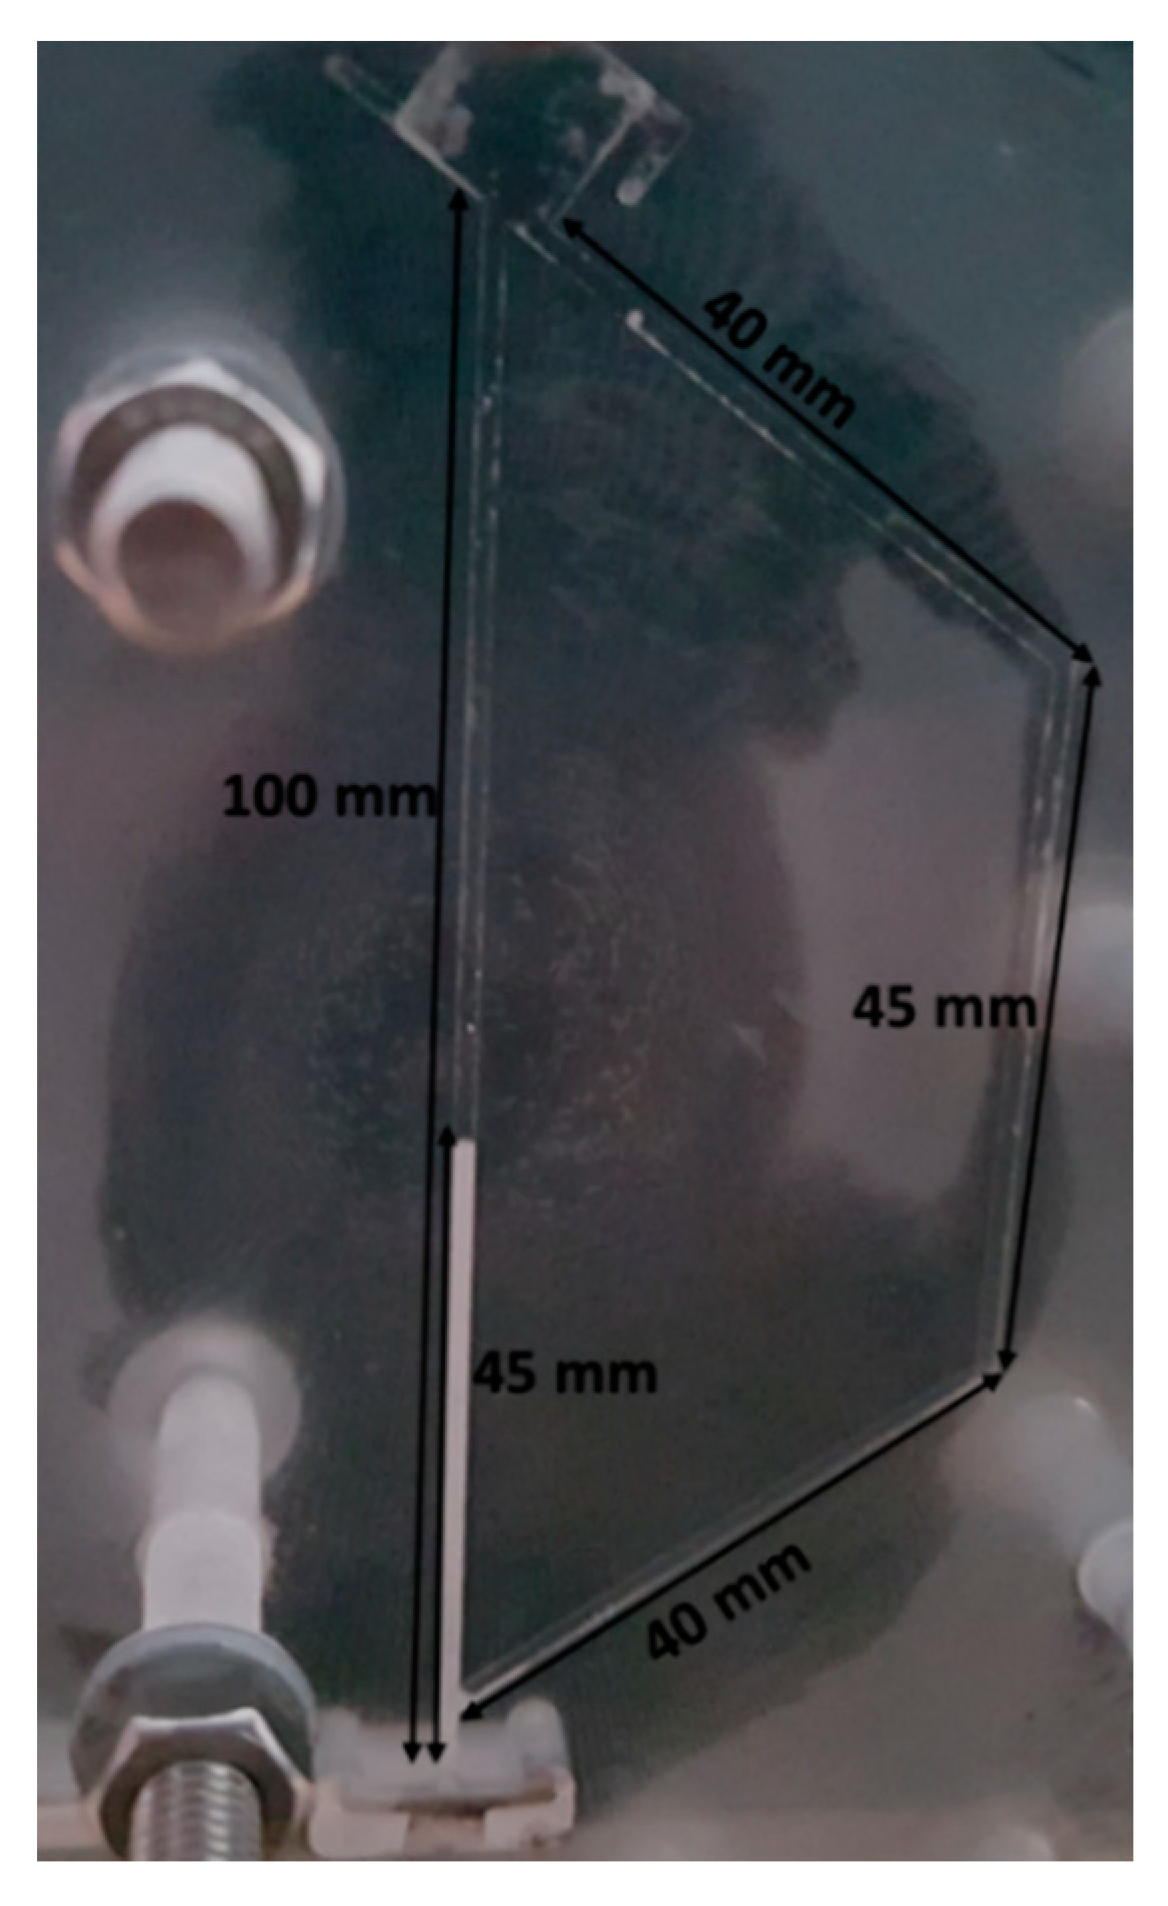
Figure 2 compares the CAD model of the micro-circulating fluidised bed with the final experimental prototype used primarily to measure the particle circulating velocity by accumulation method to validate the PIV measurement. With 3D printing it is easy to implement the magnet valve to measure the particle circulating velocity, which would be difficult to implement using the present traditional manufacturing technique.
The 3D printed micro circulating fluidised bed comprises also of the same basic components as micro-machined bed: riser (again of 100 mm in height), downcomer, t-piece, solid–liquid separator, solid feed pipe, solid return pipe, and a liquid distributor at the bottom of the bed as can be seen in Figure 2. However, the difference is that the cross-section of channels (i.e., riser and solid feed and return pipes) were of 2 × 2 mm2 cross-sections, width 2 mm and depth 2 mm. The distributor is a two-layers of parallel array pillars of 150 µm diameter and 100 µm spacing, which provided stable and uniform fluidisation across the system, and stopped the micro-particles exiting the bed. The bed was manufactured with three sides (open channel), and the magnet was manually inserted inside the bed in the T-piece, and a 3 mm thick Perspex sheet was used to seal the channel and subsequently checked for leaking. This option was chosen instead of closed channel (four-sided) because it was easier to implement the magnet inside the bed but also because the Perspex sheet provided better visualisation characteristics. The MiiCraft+ printer was able to produce the micro-circulating fluidised bed within 6 h, while the form2 printer allowed the fabrication of four micro-circulating fluidised bed simultaneously inside 8 h.

2.2. Particle and Liquid Materials

The fluidised particles in this experimental study were glass beads micro-particles of nine different diameters, d = 26 ± 1.5 µm, 30 ± 1.5 µm, 35 ± 3 µm, 58 ± 5 µm, 82 ± 6 µm, 98 ± 8 µm, 115 ± 9 µm, 165 ± 15 µm, 196 ± 16 µm with density of ρp = 2500 kg/m3, and polymethyl methacrylate (PMMA) micro-particles of five different diameters, d = 23 ± 3.5 µm, 35 ± 3 µm, 41 ± 3.5 µm, 58 ± 5 µm, and 115 ± 9 µm with density of ρp = 1200 kg/m3. Tap water (density ρf = 998 kg/m3 and viscosity µf = 0.001 Pa s) was employed as the liquid medium to fluidise the micro-particles. The experiments were done at an ambient temperature of 18 ± 2 °C. The Stokes particle terminal velocity for the laminar flow, which is applicable to the research investigation presented here, is given by
                                                      U t = ( ρ p ρ f ) g d p 2 18 μ
where g is the gravitational acceleration.

2.3. Experimental Methodology

Before each fluidisation experiment, the micro-circulating fluidised bed was totally filled with tap water and micro-particles (soda-lime glass microsphere or PMMA) to a specific bed height forming a bed of particle in the riser. The solid inventory in the system was determined by ImageJ [47]. This was done by measuring the initial static bed height using ImageJ and expressed as surface percentage occupied by the particles out of the whole system surface (in this case this is the same as volume percentage as the depth is constant) as shown in Figure 3. Tap water as the fluidising medium was pumped into the riser using a syringe pump at specific superficial liquid velocity. The bed of particles at the base of the riser were fluidised by the upward liquid flow. With an increase in the liquid velocity, particles were transported farther up the riser. When the liquid velocity was sufficiently high, particles left the riser and entered the solid–liquid separator where they were separated from the liquid and returned to the riser via the solid feeding pipe. The circulating fluidisation experiments were done by increasing and reducing the liquid velocity. To ensure the accuracy and reproducibility of the experimental results, this procedure was repeated three times for each particle.
Digital movies of granular flow were captured by a Basler aCA 1300–200 uc digital camera which as a resolution of 1.3 MP. Basler Pylon viewer software was used to monitor the recording process. A flexible fibre optic illuminator was used to illuminate the granular flow in the circulating fluidised bed and produce high quality images. The camera capture rate was set to 25 fps with a shutter time of 100 µs after preliminary test revealed that it provided high-quality videos without motion blur and the optimal PIV results. Each video had a recording time of 20 s. The digital images and movies of liquid–solid fluidisation behaviour were saved on a computer for offline study. The off-line examination comprised of movies conversion into successive frame sequences by VLC media player, and particle displacement calculation from successive frames using PIVlab in Matlab [38], which determines the particle velocity by a PIV algorithm of cross-correlating on a small sub-grid of images in successive frames.
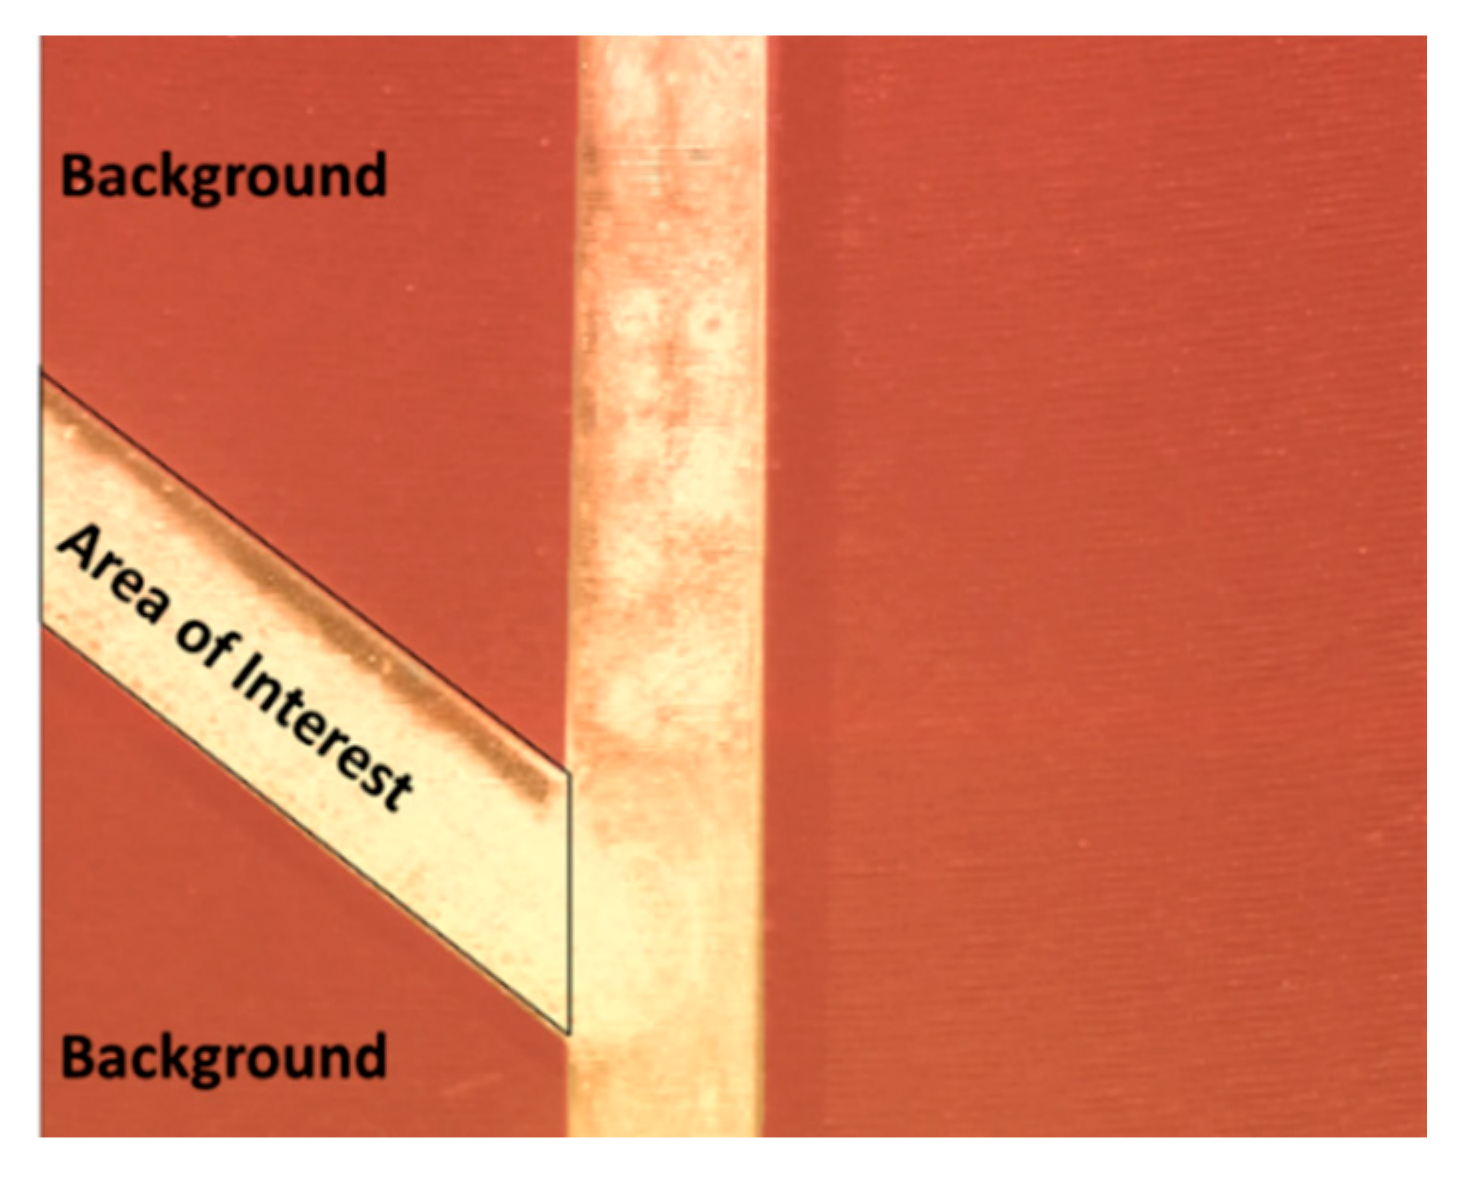
Determination of particle displacement using the PIVlab code in the current research investigation is summarised as follow: The solid feed pipe was chosen as the region of interest and a mask was applied to exclude the outside regions from the analysis as shown in Figure 4. Choosing an area of interest was important as it reduced the computational time. The area of interest was about 3 × 1 mm. Image pre-processing of contrast-limited adaptive histogram equalization (CLAHE) was applied to all frames to improve the image contrast and the probability of detecting valid vectors [38]. Each image was divided into small sub images (interrogation region), and cross-correlation of successive frames was applied to determine the most likely displacement of particles in these regions. Particle displacement was determined using fast Fourier transform (FFT) correlation with multiple pass and deforming windows algorithm. A three step cross correlation analysis with an interrogation window size of 64 pixels in the first pass, 32 pixels in the second pass, and 16 pixels in the third pass (corresponding to 0.64, 0.32, and 0.16 mm in real scale respectively) was chosen to determine the particle displacement of the image data, and each interrogation area was overlapped by 50%. These PIV setting was found to yield excellent resolution with minimal noise and satisfy the Keane and Adrian [48] recommended guideline. The displacement information obtained in each pass is used to shift the interrogation windows in the next pass to increase the resolution of vector map, and signal-to-noise ratio without sacrificing robustness. All the PIV calculations were performed on partially overlapping frame pairs (i.e., 1–2, 2–3, 3–4 etc.). The maximum particle image displacement was found to be approximately 5 pixels in all experimental investigation (less than 2 particle diameters). The particle image density was estimated to be 10–15 particles per interrogation area, which satisfy the Thielicke and Stamhuis [38] recommended guideline, and the particle image diameter was approximately 3 pixels. The vector fields were smoothed and validated using a number of filters (local median filter, and standard deviation filter) while missing data were interpolated using the boundary value solver interpolation technique to increase the accuracy of the velocity calculation. The above procedure was repeated to calculate the velocity (horizontal u and vertical v component) for each frame for all the PMMA and glass particles at various liquid flowrates.
The results obtained using PIVlab code was exported as a consecutive Mat-file into Matlab workspace for further processing. Initial PIVlab image analysis showed considerable background movement which was periodic up and down indicated external vibration as the source of this, so it was necessary to calculate movement velocity of the part of the background region in Figure 4. The velocities were then correctly adjusted by subtracting this determined background motion avoiding erroneous velocities for the area of interest (e.g., in some instances upward solid velocities were obtained in original PIVlab results). These corrections for background movement were performed in all analyses. Matlab was also employed for time averaging of velocity field for each particle at different liquid flow rate by averaging the instantaneous velocity obtained using the PIVlab code and MATLAB correction for the background motion as described above.
In the present study, the pressure drop across the micro fluidised bed was not measured, because it is very difficult due to very fine resolution required, the pressure drop across the bed is only of the order of few Pascals. The transition velocity was obtained by solid circulating velocity method. In solid circulating velocity technique, the transition velocity values were obtained from the plot of solid circulating velocity vs. superficial liquid velocity. The critical transition velocities from conventional to circulating fluidised bed regime was determined as the intercept of no particle flow (nearly zero) and initial circulating zone line. The transport transition velocity, which delineates the transition from circulating fluidised bed regime to transport regime is observed by the particles leaving the system.

3. Results and Discussion

3.1. Solid Circulation Rate by Accumulation Method as Validation Experiments

An independent experimental study was carried out to measure the solid circulating velocity in a liquid–solid micro-circulating fluidised bed. In this experimental investigation, a novel measurement technique of a micro-magnet valve for solid circulation velocity measurement was developed to measure the solid circulating velocity in the micro-circulating fluidised bed and the results was compared with those obtained using PIV software.
In order to validate the PIV measurement in a micro-circulating fluidised bed, two experimental measurements were carried out, the first experiment was the solid circulating velocity measurement by PIV technique and the second experimental investigation was the solid circulating velocity measurement by accumulation method. The system used for both experimental studies was made by additive manufacturing technology as shown in Figure 2. For the solid circulating velocity measurement by PIV methodology all the procedures given in Section 2.3 were employed. In this experimental investigation lime glass micro-particles of two different diameters, d = 165 ± 15 µm and d = 196 ± 16 µm with density of ρp = 2500 kg/m3 were employed as the solid phase and tap water as the liquid medium. The above microsphere glass particles were chosen for this experimental study because the liquid distributor was not able to support any particle of diameter below 150 µm.
A magnet was installed inside the micro-circulating fluidised bed (downcomer) as shown in Figure 5, and an external magnet was used to move and control the magnet inside the bed. By closing the downcomer with the magnet valve, which was installed in the circulating fluidised bed, the accumulation of particles above the magnet valve at a given time interval could be measured, giving the particle circulation rate. Then, Equation (2) was employed to calculate the particle circulation rate. Since the bed was transparent, it was possible to observe visually the accumulation of solids after closing the valve, and ImageJ was used to determine the bed height from movie frames. The overall solid circulation rate is expressed as
    G s = A d A r Δ H ρ P Δ t
where Ar and Ad are the downcomer and riser cross-sectional areas, respectively, ΔH the recorded bed height, and Δt time of particle accumulation above the valve.
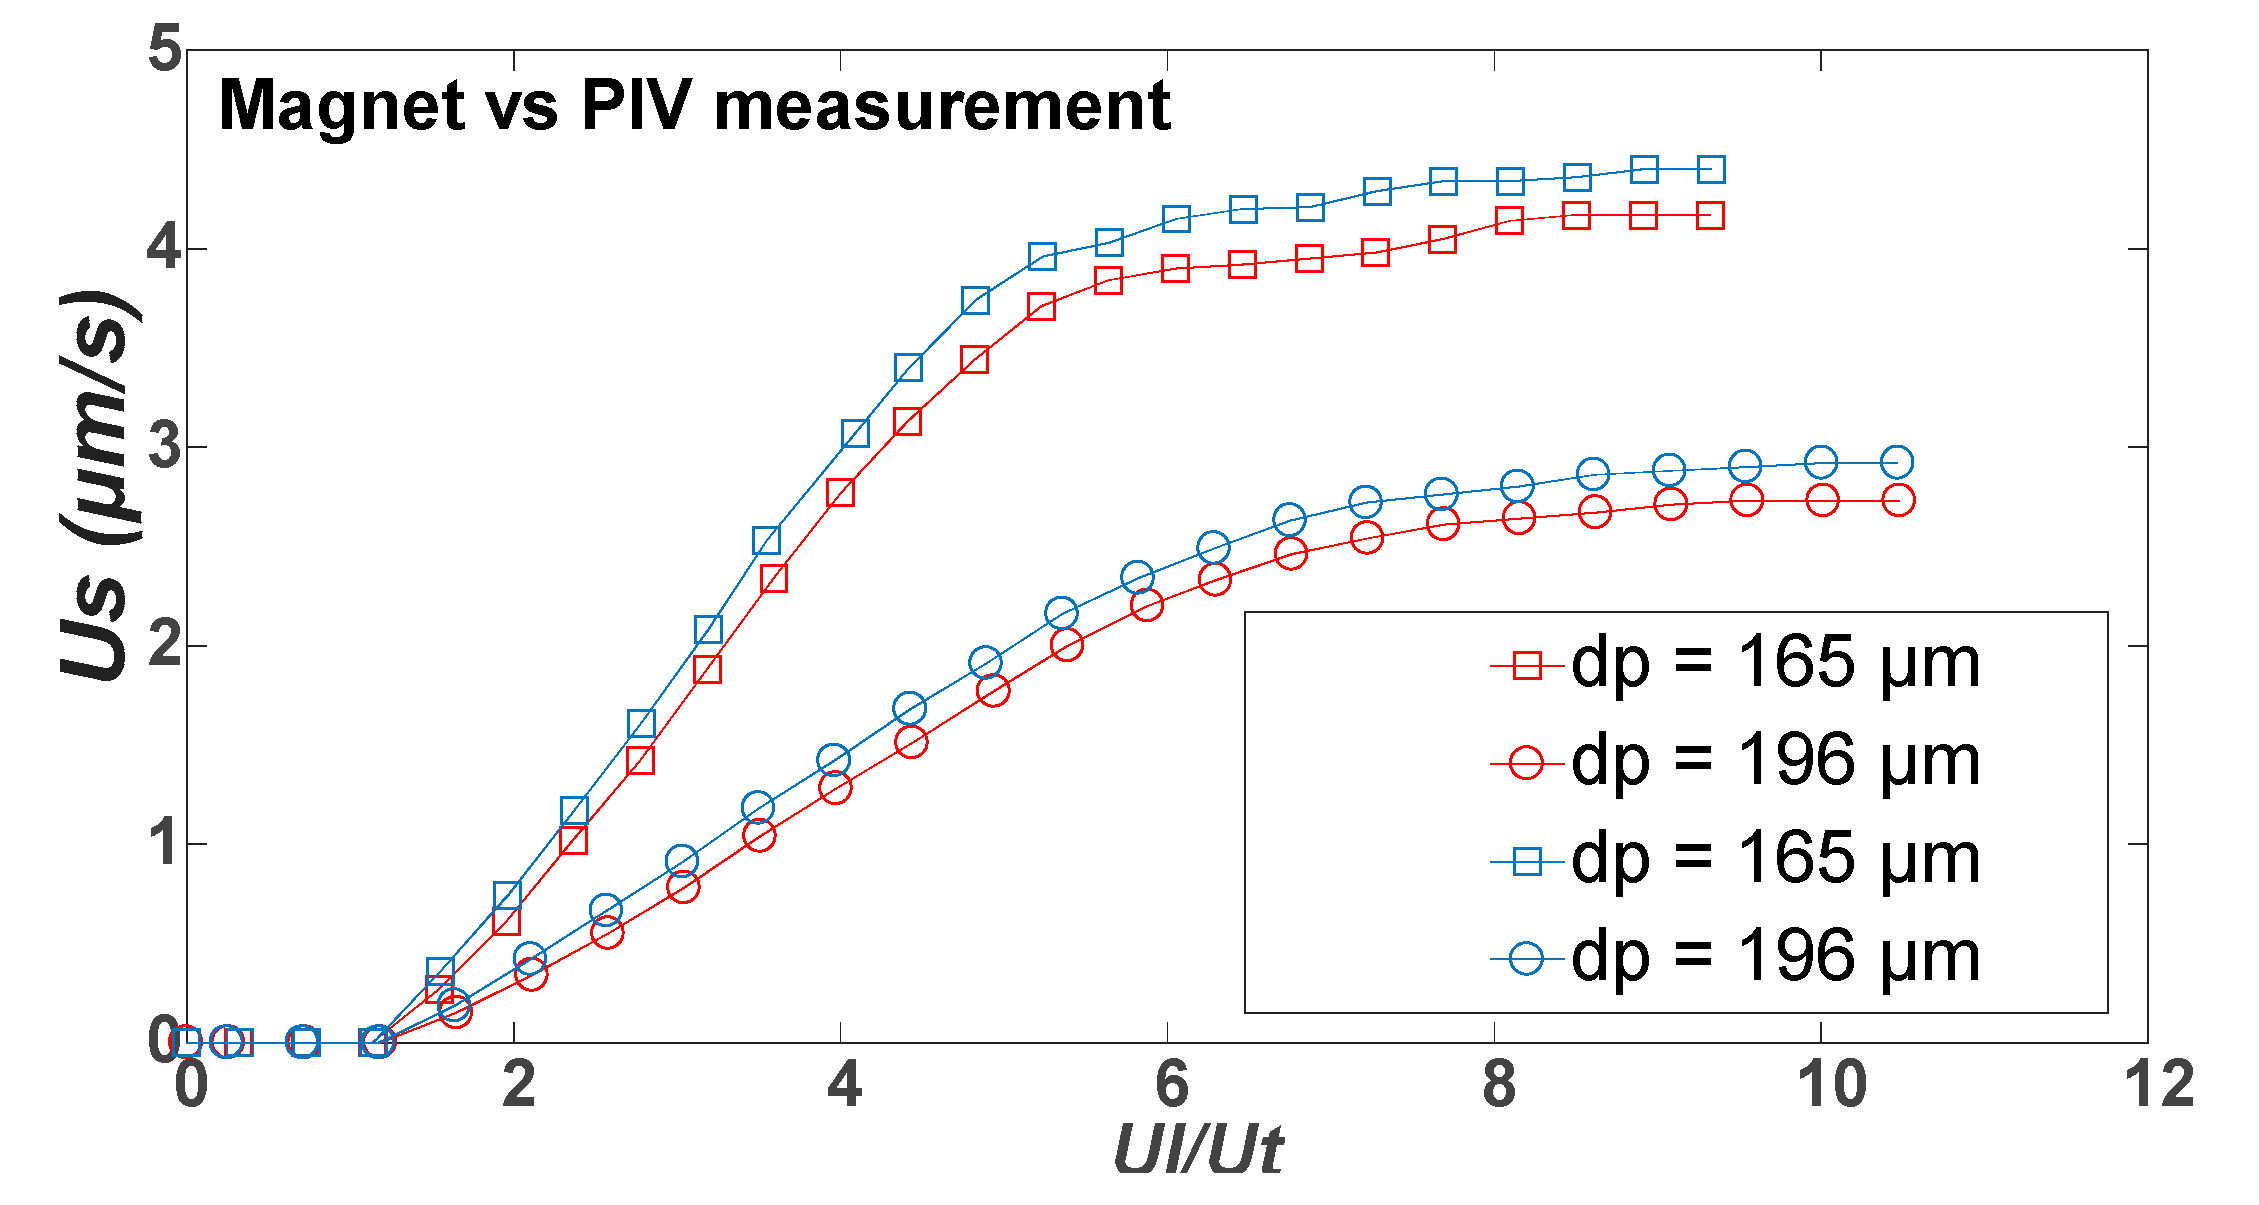
Figure 6 presents the experimental results obtained from both, the solid circulating velocity measurement by PIV technique and with magnet valve technique. We plotted the particle circulation velocity as a function of normalised velocity for both 165 µm and 196 µm glass microsphere particles. To facilitate comparison between the PIV technique and the accumulation method, the solid circulation rate obtained from the accumulation method was converted to circulating solid velocity using Equation (3) [21,49].
U s = G s ρ p        
where ρs is the solid density, Us solid circulating velocity, and Gs solid circulation rate.
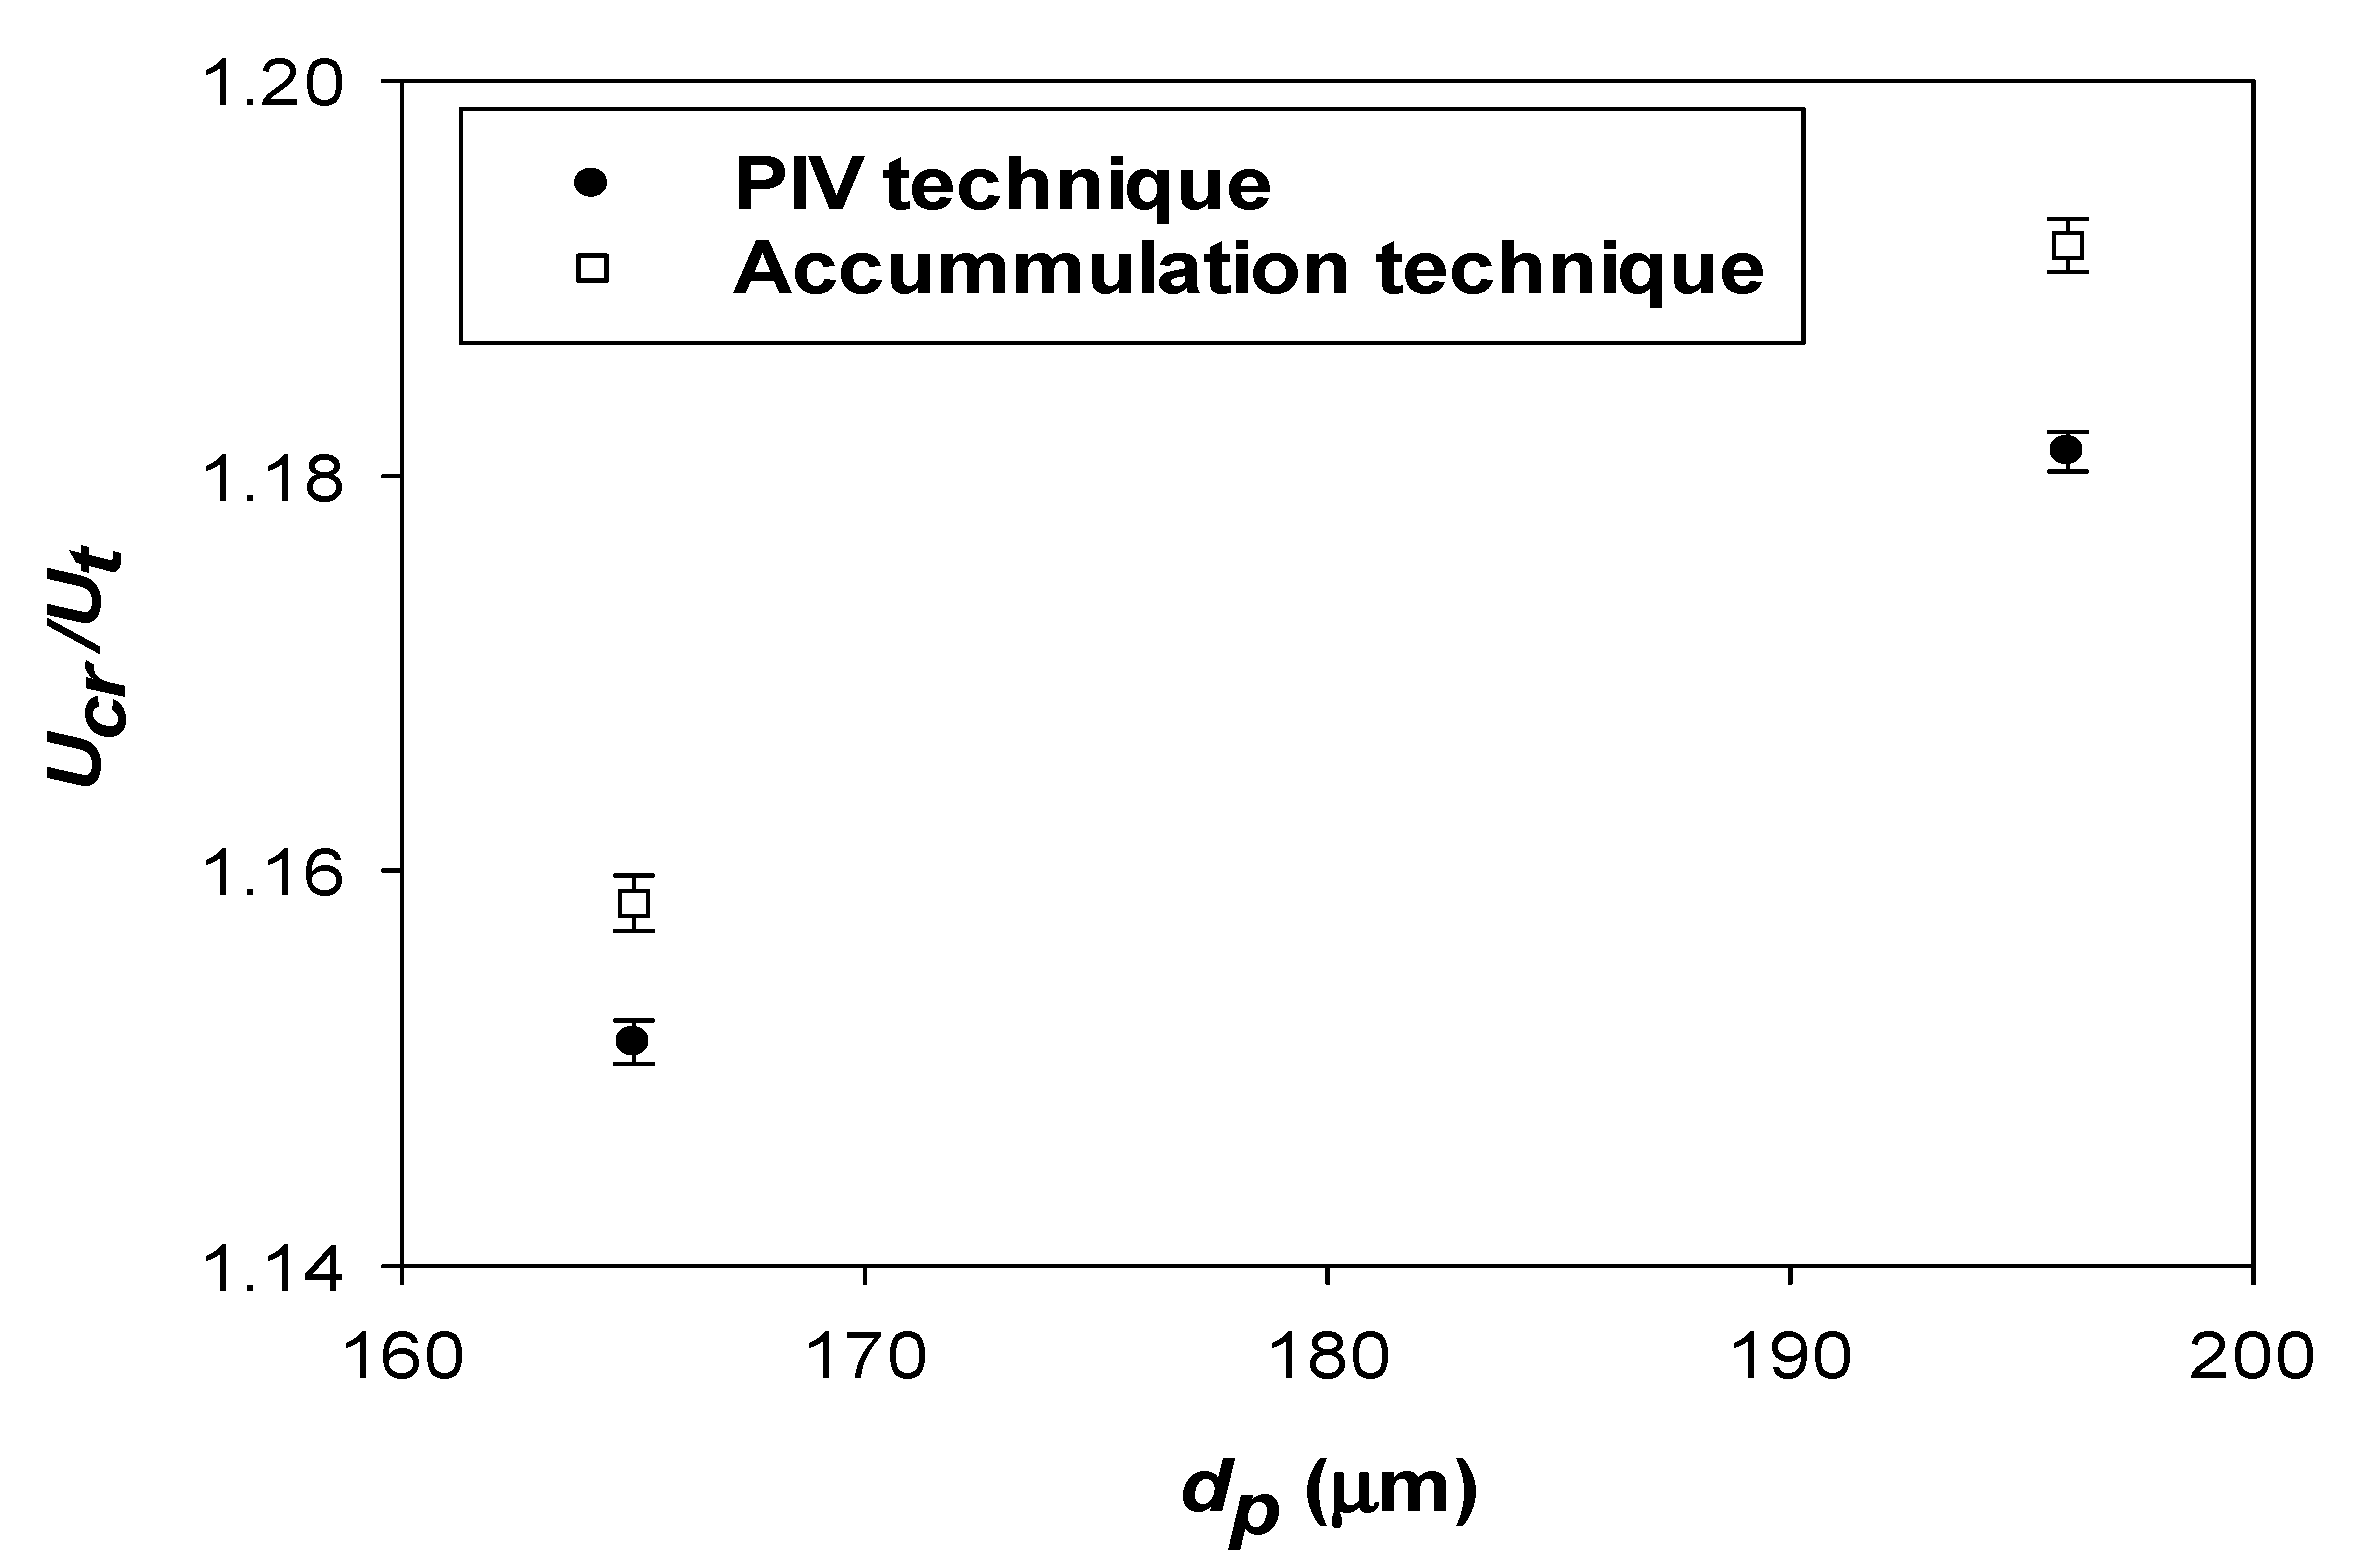
In general, the solid circulating velocity based on the accumulation method (magnet) was found to be 5–10% lower than the PIV technique measurements for all liquid velocities as displayed in Figure 6. However, the critical transition velocities, Ucr, obtained using both types of measurement technique, were almost identical, as displayed in Figure 7. The critical transition velocity is just a little bit bigger for the accumulation technique for both 165 and 196 µm particles. Furthermore, the trends are virtually identical with an initial increased particle velocity with increased liquid flow rate before plateauing at certain, almost identical velocities, for both measurement methods. These trends in solid circulation velocity as a function of liquid velocity are thoroughly discussed further below in Section 3.2.
Albeit the accumulation technique was simple to conduct and allowed direct measurement of the solid circulating velocity, the measurement was not continuous, and it is very time-consuming. In addition, the interference caused by closing the downcomer with the magnetic valve disturbs the steady-state flow in the bed. Particle accumulation in the circulating fluidised bed downcomer implies a reduction of particles in other part of the system and this introduces changes to fluidisation characteristics in the riser during the measurement. The higher the volume of particles accumulated above the magnet in the downcomer during the measurement, albeit increasing resolution of the results, the less reliable is the experimental result as it influences dynamics in other parts of the system. Overall the results obtained from these techniques agreed well with each other, and this agreement provided a strong basis for the deployment of a particle image velocimetry (PIV) software PIVlab method as a novel, simpler, and faster approach instead of an accumulation technique to determine the solid circulation rate in a micro-circulating fluidised bed.

3.2. Influence of Liquid Flow Rate on Solid Circulating Velocity

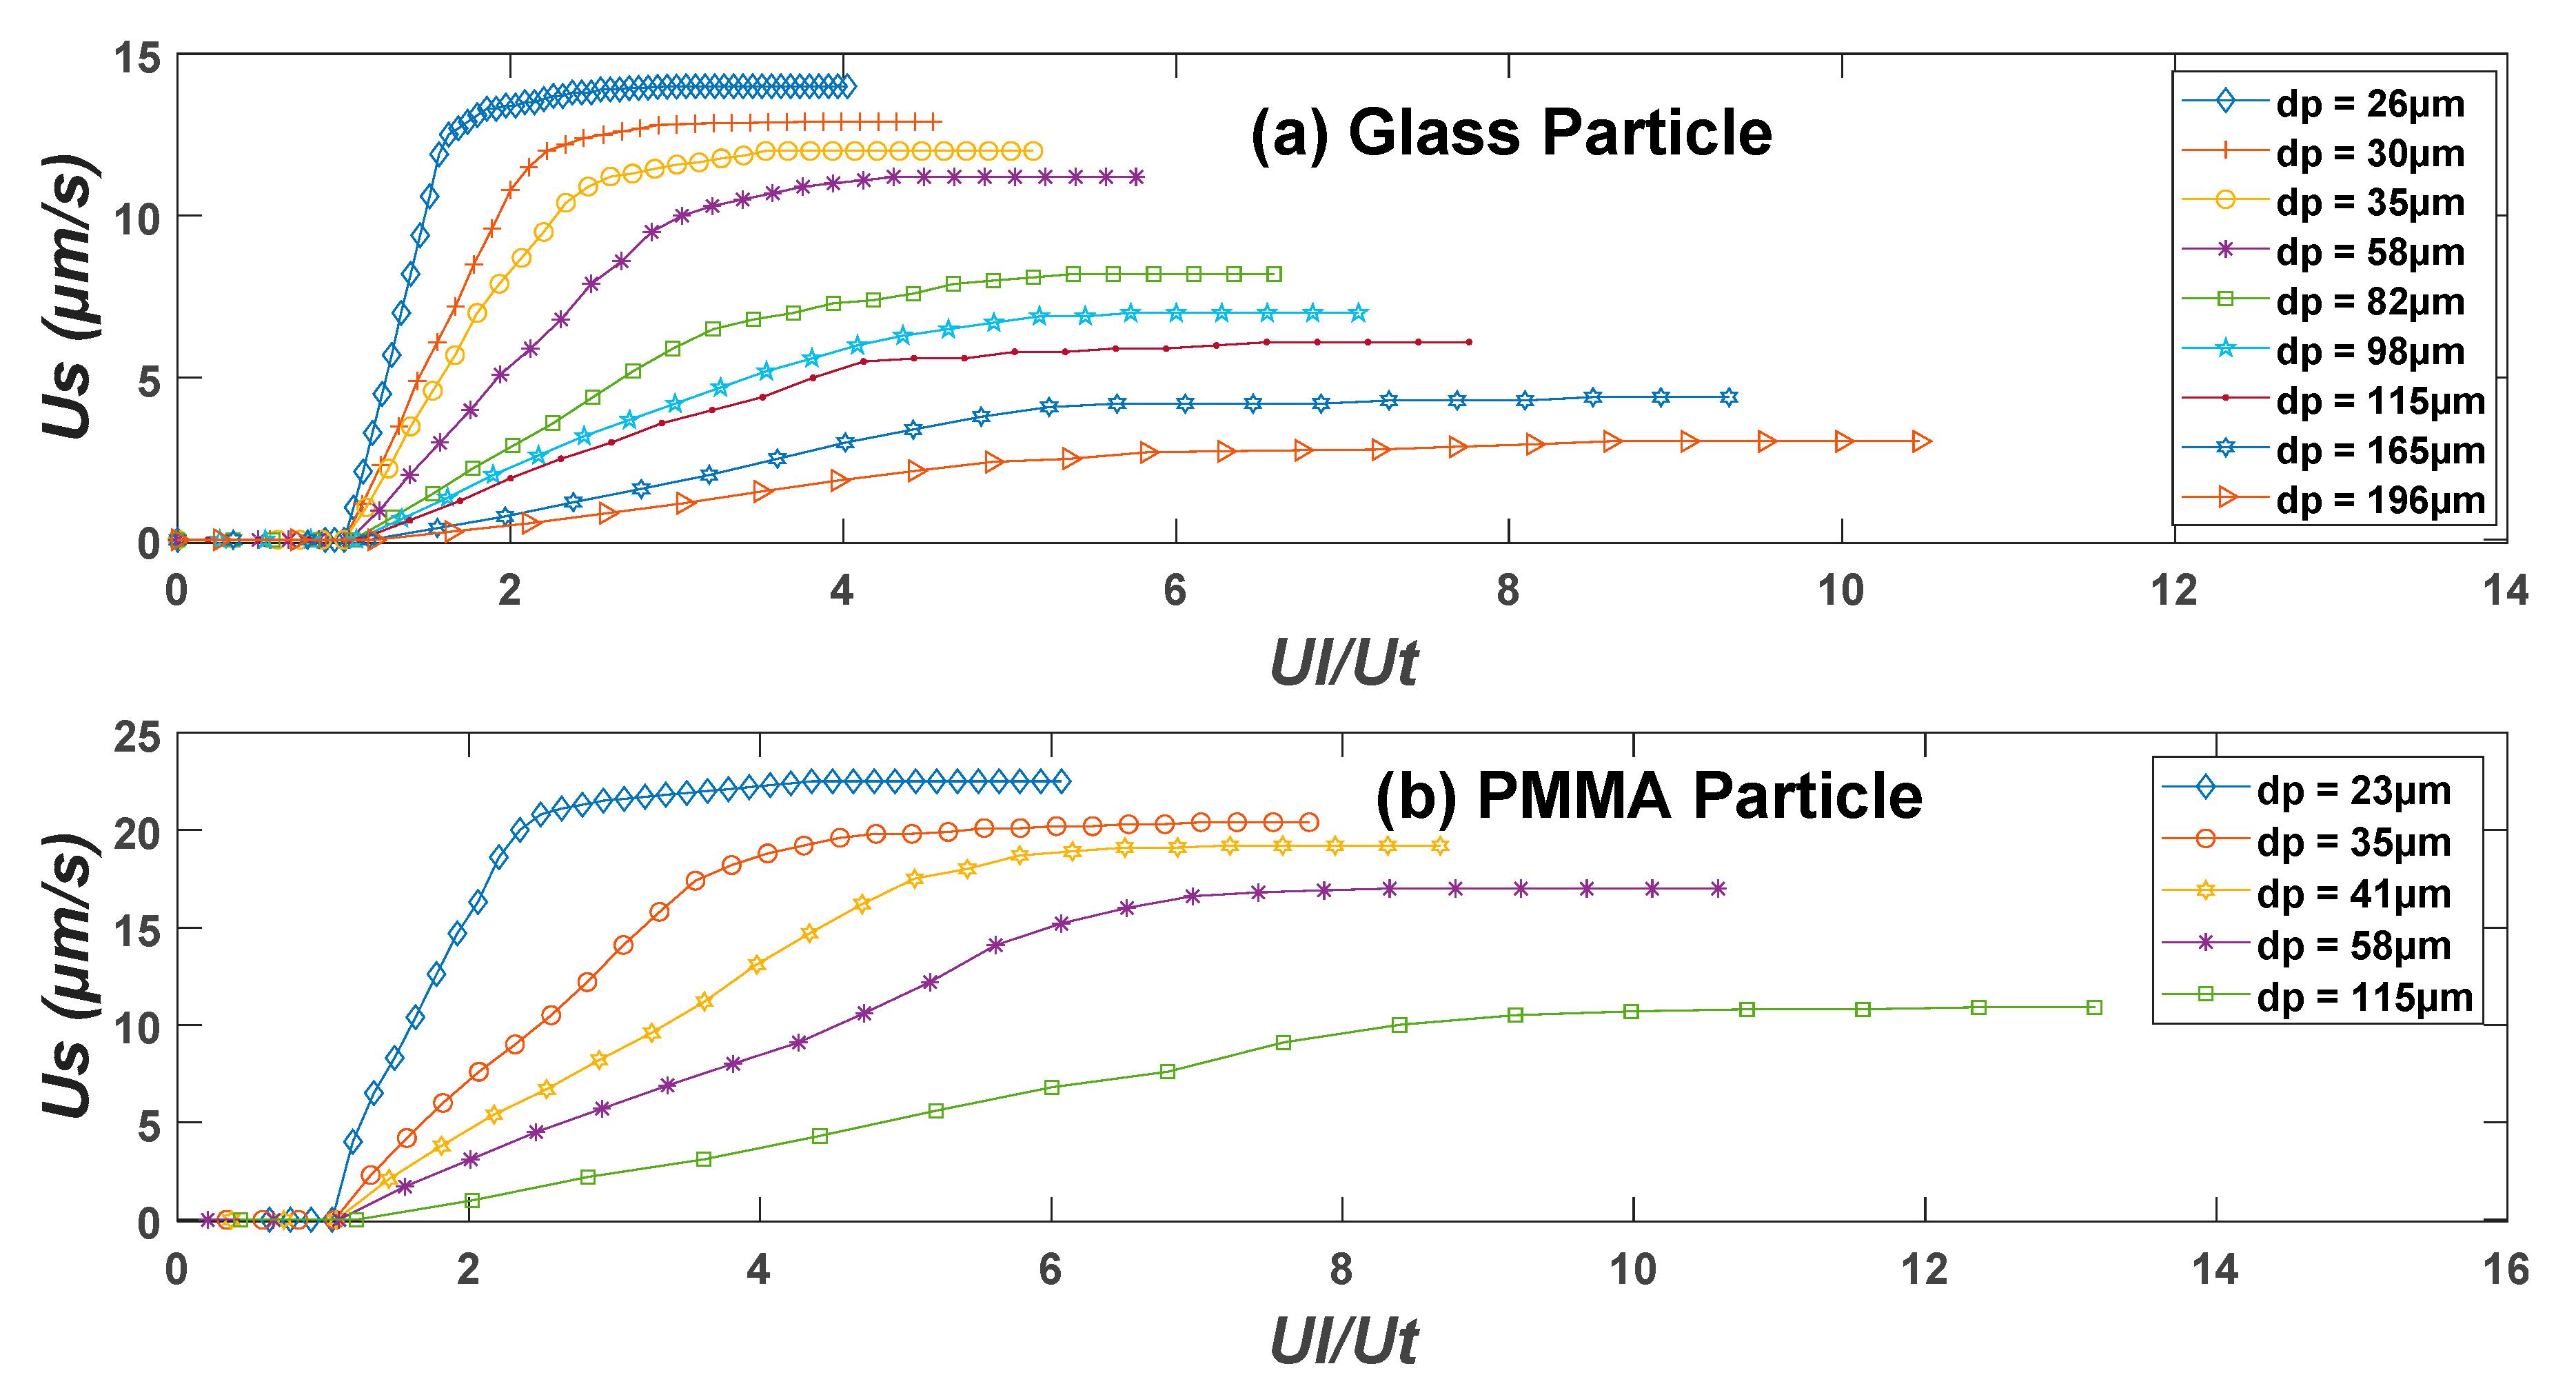
In liquid–solid circulating fluidised beds, particle motion is controlled by changing the inlet superficial liquid flow rate. Figure 8 displays the influence of liquid flow rate on the solid circulating velocity for glass and PMMA particles as determined by digital PIV analysis described in the experimental methodology Section 2.3.
The experimental results indicate that when the superficial liquid velocity is increased, the solid circulating velocity in the system is close to zero (no solid movement) then increases sharply at some critical superficial liquid velocity and then plateaus when the superficial liquid velocity is high enough. The most important parameter is the critical transition velocity from a conventional fluidised bed to circulating fluidised beds which takes place at the point where the solid circulating velocity approaches zero with reducing superficial liquid velocity. Thus, the critical transition velocities are determined as the intercept of no particle flow (nearly zero) and initial circulating zone line as shown in the plots. These plots clearly also show that the critical transition velocity, Ucr, is approximately equal to the particle terminal velocity, Ut in all considered cases in line with macroscopic studies [21,23] and the visual observed transition in our previous study [31]. The change in solid circulating velocity with superficial liquid flow rate indicates two zones. The first zone (initial circulating fluidisation zone) where solid circulating velocity increases rapidly with increasing superficial liquid velocity, and the second zone (fully developed zone) where solid circulating velocity insignificantly varies with an increase in the superficial liquid velocity as reported by Zheng et al. [21].
The transition from initial zone 1 to fully developed zone 2 was termed as critical liquid velocity, Ulc by Natarajan et al. [23], and it is a fundamental parameter in the manufacturing process and operation of a liquid–solid circulating fluidised bed. The superficial liquid velocity should be above the critical liquid velocity to obtain high particle circulating velocity in the system. Looking at Figure 8, it can be noticed that the initial circulation zone goes even up to 8 Ut. These observations are different from the early studies reported by Zheng et al. [21] and Natarajan et al. [23] where the initial circulating fluidisation zone is approximately only from Ucr close to Ut up to 2 Ut. The contrasting results is probably because of increased bed wall impacts (ratio of particle to bed diameter) which are not generally found in conventional circulating fluidised beds. Increasing particle to bed diameter ratio increases particle–wall friction due to increased particle–wall contact, and this may delay the transition liquid velocity from zone 1 to zone 2. Indeed, it is obvious from Figure 8 that the transition is postponed with particles size confirming the wall effects are influencing this critical liquid velocity. Looking at Figure 8, it can be also noticed that for a given particle size and density there is a maximum solid circulating velocity Usm related with transition to the developed zone and strongly influenced by the particle properties. Finally, the transport transition velocity, Ua, which delineates the transition from circulating fluidised bed regime to transport regime is the final point in fully developed zone regime for each curve in Figure 8. As other transition velocities, the transport transition velocity is also strong function of particle size and density as clearly seen in Figure 8. These observations are consistent with the results earlier reported by Natarajan et al. [50].
Zheng and Zhu [51] developed a correlation to predict the critical transition velocity from conventional to circulating fluidised bed in a liquid–solid circulating fluidised bed, using the following equation.
U c r = a × U t
where a is constant and is influenced by the liquid viscosity and density. When the bed is operating at ambient temperature and the fluidising liquid is water, parameter a is roughly 1.1. The predicted critical transition velocity by Equation (4) and the experimental values are shown in Figure 9. It is clear from Figure 9 that predicted and experimental critical transition velocity values are almost identical, except for large particles, where the experimental critical transition velocity is slightly higher than the predicted values, special for large PMMA particles, which is attributed to the influence of surface force and wall effect that are not generally found in conventional circulating fluidised beds. However, overall, the experimental data agrees with predicted critical transition velocity obtained by Equation (4).

3.3. Influence of Solid Inventory in the System

Figure 10 displays the particle circulating velocity vs. the normalised velocity as four different curves corresponding to solid inventory from 3% to high values (above 10%). One note that above the 10% solid inventory, the curves basically overlap and only one is given as an example for clarity reasons. However, it is quite clear that the shape of the curve and corresponding transitional velocities are influenced by used solid loading. For example, Figure 11 shows the normalised critical transition velocity vs. the solid inventory, where it is evident that the critical transition velocity from conventional to fluidised bed regime in the liquid–solid micro-circulating fluidised bed is a strong function of the solid inventory in the system. First, for a lower solid inventory system (1 to 9%) the critical transition velocity from conventional to fluidised bed regime is about 1.5 to 4.7 higher than the particle terminal velocity, and higher liquid flow rate is needed to obtain circulating fluidised bed, but for higher solid inventory system (10 to 25%) the critical transition velocity takes place near the particle terminal velocity, and the ratio of critical transition velocity to particle terminal velocity is about 1. The rise in the critical transition for lower solid inventory system is due to a reduction in the solid circulating velocity as shown in Figure 10, which in turn postpone the critical transition velocity, from conventional to circulating fluidised bed regime; hence, the circulating fluidised bed regime starts late for lower solid inventory system. These findings are consistent to those earlier reported by Liang et al. [20], the critical transition velocity reduces as the solid inventory is increased and finally becomes stable when the solid inventory is high enough. However, this observation differs from the one reported by Zheng and Zhu [51], where their proposed onset velocity (Ucf) as the minimum critical transition velocity value was independent of solid inventory, bed geometry, and operating conditions, as a result of the experimental methodology employed. The pressure imbalance between the riser and downer is probably the reason for the observed trend [52] but further investigation with precise pressure measurement across the whole system loop are needed to elucidate this in detail [52].
As already mentioned, the solid inventory also influences other transition velocities like the transport transition velocities, Ua, from circulating fluidised bed to transport regime. Figure 14 shows how the transport transition velocity, Ua, is affected by the solid inventory for the same experimental condition. Similar to critical transition velocity Ucr, the transport transition velocity Ua, also decreased with increased solid inventory (1–9%) and finally becomes stable when the solid inventory is high enough (10–25%). Lower solid inventory (1–9%) leads to a reduced solid circulating velocity as shown in Figure 12, which in turn postponed the transport transition velocity, Ua, from circulating fluidised bed to transport regime. Therefore, the transport regime is reached at higher velocities for a lower solid inventory system (1–9%). A similar proportional increase in the critical liquid velocity, Ulc, is observed as can be seen in the previous Figure 8, but not specifically plotted here.

3.4. Effect of Particle Size

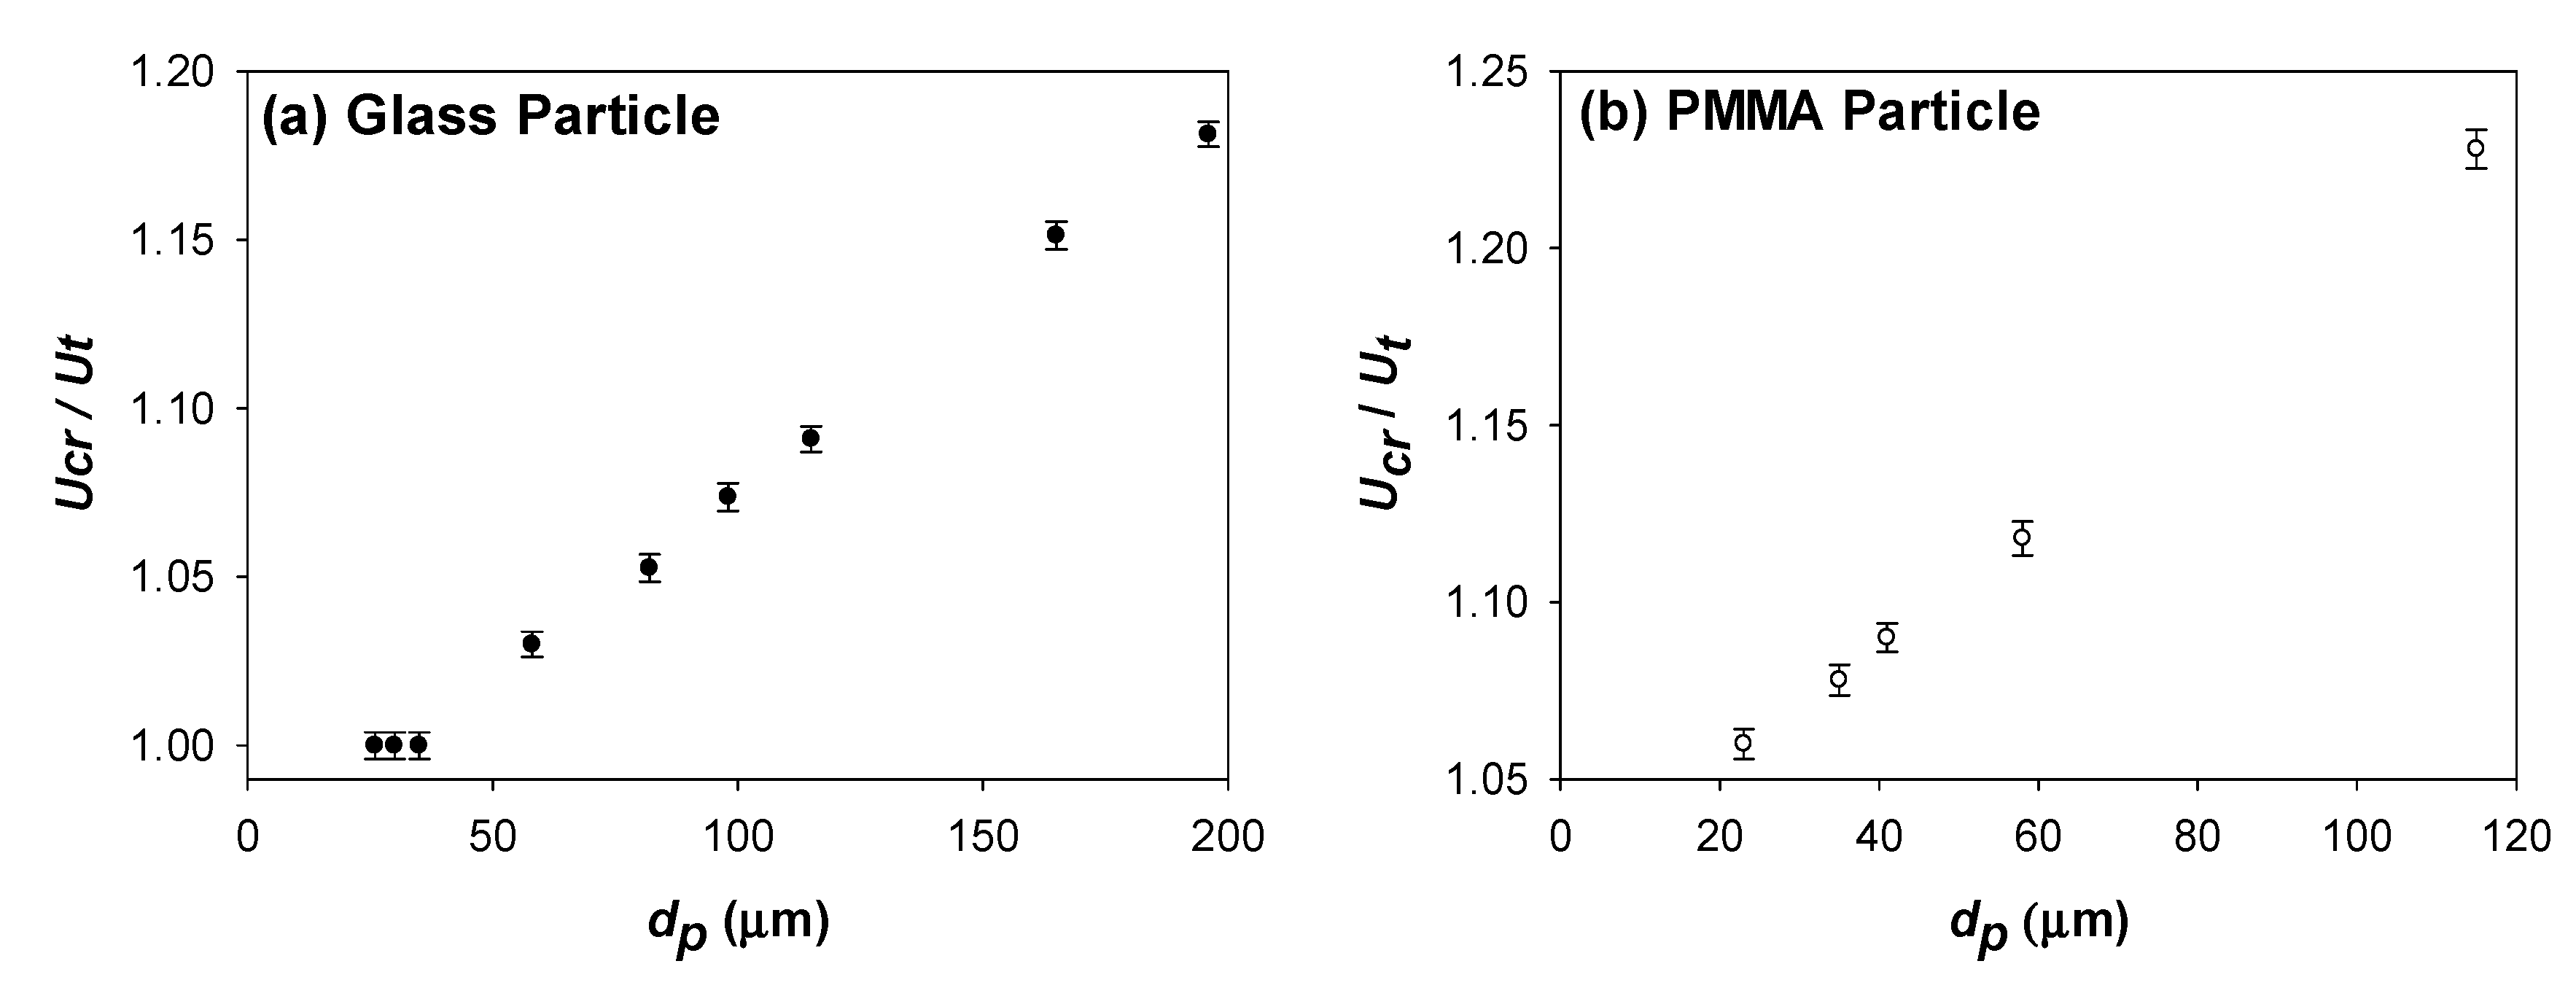
The influence of particle property such as size and density on the transition from conventional to circulating fluidisation regime is given in Figure 13. It is clear from Figure 13 that the normalised transition velocity increases with increased particle size. The normalised transition velocity is higher for larger particles and lower for smaller particles. The increment in the normalised transition velocity with an increase in the particle size is attributed to the increased wall effects (ratio of particle to bed diameter), which are not generally found in conventional circulating fluidised beds.
Looking at Figure 13, it is also evident that the normalised transition velocity (Ucr/Ut) of PMMA particles are considerably higher than that of glass particles, even though PMMA particles have lower density than glass particles. This is mainly attributed to the surface properties difference, as glass particles are hydrophilic while PMMA particles are hydrophobic. Indeed, in PMMA particles experiments, agglomeration of particles and adhesion of particles to the bed walls was spotted during the fluidisation experiment. This means that for fluidisation of PMMA particles a proportionally much larger liquid flowrate is needed to obtain circulating fluidised bed because of the cohesive forces present between them as well in adhesive interaction with walls. For example, these cohesive forces that are present in the case of PMMA particles and not in glass particles increase the effective size of particles due to agglomeration which in turn delays the transition from conventional to circulating fluidisation regime as shown in Figure 13b.
The maximum solid circulating velocity and maximum liquid velocity in a liquid–solid micro-circulating fluidised bed is influenced by particle properties such as density and size as already shown in Figure 8. The maximum solid circulating velocity increases with reducing particle size or density so it is much bigger for smaller or fine particles in comparison with the velocity corresponding to the large or heavy particles. This is due to increased solid circulating velocity with reduced particle size and density as smaller or fine particles have a higher solid circulating velocity than larger or heavy particles. As the particle size reduces, the particle input into the base of the riser increases, leading to a higher solid circulating velocity in the system. These observations are consistent with those earlier reported by Natarajan et al. [23].
The maximum liquid velocity Ulm increases with increased particle size, Ulm is higher for large particles and lower for smaller particles. This was expected since larger particles have higher transition velocity from circulating fluidisation to the transport regime due to higher particle terminal velocity. However, the maximum liquid velocity was found to be much bigger for PMMA particles in comparison to glass particles, even though glass particles have higher particle density. This could be attributed to the difference in surface properties as already mentioned above.
The influence of particle size on the transport transition velocities, Ua from circulating fluidised bed to transport regime is shown in Figure 14. One can notice that Ua is affected by the property of the particles such as size and density. Firstly, for glass and PMMA particles, the normalised transition velocity, Ua/Ut was found to increase with particle size due to increased wall impact (ratio of particle to bed diameter). Once, again, one can also observe that PMMA particles have a much higher transport transition velocity, Ua/Ut in comparison to glass particles, even though PMMA particles density is lower than glass particles (1200 and 2500 kg/m3 respectively). This is due to differences in surface properties as already discussed.

4. Conclusions

The digital PIV analysis using PIVlab validated by simple valve accumulation measurement was used to determine the solid circulating velocity in a micro-circulating fluidised bed. The use of PIVlab and Matlab codes for post-processing to estimate the solid circulating velocity seems promising, and the results look valid when compared with previously reported studies. As in a macroscopic circulating fluidised bed, the solid circulating velocity in a micro-circulating fluidised bed increases with liquid velocity in two distinct zones, increasing sharply first then levelling off at higher inlet fluid velocities. The determined transition velocities from solid circulating velocity vs. velocity plots are practically equal to the particle terminal velocity; for example, the normalised transition velocity is roughly one, in agreement with earlier reported studies on macroscale, and with our previous study using simple visual observation. The transition velocity is strongly influenced by solid inventory, i.e., reduces with an increase in the solid inventory, and finally becomes stable when the solid inventory is sufficiently high. Finally, a small increment in the normalised transition velocity with an increase in the particle size because of the wall effects (ratio of particle to bed diameter) was observed.

Author Contributions

Conceptualization, V.Z.; methodology, O.L.d.N., D.A.R., and V.Z.; validation, O.L.d.N.; formal analysis, O.L.d.N.; investigation, O.L.d.N.; data curation, O.L.d.N.; writing—original draft preparation, O.L.d.N.; writing—review and editing, D.A.R. and V.Z.; supervision, D.A.R. and V.Z.; project administration, D.A.R. and V.Z.; and funding acquisition, D.A.R. and V.Z. All authors have read and agreed to the published version of the manuscript.

Funding

O.L.d.N. acknowledges the EPSRC DTP award EP/M506382/1 for supporting his PhD studies in the School of Engineering of Newcastle University. D.A.R. and V.Z. were supported during the study by the EPSRC Grant No. EP/N024540/1.

Conflicts of Interest

The authors declare no conflict of interest.

Nomenclature

aConstant
AdDowncomer cross-sectional area (m)
ArRiser Cross sectional area (m)
dpParticle diameter (m)
ggravitational acceleration (m/s2)
GsSolid circulation rate (kgm2 s)
Hbed height (m)
UaTransport transition velocity (m/s)
Ucrcritical transition velocity (m/s)
Ulsuperficial liquid velocity (m/s)
Ulccritical liquid velocity from zone 1 to zone 2 (m/s)
Ucr/Utnormalised critical transition velocity (m/s)
UlmMaximum liquid velocity (m/s)
Ussolid circulating velocity (m/s)
Usmmaximum solid circulating velocity
UtParticle terminal Velocity (m/s)
µliquid viscosity (Pa.s)
ρffluid density (kg/m3)
ρpparticle density (kg/m3)

References

  1. Gnanasundaram, N.; Loganathan, M.; Perumal, K. Solid holdup in liquid solid circulating fluidized bed with viscous liquid medium. Alex. Eng. J. 2014, 53, 959–968. [Google Scholar] [CrossRef] [Green Version]
  2. Vidyasagar, S.; Krishnaiah, K.; Sai, P.S.T. Macroscopic properties of liquid-solid circulating fluidized bed with viscous liquid medium. Chem. Eng. Process. Process Intensif. 2011, 50, 42–52. [Google Scholar] [CrossRef]
  3. Liang, W.; Yu, Z.; Jin, Y.; Wang, Z.; Wang, Y.; He, M.; Min, E. Synthesis of linear alkylbenzene in a liquid–solid circulating fluidized bed reactor. J. Chem. Technol. Biotechnol. 1995, 62, 98–102. [Google Scholar] [CrossRef]
  4. Natarajan, P.; Velraj, R.; Seeniraj, R.V. Hydrodynamic similarity in liquid–solid circulating fluidized bed risers. Powder Technol. 2014, 264, 166–176. [Google Scholar] [CrossRef]
  5. Potic, B.; Kersten, S.; Ye, M.; Van Der Hoef, M.; Kuipers, J.; Van Swaaij, W. Fluidization with hot compressed water in micro-reactors. Chem. Eng. Sci. 2005, 60, 5982–5990. [Google Scholar] [CrossRef]
  6. Zivkovic, V.; Biggs, M.J.; Alwahabi, Z.T. Experimental study of a liquid fluidization in a microfluidic channel. AIChE J. 2013, 59, 361–364. [Google Scholar] [CrossRef] [Green Version]
  7. Do Nascimento, O.L.; Reay, D.A.; Zivkovic, V. Influence of surface forces and wall effects on the minimum fluidization velocity of liquid-solid micro-fluidized beds. Powder Technol. 2016, 304, 55–62. [Google Scholar] [CrossRef]
  8. Wang, F.; Hu, E.; Geng, S.; Yue, J.; Tang, S.; Cui, Y.; Yu, J.; Xu, G. Distinctive Hydrodynamics of a Micro Fluidized Bed and Its Application to Gas–Solid Reaction Analysis. Energy Fuels 2018, 32, 4096–4106. [Google Scholar] [CrossRef]
  9. Geng, S.; Yu, J.; Zhang, J.; Guo, H.; Yue, J.; Xu, G. Gas back-mixing in micro fluidized beds. Chem. Eng. J. 2013, 64, 867–876. [Google Scholar]
  10. Wang, F.; Fan, L.-S. Gas-Solid Fluidization in Mini-and Micro-channels. Ind. Eng. Chem. Res. 2011, 50, 4741–4751. [Google Scholar] [CrossRef]
  11. Wang, H.; Mustaffar, A.; Phan, A.N.; Zivkovic, V.; Reay, D.A.; Law, R.; Boodhoo, K. A review of process intensification applied to solids handling. Chem. Eng. Process. Process Intensif. 2017, 118, 78–107. [Google Scholar] [CrossRef]
  12. Doroodchi, E.; Peng, Z.; Sathe, M.; Abbasi-Shavazi, E.; Evans, G.M. Fluidisation and packed bed behaviour in capillary tubes. Powder Technol. 2012, 223, 131–136. [Google Scholar] [CrossRef]
  13. Hessel, V.; Kralisch, D.; Kockmann, N. Novel Process Windows: Innovative Gates to Intensified and Sustainable Chemical Processes; John Wiley & Sons: Hoboken, NJ, USA, 2014. [Google Scholar]
  14. Reay, D.; Ramshaw, C.; Harvey, A. Process Intensification: Engineering for Efficiency, Sustainability and Flexibility; Butterworth-Heinemann: Oxford, UK, 2013. [Google Scholar]
  15. McDonough, J.R.; Law, R.; Reay, D.A.; Zivkovic, V. Intensified carbon capture using adsorption: Heat transfer challenges and potential solutions. Therm. Sci. Eng. Prog. 2018, 8, 17–30. [Google Scholar] [CrossRef] [Green Version]
  16. Kivikero, N.; Murtomaa, M.; Antikainen, O.; Hatara, J.; Juppo, A.-M.; Sandler, N. Rapid formulation screening with a Multipart Microscale Fluid bed Powder processor. Pharm. Dev. Technol. 2011, 16, 358–366. [Google Scholar] [CrossRef]
  17. Zeng, X.; Wang, F.; Han, J.; Zhang, J.; Liu, Y.; Wang, Y.; Yu, J.; Xu, G. Micro fluidized bed reaction analysis and its application to coal char gasification kinetics. CIESC J. 2013, 1, 289. [Google Scholar]
  18. Yu, J.; Zhu, J.-H.; Guo, F.; Duan, Z.-K.; Liu, Y.; Xu, G. Reaction kinetics and mechanism of biomass pylolysis in a micro-fluidized bed reactor. J. Fuel Chem. Technol. 2010, 38, 666–672. [Google Scholar] [CrossRef]
  19. Chavan, P.V.; Kalaga, D.V.; Joshi, J.B. Solid-Liquid Circulating Multistage Fluidized Bed: Hydrodynamic Study. Ind. Eng. Chem. Res. 2009, 48, 4592–4602. [Google Scholar] [CrossRef]
  20. Liang, W.; Zhang, S.; Zhu, J.; Jin, Y.; Yu, Z.; Wang, Z. Flow characteristics of the liquid–solid circulating fluidized bed. Powder Technol. 1997, 90, 95–102. [Google Scholar] [CrossRef]
  21. Zheng, Y.; Zhu, J.; Wen, J.; Martin, S.A.; Bassi, A.S.; Margaritis, A. The axial hydrodynamic behavior in a liquid-solid circulating fluidized bed. Can. J. Chem. Eng. 1999, 77, 284–290. [Google Scholar] [CrossRef]
  22. Vidyasagar, S.; Krishnaiah, K.; Sai, P.S.T. Hydrodynamics of a liquid–solid circulating fluidized bed: Effect of dynamic leak. Chem. Eng. J. 2008, 138, 425–435. [Google Scholar] [CrossRef]
  23. Natarajan, P.; Velraj, R.; Seeniraj, R.V. Effect of various parameters on the solid circulation rate in a liquid–solid circulating fluidized bed. Asia-Pac. J. Chem. Eng. 2008, 3, 459–470. [Google Scholar] [CrossRef]
  24. Cho, Y.; Song, P.S.; Lee, C.G.; Kang, Y.; Kim, S.D.; Fan, L.T. Liquid radial dispersion in liquid-solid circulating fluidized beds with viscous liquid medium. Chem. Eng. Commun. 2005, 192, 257–271. [Google Scholar] [CrossRef]
  25. Roy, S.; Kemoun, A.; Al-Dahhan, M.; Dudukovic, M. A method for estimating the solids circulation rate in a closed-loop circulating fluidized bed. Powder Technol. 2001, 121, 213–222. [Google Scholar] [CrossRef]
  26. Hensler, T.; Firsching, M.; Bonilla, J.S.G.; Wörlein, T.; Uhlmann, N.; Wirth, K.-E. Non-invasive investigation of the cross-sectional solids distribution in CFB risers by X-ray computed tomography. Powder Technol. 2016, 297, 247–258. [Google Scholar] [CrossRef]
  27. Wu, W.; Gerhart, A.L.; Chen, Z.; A Dellenback, P.; Agarwal, P.K. A device for measuring solids flowrate in a circulating fluidized bed. Powder Technol. 2001, 120, 151–158. [Google Scholar] [CrossRef]
  28. Masuda, H.; Iinoya, K. Electrification of particles by impact on inclined metal plates. AIChE J. 1978, 24, 950–956. [Google Scholar] [CrossRef]
  29. Rahman, M.H.; Bi, X.; Grace, J.R.; Lim, C.J. Measurement of solids circulation rate in a high-temperature dual fluidized bed pilot plant. Powder Technol. 2017, 316, 658–669. [Google Scholar] [CrossRef]
  30. Guío-Pérez, D.C.; Dietrich, F.; Cala, J.N.F.; Pröll, T.; Hofbauer, H. Estimation of solids circulation rate through magnetic tracer tests. Powder Technol. 2017, 316, 650–657. [Google Scholar] [CrossRef]
  31. Do Nascimento, O.L.; Reay, D.; Zivkovic, V. Study of Transitional Velocities of Solid–Liquid Micro-circulating Fluidized Beds by Visual Observation. J. Chem. Eng. Jpn. 2018, 51, 349–355. [Google Scholar] [CrossRef] [Green Version]
  32. Jensen, K.F. Microreaction engineering—Is small better? Chem. Eng. Sci. 2001, 56, 293–303. [Google Scholar] [CrossRef]
  33. Yang, W.-C. Handbook of Fluidization and Fluid-Particle Systems; CRC Press: Boca Raton, FL, USA, 2003. [Google Scholar]
  34. Mills, P.L.; Quiram, D.J.; Ryley, J.F. Microreactor technology and process miniaturization for catalytic reactions—A perspective on recent developments and emerging technologies. Chem. Eng. Sci. 2007, 62, 6992–7010. [Google Scholar] [CrossRef]
  35. Dietrich, F.; Tondl, G.; Wöss, D.; Pröll, T.; Hofbauer, H. Comparison of Four Different Methods for Measuring the Solids Circulation Rate in Circulating Fluidized Beds. In Proceedings of the 14th International Conference on Fluidization—From Fundamentals to Products, Noordwijkerhout, The Netherlands, 26–31 May 2013. [Google Scholar]
  36. Tebianian, S.; Dubrawski, K.; Ellis, N.; Cocco, R.A.; Hays, R.; Karri, S.R.; Leadbeater, T.; Parker, D.J.; Chaouki, J.; Jafari, R.; et al. Investigation of particle velocity in FCC gas-fluidized beds based on different measurement techniques. Chem. Eng. Sci. 2015, 127, 310–322. [Google Scholar] [CrossRef] [Green Version]
  37. Sarno, L.; Papa, M.N.; Tai, Y.C.; Carravetta, A.; Martino, R. A reliable PIV approach for measuring velocity profiles of highly sheared granular flows. In Proceedings of the 7th International Conference on Engineering Mechanics Structures, Engineering Geology, Salerno, Italy, 3–5 June 2014. [Google Scholar]
  38. Thielicke, W.; Stamhuis, E. PIVlab–towards user-friendly, affordable and accurate digital particle image velocimetry in MATLAB. J. Open Res. Softw. 2014, 2, 1202. [Google Scholar] [CrossRef] [Green Version]
  39. McDonough, J.; Law, R.; Kraemer, J.; Harvey, A. Effect of geometrical parameters on flow-switching frequencies in 3D printed fluidic oscillators containing different liquids. Chem. Eng. Res. Des. 2017, 117, 228–239. [Google Scholar] [CrossRef] [Green Version]
  40. McDonough, J.; Law, R.; Reay, D.; Zivkovic, V. Fluidization in small-scale gas-solid 3D-printed fluidized beds. Chem. Eng. Sci. 2019, 200, 294–309. [Google Scholar] [CrossRef]
  41. McDonough, J.R.; Law, R.; Reay, D.A.; Groszek, D.; Zivkovic, V. Miniaturisation of the toroidal fluidization concept using 3D printing. Chem. Eng. Res. Des. 2020, 160, 129–140. [Google Scholar] [CrossRef]
  42. Chen, C.; Mehl, B.T.; Munshi, A.S.; Townsend, A.D.; Spence, D.M.; Martin, R.S. 3D-printed microfluidic devices: Fabrication, advantages and limitations—A mini review. Anal. Methods 2016, 8, 6005–6012. [Google Scholar] [CrossRef]
  43. Waheed, S.; Cabot, J.M.; Macdonald, N.P.; Lewis, T.W.; Guijt, R.M.; Paull, B.; Breadmore, M.C. 3D printed microfluidic devices: Enablers and barriers. Lab Chip 2016, 16, 1993–2013. [Google Scholar] [CrossRef] [Green Version]
  44. McDonough, J.R. A perspective on the current and future roles of additive manufacturing in process engineering, with an emphasis on heat transfer. Therm. Sci. Eng. Prog. 2020, 19, 100594. [Google Scholar] [CrossRef]
  45. Au, A.K.; Huynh, W.; Horowitz, L.F.; Folch, A. 3D-printed microfluidics. Angew. Chem. Int. Ed. 2016, 55, 3862–3881. [Google Scholar] [CrossRef]
  46. Ho, C.M.B.; Ng, S.H.; Li, K.H.; Yoon, Y.-J. 3D printed microfluidics for biological applications. Lab Chip 2015, 15, 3627–3637. [Google Scholar] [CrossRef] [PubMed]
  47. Schneider, C.A.; Rasband, W.S.; Eliceiri, K.W. NIH Image to ImageJ: 25 years of image analysis. Nat. Methods 2012, 9, 671–675. [Google Scholar] [CrossRef] [PubMed]
  48. Keane, R.D.; Adrian, R.J. Theory of cross-correlation analysis of PIV images. Appl. Sci. Res. 1992, 49, 191–215. [Google Scholar] [CrossRef]
  49. Nirmala, G.S.; Muruganandam, L. An Experimental Study of Liquid-Solid Flow in a Circulating Fluidized Bed of Varying Liquid Viscosity. J. Appl. Fluid Mech. 2015, 8, 95–101. [Google Scholar]
  50. Natarajan, P.; Velraj, R.; Seeniraj, R. Studies on Regime Transition, Operating Range and System Stability in a Liquid-Solid Circulating Fluidized Bed. Chem. Eng. Technol. Ind. Chem. Plant Equip. Process Eng. Biotechnol. 2009, 32, 572–579. [Google Scholar] [CrossRef]
  51. Zheng, Y.; Zhu, J.X. The onset velocity of a liquid-solid circulating fluidized bed. Powder Technol. 2001, 114, 244–251. [Google Scholar] [CrossRef]
  52. Zheng, Y.; Zhu, J.-X. Overall pressure balance and system stability in a liquid-solid circulating fluidized bed. Chem. Eng. J. 2000, 79, 145–153. [Google Scholar] [CrossRef]
Figure 1. Schematic of (a) experimental set up for imaging and (b) micro circulating fluidised bed.
Processes 08 01159 g001
Figure 2. (a) Exploded CAD model of micro-circulating fluidised bed design; (b) 3D printed micro-circulating fluidised bed.
Processes 08 01159 g002
Figure 3. Example of solid inventory measurement with static bed height of 45 mm as determined by ImageJ. In this case 45 mm static bed height corresponds to 20% of surface percentage occupied by the particles out of the whole system surface. Therefore, the solid inventory in the system was estimated to be 20%.
Processes 08 01159 g003
Figure 4. Example image of fluidised bed with 58 µm glass particles at 445 µL/min liquid flow rate inside 15% solid inventory bed. Area interest for the digital particle image velocimetry (PIV) analysis and a background are shown in the image.
Processes 08 01159 g004
Figure 5. Picture of 3D printed micro-circulating fluidised bed with a magnet inside the system used to measure the solid circulation rate, where 35 µm glass particles at 140 µL/min liquid flow rate was left to accumulate above the magnet for 20 s.
Processes 08 01159 g005
Figure 6. Particle circulating speed as a function of normalised velocity (Ul/Ut) for both the PIV technique (blue) and the accumulation method (red), inside 15% solid inventory bed.
Processes 08 01159 g006
Figure 7. Normalised critical transition velocity as a function of particle size obtained from the PIV and accumulation measurement technique.
Processes 08 01159 g007
Figure 8. Particle circulating speed as a function of normalised velocity (Ul/Ut) for (a) glass and (b) PMMA particle. Errors are smaller than the symbols.
Processes 08 01159 g008
Figure 9. Experimental critical transition velocity and predicted critical transition velocity as a function of particle terminal velocity for (a) glass particles and (b) polymethyl methacrylate (PMMA) particles.
Processes 08 01159 g009
Figure 10. Influence of solid inventory on the particle circulating velocity as a function of normalised velocity (Ul/Ut) for (a) glass and (b) PMMA particles.
Processes 08 01159 g010
Figure 11. Solid inventory influence on the normalised transition velocity, Ucr/Ut, for 35 µm (a) glass and (b) PMMA particles.
Processes 08 01159 g011
Figure 12. Solid inventory influence on transport transition velocity for 35 µm (a) glass particles and (b) PMMA particles.
Processes 08 01159 g012
Figure 13. Normalised critical transition velocity as a function of particle size for (a) glass and (b) PMMA micro-particles with solid inventory in the range of 10–25%.
Processes 08 01159 g013
Figure 14. Transition velocity from circulating fluidised bed to transport regime for (a) glass and (b) PMMA particles with solid inventory in the range of 10–25%.
Processes 08 01159 g014
Table 1. 3D Printer description.
PrinterForm2MiiCraft+
Printing typeSLADLP
MakerFormLabsMiiCraft
Build size (mm)145 × 145 × 17543 × 27 × 180
XY resolution (µm)15056
Z-axis resolution (µm)25–10030–100