Abstract
To mitigate the power shortage problem in the South Pacific island nations and the equatorial area, we studied the development characteristics of ocean thermal energy conversion (OTEC) using abundant clean ocean energy. Through the simulation of open- and closed-cycle OTEC, the generation amount and its economic efficiency were compared, and the application characteristics of the power generation cycle according to the seawater temperature distribution were compared by applying various seawater temperature conditions. According to the characteristics of seawater heat sources in the region, the power generation output was about 883.2 kW in Samoa, and the average power generation by region was about 650.5 kW for the open-cycle OTEC model. Regional revenue up to approximately $8,487,000 was generated in Kiribati, driven by the higher electricity tariff of $0.327/kWh and high water costs of $5.86/ton. With the spread of 50 MW commercial plants, Kiribati had a high net present value of $1,930,402,000, and its internal rate of return was more than 37.0%. This paper is presents a method of securing economic feasibility of OTEC according to various heat source conditions and economic conditions in the region, while it also analyzes the capacity and type of the power plant.
1. Introduction
Freshwater is one of the most biologically dependent resources on earth, but only accounts for 3% of total water resources. However, most freshwater is located in ice at the poles, whereas drinkable freshwaters account for only 0.01% from rivers and lakes. This not only determines the distribution of life, but also has a direct impact on industrial and economic development [1]. However, despite these essential factors, desalination plants cannot be used for freshwater production because of a lack of production power and technology in some islands, including water shortage countries [2]. The South Pacific islands, the Middle East, and Africa are struggling for drinkable water due to the depletion of groundwater and the inflow of seawater, resulting in them relying on large amounts of imported drinkable water. In addition, water is an essential resource for the ability to provide the three basic human needs of water, energy and food security [3].
The World Resources Institute (WRI) reported in its technical report that industrial, agricultural, and household water intakes for water use will increase from 20% of the world’s water to more than 80% by 2040 [4]. In addition, South Pacific islands such as Kiribati, Tuvalu, and Samoa, and West Africa nations, such as Liberia, Nigeria, and Kenya, have high power costs along with water shortages.
Figure 1 shows the distribution of world surface sea temperature and a map of the world’s predicted water shortages until 2040. As shown in the figure, most countries in Southeast Asia and Oceania are predicted to be capable of ocean thermal energy conversion (OTEC), and, among these countries, countries experiencing water shortage are included. In order to solve such water shortage and power shortage, research on OTEC plants is being conducted. The potential for ocean thermal energy is widespread worldwide, with economic feasibility in at least 98 countries [5]. According to Vega, the sea temperature range is 25–30 °C on the African and Indian coasts, the tropical west and southeastern coasts of the continental United States, and many Caribbean and Pacific islands [6]. Recently, Bernardoni et al. conducted a study on the economic feasibility of Kiribati and Fiji with regard to closed-cycle OTEC, but a more comprehensive comparison is required due to the limited technology and countries investigated [7].
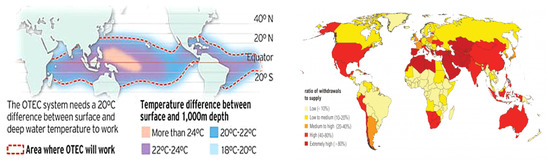
Figure 1.
Distribution of world surface sea temperature (left) and water stress by country in 2040 (right). (Source: INHABITAT & World Resources Institute)
The performance comparison between 50 MW open-cycle (OC) OTEC and closed-cycle (CC) OTEC reported at the University of Hawaii in 2010 was 432,609 MWh/year for CC-OTEC and 414,415 MWh/year for OC-OTEC, with 118,434 m3/day representing a difference of about 4.2% in the amount of electricity. However, it is reported that this value will be higher if freshwater production is converted to the appropriate amount [8].
In addition, through a study on the performance improvement of open-cycle OTEC, freshwater of 16.93 kg/s was produced through the design of 1 MW OC-OTEC, where VMD (vacuum membrane distillation) and OC-OTEC were applied to reduce the volume by 90%, highlighting its benefit as an alternative solution to the conventional method [9,10].
In this paper, we selected many regions where the OTEC of sea surface temperature is possible, and we compared the open-cycle and closed-cycle generation approaches according to power generation and freshwater production. In addition, an economic analysis of OTEC according to the power generation type was performed to provide basic data for the commercialization of OTEC.
2. Ocean Thermal Energy Conversion Cycle
2.1. Open-Cycle Ocean Thermal Energy Conversion Design
Open-cycle OTEC is a power generation cycle that drives a turbine with steam generated by evaporating surface seawater under reduced pressure. It consists of a surface seawater pump and an evaporation chamber, a low-pressure turbine, a condenser, a deep seawater pump, a freshwater tank, a vacuum pump, and a freshwater pump. The vapor evaporated in the evaporation chamber passes through the turbine and generates electricity, and it is then stored in a freshwater tank through a condenser. In the vacuum pump connected to the freshwater tank, the inside pressure of the system is reduced to under 3.3 kPa, and the stored freshwater is supplied through the freshwater pump.
In the case of open-cycle OTEC generation, the turbine efficiency of about 9.2% is increased when it is directly condensed using deep water [11]. However, this was not applied in this paper because freshwater cannot be produced when discharged as deep water.
The method of lowering the surface water discharged from the evaporation chamber via two-stage decompression and of storing the generated steam in a freshwater tank through a condenser is called two-stage evaporation open-cycle OTEC. This is suitable for countries with a high water shortage. Figure 2 represent the single-stage evaporation and the two stage-evaporation open thermoelectric cycles. As a simulation analysis method, a process design program called Aspentech HYSYS (V10) was used to analyze the basic OTEC cycle. Helmholtz energy equations with high accuracy including international standard equations for water equations were used [12,13]. Through the Helmholtz energy equation, it is possible to derive an accurate energy value by applying the physical property values of water and R32 refrigerant in the simulation.
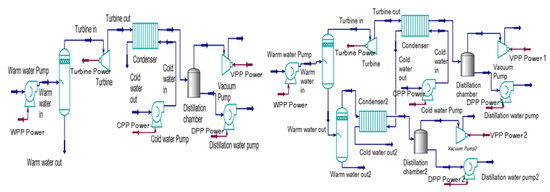
Figure 2.
Single-stage open-cycle ocean thermal energy conversion (OTEC) (left) and two-stage open-cycle OTEC (right).
Electricity for open-cycle systems is generated through the output of the turbine in each power generation cycle, and power is required by the vacuum pump, seawater, and freshwater pumps. In addition, power consumption for the management and discharge of brine water occurs, but it is not considered in this paper as it is assumed that gravity discharge technology will be applied [14]. The calculation formulas for each element are shown in Equations (1)–(5).
In addition, the amount of heat in the evaporator and the condenser and the efficiency of the open-cycle temperature differential power generation are shown in Equations (6)–(8).
Turbine power (J/s):
Cold water pump work (J/s):
Warm water pump work (J/s):
Freshwater pump work (J/s):
Vacuum pump work (J/s):
Heat of evaporation (J/s):
Heat of condensation (J/s):
Net thermal efficiency (%):
2.2. Closed-Cycle Ocean Thermal Energy Conversion Design
The closed-cycle OTEC is the same as the ORC (Organic Rankine Cycle) and, as shown in Figure 3, the cycle is generated through turbines when evaporation and condensation are repeated by circulating the working fluid. Surface and deep seawater are used as heat sources and the heat sink. The working fluid evaporated by the surface seawater passes through the turbine at high temperature and pressure and is decompressed to condense into a low-temperature liquid by the deep seawater. Since this cycle is circulated by the working fluid pump, the supply of heat constitutes an infinite cycle of power generation [15]. The same Helmholtz energy state equation was applied for the design of a closed-cycle OTEC, but the state equation was transformed and applied according to the characteristics of R32 working fluid [16,17].
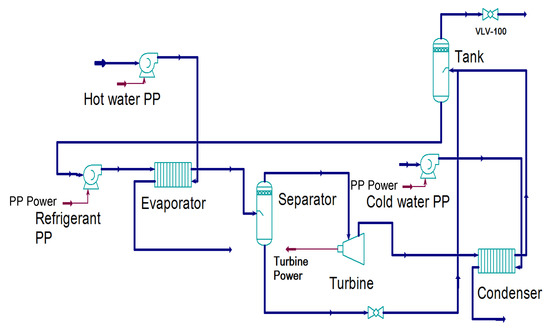
Figure 3.
Closed-cycle ocean thermal energy conversion (OTEC).
According to Navani and Sapra, the size of a closed-cycle plant is modest when compared to an open-cycle system, and the efficiency is also relatively higher [18].
Electricity for the closed-cycle system is generated through the output of the turbine in each power generation cycle, and power is required by the working fluid pump and seawater pumps. The calculation formulas for the turbine and working fluid pump are shown in Equations (9) and (10).
In the case of the closed type, the calculations for power of the seawater pump and heat amount of the heat exchanger are the same as for the open type, while the efficiency is determined using Equation (11).
Turbine power (J/s):
Working fluid pump work (J/s):
Net thermal efficiency (%):
3. Economic Analysis of Ocean Thermal Energy Conversion
3.1. Thermodynamic Cycle Economic Analysis
Economic analysis according to the practical use of OTEC analyzes economic value by applying benefit/cost analysis, the net present value (NPV) method, and the internal rate of return (IRR) method. It is an important means to secure the transparency of direct and indirect investment of social capital.
3.1.1. Benefit/Cost Analysis
The benefit/cost (B/C) ratio is easy to understand when determining economic value and is widely used depending on the size of the business. It is the ratio between the present value discounted to total benefit and total cost, that is, the benefits and costs that will be incurred in the future converted to present value, and the present value of the benefit divided by the present value of the cost. In general, if B/C ≥ 1.0, it is judged to be economically feasible. The benefit/cost analysis calculation method is shown in Equation (12).
3.1.2. Net Present Value (NPV)
All costs and benefits involved in the business are discounted to the present value of the base year, representing total benefits minus total costs. In general, if NPV ≥ 0, it is judged to be economically feasible. The NPV calculation method is shown in Equation (13).
3.1.3. Internal Rate of Return (IRR)
IRR is a method of obtaining a discount rate that is equal to the value converted from the present value of benefits and costs. It is a method of obtaining a discount rate (r) that makes the net present value of the implementation of the project zero. In general, if the result of the analysis is greater than the social discount rate, it is judged to be economically feasible. The IRR calculation method is shown in Equation (14).
3.2. Economic Factors in Ocean Thermal Energy Conversion Plant Operation
To estimate the economic feasibility of the OTEC plant, economic indicators were calculated in consideration of social discount rates and operating costs.
In addition, we applied a 5.5% social discount rate to the future value of cash flow, while applying the social discount rate, a real discount rate, to estimate the cost and benefit estimates as a constant price that does not reflect inflation.
- The discount rate of 5.5% was applied by estimating the social discount rate to the Korea Development Institute (KDI) General Guide to preliminary feasibility study.
- The Korea Institute of Science and Technology Evaluation (KISB), avoided the sudden adjustment of social discount rate and applied 5.5% in consideration of the possibility of recent upward interest rate fluctuations.
- It was assumed that profits are incurred for about 20 years from the completion of plant construction. Thereafter, there are no profits due to the cycle of repair and change of major parts.
3.3. Economic Analysis Procedures of Ocean Thermal Energy Conversion
3.3.1. Cost Estimate
The total cost is largely divided into the total installation cost, which is required for initial installation, and the operating cost after installation. Since an annual operating cost is required, the cost is calculated by adding about 5% of the total installation cost to the annual operating cost. The total operating costs include annual operating, maintenance, repair, and replacement costs, as suggested by Vega [6]. The total project cost is divided into initial capital costs and operating costs, and operating costs include facility and equipment maintenance costs and management operation costs after initial installation. The economic feasibility analysis procedure was carried out in the order of cost estimation, benefit estimation, and economic feasibility evaluation based on the simulation results as shown in Figure 4.

Figure 4.
Economic feasibility analysis procedure.
3.3.2. Benefit Estimate
The benefit estimate was calculated as the power output that can confirm high-efficiency and visible results among the benefit items generated by the OTEC plant. As the method of determining benefit items affects the results of NPV and IRR analysis, there is a need for improvement in the future. The general economic feasibility evaluation procedure is shown in Figure 5. In addition, the measurement of benefit items generally involves a number of assumptions and complex procedures. Due to the difficulty of estimating benefits, only power and freshwater generation were considered [19].
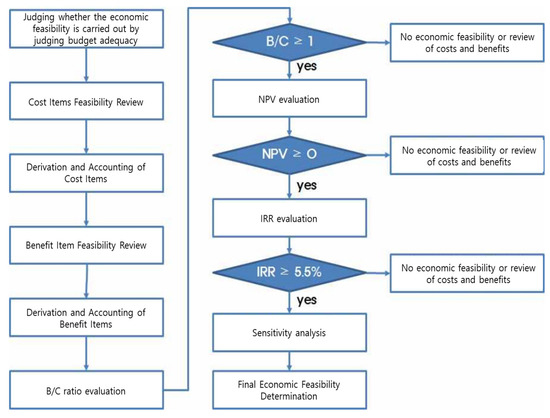
Figure 5.
General economic feasibility procedure.
4. Economic Factor Analysis of Ocean Thermal Energy Conversion
4.1. Economic Factors
Several conditions are required to apply seawater temperature differentials. First, deep water within 1000 m should be distributed to collect a low-temperature heat source of 4–6 °C, and the difference between annual surface temperature and 20 °C should be maintained. As the deep seawater intake distance increases, fabrication costs, heat loss, and pressure loss occur. The simulations were compared assuming the same intake conditions and turbine efficiency except for the pipe loss caused by the cycle application.
In order to compare the surface water temperature and the power generation according to the generation method, 16 countries in OTEC-feasible areas were selected, and OTEC using the average seawater temperature was simulated.
4.1.1. Seawater Temperature Analysis
The temperature difference increases in the equatorial region, with a difference between surface and deep water of up to 25 °C. In Japan, where the relative latitudes are high, the average surface temperature is 25.0 °C. In the case of Samoa, near the equator, the average water temperature is 29.3 °C [20].
On the other hand, the deep water temperature varies depending on the region, and the water intake distance required to obtain the heat sink at the same temperature varies, which affects economic requirements. However, in order to compare the power generation performance under the same conditions, the same water withdrawal distance was assumed. The temperature of deep water applied was 5 °C, and the case of a 1000 m depth point suggested in Kiribati’s 1 MW progress model located 3.0 km from the beach was commonly applied.
4.1.2. Power and Water Cost Analysis
In order to compare the cost-effectiveness of electricity and freshwater generated from the 16 selected OTEC sites, electric power costs and freshwater costs in each region were analyzed. The selected area had an average power cost of $0.237/kWh, while Nigeria, an Africa country, had the highest unit price of $0.71/kWh.
In addition, the cost of freshwater was investigated for the local water tariff per m3, which was surveyed by the International Benchmarking Network for Water and Sanitation Utilities (IBNET) [21]. The price of water supply was highest in Kiribati at $5.86/m3, and, in some countries with abundant water resources or low local economies, prices below $1.0/m3 were confirmed. Table 1 shows the temperature of surface seawater and the electric selling cost and water cost by region.

Table 1.
Countries expected to apply OTEC system. USA, United States of America.
4.2. Initial Investment Cost
There is no long-term, sustained field experience with OTEC technologies; thus, it is difficult to predict current costs and future trends. Investment costs for individual projects are high; therefore, technological development is slow [22].
Table 2 shows the initial investment cost of OTEC generators due to changes in net power. OTEC systems are cost-competitive, indicating that closed-cycle OTEC plants of at least 50 MW and as much as 100 MW capacity must be considered. In addition, small (1 to 10 MW) land-based open-cycle OTEC plants, with a second stage for additional water production, are cost-effective [23]. However, in this paper, facilities from small-scale power generation to medium-scale power generation (1 to 50 MW) were compared.
Table 2.
Initial investment cost for OTEC system.
Recently, Vega and Kim analyzed economic feasibility through the initial facility cost of terrestrial OTEC power generation and assumed that a large-capacity water intake pipe with 100,000 tons per day was developed and installed to produce 1 MW of electricity. Vega applied a heat exchanger installation cost of about $100 to 215/m2 for 50 MW of power generation and assumed that seawater intake was less than 10 km to reach 1 km depth [24].
Vega also predicted that, in comparison of economics, the development of technology would lead to a reduction in initial investment in the future, and a reduction of about 30% was applied. Kim also conducted an economic analysis by applying changes of 15% and 30% of the initial investment [23,25]. However, it is necessary to consider the increase in the initial investment cost due to the decrease in the value of money and the rise in prices.
Therefore, in this paper, the initial investment cost change was applied from a pessimistic point of view. We applied the initial investment cost change from a pessimistic point of view and compared the economics by applying a cost change of 15% and a change in capacity.
4.3. Power Cycle Analysis
For a comparison of OTEC sites, open- and closed-cycle OTEC plants were designed and power generation performance was verified by applying local seawater temperature conditions. The cycle design of the open-cycle OTEC applied the 210 kW experimental conditions conducted by Bharathan [26]. In addition, in order to design OTEC plants, the same surface water flow rate was used. The various surface seawater temperatures were applied according to region; thus, the evaporator seaside temperature difference was designed as 5 °C. The surface seawater flow rate was designed to be 1945 kg/s, and the deep seawater flow rate changes with the surface water temperature were varied using the same 5 °C for the condenser inlet and outlet temperature difference.
The efficiency of the seawater pump and the turbine efficiency were set as 75% and 80%, respectively. The head loss caused by surface water and deep water is caused by various factors such as land risers, heat exchangers, pressure-reducing chambers, and fittings. The head was designed to be 5.5 m in surface seawater and 8.5 m in deep seawater. The design values for OTEC are shown in Table 3.
Table 3.
Parameters of OTEC.
The pinch temperature was assumed to be 1.5 °C, and the superheat degree was designed to be 1 °C for the design of the heat exchanger of the OTEC. The flow rate of the working fluid varied with seawater temperature, and the power consumption and net power generation of OTEC components were compared according to the choice of application area.
5. Performance Characteristics of Ocean Thermal Energy Conversion
5.1. Power Production Characteristics
Regional characteristics were compared under the same development conditions. In Japan, where the relative low-temperature surface water condition of 25.0 °C was used, the power generation amount was 803.2 kW for the open cycle and 763.2 kW for the closed cycle under the same flow condition. However, as the seawater temperature increased, Samoa at 29.3 °C showed a maximum power output of 1237 kW in the open cycle, which showed an increased rate of 1.5. It was confirmed that the average power was 1058.3 kW in the open cycle.
On the other hand, the power consumption according to the cycle tended to be the same for the open cycle and the closed cycle, with the generation of power consumption being up to 404.5 kW in the closed cycle (479.4 kW at open cycle) in the Samoa region. For the closed cycle, average power consumption of 393.8 kW was seen, which was 85.6 kW lower compared to open cycle. In the case of two-stage open-cycle OTEC, an average power required of 98.6 kW was generated compared to the first-stage evaporation, with 1.8 kW in freshwater pump 2 and 96.8 kW in vacuum pump 2. The left side of Figure 6 shows the power consumption of the open-cycle OTEC, and the right side shows the power consumption of the closed-cycle OTEC.
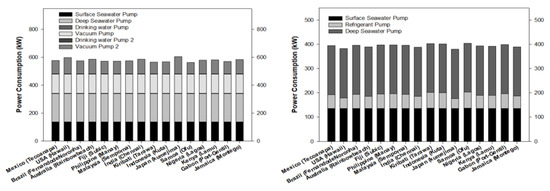
Figure 6.
Power consumption of OC-OTEC (left) and CC-OTEC (right).
Compared to the OC-OTEC power generation, the power consumption of the CC-OTEC power generation was lower, and, in the case of multi-stage power generation, the power consumption by the vacuum pump was increased. The total power production and net power production of the open-cycle and closed-cycle OTEC are shown in Figure 7.
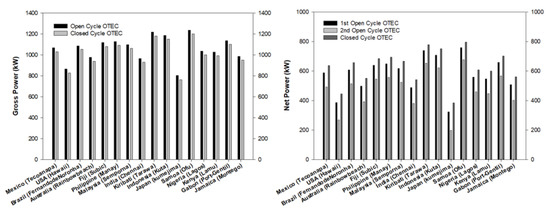
Figure 7.
Gross power and net power for OTEC cycle in application areas.
5.2. Water Production Characteristics
The amount of freshwater obtained through the open-cycle OTEC was different in first-stage evaporation and second-stage evaporation, and, in the case of first-stage evaporation, the difference in seawater temperature of the evaporation chamber was the same, while the flow rate change was less than 200 kg/h.
In the case of single-stage evaporation, average production was 55,248 kg/h. In the case of two-stage evaporation, production changed with temperature change. In Japan at 25.0 °C, 53,244 kg/h of freshwater was produced, while this value was 41,112 kg/h in Samoa, representing a 29.5% reduction in production according to the temperature change.
As such, as the temperature of the evaporation chamber increased, the amount of evaporation decreased. Figure 8 compares the freshwater production by region for single-stage evaporation and two-stage evaporation of the open-cycle OTEC.
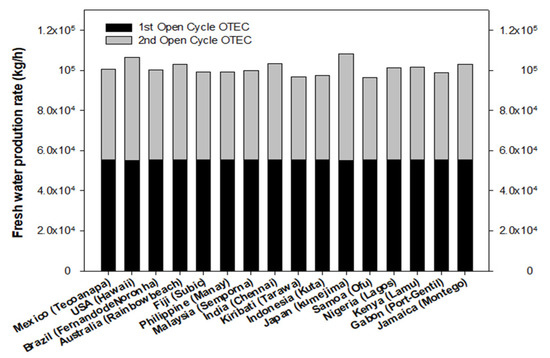
Figure 8.
Freshwater production rate for OC-OTEC in application areas.
6. Economic Feasibility of Ocean Thermal Energy Conversion
6.1. Regional Revenue Analysis
The total sales cost was analyzed by applying the water and electricity rates of the applicable OTEC plants. In addition, to reflect the annual income, the expected operating rate was 95%. The maximum sales revenue was $6,500,000 annually in Kiribati when the two-stage evaporation OC-OTEC was applied, and the lowest income was $332,000 in Malaysia where the CC-OTEC was applied. In the United States and Kiribati, income changes were high depending on the power generation method, and these results were due to the high relative water demand and high income from open-cycle OTEC. Nigeria’s CC-OTEC had the second highest sales revenue of $3,589,000 due to the high power cost compared to the water rate. The total selling costs for OC- and CC-OTEC in the application areas are shown in Figure 9.
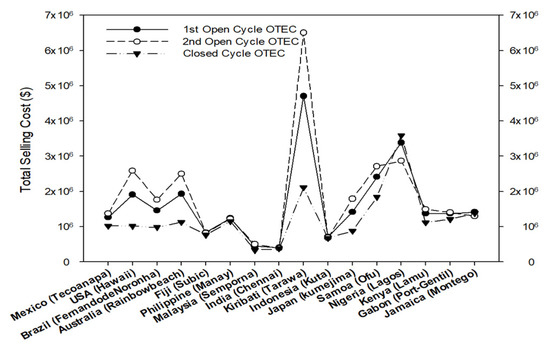
Figure 9.
Total selling costs for OC- and CC-OTEC in application areas.
6.2. Analysis of Economic Value of Ocean Thermal Energy Conversion
6.2.1. B/C Ratio
The initial investment costs of the 1 MW class OTEC demonstration plant and the total operating costs for 20 years were approximately $17,920,000 for each closed-cycle OTEC, $20,720,000 for the single-stage OC-OTEC, and $34,320,000 for the two-stage OC-OTEC. When this was excluded, a B/C ratio of 1 or more was secured. However, there were no countries with economic efficiency, except for Kiribati’s single-stage open-cycle (2.02) and second-stage open-cycle (1.68) models, Nigeria’s single-stage open-cycle (1.45) and closed-cycle (1.78) models, and Samoa’s single-stage open-cycle model (1.03).
In the case of the 10 MW class, the single-stage open model showed a B/C ratio higher than 1 in most countries except for Mexico, Fiji, Malaysia, India, and Indonesia. However, in the Philippines, Nigeria, Gabon, and Jamaica, the closed-cycle OTEC ratio was higher than the open-cycle OTEC ratio.
In the case of the 50 MW or higher class, which can be commercially used, most countries had a B/C ratio of 1 or higher in single-stage open-cycle and closed-cycle generation except for the second-stage open-cycle OTEC, whereas some countries such as Malaysia and India showed negligible ratios. The B/C ratio change according to the capacity change of each country’s OTEC is shown in Figure 10.
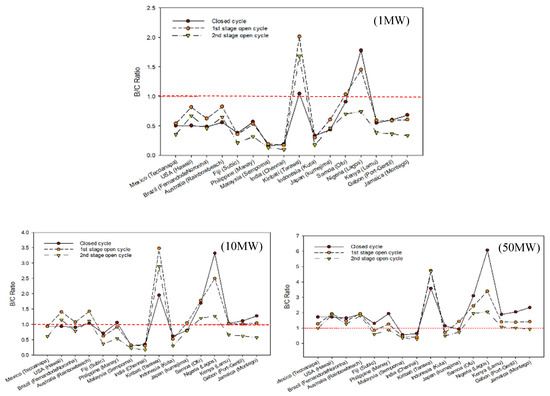
Figure 10.
The benefit/cost (B/C) ratio change according to the capacity change of each country’s OTEC.
6.2.2. Net Present Value
OTEC’s economic feasibility was compared as a cash value through the economic indicator NPV, and the evaluated countries that secured economic feasibility had a value of $0 or more. The 1 MW OTEC plant showed high value in Kiribati’s single-stage open-cycle ($14,836,000) and two-stage open-cycle ($9,147,000) models, while the closed-cycle model was economical in Nigeria ($7,115,000). Samoa was included in the B/C ratio calculation, but it was excluded from the NPV value.
In the 10 MW class power generation, additional economic feasibility was secured in a single-stage open model in Samoa. In addition, the development model that generated the largest profit and the country that secured the best economic feasibility was Kiribati ($377,426,000), which supplied a two-stage open cycle.
For the 50 MW class commercialization model, a value of more than $0 was secured in the single-stage open- or closed-cycle models except for Fiji, Malaysia, India, Japan, and Indonesia. Kiribati secured an NPV of up to $2,652,342,000 in a two-stage open-cycle model. Figure 11 shows the NPV index by country according to the change in OTEC capacity.
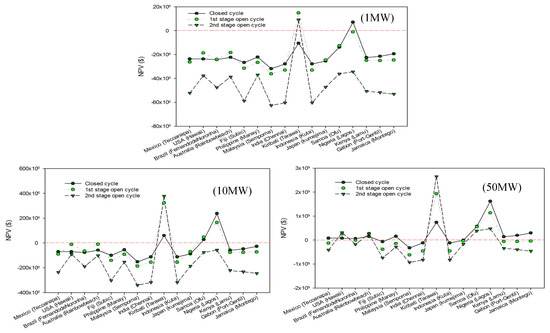
Figure 11.
The net present value (NPV) index by country according to the change in OTEC capacity.
6.2.3. Internal Rate of Return
By comparing the IRR, we can determine the maximum profit from the higher return on investment of OTEC. In the case of the 1 MW class power generation model, an IRR value of more than 5.5% was secured in Kiribati’s single-stage (11.7%) and the two-stage (8.0%) open-cycle models and Nigeria’s closed-cycle OTEC (9.1%).
In the case of the 10 MW model, the IRR indicators were equally high in countries included in the NPV calculation. The maximum value of IRR was shown in Kiribati country’s single-stage open-cycle model.
In the case of the 50 MW class model, economic efficiency was secured in most countries, as with the NPV value. The country and model with the highest economic value was Nigeria, valued at 49.7% when applying closed-cycle generation. The IRR indicator by country according to the change in the capacity of OTEC is shown in Figure 12.
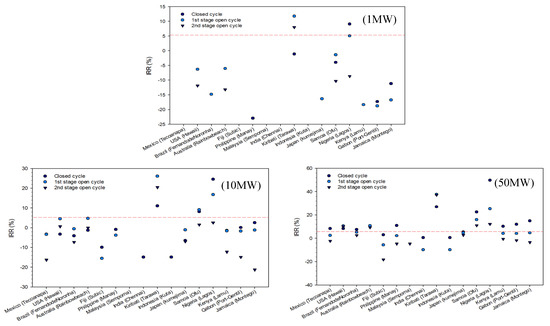
Figure 12.
The internal rate of return (IRR) according to the change in capacity of OTEC.
6.3. Economic Feasibility Evaluation According to Sensitivity Analysis
6.3.1. Change in Initial Investment Cost
OTEC has no commercialization development yet, and the reliability of the initial investment cost is low because there is only a 1 MW class demonstration plant in Korea. Since the variables for calculating the initial investment cost, such as the size of the country, the economy, and technology, are large, the economic feasibility of applying a 15% change rate was analyzed in consideration of the increase and decrease in the initial investment cost.
An increase of 15% was assumed by applying inflation and a decrease in the monetary value of the initial investment cost. Here, the commercial model, 50 MW OTEC, also reduced the IRR figure, an economic indicator. In the case of closed cycle, Japan and Brazil fell below the standard from 5.47% and 7.65% to 2.81% and 4.91%. In the case of the open cycle, Brazil and USA showed IRR values of 5.29% and 10.67% in the first-stage open cycle, but decreased to 2.64% and 7.8% in the second-stage open cycle, whereas Australia decreased from 9.33% to 6.53%.
In addition, it was assumed that the initial investment cost was reduced by 15% due to the rise in technological power and deflation. In this case, the 50 MW class CC-OTEC in Fiji had an IRR of 6.08%, showing an increase of 104% from the previous 2.98%. In the case of OC-OTEC, Mexico and the Philippines increased from 2.54% and 2.24% to 5.63% and 5.32% in the single-stage model, while the second-stage OC-OTEC increased from 2.54% to 5.62% in Brazil. Table 4, Table 5 and Table 6 show the economic indicators according to the existing initial investment cost and the change in initial investment cost.
Table 4.
Economic analysis according to OTEC’s capacity.
Table 5.
Economic analysis according to OTEC’s capacity with 15% increase in initial investment cost.
Table 6.
Economic analysis according to OTEC’s capacity with 15% decrease in initial investment cost.
6.3.2. Other Factor Changes
In order to analyze the sensitivity of each variable affecting the economic efficiency of seawater temperature difference and power generation, the effect on the open- and closed-cycle OTEC models of 1 MW in Kiribati was compared by applying a change value of 15% in variables such as the initial investment cost. Additional sensitivity analysis factors included electric tariff changes, water tariff changes, operating cost changes, interest rate changes, and NPV changes.
Table 7 shows the results of sensitivity analysis of the 1 MW OTEC applied to Kiribati. According to each power generation method, the initial cost increased by 15% and the NPV increased and decreased by up to 41.83% for the first-stage open type, while the second-stage open type also showed a change of 112.39% according to the initial cost change. In addition, in the case of the closed type, a change amount of 51.0% was established according to the initial cost change. Excluding the initial cost, NPV was the highest in the open type due to changes in the water tariff, where values in the first- and second-stage open-cycle OTEC (32.58% and 92.58%, respectively) increased and decreased. On the other hand, in the case of the closed-type OTEC, the increase and decrease amount was 36.0%, representing the highest change rate in the electric tariff category. The sensitivity analysis of OTEC varied depending on the development method and region, and this comparison was based on the Kiribati model.
Table 7.
Parameters of OTEC.
7. Conclusions
The economic cost was reviewed and several conclusions were drawn upon comparing the power cost and heat source conditions of OTEC application sites for commercialization and upon comparing the capacity and model of the equipment to be applied.
Samoa, where the seawater heat source is 29.3 °C, showed production of 757.6 kW with the single-stage open-cycle model, representing the largest net power generation, whereas Japan showed the lowest power generation of 323.6 kW with the single-stage open-cycle model due to its low heat source temperature of 25.0 °C. In addition, values of 59,332 kg/h and 59,152 kg/h were obtained for freshwater production in Samoa and Japan. Converting electricity and freshwater into production costs, annual revenues of $2,409,000 in Samoa and about $1,417,000 in Japan were reported. However, it was confirmed that Kiribati and Nigeria, which have high costs of electricity and fresh water, were the largest beneficiaries with $4,703,000 and $3,382,000, respectively.
Assuming a social discount rate of 5.5%, and assuming that the annual operating cost was 5% of the initial investment cost, when the single-stage OC-OTEC was applied to Kiribati at the scale of a 1 MW demonstration plant, it had an internal rate of return of 11.7%, which is economical. The country and model with the highest economic feasibility for the 10 MW class semi-commercial OTEC was Kiribati’s single-stage open-cycle model with a net present value of $322,499,000 and an internal rate of return of 26.1%. The 50 MW class commercialized OTEC showed the highest economic feasibility for the closed-cycle model in Nigeria, with an internal rate of return of 49.7% and a net present value of $1,621,012,000.
In the case of a commercial plant, Fiji, Malaysia, India, Indonesia, and Japan, assuming the existing initial investment cost, were unable to secure economic feasibility with an NPV of 0 or less and an IRR of 5.5% or less in all types of power generation. However, assuming a 15% decrease in initial investment costs through increased technology, Fiji secured economic feasibility with an NPV of $13,696,000 and an IRR of 6.08% in a closed model. On the other hand, assuming a 15% increase in the initial investment cost through inflation, the economic value declined in countries that initially secured economic efficiency, while Brazil failed to achieve economic feasibility in all development models.
Through this paper, we confirmed the economic feasibility of each region based on the scale of development of existing open- and closed-cycle OTEC, and these data can be used for future OTEC development by predicting the numerical value of economic indicators according to the change in initial investment cost.
This paper analyzed the economic feasibility of basic open- and closed-cycle models. Currently, the initial investment cost data for the demonstration plant scale for the hybrid model are insufficient, and the accuracy of the analysis cannot be confirmed. If such data are obtained in the future, we plan to supplement our research.
Author Contributions
Conceptualization, L.S.; Methodology, L.S.; Software, L.S.; Validation, L.S.; Formal Analysis, L.S.; Investigation, K.H.; Resources, K.H.; Data Curation, M.J. and L.S.; Writing-Original Draft Preparation, L.S.; Writing-Review & Editing, M.J. and L.H.; Visualization, L.S.; Supervision, L.H.; Project Administration, K.H.; Funding Acquisition, K.H. All authors have read and agreed to the published version of the manuscript.
Funding
This research received no external funding.
Acknowledgments
This research was supported by a grant from the National R & D Project “Development of 1 MW Ocean Thermal Energy Conversion Plant for Demonstration” funded by the Ministry of Oceans and Fisheries, Korea (PMS4320).
Conflicts of Interest
The author declares that there is no conflict of interest.
Abbreviations
| Symbols | |
| a, b, c, d | Adjustable parameters |
| B | Benefit |
| C | Cost |
| Specific Helmholtz free energy, coefficient | |
| c | Density exponent |
| d | Exponent |
| i | Serial numbers |
| n | Adjustable coefficient |
| p | Pressure |
| Q | Quantity of heat |
| r | Discount rate |
| R | Individual gas constant |
| t | Exponent |
| T | Temperature |
| W | Work |
| h | Enthalpy |
| m | Mass flow rate |
| y | Year |
| Greek Symbols | |
| Rotation–vibration constants | |
| Proportionality constant | |
| Reduced density () | |
| Static dielectric constant | |
| Inverse reduced temperature (/T) | |
| Special caloric function | |
| Dimensionless Helmholtz free energy | |
| Efficiency | |
| Subscripts | |
| tb | Turbine |
| cs | Cold seawater |
| ws | Warm seawater |
| fr | Fresh water |
| net | Net efficiency |
| vac | Vacuum |
| pp | Pump |
| st | Steam |
| wf | Working fluid |
| e | Evaporator |
| c | Condenser |
References
- Uche, J.; Martínez-Gracia, A.; Círez, F.; Carmona, U. Environmental impact of water supply and water use in a Mediterranean water stressed region. J. Clean. Prod. 2015, 88, 196–204. [Google Scholar] [CrossRef]
- Ziolkowska, J.R. Is Desalination Affordable?—Regional Cost and Price Analysis. Water Resour. Manag. 2014, 29, 1385–1397. [Google Scholar] [CrossRef]
- Vanham, D. Does the water footprint concept provide relevant information to address the water–food–energy–ecosystem nexus? Ecosyst. Serv. 2016, 17, 298–307. [Google Scholar] [CrossRef]
- Luo, T.; Young, R.; Reig, P. Aqueduct Projected Water Stress Country Rankings; Technical Note; World Resources Institute: Washington, DC, USA, 2015. [Google Scholar]
- Kempener, R.; Neumann, F. Ocean Thermal Energy Conversion Technology Brief. In IRENA Ocean Energy Technology Brief; IRENA: Abu Dhabi, UAE, 2014; Volume 1. [Google Scholar]
- Vega, L.A. Ocean Thermal Energy Conversion, Encyclopedia of Sustainability Science and Technology; Springer: Berlin, Germany, 2012; pp. 7296–7328. [Google Scholar]
- Bernardoni, C.; Manzolini, G.; Giostri, A. Techno-economic analysis of closed OTEC cycles for power generation. Renew. Energy 2019, 132, 1018–1033. [Google Scholar] [CrossRef]
- Vega, L.A. Economics of Ocean Thermal Energy Conversion (OTEC): An Update. In Proceedings of the Offshore Technology Conference; Society of Petroleum Engineers (SPE), Houston, TX, USA, 3–6 May 2010. [Google Scholar]
- Kim, A.S.; Kim, H.-J.; Lee, H.-S.; Cha, S. Dual-use open cycle ocean thermal energy conversion (OC-OTEC) using multiple condensers for adjustable power generation and seawater desalination. Renew. Energy 2016, 85, 344–358. [Google Scholar] [CrossRef]
- Kim, A.S.; Oh, W.; Lee, H.-S.; Cha, S.; Kim, H.-J. Perspective of membrane distillation applied to ocean thermal energy conversion. IDA J. Desalin. Water Reuse 2015, 7, 17–24. [Google Scholar] [CrossRef]
- Song, Y. A study of OTEC application on deep-sea FPSOs. J. Mar. Sci. Technol. 2018, 24, 466–478. [Google Scholar] [CrossRef]
- Wagner, W.; Pruß, A. The IAPWS Formulation 1995 for the Thermodynamic Properties of Ordinary Water Substance for General and Scientific Use. J. Phys. Chem. Ref. Data 2002, 31, 387–535. [Google Scholar] [CrossRef]
- Lemmon, E.W.; Tillner-Roth, R. A Helmholtz energy equation of state for calculating the thermodynamic properties of fluid mixtures. Fluid Phase Equilibria 1999, 165, 1–21. [Google Scholar] [CrossRef]
- Vega, L.-A. Ocean Thermal Energy Conversion (OTEC). Available online: https://www.semanticscholar.org/paper/Ocean-Thermal-Energy-Conversion-(OTEC)-Vega-Otec/e5d2c26e7e34ae5b96641d5ccf420ae5d48297a1 (accessed on 14 January 2020).
- Lim, S.T.; Lee, H.S.; Kim, H.J. Simulation of power generation performance of MW-class open-cycle OTEC and closed-cycle OTEC. J. Korean Soc. Mar. Eng. 2019, 43, 420–426. [Google Scholar]
- Seungtaek, L.; Hoseang, L.; Hyeonju, K. Dynamic Simulation of System Performance Change by PID Automatic Control of Ocean Thermal Energy Conversion. J. Mar. Sci. Eng. 2020, 8, 59. [Google Scholar] [CrossRef]
- Tillner-Roth, R.; Yokozeki, A. An International Standard Equation of State for Difluoromethane (R-32) for Temperatures from the Triple Point at 136.34 K to 435 K and Pressures up to 70 MPa. J. Phys. Chem. Ref. Data 1997, 26, 1273. [Google Scholar] [CrossRef]
- Navani, J.P.; Sapra, S. Non-Conventional Energy Resources (For UPTU & UTU), 1st ed.; S. Chand & Company Pvt. Ltd.: Delhi, India, 2013. [Google Scholar]
- Lim, S.-T.; Lee, H.-S.; Moon, J.-H.; Kim, H.-J. Simulation of Regional Economic Analysis of Closed Cycle OTEC for Empirical Application. J. Korean Soc. Power Syst. Eng. 2020, 24, 73–82. [Google Scholar] [CrossRef]
- Sea Temperature. Available online: https://www.seatemperature.org (accessed on 1 December 2019).
- Danilenko, A.; Berg, C.V.D.; Macheve, B.; Moffitt, L.J. The IBNET Water Supply and Sanitation Blue Book 2014: The International Benchmarking Network for Water and Sanitation Utilities Databook; IBNET: Washington, DC, USA, 2014. [Google Scholar]
- Lewis, A.; Estefen, S.; Huckerby, J.; Li, K.; Musial, W.; Pontes, T.; Julio, T.M. Ocean Energy. In IPCC Special Report on Renewable Energy Sources and Climate Change Mitigation; Edenhofer, O., Pichs-Madruga, R., Sokona, Y., Seyboth, K., Matschoss, P., Kadner, S., Zwickel, T., Eickemeier, P., Hansen, G., Schlömer, S., et al., Eds.; Cambridge University Press: Cambridge, MA, USA, 2011. [Google Scholar]
- Vega, L.A. Economics of Ocean Thermal Energy Conversion (OTEC); American Society of Civil Engineers (ASCE): Reston, VA, USA, 1992; pp. 152–181. [Google Scholar]
- Yoon, J.I.; Son, C.H.; Bark, S.M. Power System for Ocean Thermal Energy Conversion (OTEC). J. Korean Soc. Mar. Eng. 2012, 36, 217–223. [Google Scholar]
- Kim, J.H.; Kim, G.T.; Park, S.H.; Oh, W.Y.; Kim, H.J. A Feasibility Study on Thermal Energy Resource in Deep Ocean Water. J. Korean Soc. Mar. Environ. Eng. 2012, 15, 9–18. [Google Scholar] [CrossRef]
- Bharathan, D.; Green, H.; Link, H.; Parsons, B.; Parsons, J.; Zangrando, F. Conceptual design of an open-cycle ocean thermal energy conversion net power-producing experiment (OC-OTEC NPPE). Concept. Des. Open-Cycle Ocean Therm. Energy Convers. Net Power-Prod. Exp. (OC-OTEC NPPE) 1990. [Google Scholar] [CrossRef]
© 2020 by the authors. Licensee MDPI, Basel, Switzerland. This article is an open access article distributed under the terms and conditions of the Creative Commons Attribution (CC BY) license (http://creativecommons.org/licenses/by/4.0/).