Article

Accumulation of Airborne Toxic Elements and Photosynthetic Performance of Lolium multiflorum L. Leaves

1
Department of Ecology and Environmental Protection, Poznan University of Life Sciences, 60-637 Poznan, Poland
2
Department of Mathematical and Statistical Methods, Poznan University of Life Sciences, 60-637 Poznan, Poland
3
Department of Trace Analysis, Faculty of Chemistry, Adam Mickiewicz University, 61-614 Poznan, Poland
4
Department of Agricultural Chemistry and Environmental Biogeochemistry, Poznan University of Life Sciences, 60-637 Poznan, Poland
5
Institute of Construction and Geoengineering, Poznan University of Life Sciences, 60-637 Poznan, Poland
6
Institute of Land Improvement, Environmental Development and Geodesy, Poznan University of Life Sciences, 60-637 Poznan, Poland
*
Author to whom correspondence should be addressed.
Processes 2020, 8(9), 1013; https://doi.org/10.3390/pr8091013
Submission received: 16 July 2020 / Revised: 14 August 2020 / Accepted: 17 August 2020 / Published: 19 August 2020

Abstract

:
In this study, we aimed to investigate the accumulation of airborne trace elements in Lolium multiflorum leaves concerning photosynthetic activity parameters. Five sites for four 28-day series of plant exposition were selected. The concentration of trace elements in leaves was measured after each series, while photosynthetic activity parameters were measured three times during each series. Net photosynthesis rate (PN) and stomatal conductance (gs) were mostly negatively associated with all analyzed trace elements, unlike to CO2 concentrations (Ci). Arsenic was found with opposite trend in two exposure series. The high accumulation of Cd and Pb in plants recorded at two sites was mostly related to lowest PN and gs. Similar tendency for PN was found at sites and series with the highest Cr and Ni content in plants. L. multiflorum revealed a medium-level accumulation of trace elements and a low tolerance of the photosynthetic process to the presence of trace elements in ambient air.

1. Introduction

Increasing heavy metal concentrations in soil and ambient air, caused by a higher intensity of human activities, can limit the growth and yield of plants [1,2]. Trace elements in the ambient air can cause a physiological imbalance in plants, influencing the biogeochemical balance and stability of habitats [3]. Physiological and biochemical processes aiming to maintain or regain cell homeostasis, disturbed due to negative stress factors, are very important for the further determination of potential resistance to these stress factors, such as trace elements in ambient air. The defensive mechanisms of plants for specific elements employ one of two strategies: avoidance or tolerance of stress. The first strategy involves various processes limiting the absorption of toxic ions into the cells. The second one allows the plant to absorb the element, but its negative effects are minimized by various processes inside the cell [4].
There are heavy metals (HM), such as cobalt, copper, iron, manganese, molybdenum, nickel, and zinc are necessary elements for plant life functions; however, an increase in their concentration can cause HM stress and impact various processes in plant metabolism [4]. Due to their high reactivity, they can have a direct influence on growth, senescence, and various processes that produce energy in plants. There is many several approaches conducted by plants to survive the toxicity of HM, such as the protein pump in the cytoplasmic membrane, capture of trace elements in the cell, and creation of connections with ligands, e.g., phytochelatins or free amino acids. Hyperaccumulators can collect up to a few percent of HM in dry matter of aboveground plant organs [5]. Mechanisms responsible for this ability were examined by many investigators, but there are still a lot of uncertainties and discussions [6].
The photosynthetic process is very sensitive to the presence of trace elements in the environment. Disturbances of photosynthesis are the first symptom of their toxic effect [7]. The influence on photosynthesis includes injuries of the leaf structure, the ultrastructure of chloroplasts and chloroplast membranes, disturbances in chlorophyll synthesis, especially in seedlings and new leaf growth [8], inhibition of PSI and PSII activity, and disturbances in electron transport [7,9]. Heavy metals can affect on leaf and chloroplast structure and might be revealed by inhibition of leaf growth as well as disorganization of chloroplast ultrastructure. Lead and cadmium can cause the disappearance of chloroplast thylakoids and increase the number of lipid droplets (plastoglobules) [10].
Interactions of HM with enzymatic proteins and other biomolecules are the main cause of negative effects on certain photosynthetic reactions. Trace elements can cause cell oxidative stress and the creation of reactive oxygen species (ROS). This can result in many negative effects on lipids, pigments, membranes, and enzyme activity. To decrease this process, the plant defense system includes some enzymatic and non-enzymatic mechanisms to achieve the redox balance [11]. The enzymatic system includes enzymes like peroxidases (POX), superoxide dismutase (SOD), and catalases (CAT), and non-enzymatic scavengers like glutathione (GSH) or ascorbate (AsA) [12]. The effect of the antioxidative mechanism relates mainly to the balance of redox and avoiding cell and tissue damage, especially chloroplasts and mitochondria [13].
The possibility of the accumulation of HM in plants is widely used for the determination of their concentrations in different environments, but the use of plants with a standardized response is critical in the production of reproducible results [14]. Lichens and mosses are the most popular air pollution bioindicators of trace elements [15,16,17,18,19,20], but their use in highly polluted areas might be limited due to their low tolerance levels; higher plants can be used, as they are more tolerant. Several plants are used as bioindicators of air pollution, such as tobacco (Nicotiana tabacum L. [21], white campion (Melandrium album), and black locust (Robinia pseudoacacia) [22], or other trees and shrubs [23]. There is also great interest in standardized Italian ryegrass (Lolium multiflorum L.) as an easy-to-apply and low-cost HM bioindicator [24]. This plant belongs to the Poaceae family and is widely cultivated as a pasture plant and material for bio-ethanol production [25]. Standardized Italian ryegrass cultivated in controlled conditions can be used for the monitoring of trace elements (in anthropogenic areas, with high replicability and comparable results [26]). Other factors do not influence the final result of heavy metal accumulation, because all exposed plants are cultivated in the same conditions (water and soil properties). The most important factors affecting plant HM accumulation levels are their concentrations in the air and meteorological conditions [27].
Due to its high biomonitoring potential and tolerance, we can also evaluate the potential of plant species tolerant to HM in ambient air, as well as investigating the mechanisms of response (such as photosynthetic activity) to stress factors. In this study, In this study, our aims were to: (i) examine whether there were any significant differences between photosynthetic activity parameters and the accumulation of trace elements of plants exposed in sites varying in environmental characteristics; (ii) evaluate whether there were any significant differences between gas exchange parameters during the growing season; (iii) determine the types of relations between HM concentrations in leaves and photosynthetic activity parameters of L. multiflorum and evaluate the potential of photosynthetic activity as a biomarker of airborne trace elements stress.

2. Materials and Methods

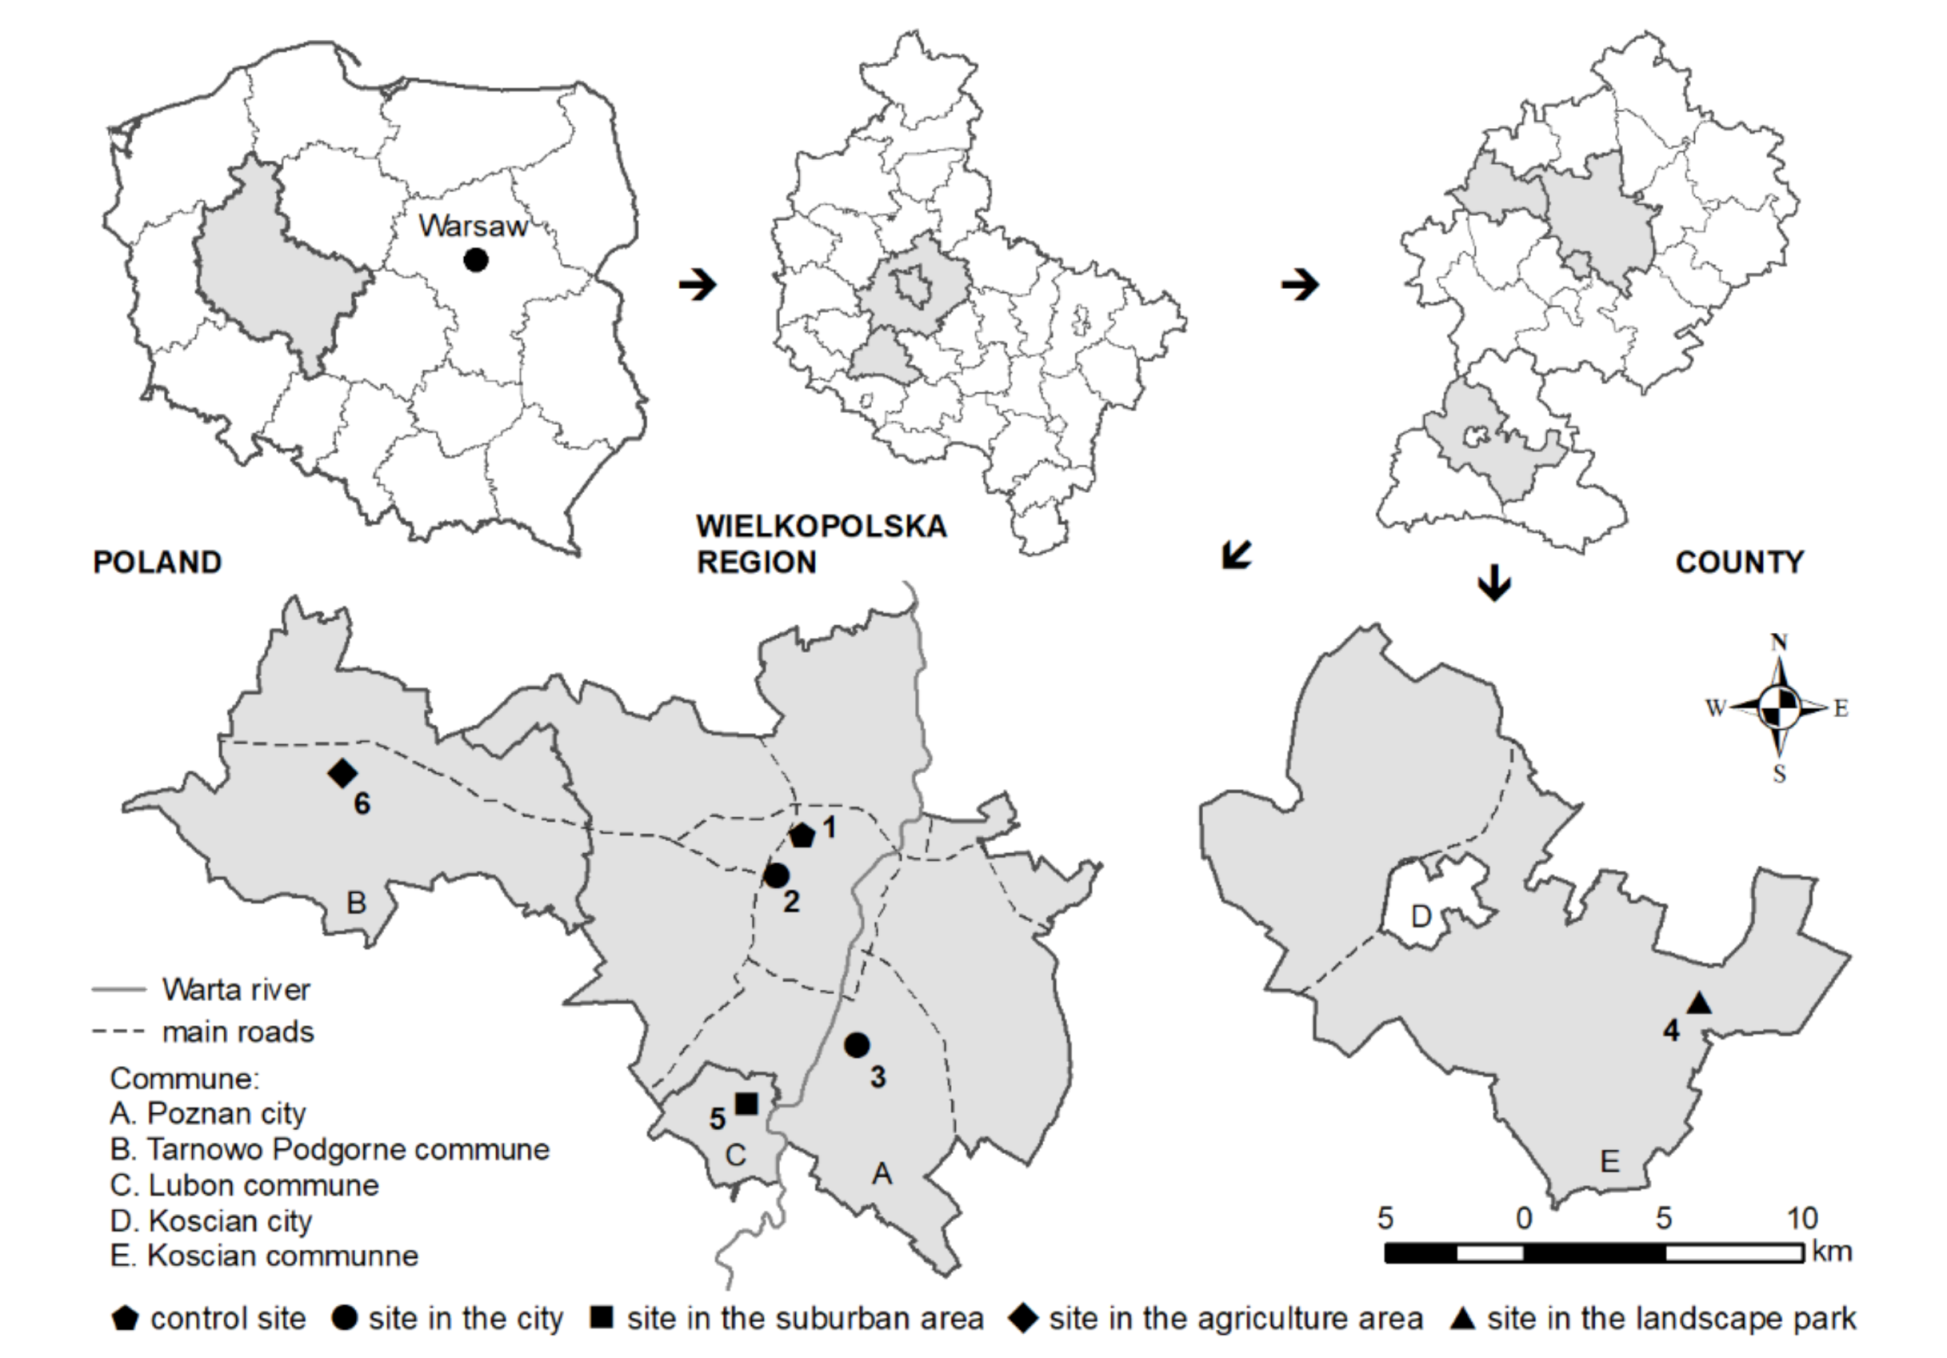
2.1. Experimental Design

The experiment was carried out during the growing season in 2011. The investigation schedule was provided according to the standardized method of the German Engineering Association [28]. 5 L pots with a standard mixture of peat and sand were used with the same amount of seeds sawn in it. The deionized water was used to plants irrigation. A solution of laboratory chemicals (analytical grade) was used so that no heavy metals in readily available form were introduced into the substrate during cultivation in the greenhouse. It contained 5.8 g KH2PO4, 8.5 g KNO3, and 5.3 g NH4NO3 per liter of deionized water. The last fertilizer application was at least one day before transport to the exposure site. Plants were cut to 4 cm before exposure to sites varying in environmental conditions. The control site (site 1) and five exposure sites were selected for these investigations, located in Poznan city and surrounding areas. Two sites were located in an urban area (sites 2 and 3), one site in a suburban area (site 5), one site in an agricultural area (site 6), and one site located in the Agro-ecological Landscape Park (site 4) (Figure 1). Each of four exposure series lasted 28 ± 1 days in 2011 growing season (16.05–12.06; 13.06–10.07; 11.07–07.08; 08.08–04.09). A similar set of five plants as at exposure site was cultivated in greenhouse conditions as a control. Deionized water was supplied through glass fiber wicks located in pots and water tanks placed underneath the pots. The construction made it possible to ensure plants were 130 cm above the ground at every site, to obtain comparable results of the plant response to air pollution by trace elements.

2.2. Trace Elements Analysis

Lead (Pb), cadmium (Cd), nickel (Ni), chromium (Cr), and arsenic (As) concentrations in leaves were measured after every exposure series. Five samples (replicates) were taken from each site. Leaves were dried and 0.5 g of dry weight was placed in 9 mL of ultrapure HNO3. Samples were mineralized in MARS5 microwave equipment. The whole process was divided into three phases: reaching certain parameters, maintaining the parameters (pressure 300 PSI, temperature 175 °C) for 15 min, and cooling for the next 15 min. The digested samples were quantitatively transferred into 10 mL volumetric flasks, and the final volume adjusted to the mark with deionized water. Procedural blanks and reference materials were carried out in the same way as the samples in each digestion run. The digestion process for each sample was replicated three times.
Elements were determined in each prepared sample using an inductively coupled plasma mass spectrometer (ICP-MS) equipped with a dynamic reaction cell (Elan DRCII, Perkin Elmer, Toronto, Ontario, Canada). An ICP-MS spectrometer equipped with a Meinhard concentric nebulizer, cyclonic spray chamber, Pt cones, and quadrupole mass analyzer was used for this study. Typical instrument operating conditions for the ICP-MS spectrometer were: RF power 1150 W, plasma Ar flow rate 15 L/min, nebulizer Ar flow rate 0.98 L min−1, and auxiliary Ar flow rate 1.2 L min−1. Whilst tuning the ICP-MS, compromise conditions for maximum signal intensity of the analyte (24Mg+, 115In+, 238U+), minimum ratio of oxide (140Ce16O+/140Ce < 3%), and doubly charged ions (128Ba2+/128Ba+ < 3%) were found. The proper conditions of ICP-MS operation were checked by using a solution containing Mg, In, and U at a concentration of 1 µg L−1 and Ba concentration of 10 µg L−1 (Smart Tune Solution—Elan DRC II/plus, Atomic Spectroscopy Standard, PerkinElmer Pure). Calibration curves were established using aqueous standards of relevant elements. The standard solutions were prepared using 10 mg L−1 Multi-element ICP-MS Calibration Std 3 (Atomic Spectroscopy Standard, PerkinElmer, Canada). The isotopes of Sc45 and Rh103 were prepared from appropriate solutions with a concentration of 1000 mg L−1 (Merck, Darmstadt, Germany). All standards were prepared daily after subsequent appropriate dilution with high purity deionized water (Millipore, Burlington, MA, USA). The correction with internal standards, scandium and rhodium at the concentration of 1 µg L−1, allowed us to correct for matrix-induced variation and instrumental drift.
To verify the analytical performance of the applied method, we validated the selected parameters. Calibration curves were determined by the interpolation method. For all analytes, the calibration curves demonstrated very good linearity, and the correlation coefficients were 0.999 for all elements. The limit of detection (LOD) was considered three times the standard deviation (SD) for the ten independent blank samples. The estimated detection parameters were as follows: As—0.005 µg/g; Cd—0.003 μg g−1; Cr—0.01 μg g−1; Ni—0.01 μg g−1; Pb—0.009 μg g−1. Precision values, expressed as relative standard deviations, were estimated as As—2.3%; Cd—1.6%; Cr—2.3%; Ni—2.5%; Pb—2.1%. Establishing traceability of measurement was performed by applying: Water reference material NIST 1643e (NIST, Gaithersburg, MD, USA) and trace elements in spinach leaves NIST SRM 1570a (NIST, Gaithersburg, MD, USA). In the course of the study, the control materials were run every 10 samples to ensure analytical accuracy. The calculated recoveries for NIST SRM 1570a were As—95%; Cd—98%; Cr—93%; Ni—96%; Pb—98%; NIST 1643e recovery values ranged from 95% to 101%.

2.3. Gas Exchange Measurements

Before (Day 0), in the middle (Day 14), and at the end (Day 28) of each exposure series, net photosynthetic activity (PN), stomatal conductance (gs), and intercellular CO2 concentration (Ci) were measured. Leaves without mechanical injury and fully developed leaves were chosen. Gas exchange investigations were conducted with the aid of the portable photosynthesis system Ci 340 aa (CID BIOSCIENCE Inc., Camas, WA, USA). The constant conditions in the leaf chamber were maintained to ensure similar conditions of measurements at every site: CO2 inflow concentration (390 µmol (CO2)mol−1), photosynthetic photon flux density (PPFD) 1000 µmol (photon) m−2s−1, a chamber temperature of 23 °C, and relative humidity of 50% ± 3%. Gas exchange measurements were performed between 10:00 and 15:00 h. Five plants (replicates) were analyzed at every site.

2.4. Statistical Analysis

Results were analyzed with a factorial ANOVA with “exposure site” and “day of measurement” as fixed factors. Before ANOVA, the normality and homogeneity of data were checked. Shapiro–Wilk’s test and Bartlett’s test were conducted, respectively. The data normality and Box–Cox’s transformation were performed in case of a lack of data normality and homogeneity. The differences between measured parameters were analysed with the aid of Tukey’s test, while principal component analysis (PCA) was performed to determine the structure and rules between variates. In this analysis, the orthogonal transformation of observed variates to a new set of non-correlated variates (components) was performed. Pearson’s correlation coefficients were presented in the form of a matrix of correlations. The data were analyzed with the statistical software STATISTICA 13.1 R platform version 3.6.1.

3. Results

3.1. Trace Elements Accumulation and Meteorological Conditions

The results varied between sites and series. The possibility of trace elements accumulating changes during the growing season, which might be related to changing meteorological conditions. Hence, the variation between sites might be more important for further recommendations for certain areas of environmental management and we were more focused on site variability. One-way ANOVA within a certain series revealed a highly significant effect of site on each element accumulation in plants (Table 1). Trace element concentrations in L. multiflorum leaves varied between exposure series. Chromium and nickel accumulation levels were mostly the highest in plants located in urban areas (sites 2 and 3); however, higher levels were also noted at the agricultural site (site 6) (Table 2). The highest levels of these two elements were observed after the second and third exposure series, which might be related to the highest precipitation levels (Table 3). The Agro-ecological Landscape Park (site 4) was found with the highest arsenic accumulation in plants in all series (excluding series 1). Although arsenic-based pesticides are no longer used, elevated arsenic levels may be connected with a windblown dispersion of fine particulate material containing arsenic. Cadmium and lead accumulation levels were the highest at urban sites. The highest cadmium levels were observed after the third series, the highest lead levels after the second series (Table 2).

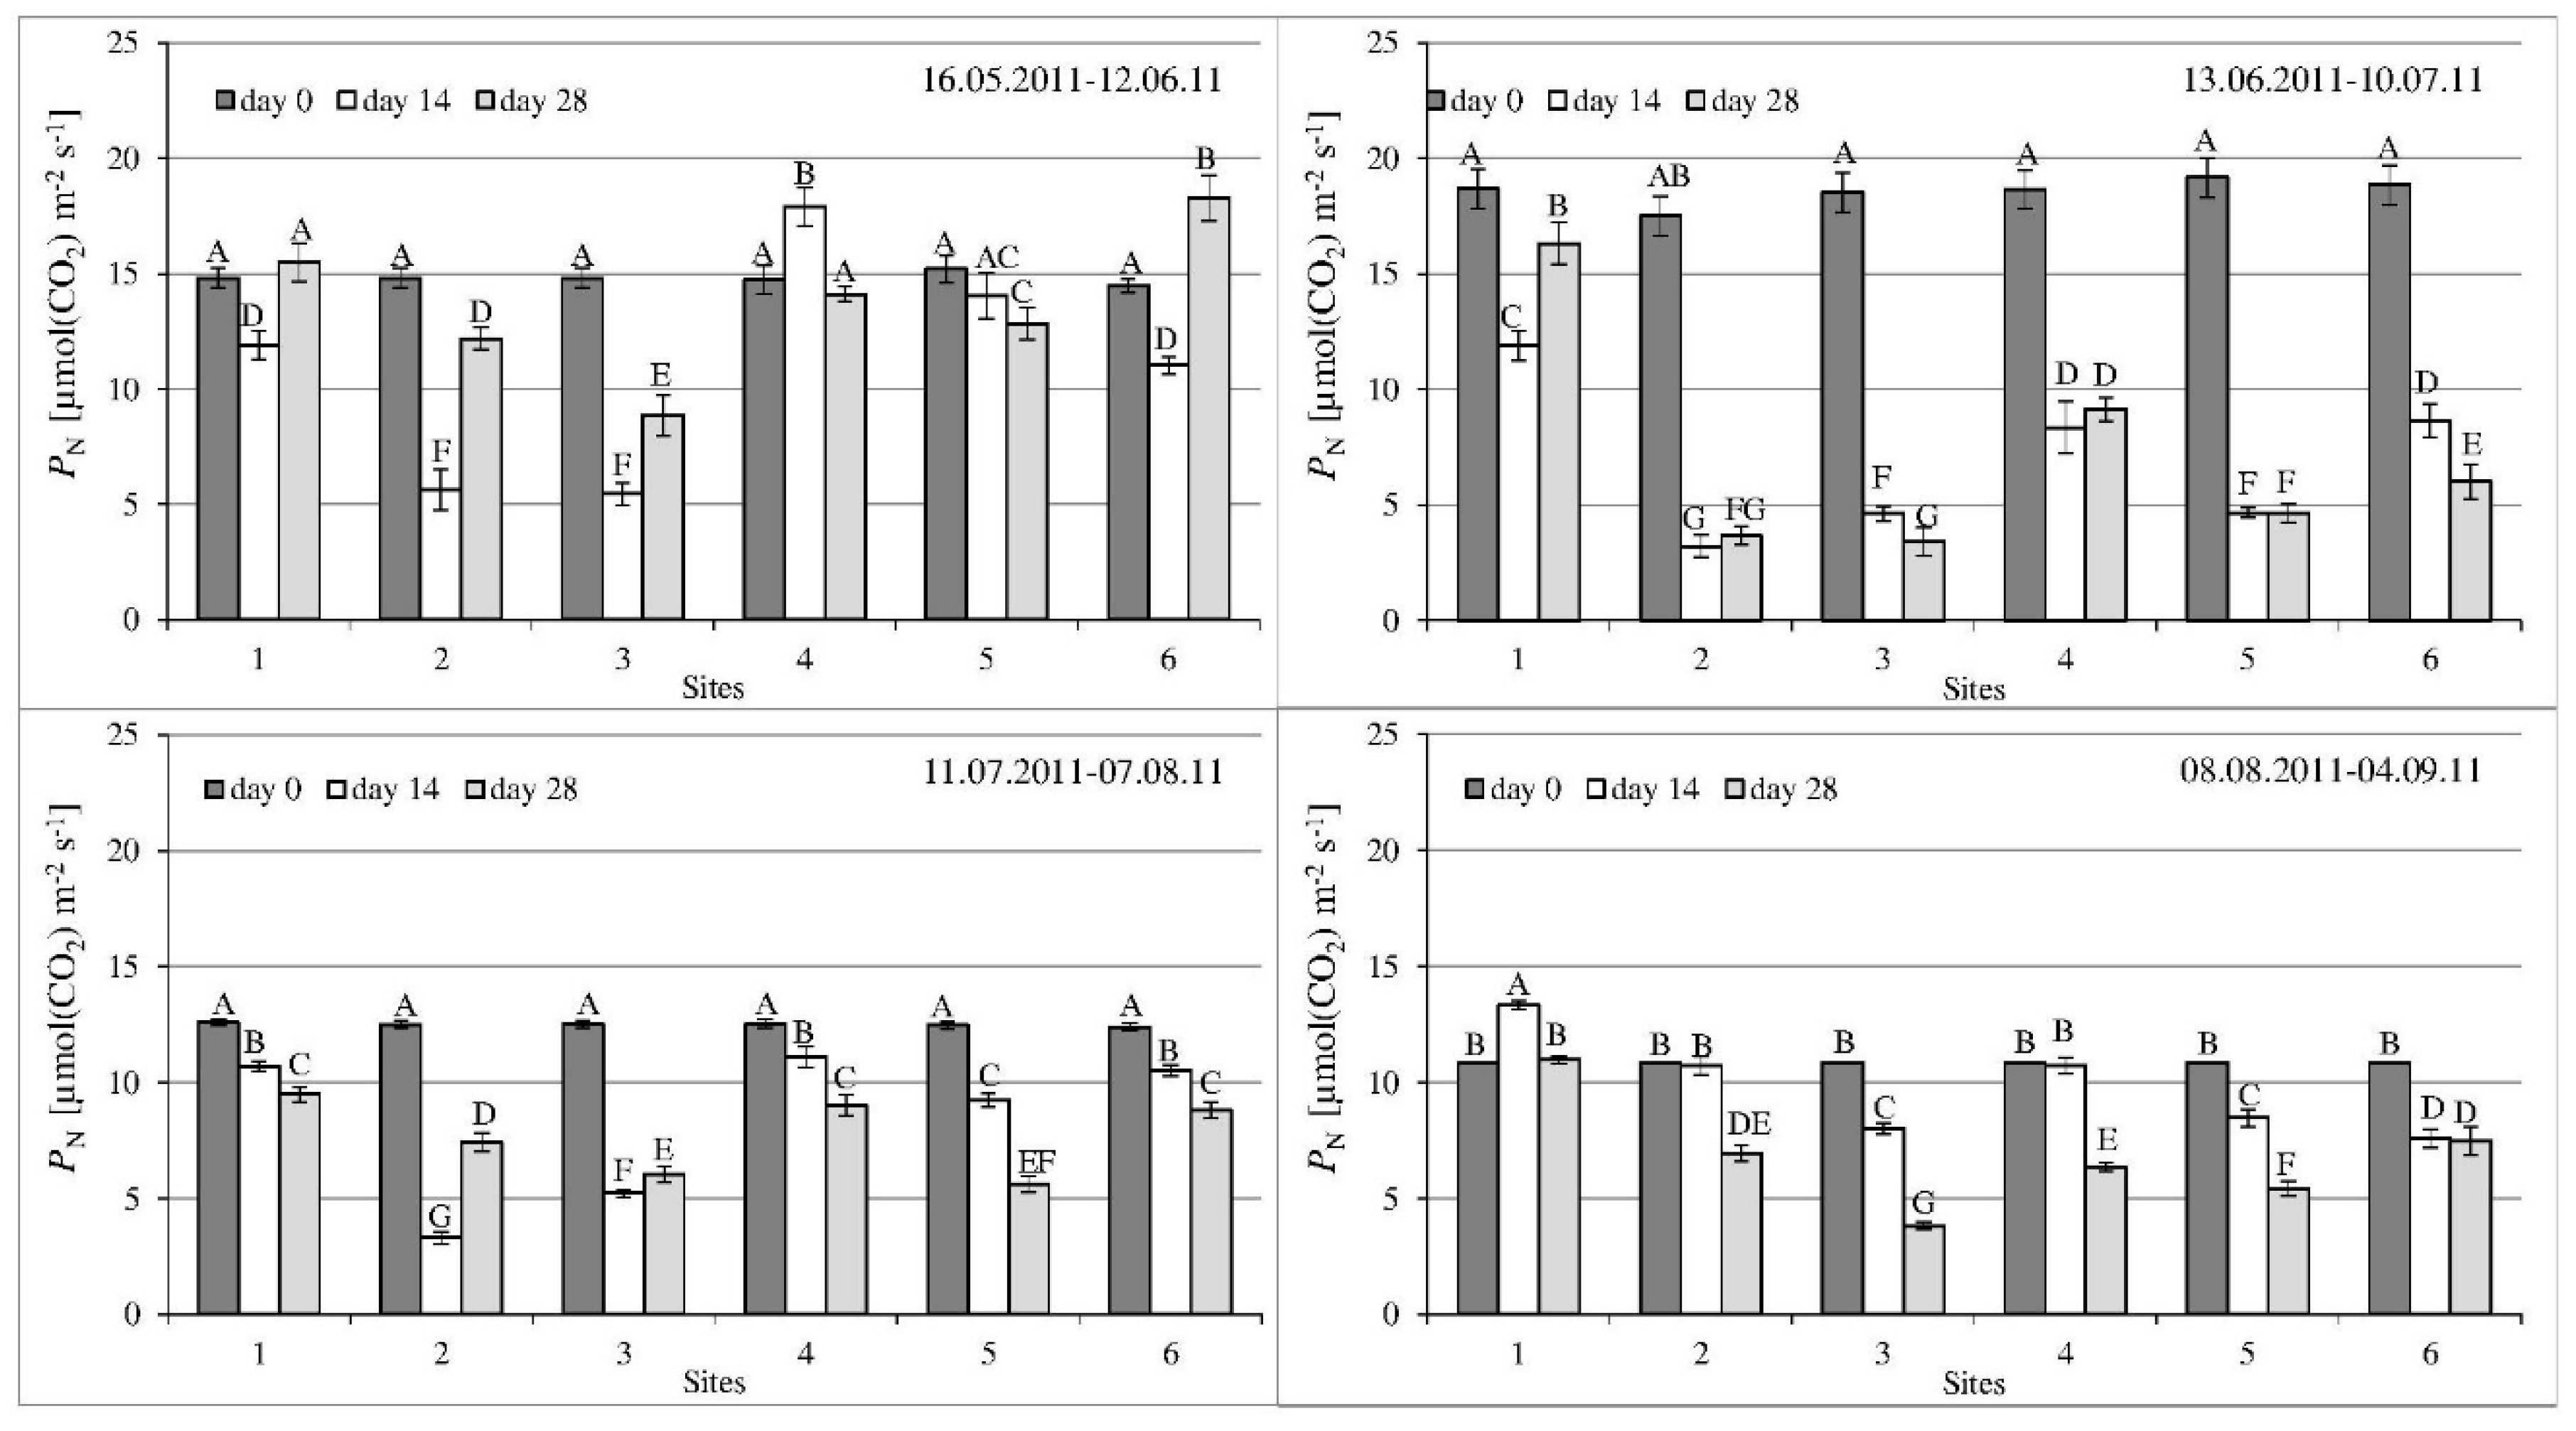
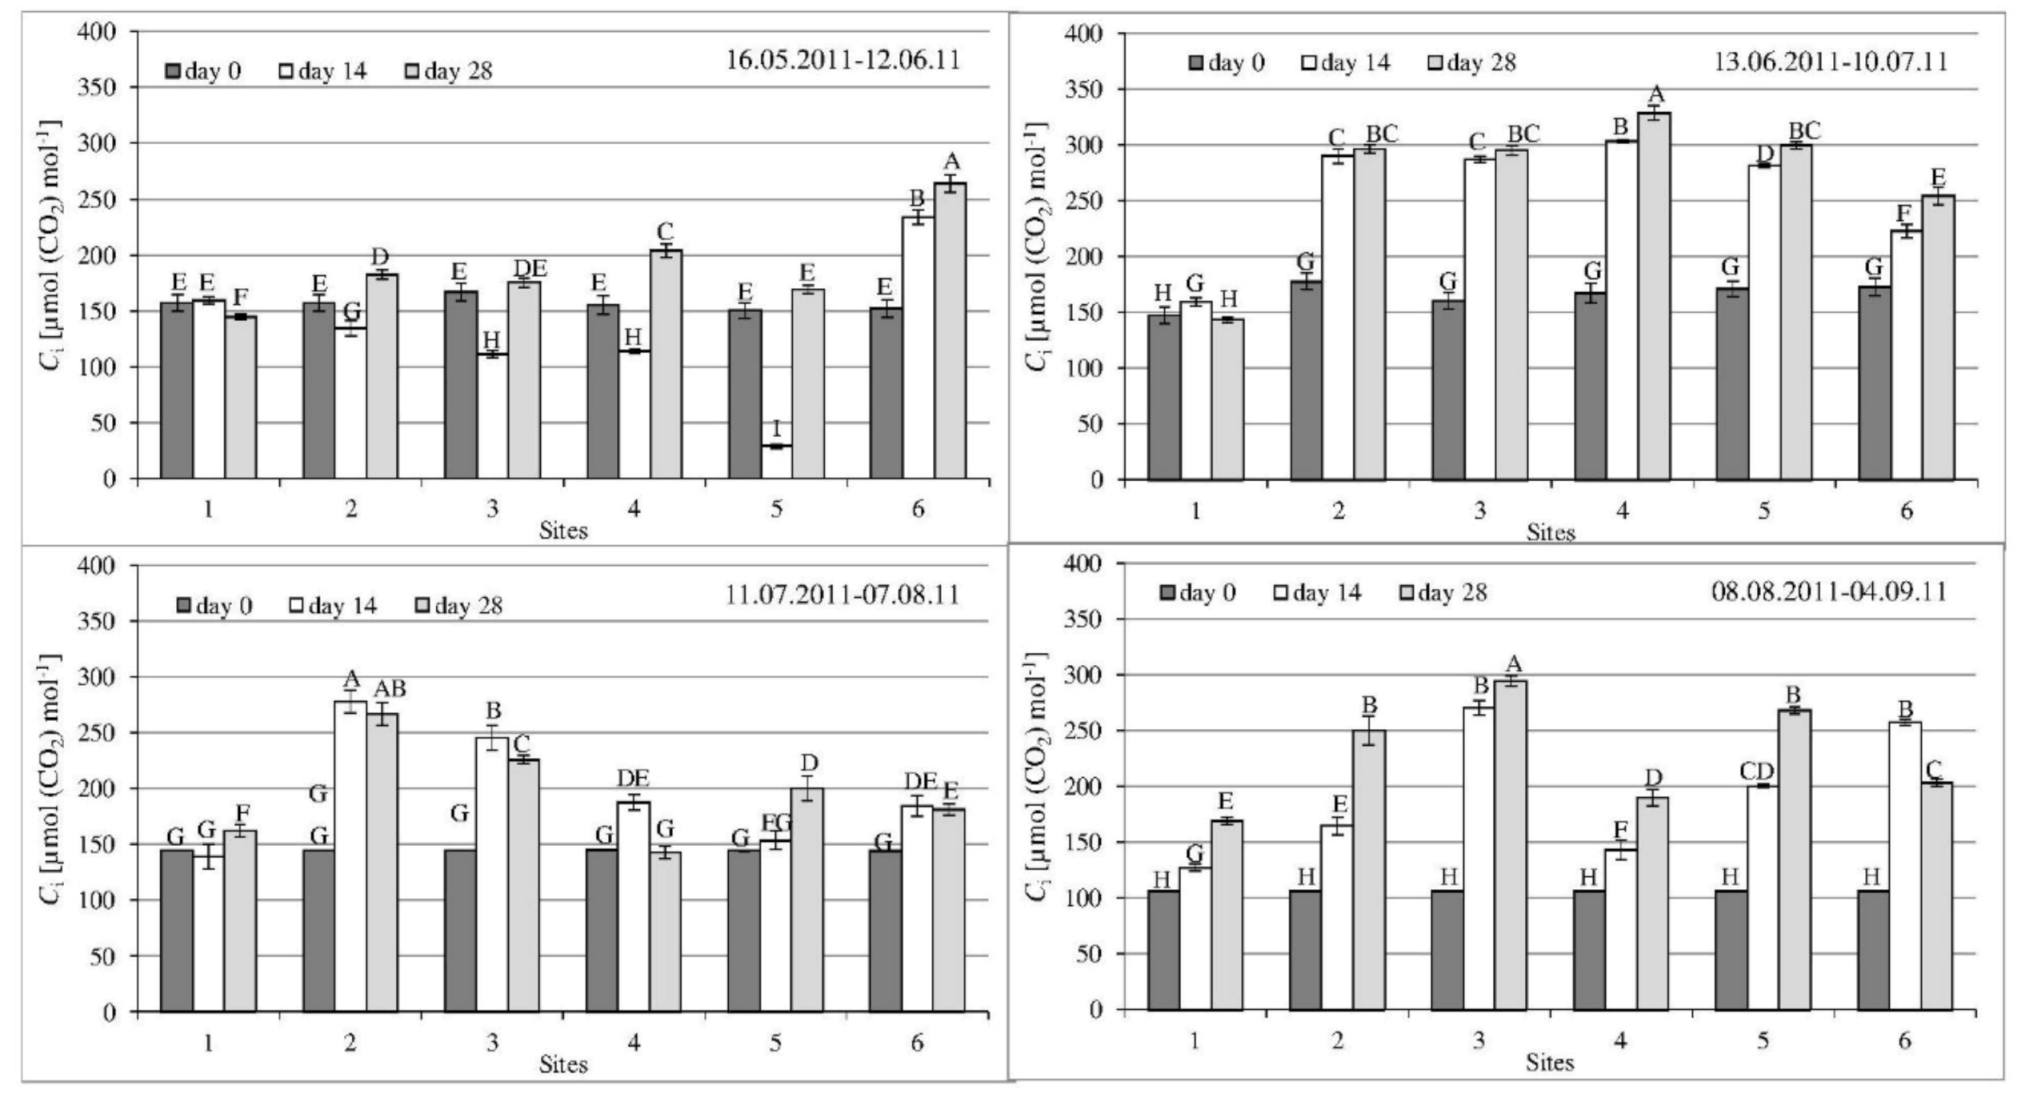
3.2. Gas Exchange Parameters

Gas exchange parameters varied between sites and series; however, the differences in plant response might also be seen within each series due to the growth of plants and changes in physiological plant response at each site. Two-way analysis of variance revealed a highly significant effect of site and term of measurement interaction on the net photosynthesis rate in all exposure series, while gs and Ci results were statistically dependent on site only during the second and third series (Table 4).
The net photosynthesis rate varied between series and sites. The lowest level was mostly noted at urban sites in all exposure series. The mid-series measurements during the first series revealed a decrease at both urban sites and an increase at the end; however, these values did not reach the level before exposure. The highest level of PN was observed after exposure for the first series (Figure 2), which might be connected to the relatively low levels of trace elements in comparison to the other series (Table 2).
Overall, the lowest levels of PN were noted after exposure in the second and fourth series. Moreover, a decrease of PN at the end of exposure was observed in most exposed plants of the fourth series (excluding site 6), whereas the response pattern varied in other series. Usually, the highest level of PN was recorded at sites 4 and 6 (Figure 2).
Stomatal conductance was related to PN response, and usually, a decrease at the end of exposure was noted; however, the lowest levels were noted in the last two series and there were no differences between plants from almost all sites at the end of exposure in the fourth series (Figure 3). Intercellular CO2 concentrations also varied between sites and series, and the highest levels were noted in the second series, where the lowest levels of PN were also recorded (Figure 2 and Figure 4). An increase of Ci at the end of the exposure series was noted—this was especially valid for the last series. Additionally, during the fourth series, a higher increase of Ci was found in plants located at urban areas (sites 2 and 3); however, during the second series, a relatively high level of Ci was noted in plants exposed at site 4, where a high level of PN was also observed. In some exposure sites, a decrease of PN and gs after 14 days of exposure was noted and then an increase, but not higher than the level at day 0. In some cases, this was related to the opposite level of Ci (Figure 2 and Figure 4).

3.3. Relations between Trace Element Accumulation and Photosynthetic Activity

PCA revealed that after the first exposure series PN and gs had negative relations to all measured trace elements, whereas Ci revealed a positive or no relation to trace element concentrations. A positive location of trace elements of control site to PN and gs was noted opposite to the exposure sites. In the rest of the series, Ci revealed a positive relation to trace elements (excluding As). A similar location of the control site concerning PN and gs was found in the rest of the series. Arsenic was found in a position indicating no relation to photosynthetic parameters and trace elements (Figure 5).
The accumulation and photosynthesis activity level in ambient air conditions might be the synergistic result of many factors, including other air pollutants (such as oxidative and particulate matter), meteorological conditions, and trace elements accumulation. To analyze these possibilities, a matrix of correlation was performed. All data from the experiment and the sites were taken into consideration. A positive relation was found between PN and such parameters as, SO2, O3, and UVB radiation, whereas gs revealed a positive relation to air temperature. A negative relation was found between PN and Cr, Cd, Pb, NOx, and air humidity. A strong negative relation was also found between gs and Cd (Figure 6).

4. Discussion

Air pollution by trace elements can cause several negative effects on the environment, including plants. The main sources of trace elements in the Wielkopolska region are transport, households, and agriculture. Air pollution caused by these sources is hard to eliminate due to population growth, vehicular traffic, and food production. The accumulation of elements in plant tissue might be related to meteorological conditions, such as precipitation. The highest precipitation was noted in the third series (Table 3), together with the elevated accumulation of some elements, such as chromium, nickel, and cadmium. The lower levels of arsenic and lead may be associated with rainfall, which may interfere with metals’ bioavailability characteristics [29].
Plant growth is influenced by many synergistic and antagonistic factors that determine the final result. We have correlated trace elements accumulation and photosynthesis activity parameters to meteorological parameters and other air pollutants. Some oxidative air pollutants also influenced plant photosynthesis and the potential to accumulate trace elements. A positive relation was found between PN, tropospheric ozone and solar radiation. A positive relation between ozone and UVB is related to the conditions of ozone creation, where solar radiation is a key factor [30]. Tropospheric ozone is a well-known phytotoxic air pollutant and harms many crop plants [31]; however, we observed that trace elements were more negatively-related to photosynthesis plant activity than this air pollution. NOX air pollution related negatively to PN, while some authors previously found a positive role of NOX and SO2 on plant response at certain levels in control conditions [32]. We can conclude that some negative effects of elements on plants, such as Cd, Cr, and oxidative air pollutants, such as NOX, might be important. So, it is important to take into consideration all possible influencing factors during ambient air condition experiments.
Air pollution can cause a decrease in plant productivity due to its direct effect on plants and an indirect effect on the environment, such as soil and water [33]. Most exposed plants usually reveal some physiological changes before visible symptoms occur [34]. The negative role of airborne trace elements in particulate matter on photosynthetic activity, as well as on nitrate assimilation, was already proven [35]; however, there is a lack of studies in ambient air conditions confirming these findings.
Negative effect of trace elements on photosynthetic activity can be observed. On the other hand, in the case of cadmium hyperaccumulators and tolerant species, an elevated photosynthetic activity can also be found as an adjustment to stress due to tolerance of their carbon assimilation enzyme (Rubisco) [36] and carbonic anhydrase [37]. Shanying et al. [38] indicated a protective role of organic-Cd complex formation and changing the interactions of Cd with other elements, as a tool to protect the photosynthetic process against excessive Cd levels in hyperaccumulator species; however, many authors have pointed out the non-essential function of cadmium in plants and the negative effect of its excess on photosynthesis and biochemical processes [39,40].
Although toxic levels of Cd in plant tissues, which are considered to be 3–30 mg kg−1 [41,42], were not recorded in our experiment, decreases of PN and gs were found as well as a negative relation to Cd in all exposure series. This might indicate a low level of tolerance of L. multiflorum to Cd in the atmosphere, as well as the potential of PN and gs to be early-stage indicators of Cd stress without visual symptoms. Decreasing stomatal conductance was also found as an effect of Cd influence on plants [43,44].
There have been relatively few studies on the effect of arsenic on photosynthesis; however, a chemical relation between arsenate and phosphate was reported, which enables the replacement of the latter in ATP (adenosine triphosphate), which in turn may cause an imbalance in growth and plant metabolism [45]. Rahman et al. [46] found a negative effect of arsenic on chlorophyll content, which in turn can disrupt photosynthesis.
Nickel was found to be an essential element for plants in amounts between 0.01 and 5 µg g−3 DW [47]. Nevertheless, our results show that some effects on photosynthetic activity can already be observed within this range. A negative relation of Ni accumulation and PN, as well as gs, was found. Similarly, as for Cd, it may indicate low tolerance of photosynthesis and further potential as a biomarker of trace element stress without visible symptoms. A nickel-caused decrease of PN and gs was already found in wheat, which was related to stressed carbon metabolism and similarly, as in the case of Cd, with a decrease of Rubisco [48]. The relation between Ni leaf concentration and PN decrease was also found in poplar [49]. The authors related the reduction of the photosynthetic process to mesophyll conductance and metabolism impairment. Some hyperaccumulators of Ni, such as Arundo donax L. [50], also showed no response or even an increase of photosynthetic activity, which may indicate that L. multiflorum can be tolerant or even a sensitive indicator without visible symptoms.
Similarly to Cd and Ni, chromium affects photosynthesis through a disturbance in Rubisco [51,52], CO2 fixation, and electron transport [9,53]. Decreases of PN, gs, and transpiration rate were observed in chromium-treated Lolium perenne plants [50], pea [52], and Datura innoxia [54].
Lead was also found to be a disruptor of the photosynthetic process due to inadequate carbon dioxide concentration because of stomatal closure, obstruction of the electron transport system, and distorted chloroplast ultrastructure [55]. We have noted a decrease of PN and gs, which caused a reduction of CO2 availability for photosynthesis, similar to reports by previous authors.

5. Conclusions

Net photosynthesis rate (PN) and stomatal conductance (gs) were mostly negatively associated with all analyzed trace elements, unlike to CO2 concentrations (Ci). Arsenic was found with opposite trend in two exposure series. The high accumulation of Cd and Pb in plants recorded at two sites was mostly related to lowest PN and gs. Similar tendency for PN was found at sites and series with the highest Cr and Ni content in plants. Based on our results, we can conclude that L. multiflorum is a plant showing low tolerance of the photosynthetic process to the presence of trace elements in ambient air and, in turn, its photosynthetic parameters are potential indicators of stress caused by trace elements in the air without visible symptoms. The plant response was also connected with the other factors occurring in the ambient air conditions, such as other pollutants and meteorological parameters.

Author Contributions

K.B., J.Z., and D.B. conceived the idea and planned the experiments. K.B., A.B., M.L.-Z., A.S.-G., J.K. and R.G. carried out the experiments. A.B., D.K. and A.S.-G. planned and carried out the statistical analyses. A.H., M.L.-Z. and R.G. contributed to sample preparation. K.B. and A.B. contributed to the interpretation of the results. K.B. took the lead in writing the manuscript. All authors provided critical feedback and helped shape the research, analysis, and manuscript. All authors have read and agreed to the published version of the manuscript.

Funding

This research was funded by the NATIONAL SCIENCE CENTRE, grant number N 0540/B/P01/2011/40.

Acknowledgments

We would like to thank the Adam Mickiewicz University Botanical Garden and Research Station in Turew of the Institute for Agricultural and Forest Environment of the Polish Academy of Sciences for their provision of space for exposure sites. I would also like to thank the Adam Mickiewicz University Botanical Garden and Research Station in Turew of the Institute for Agricultural and Forest Environment of the Polish Academy of Sciences for their provision of space for exposure sites.

Conflicts of Interest

The authors declare no conflict of interest.

References

  1. Bergqvist, C.; Herbert, R.; Persson, I.; Greger, M. Plants influence on arsenic availability and speciation in the rhizosphere, roots and shoots of three different vegetables. Environ. Pollut. 2014, 184, 540–546. [Google Scholar] [CrossRef] [PubMed]
  2. Tiwari, K.K.; Singh, N.K.; Rai, U.N. Chromium phytotoxicity in radish (Raphanus sativus): Effects on metabolism and nutrient uptake. Bull. Environ. Contam. Toxicol. 2013, 91, 339–344. [Google Scholar] [CrossRef] [PubMed]
  3. Ahsan, N.; Renaut, J.; Komatsu, S. Recent developments in the application of proteomics to the analysis of plant responses to heavy metals. Proteomics 2009, 9, 2602–2621. [Google Scholar] [CrossRef] [PubMed]
  4. Emamverdian, A.; Ding, Y.; Mokhberdoran, F.; Xie, Y. Heavy metal stress and some mechanisms of plant defense response. Sci. World J. 2015. [Google Scholar] [CrossRef] [PubMed]
  5. Rascio, N.; Navari-Izzo, F. Heavymetal hyperaccumulating plants: How and why do they do it? And what makes them so interesting? Plant Sci. 2011, 180, 169–181. [Google Scholar] [CrossRef] [PubMed]
  6. Lone, M.; He, Z.; Stoffella, P.; Yang, X. Phytoremediation of heavy metal polluted soils and water: Progresses and perspectives. J. Zhejiang Univ. Sci. B 2008, 9, 210–220. [Google Scholar] [CrossRef] [Green Version]
  7. Ali, H.; Khan, E.; Sajad, M.A. Phytoremediation of heavy metals—Concepts and applications. Chemosphere 2013, 91, 869–881. [Google Scholar] [CrossRef]
  8. Myśliwa-Kurdziel, B.; Strzałka, K. Influence of metals on biosynthesis of photosynthetic pigments. In Physiology and Biochemistry of Metal Toxicity and Tolerance in Plants; Prasad, M.N.V., Strzałka, K., Eds.; Springer: Dordrecht, The Netherlands, 2002; pp. 201–227. [Google Scholar] [CrossRef]
  9. Singh, M.; Kumar, J.; Singh, S.; Singh, V.P.; Prasad, S.M.; Singh, M.P.V.V.B. Adaptation strategies of plants against heavy metal toxicity: A short review. Biochem. Pharmacol. 2015, 4, 161. [Google Scholar]
  10. Clijsters, H.; Van Assche, F. Inhibition of photosynthesis by heavy metals. Photosynth. Res. 1985, 7, 31–40. [Google Scholar] [CrossRef]
  11. Lin, Y.L.; Chao, Y.Y.; Huang, W.D.; Kao, C.H. Effect of nitrogen deficiency on antioxidant status and Cd toxicity in rice seedlings. Plant Growth Regul. 2011, 64, 263–273. [Google Scholar] [CrossRef]
  12. Li, F.; Qi, J.; Zhang, G.; Lin, L.; Fang, P.; Ta, A.; Xu, J. Effect of cadmium stress on the growth, antioxidative enzymes and lipid peroxidation in two Kenaf (Hibiscus cannabinus L.) plant seedlings. J. Integr. Agric. 2013, 12, 610–620. [Google Scholar] [CrossRef]
  13. Dagupta, N.; Datt, P.N.; Das, S. Photosynthesis and antioxidative enzyme activities in five Indian mangroves with respect to their adaptability. Acta Physiol. Plant 2010, 33, 803–810. [Google Scholar] [CrossRef]
  14. Vaverkova, M.; Adamcova, D. Heavy metals uptake by select plant species in the landfill area of Stepanovice, Czech Republic. Pol. J. Environ. Stud. 2014, 23, 2265–2269. [Google Scholar] [CrossRef]
  15. Bačeva, K.; Stafilov, T.; Šajn, R.; Tănăselia, C. Moss biomonitoring of air pollution with heavy metals in the vicinity of a ferronickel smelter plant. J. Environ. Sci. Health A 2012, 47, 645–656. [Google Scholar] [CrossRef]
  16. Giordano, S.; Adamo, P.; Spagnuolo, V.; Tretiach, M.; Bargagli, R. Accumulation of airborne trace elements in mosses, lichens and synthetic materials exposed a turban monitoring stations: Towards a harmonisation of the moss-bag technique. Chemosphere 2013, 90, 292–299. [Google Scholar] [CrossRef]
  17. Pajak, M.; Jasik, M. Heavy metal (Zn, Pb, Cd) concentration in soil and moss (Pleurozium schreberii) in the Brynica district, southern Poland. Iforest 2011, 4, 176–180. [Google Scholar] [CrossRef]
  18. Gerdol, R.; Marchesini, R.; Iacumin, P.; Brancaleoni, L. Monitoring temporal trends of air pollution in an urban area using mosses and lichens as biomonitors. Chemosphere 2014, 108, 388–395. [Google Scholar] [CrossRef]
  19. Demková, L.; Bobul’ská, L.; Árvay, J.; Jezný, T.; Ducsay, L. Biomonitoring of heavy metals contamination by mosses and lichens around Slovinky tailing pond (Slovakia). J. Environ. Sci. Health A 2016, 52, 30–36. [Google Scholar] [CrossRef]
  20. Will-Wolf, S.; Jovan, S.; Amacher, M.C. Lichen elemental content bioindicators for air quality in upper Midwest, USA: A model for large-scale monitoring. Ecol. Indic 2017, 78, 253–263. [Google Scholar] [CrossRef] [Green Version]
  21. Budka, A.; Kayzer, D.; Borowiak, K.; Zbierska, J.; Wolna-Maruwka, A.; Schroeter-Zakrzewska, A.; Chlebowska, A. Visible tobacco leaf injury indices as indicators of cumulative tropospheric ozone effect. Arch. Environ. Prot. 2014, 40, 53–65. [Google Scholar] [CrossRef] [Green Version]
  22. Nadgórska-Socha, A.; Kandziora-Ciupa, M.; Ciepał, R.; Barczyk, G. Robinia pseudoacacia and Melandrium album in trace elements biomonitoring and air pollution tolerance index study. Int. J. Environ. Sci. Technol. 2016, 13, 1741–1752. [Google Scholar] [CrossRef] [Green Version]
  23. Liang, J.; Fang, H.L.; Zhang, T.L.; Wang, X.X.; Liu, Y.D. Heavy metal in leaves of twelve plant species from seven different areas in Shanghai, China. Urban For. Urban Green. 2017, 27, 390–398. [Google Scholar] [CrossRef]
  24. Illi, J.C.; Vancetta, T.; Alves, D.D.; Osório, D.M.M.; Bianchin, L.; De Quevedo, D.M.; Juchem, F. Integrated assessment of air pollution by metals and source apportionment using ryegrass (Lolium multiflorum Lam.) in southern Brazil. Environ. Sci. Pollut. Res. 2017, 24, 2790–2803. [Google Scholar] [CrossRef]
  25. Fang, Z.; Lou, L.; Tai, Z.; Wang, Y.; Yang, L.; Hu, Z.; Cai, Q. Comparative study of Cd uptake and tolerance of two Italian ryegrass (Lolium multiflorum) cultivars. PeerJ 2017, 5, e3621. [Google Scholar] [CrossRef] [Green Version]
  26. Borowiak, K.; Zbierska, J.; Barałkiewicz, D.; Hanć, A.; Budka, A.; Kayzer, D.; Kawala, A. Biomonitoring of Air Pollution by Trace Elements Using Italian Ryegrass (Lolium multiflorum L.’Lema’). Pol. J. Environ. Stud. 2014, 23, 681–688. [Google Scholar]
  27. VDI 3957 Part 2. German proposal to grass culture. In Biological Measuring Techniques for the Determination and Evaluation of Effects of Air Pollutants on Plants (Bioindication). Method of Standardised Grass Exposure; Beuth Verlag: Berlin, Germany, 2003. [Google Scholar]
  28. Klumpp, A.; Ansel, W.; Klumpp, G.; Breuer, J.; Vergne, P.; José Sanz, M.; Rasmussen, S.; Ro-Poulsen, H.; Ribas Artola, A.; Peñuelas, J.; et al. Airborne trace element pollution in 11 European cities assessed by exposure of standardised ryegrass cultures. Atmos. Environ. 2009, 43, 329–339. [Google Scholar] [CrossRef]
  29. Alves, D.D.; Osório, D.M.M.; Rodrigues, M.A.S.; Illi, J.C.; Bianchin, L.; Benvenuti, T. Concentrations of PM2. 5-10 and PM2. 5 and metallic elements around the Schmidt Stream area, in the Sinos River Basin, southern Brazil. Braz. J. Biol. 2015, 75, 43–52. [Google Scholar] [CrossRef]
  30. Jasaitis, D.; Vasiliauskienė, V.; Chadyšienė, R.; Pečiulienė, M. Surface ozone concentration and its relationship with UV radiation, meteorological parameters and radon on the eastern coast of the Baltic Sea. Atmosphere 2016, 7, 2. [Google Scholar] [CrossRef] [Green Version]
  31. Singh, A.A.; Agrawal, S.B. Tropospheric ozone pollution in India: Effects on crop yield and product quality. Environ. Sci. Pollut. Res. 2017, 24, 4367–4382. [Google Scholar] [CrossRef]
  32. Muneer, S.; Kim, T.H.; Choi, B.C.; Lee, B.S.; Lee, J.H. Effect of CO, NOx and SO2 on ROS production, photosynthesis and ascorbate–glutathione pathway to induce Fragaria×annasa as a hyperaccumulator. Redox Biol. 2014, 2, 91–98. [Google Scholar] [CrossRef] [Green Version]
  33. Seyyednejad, S.M.; Niknejad, M.; Koochak, H. A review of some different effects of air pollution on plants. Res. J. Environ. Sci. 2011, 5, 302–309. [Google Scholar] [CrossRef]
  34. Liu, Y.J.; Ding, H. Variation in air pollution tolerance index of plants near a steel factory: Implications for landscape-plant species selection for industrial areas. WSEAS Trans. Environ. Dev. 2008, 4, 24–32. [Google Scholar]
  35. Pavlík, M.; Pavlíková, D.; Zemanová, V.; Hnilička, F.; Urbanová, V.; Száková, J. Trace elements present in airborne particulate matter--stressors of plant metabolism. Ecotoxicol. Environ. Saf. 2012, 79, 101–107. [Google Scholar] [CrossRef]
  36. Pérez-Romero, J.A.; Redondo-Gómez, S.; Mateos-Naranjo, E. Growth and photosynthetic limitation analysis of the Cd-accumulator Salicornia ramosissima under excessive cadmium concentrations and optimum salinity conditions. Plant Physiol. Biochem. 2016, 109, 103–113. [Google Scholar] [CrossRef]
  37. Pereira, M.P.; de Almeida Rodriguez, L.C.; Corréa, F.F.; de Castro, E.M.; Ribeiro, V.E.; Pereira, F.J. Cadmium tolerance in Schinus molle trees is modulated by enhanced leaf anatomy and photosynthesis. Trees 2015, 30, 807–814. [Google Scholar] [CrossRef]
  38. Shanying, H.E.; Yang, X.; He, Z.; Baligar, V.C. Morphological and physiological responses of plants to cadmium toxicity: A review. Pedosphere 2017, 27, 421–438. [Google Scholar] [CrossRef]
  39. Tóth, T.; Zsiros, O.; Kis, M.; Garab, G.; Kovács, L. Cadmium exerts its toxic effects on photosynthesis via a cascade mechanism in the cyanobacterium, Synechocystis PCC 6803. Plant Cell Environ. 2016, 35, 2075–2086. [Google Scholar] [CrossRef]
  40. Tran, T.A.; Popova, L.P. Functions and toxicity of cadmium in plants: Recent advances and future prospects. Turk. J. Bot. 2013, 37, 1–13. [Google Scholar] [CrossRef]
  41. Solís-Domínguez, F.A.; González-Chávez, M.Z.; Carrillo-González, R.; Rodriguez-Vázquez, R. Accumulation and localization of cadmium in Echinochloa polystachya grown within a hydroponic system. J. Hazard. Mater. 2007, 141, 630–636. [Google Scholar] [CrossRef]
  42. Chen, L.; Long, X.H.; Zhang, Z.H.; Zheng, X.T.; Rengel, Z.; Liu, Z.P. Cadmium accumulation and translocation in two Jerusalem artichoke (Helianthus tuberosus L.) cultivars. Pedosphere 2001, 21, 573–580. [Google Scholar] [CrossRef]
  43. Perfus-Barbeoch, L.; Leonhardt, N.; Vavasseur, A.; Forestiers, C. Heavy metal toxicity: Cadmium permeates through calcium channels and disturbs the plant water status. Plant J. 2002, 32, 539–548. [Google Scholar] [CrossRef]
  44. Shi, G.R.; Cai, Q.S. Photosynthetic and anatomic responses of peanut leaves to cadmium stress. Photosynthetica 2008, 46, 627–630. [Google Scholar] [CrossRef]
  45. Punshon, T.; Jackson, B.P.; Meharg, A.A.; Warczack, T.; Scheckel, K.; Guerinot, M.L. Understanding arsenic dynamics in agronomic systems to predict and prevent uptake by crop plants. Sci. Total Environ. 2017, 581, 209–220. [Google Scholar] [CrossRef]
  46. Rahman, M.A.; Hasegawa, H.; Rahman, M.M.; Islam, M.N.; Miah, M.A.M.; Tasmen, A. Effect of arsenic on photosynthesis, growth and yield of five widely cultivated rice (Oryza sativa L.) varieties in Bangladesh. Chemosphere 2007, 67, 1072–1079. [Google Scholar] [CrossRef] [Green Version]
  47. Seregin, I.V.; Kozhevnikova, A.D. Physiological role of nickel and its toxic effects on higher plants. Russ. J. Plant Physiol. 2006, 53, 257–277. [Google Scholar] [CrossRef]
  48. Gajewska, E.; Niewiadomska, E.; Tokarz, K.; Słaba, M.; Skłodowska, M. Nickel-induced changes in carbon metabolism in wheat shoots. J. Plant Physiol. 2013, 170, 369–377. [Google Scholar] [CrossRef]
  49. Velikova, V.; Tsonev, T.; Loreto, F.; Centritto, M. Changes in photosynthesis, mesophyll conductance to CO2, and isoprenoid emissions in Poplar nigra plants exposed to excess nickel. Environ. Pollut. 2011, 159, 1058–1066. [Google Scholar] [CrossRef]
  50. Papazoglou, E.G.; Karantounias, G.A.; Vemmos, S.N.; Bouranis, D.L. Photosynthesis and growth responses of giant reed (Arundo donax L.) to the heavy metals Cd an Ni. Environ. Int. 2005, 31, 243–249. [Google Scholar] [CrossRef]
  51. Vernay, P.; Gauthier-Moussard, C.; Hitmi, A. Interaction of bioaccumulation of heavy metal chromium with water relation, mineral nutrition and photosynthesis n developed leaves of Lolium perenne L. Chemosphere 2007, 68, 1563–1575. [Google Scholar] [CrossRef]
  52. Rodriguez, E.; Santos, C.; Azevedo, R.; Moutnho-Pereira, J.; Correia, C. Chromium (VI) induces toxicity at different photosynthetic levels in pea. Plant Physiol. Biochem. 2012, 53, 94–100. [Google Scholar] [CrossRef]
  53. Dhir, B.; Sharmila, P.; Saradhi, P.P. Photosynthetic performance of Salvinia natans exposed to chromium and zinc rich wastewater. Braz. J. Plant Physiol. 2008, 20, 61–70. [Google Scholar] [CrossRef]
  54. Vernay, P.; Gauthier-Moussard, C.; Jean, L.; Bordas, F.; Faure, O.; Ledoigt, G.; Hitmi, A. Effect of chromium species on phytochemical and physiological parameters in Datura innoxia. Chemosphere 2008, 72, 763–771. [Google Scholar] [CrossRef]
  55. Leal-Alvarado, D.A.; Espadas-Gil, F.; Sáenz-Carbonell, L.; Talavera-May, C.; Santamaria, J.M. Lead accumulation reduces photosynthesis in the lead hyper-accumulator Salvinia minima Baker by affecting the cell membrane and inducing stomatal closure. Aquat. Toxicol. 2016, 171, 37–47. [Google Scholar] [CrossRef]
Figure 1. Location of exposure sites. Source: own study based on data from National Geodetic and Cartographic Resource.
Processes 08 01013 g001
Figure 2. Net photosynthesis rate (PN) of L. multiflorum measured at control and exposure sites during four series. Vertical bars represent standard errors; different letters denote significance difference at level α ≤ 0.05 between all treatments within each series.
Processes 08 01013 g002
Figure 3. Stomatal conductance (gs) of L. multiflorum measured at control and exposure sites during four series. Vertical bars represent standard errors; different letters denote significance difference at level α ≤ 0.05 between all treatments within each series.
Processes 08 01013 g003
Figure 4. Intercellular CO2 concentration (Ci) of L. multiflorum measured at control and exposure sites during four series. Vertical bars represent standard errors; different letters denote significance difference at level α ≤ 0.05 between all treatments within each series.
Processes 08 01013 g004
Figure 5. Principal component analysis of photosynthetic activity parameters and trace elements concentrations (arrows) and samples from each exposure sites (points) in four exposure series (AD, respectively). Ellipses represent the confidence intervals of points.
Processes 08 01013 g005
Figure 6. Matrix of correlations between photosynthesis activity parameters, trace elements accumulations, meteorological parameters, and other air pollutants.
Processes 08 01013 g006
Table 1. One-way ANOVA results (F statistics) of element accumulation in leaves at six sites (including control). The site is an influencing factor. *** statistically significant at level α ≤ 0.001.
Parameter1st Series2nd Series3rd Series4th Series
Cr75.80 ***123.90 ***60.49 ***98.96 ***
Ni15.87 ***15.23 ***31.26 ***117.97 ***
As6.80 ***428.58 ***68.45 ***12.62 ***
Cd16.68 ***22.74 ***14.70 ***348.14 ***
Pb15.16 ***325.14 ***76.00 ***35.88 ***
Table 2. Trace elements concentrations (means ± SD, n = 5) in L. multiflorum leaves measured after four exposure at exposure and control sites.
SeriesSiteCr
(µg g−1)
Ni
(µg g−1)
As
(µg g−1)
Cd
(µg g−1)
Pb
(µg g−1)
1–4

1
1 (control)0.233 ± 0.0250.690 ± 0.0350.018 ± 0.0060.093 ± 0.0010.000 ± 0.000
21.581 ± 0.0721.932 ± 0.0670.295 ± 0.0510.156 ± 0.0210.342 ± 0.029
31.570 ± 0.0831.881 ± 0.0740.519 ± 0.0110.224 ± 0.0400.304 ± 0.014
41.723 ± 0.0672.035 ± 0.0710.425 ± 0.0110.149 ± 0.0160.388 ± 0.028
51.879 ± 0.3501.742 ± 0.2460.268 ± 0.0130.162 ± 0.0160.396 ± 0.013
61.520 ± 0.0861.796 ± 0.3210.376 ± 0.0070.248 ± 0.0260.481 ± 0.017
222.876 ± 0.2621.493 ± 0.2350.069 ± 0.0060.190 ± 0.0040.883 ± 0.066
32.114 ± 0.1011.468 ± 0.0810.031 ± 0.0070.312 ± 0.0121.086 ± 0.176
42.204 ± 0.2191.437 ± 0.1010.533 ± 0.0060.128 ± 0.0090.275 ± 0.020
52.049 ± 0.0681.254 ± 0.0400.088 ± 0.0060.111 ± 0.0110.322 ± 0.020
62.508 ± 0.2271.594 ± 0.2060.049 ± 0.0010.119 ± 0.0170.164 ± 0.022
322.872 ± 0.2181.923 ± 0.0830.044 ± 0.0040.285 ± 0.0210.234 ± 0.027
33.384 ± 0.1592.255 ± 0.1000.036 ± 0.0050.347 ± 0.0060.210 ± 0.031
44.469 ± 0.8582.222 ± 0.6030.225 ± 0.0160.322 ± 0.0160.167 ± 0.020
51.829 ± 0.1331.205 ± 0.0500.041 ± 0.0040.122 ± 0.0060.038 ± 0.018
63.168 ± 0.3821.955 ± 0.1160.046 ± 0.0070.225 ± 0.0230.106 ± 0.002
422.512 ± 0.1171.762 ± 0.0570.053 ± 0.0090.381 ± 0.0440.632 ± 0.082
32.368 ± 0.1591.587 ± 0.0630.061 ± 0.0030.413 ± 0.0860.181 ± 0.022
41.921 ± 0.2231.397 ± 0.1050.100 ± 0.0110.173 ± 0.0100.028 ± 0.002
51.768 ± 0.1451.416 ± 0.1520.041 ± 0.0130.215 ± 0.0240.069 ± 0.009
62.373 ± 0.1021.718 ± 0.0610.066 ± 0.0110.195 ± 0.0140.673 ± 0.064
Table 3. Mean values of meteorological parameters (temperature, air humidity, and ultraviolet B (UVB) radiation) and the sum of precipitation for series.
SeriesTemperature (°C)Air Humidity (%)UVB Radiation (W·m2)PrecipitationSum (mm)
16.05–12.0617.6764.97246.1910
13.06–10.0718.2076.34103.8986
11.07–07.0817.0081.00171.72155
08.08–04.0916.0078.25181.3643
Means17.0076.62173.92294 (sum)
Table 4. Two-way ANOVA results of photosynthetic activity parameters measured before, in the middle, and after exposure in four series and six sites (including control). F statistics of the interaction of site and term of measurement within the series. *** statistically significant at level α ≤ 0.001, ** statistically significant at level α ≤ 0.01, ns—not significant.
Parameter1st Series2nd Series3rd Series4th Series
PN8.331 ***7.393 ***8.208 ***16.633 ***
gs1.225 ns66.845 ***6.083 ***1.387 ns
Ci1.542 ns3.327 **10.649 ***12.788 ns

