Article

Mechanism of Permeability and Oil Recovery during Fracturing in Tight Oil Reservoirs

1
MOE Key Laboratory for Enhanced Oil and Gas Recovery, Northeast Petroleum University, Daqing 163318, China
2
No. 6 oil production plant of Daqing Oilfield, PetroChina, Daqing 163000, China
3
School of Science, Zhejiang University, Hangzhou 310000, China
*
Author to whom correspondence should be addressed.
Processes 2020, 8(8), 972; https://doi.org/10.3390/pr8080972
Submission received: 10 July 2020 / Revised: 27 July 2020 / Accepted: 4 August 2020 / Published: 12 August 2020
(This article belongs to the Section Chemical Processes and Systems)

Abstract

:
In this study, the effect of fracturing fluid on the permeability of tight oil reservoirs is analyzed through oil absorption. The mechanism of permeation and absorption in tight oil reservoirs was studied using the molecular dynamics simulation of fluid flow through fractures in porous media containing crude oil. The influence of surfactants on the adsorption characteristics of crude oil formations on rock walls was also examined. The research results show that the introduction of the appropriate surfactant to the fracturing fluid could accelerate the rate of percolation and recovery as well as improve the recovery rate of absorption. The optimal concentration of polyoxyethylene octyl phenol ether-10 (OP-10) surfactant in the fracturing fluid was 0.9%. When the percolation reached a certain stage, the capillary forces in the crude oil and percolation medium in the pore stabilized; accordingly, the crude oil from the pore roar should be discharged at the earliest. The fluid flow through the fracture effectively carries the oil seeping out near the fractured wall to avoid the stability of the seepage and absorption systems. The surfactant can change the rock absorbability for crude oil, the result of which is that the percolating liquid can adsorb on the rock wall, thus improving the discharge of crude oil. The results of this study are anticipated to significantly contribute to the advancement of oil and gas recovery from tight oil reservoirs.

1. Introduction

For tight reservoirs, fracturing is one of the most effective stimulation methods to improve oil recovery and increase oil and gas production. Combined with mass volume fracturing and permeability absorption, the production of tight oil can be greatly increased. The process of infiltration and absorption is the exchange of oil, water and gas between the formation matrix and the fractures. In a hydrophilic reservoir, water will enter the matrix blocks through the smaller holes, the suction water will displace the crude oil from the matrix blocks through the larger holes in the low-permeability matrix blocks, and the displacement of the oil in the fractures will be compensated for by the injected water. Due to capillary absorption, water can displace more crude oil from the matrix block into the fracture system.
In 2004, Algharbi [1] proposed a dynamic capillary self-imbibition model. However, the capillary structure in porous media is complex, so it could not be used in the calculation of permeability and absorption. As the wettability of rock in the process of infiltration and absorption has a great influence on the effect of infiltration and absorption, Mason et al. [2,3] improved the theoretical model of self-absorption based on rock wettability and pore characteristics. Smirnov et al. [4,5,6,7] studied the self-imbibition mechanism under different wettability conditions and confirmed that crude oil viscosity has a greater influence on oil production through oil absorption, but they could not describe the specific characteristics of oil and water distribution and oil absorption during the oil absorption process. M.A. Fern et al. [8,9,10,11,12] used nuclear magnetic resonance imaging (MRI) to monitor the self-absorption process of the rock, studied the evolution process of percolation and oil recovery in core samples and found that reverse percolation and absorption only occurred in the first time [13]. Chapman [14] studied the influence of pore shape and throat width on fluid displacement through a microetching model and observed the distribution characteristics of oil and water in pores in the process of infiltration and absorption. However, the microetching model and the nuclear magnetic technology could only study the mechanism of percolation and absorption; hence, the variation characteristics of percolation and absorption could not be quantitatively described.
Consequently, the evaluation of the permeability absorption effect could only be measured using a conventional permeability absorption detector. O. Pitois et al. [15,16,17,18,19] obtained formation parameters, interfacial tension, viscosity of different fracturing fluids and self-priming rules through self-priming experiments. The permeability and oil recovery greatly affected the mechanical properties of the rock. Self-absorption of oil improved the strength of rock, while hydroscopicity reduced it [20,21]. Yang [22] proposed the initial expansion rate, later expansion rate and expansion capacity to describe expansion characteristics. Li [23] introduced the concept of modal parameters to describe the competitive relationship between capillary forces and viscous forces in the infiltration process. Ahmadi [24] believed that the recovery rate of naturally fractured carbonate reservoirs was affected by wettability and developed SDS and C12TAB surfactants to change the wettability of carbonate reservoirs. For percolation and recovery of tight oil, the fracture characteristics exhibited a major influence on the permeability and absorption development effects. Haugen [25,26,27,28,29] et al. established a coupling model of water movement in fractures through the study of porous media and fractures. In subsequent studies, Paiaman [30] and Amadu [31] both considered the influence of the interfacial tension between gravity and oil and of water on permeability and absorption through theoretical studies. When water and surfactant solutions entered the shale during hydraulic fracturing, the flow entered the formation under the action of capillary force, causing the loss of fracturing fluid [32].
On the whole, there are few theoretical studies on oil absorption through tight oil reservoirs, and it is believed that oil absorption is influenced by the interfacial tension between oil and water, the viscosity of crude oil, the capillary force of fluids in porous media and the fracture system. Because of the slow permeability and absorption, the oil adsorption on the rock surface also has a major influence on the permeability and absorption effect. Adsorption is the phenomenon when one or more components of the fluid accumulate on the solid surface when the fluid is in contact with a porous solid. Therefore, the original fluid (oil) in the porous medium will be adsorbed on the rock surface before the external percolating medium enters the porous medium, and the inflow of foreign fluid will change the original adsorption state, rendering the crude oil more easily percolatable and extractable. Hence, it is of great significance to study the adsorption characteristics of formation fluids on rock surfaces through molecular simulation.
Currently, nuclear MRI or measurement using a conventional imbibition meter is generally utilized to study spontaneous imbibition. However, nuclear MRI cannot accurately describe the change in the infiltration rate of the entire core sample. Moreover, the measurement accuracy of conventional absorptiometry is insufficient. Therefore, based on the characteristics and drainage of the oil absorption paper, the effects of surfactant content on the permeability and absorption of a guanidine rubber fracturing fluid system was more rigorously studied. This research measures the change in permeability and absorption rate. It also studies the effect of surfactant content in the guanidine rubber fracturing fluid system as well as the effect of fluid flow on the permeation and absorption at the fracture wall. Finally, the effects of different surfactants on the adsorption characteristics of crude oil were studied using the molecular dynamics method, the stripping effect of surfactants on crude oil components was studied from a molecular interaction perspective, and the mechanism of percolation and recovery in tight horizontal wells was further analyzed. The results of this study are expected to contribute significantly to the improvement of oil and gas recovery from tight oil reservoirs.

2. Materials and Methods

2.1. Experimental Materials

In this study, crude oil mixed with kerosene (viscosity: 3 mPa·s) was used as the experimental oil; the experimental temperature was 50 °C, and the percolating liquid was guanidine fracturing fluid filtrate and formation water with a salinity of 6700 ppm. The formula of the experimental fracturing fluid is summarized in Table 1.

2.2. Experimental Methods and Procedures

To date, either nuclear MRI or a conventional osmometer is generally used for spontaneous osmotic absorption experiments. Nuclear MRI technology offers very high-resolution imaging at the microscopic level and is generally used to study the distribution characteristics of the remaining oil in pore roar channels inside rocks. However, it is not possible to accurately describe the entire permeability process and absorption velocity of the core sample, and the measurement accuracy of conventional absorptiometry is insufficient. In the later stages, only part of the oil film seeps out due to the low tight core porosity permeability, low oil saturation, slow permeability and low absorption rate, hence requiring a higher test accuracy. Accordingly, in this study, to determine the effect of different surfactant contents of the fracturing fluid on the imbibition rate, the oil absorption capacity was measured using oil absorption paper. The oil absorption and drainage characteristics of this paper are shown in Figure 1.
The oil absorption paper was composed of modified polypropylene that can absorb oil and non-water-based elements. According to the oil and water absorption characteristics of the oil absorption paper, as well as the fracture development process and absorption in tight horizontal wells, the following specific experimental steps were implemented.
(1)
Fracturing fluids with different surfactant concentrations were filtered to obtain the fracturing fluid filtrate after gel breaking;
(2)
After the saturated formation, water was evacuated from the core and the fracturing fluid filtrate was displaced, simulating the invasion of fracturing fluid;
(3)
The displacement of oil was used to simulate the oil permeation and absorption in the core, after fracturing in the deep formation. Considering the low permeability and long measurement time, the jars were sealed after each set of measurements to prevent the volatilization of crude oil and fracturing fluids;
(4)
During the measurements, the quality of the oil absorbent paper was first assessed and the quantity of oil absorbed was thereafter determined based on the paper’s characteristics;
(5)
The amounts of oil absorbed by different percolating and absorbing media at different periods were recorded and changes in the percolating and absorbing speeds as well as the recovery efficiency were calculated.

3. Results

This section is divided into three subsections and provides a concise description of the experimental results, their interpretation and the experimental conclusions that can be drawn.

3.1. Variation in Permeability Characteristics and Absorption Rate of Fracturing Fluid System

Based on the experimental scheme, the effect of the fracturing fluid system on permeability and absorption rate was determined. The core permeability, absorption process and oil absorption effect of the paper during the permeability and absorption experiments are shown in Figure 2.
It can be seen that during the percolation process, small crude oil droplets were formed. Some of the oil droplets adsorbed on the rock surface, whereas the others desorbed from the core and rose to the surface due to gravity and buoyancy. When an oil absorption paper was utilized to collect crude oil at the liquid level, no residual water was observed on the paper surface, demonstrating that better experimental results had been achieved. The recovery rate and permeability of the core under different percolation and absorption liquid systems were further measured, as shown in Figure 3 and Figure 4.
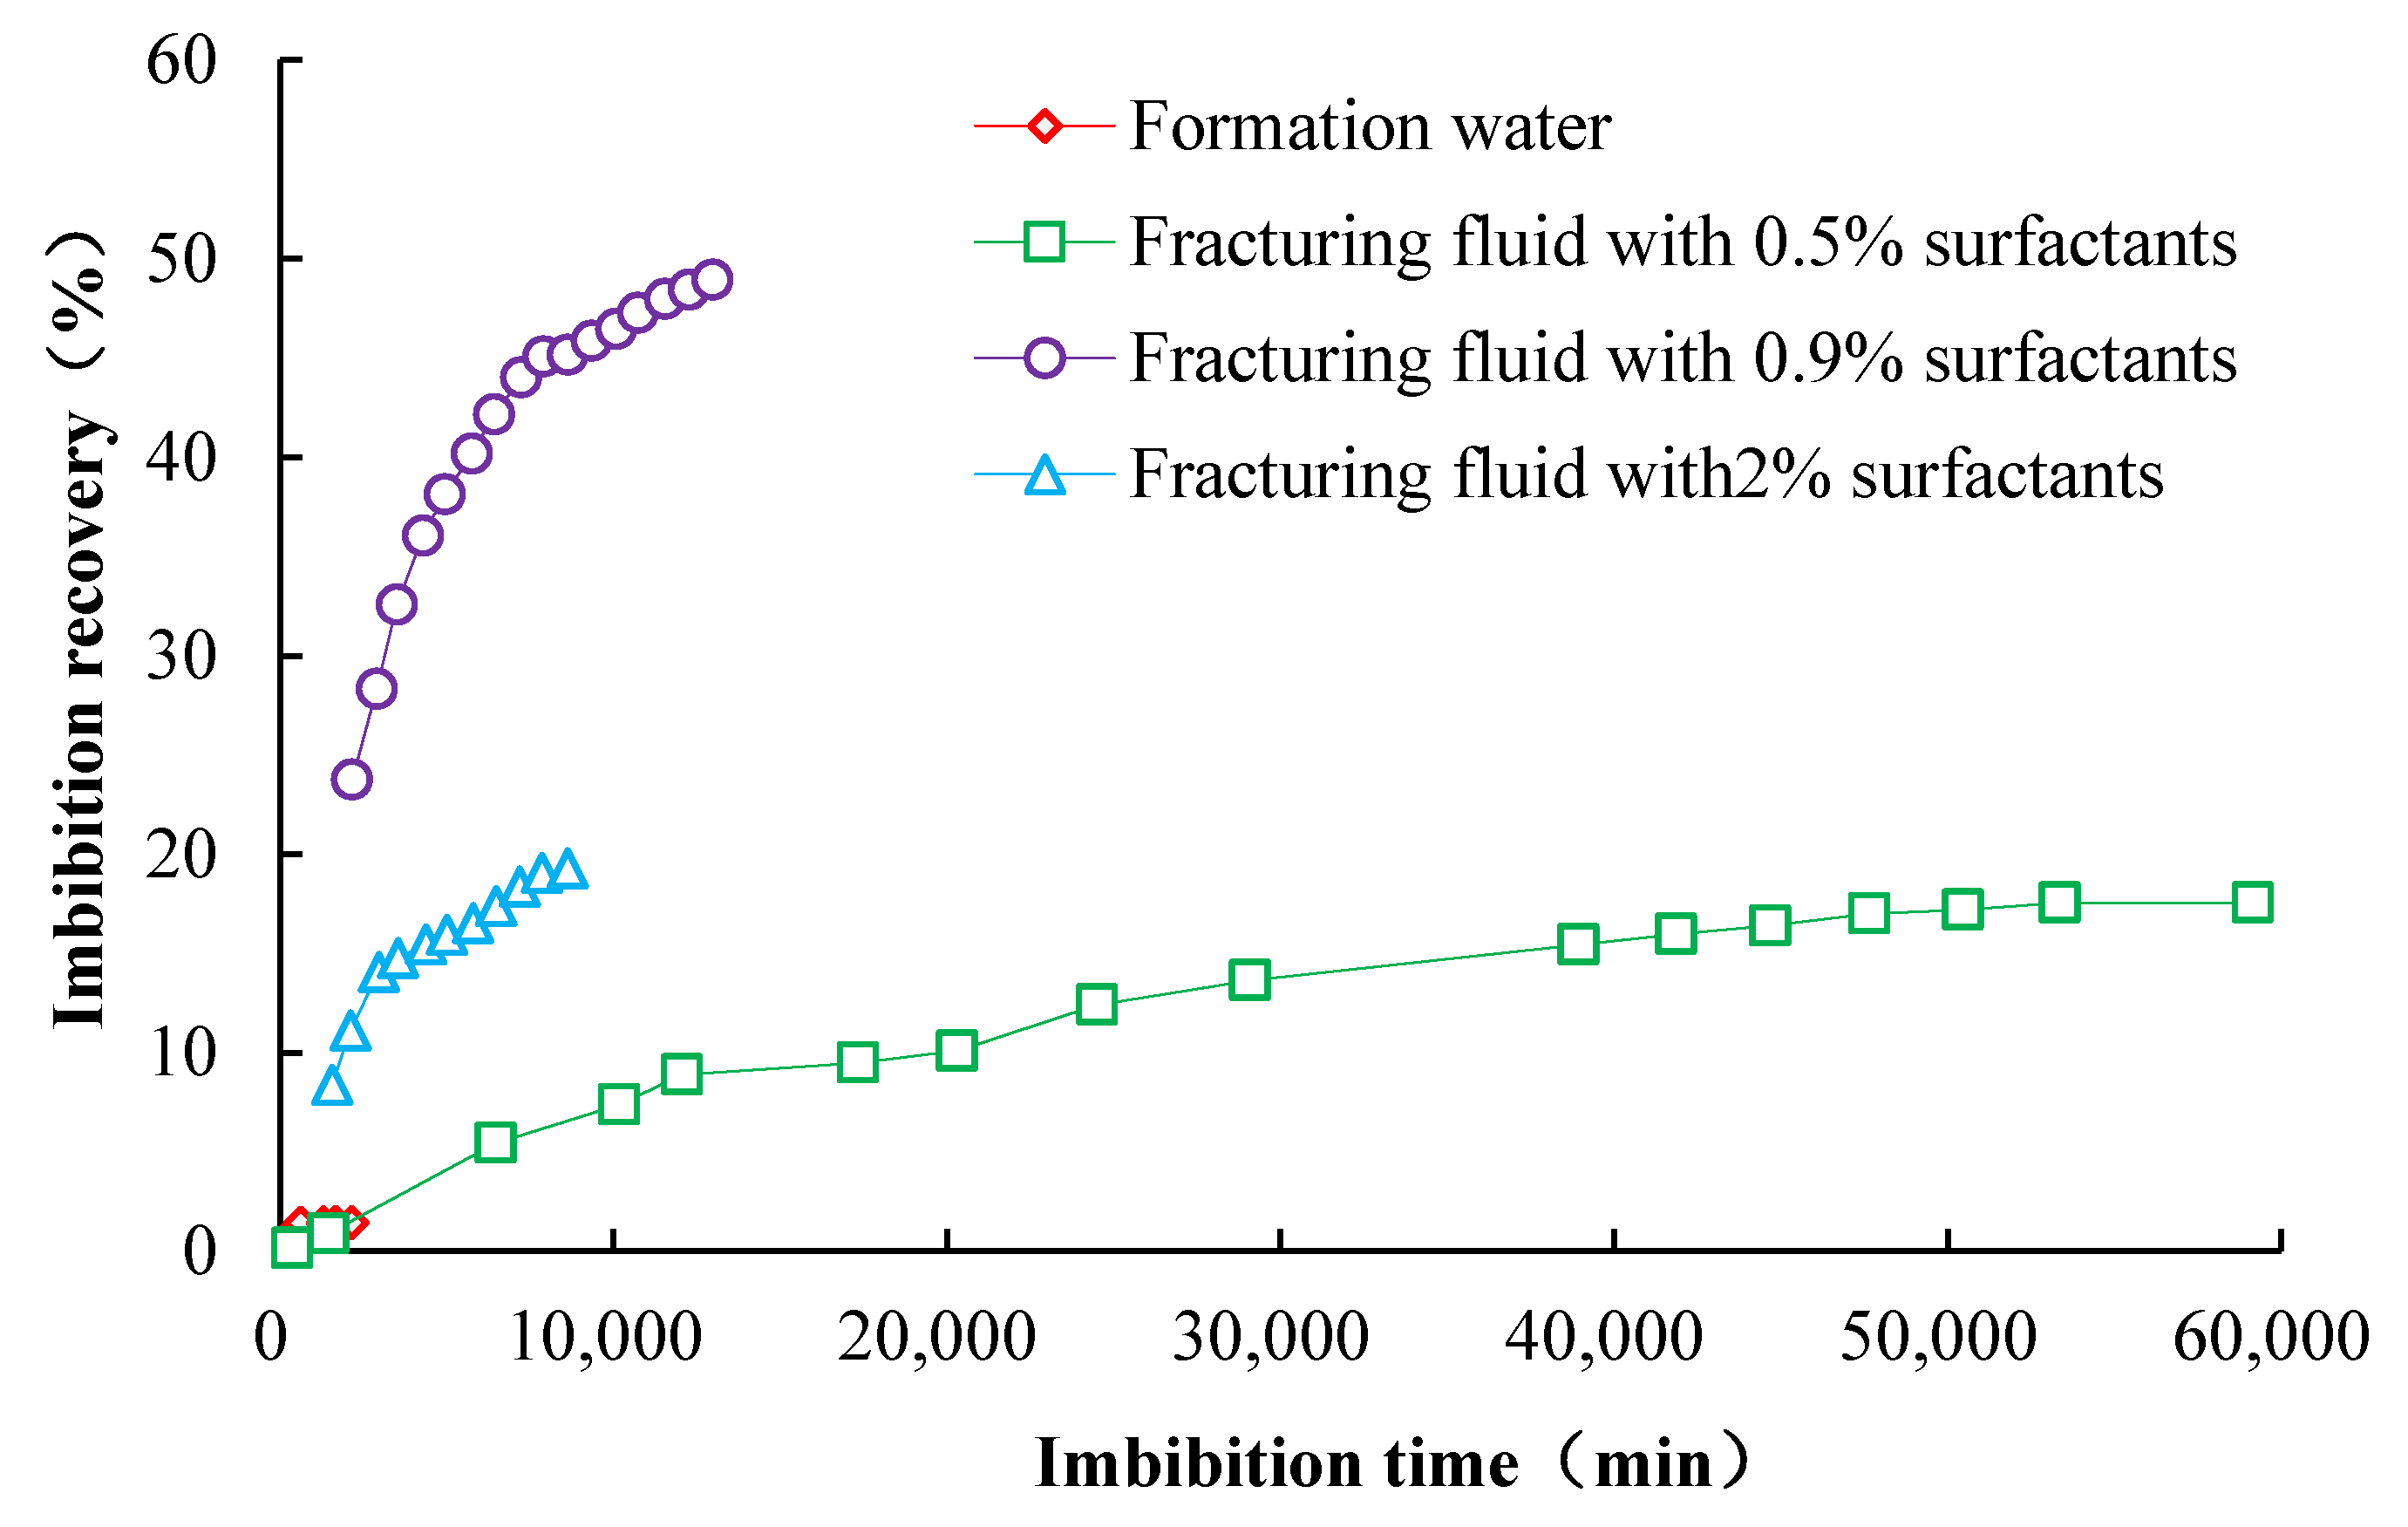
Figure 3 shows that the addition of a certain amount of surfactant to the fracturing fluid enabled the relatively rapid development and ultimate recovery of percolation and absorption, as follows: fracturing fluid with 0.9% surfactant > fracturing fluid with 2% surfactant > fracturing fluid with 0.5% surfactant > formation water. The degree of enhancement afforded by the formation of water to the core’s permeability and absorption capacity was less than that provided by the fracturing fluid with surfactant. This suggests that the development effect of the former was weak. By comparing the studies of Yang (3000-min infiltration time) and M.A. Fern (1668 min infiltration time), it was found that adding an op-10 surfactant could effectively extend the infiltration time. Therefore, a certain amount of surfactant must be used to enhance the infiltration and absorption effect of the core for the pervious and oil recovery in tight reservoirs.
Figure 4 shows that with the increase in permeability and absorption time, the infiltration and absorption velocity sharply dropped and stabilized at approximately 10,000 min. However, the percolation and absorption rates with formation water dropped to zero over a short period, indicating that the percolation and absorption system had reached stability. Consequently, the surfactants aided in increasing the absorption rate and prolonging the stabilization time of the absorption system. When the surfactant concentration in the fracturing fluid was 0.5%, the infiltration time was longer (i.e., the infiltration rate was slow)—up to 60,000 min—that was much higher than that of other groups. The analysis showed that percolation and absorption were slow when low-concentration surfactants were used; nevertheless, these processes continued until the system stabilized. Therefore, for permeability oil absorption, the stabilization time of the absorption system could be prolonged by adding an appropriate amount of surfactant. In addition, when the surfactant concentration was 0.5% and the infiltration time was 20,000–60,000 min, the infiltration rate is very low, but still exhibited a gradually decreasing trend, demonstrating that the infiltration and oil recovery would exhibit an exponential decline before the infiltration and absorption system reached stability.
Based on the list in Table 2, the surfactant content in the absorbent medium considerably influenced the interfacial tension between oil and water as well as the contact angle between the core and absorbent medium. As the surfactant content in the fracturing fluid increased, the interfacial tension and contact angle gradually decreased to a minimum of 6.24°. The percolation medium also considerably influenced percolation recovery. The surfactant in the absorbent medium reduced the interfacial tension between oil and water; in turn, the lower interfacial tension reduced the seepage resistance of crude oil in the porous medium. Moreover, the large oil droplets were dispersed as smaller droplets, thus facilitating their passage through the fine rock pores. The contact angle between the core and percolation medium indicated the adsorption characteristics of the pore wall. The contact angle decreased with increasing surfactant content in the porous media, indicating that increasing amounts of surfactant in the fracturing fluid promoted the stripping of crude oil from the rock wall. However, the percolation recovery rate did not increase with the surfactant content in the fracturing fluid. As the concentration of surfactant OP-10 first increased and then decreased, the maximum perspiration-recovery rate was 48.93%, i.e., similar to Wang’s study (where the perspiration-recovery rate was 40%). Based on Figure 3 and Figure 4, the recovery rate of infiltration was affected by the duration and velocity of infiltration. When the surfactant concentration was extremely high, the absorption system prematurely stabilized, reducing the absorption time. Therefore, an optimal surfactant concentration is necessary to maximize the absorption rate and stabilization time.

3.2. Carrying Effect of Fluid Flow with Crude Oil Particles through Pores

Percolation stops when the system reaches equilibrium. The capillary force in the pores is the main driving force of crude oil in porous media (Figure 5a). When the capillary force of oil droplets in the pores reaches equilibrium, the driving force of permeation and absorption is zero and both permeation and absorption stop (Figure 5b).
Therefore, to increase the absorption time, the oil droplets should be discharged at the earliest to avoid the capillary force balance, which can change the fluid flow condition through the fracture. The oil droplets should be produced immediately upon permeation and suction. The fluid flow through the fracture can be expressed as follows:
ρ u t + ρ ( u ) u = [ p I + μ ( μ + ( μ ) T ] + F + ρ g
where ρ is the density of fluid passing through the crack (kg/m3); u is the flow rate of fracture fluid (m/s); t is dimensionless time; pI is the pressure of the fluid passing through the fracture (Pa); μ is the viscosity of fluid passing through the fracture (Pa·s); F is the force per unit volume of fluid (N/m3); T is the temperature (K):
ρ ( u ) = 0
As fluid flows through the fracture, crude oil droplets are formed by the drag force acting on the fluid:
F D = 1 τ P m P ( u v )
where FD is the fluid carrying force acting on the oil droplets (N) and v is the flow rate of the fracturing fluid through the fracture (m/s). The droplet velocity response time, τp (m/s), is given by:
τ P = ρ P d P 2 18 μ
where dP is the oil droplet diameter (m) and ρp is the oil droplet density (kg/m3).
Using COMSOL software, the influence of fluid flow through the wall fracture on the fluid in the pores is shown (Figure 6); the red and blue phases represent oil and water, respectively.
It can be seen that the fluid in the fracture carried the stable oil in the pore roar duct near the fracture wall during the flow process. Only the crude oil near the fracture wall was carried because of the small size of the pore roar channel. The results show that the combination of permeability fracturing and stimulation may be used to increase the fluid flow frequency and velocity in tight oil reservoirs.
As a result of dispersion, the crude oil can easily seep out as small droplets, thus increasing the rate and degree of seepage and recovery. By contrast, small crude oil particles can be extracted under the traction force action to avoid the capillary force balance in the pore duct, thus prolonging the permeation and absorption time (Figure 7).

3.3. Influence of Surfactant on Rock Adsorption Characteristics during Infiltration Process

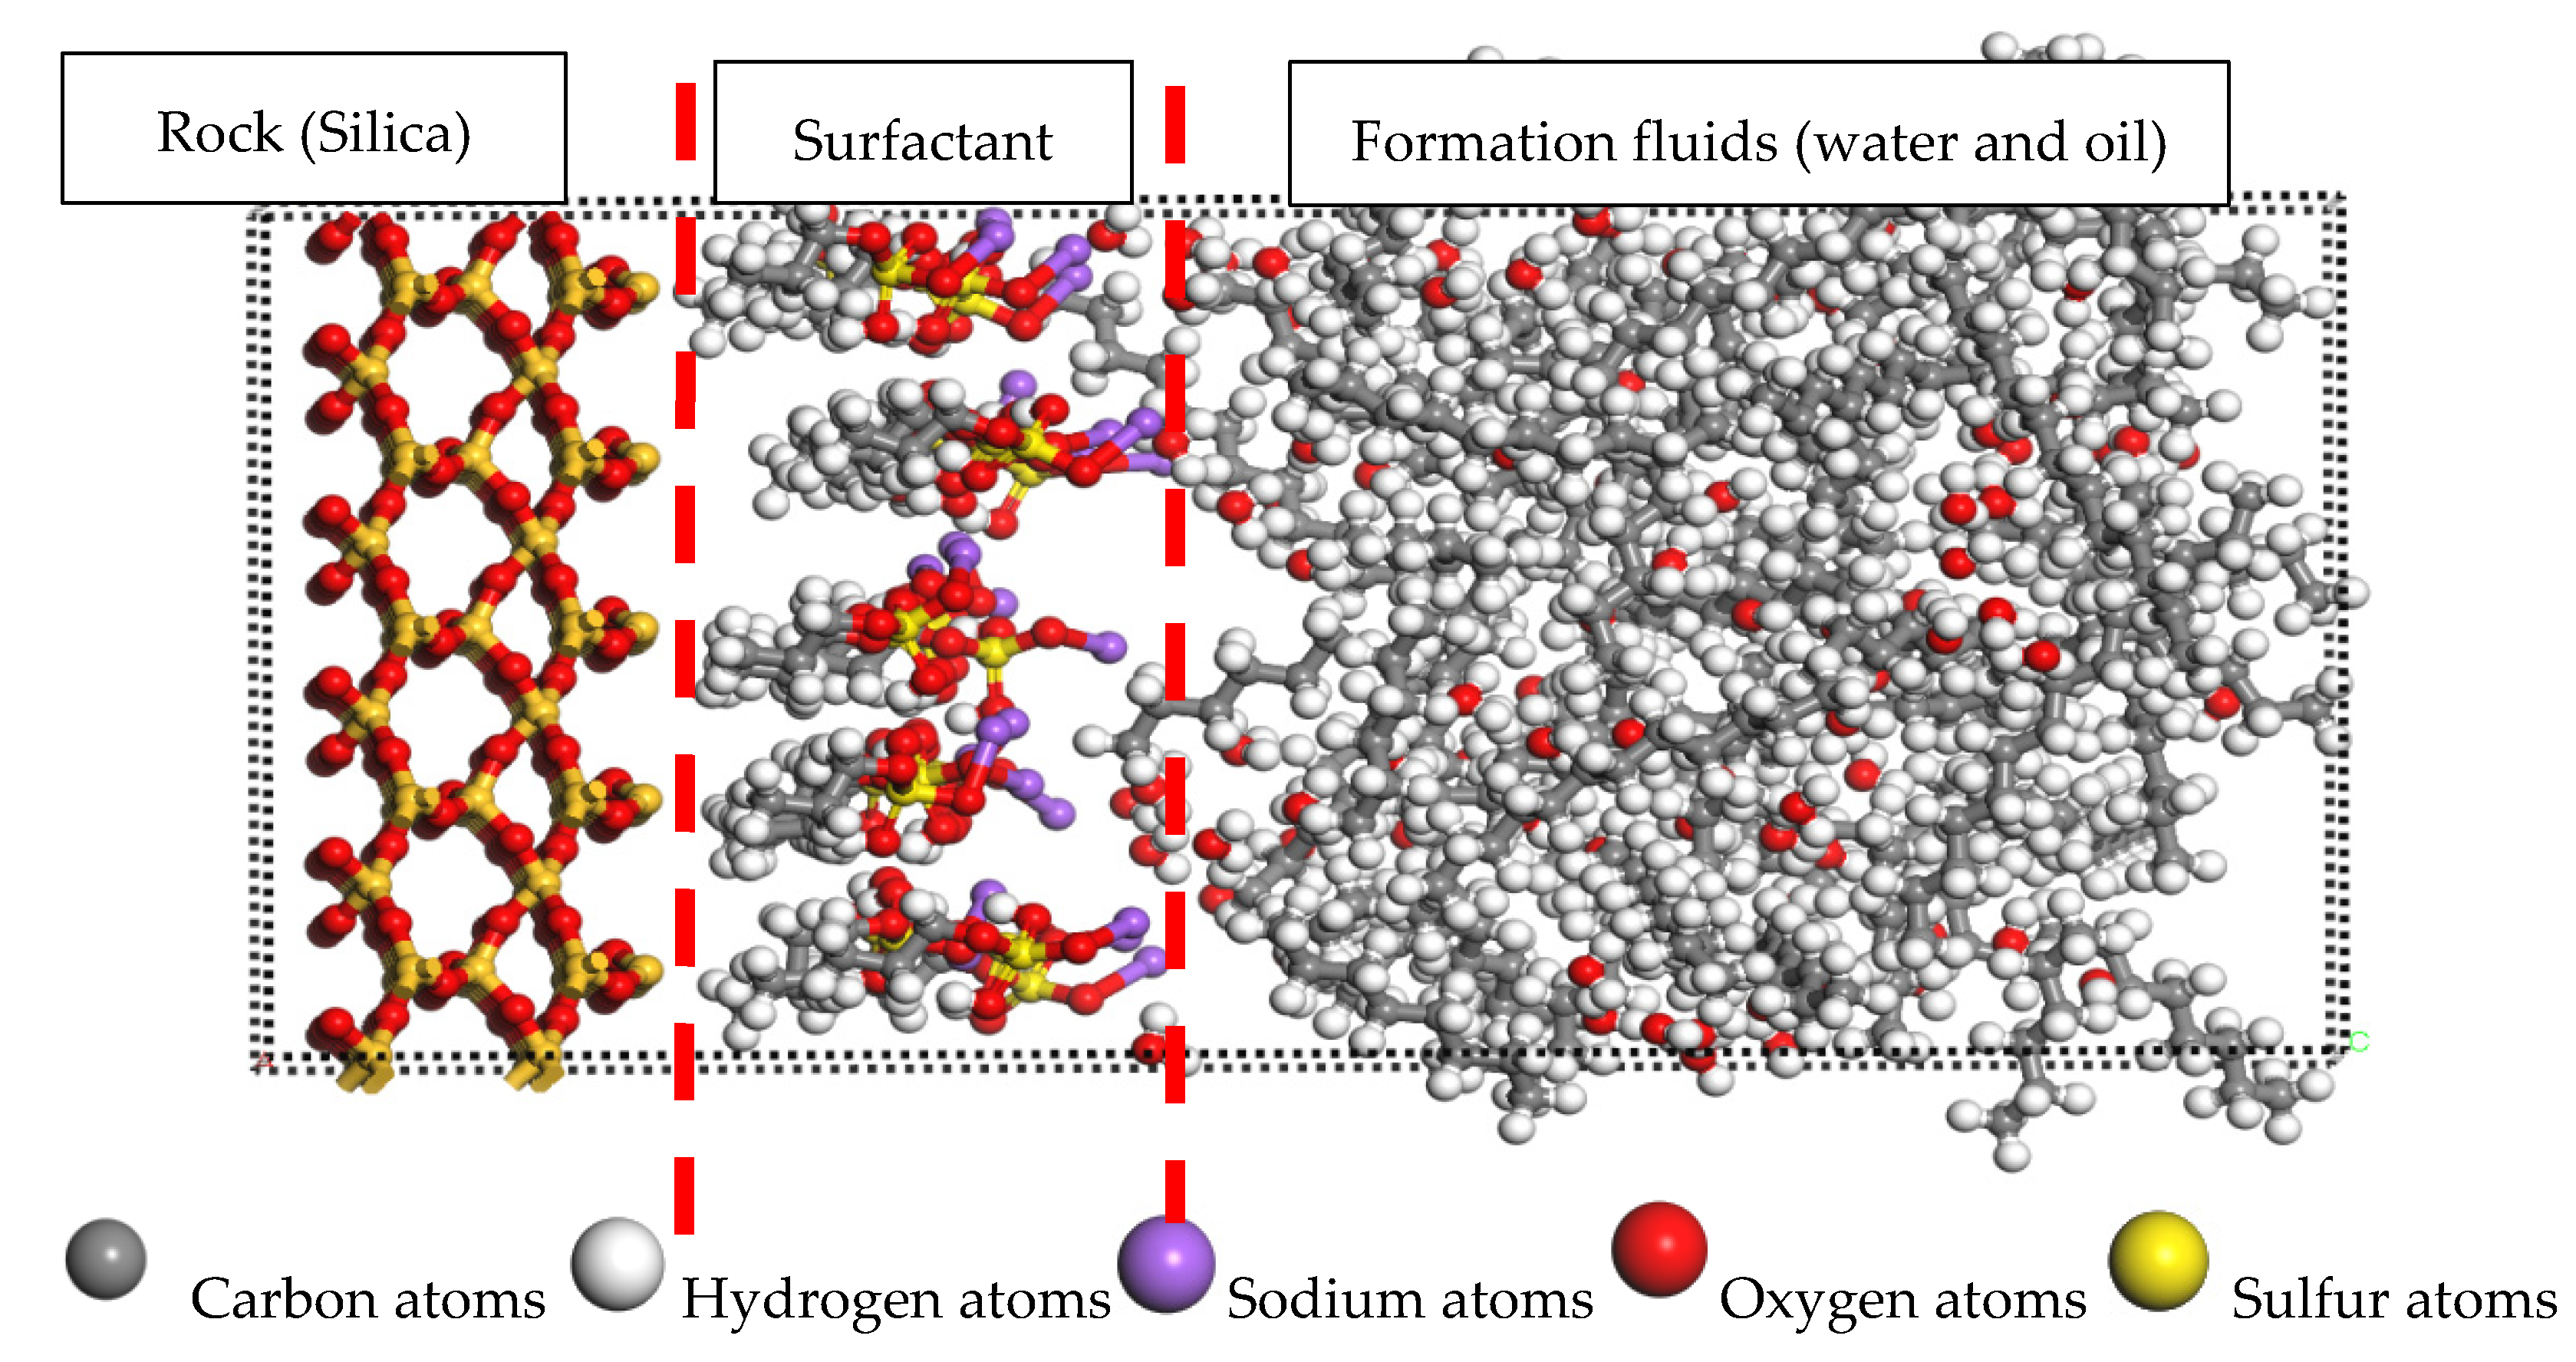
Rock has strong lipophilic properties under primitive conditions. In such cases, the irregular movement of crude oil tends to cause the oil to percolate. However, once per foreign fluid enters the pore growth and disrupts the original balance, the oil-wet property of rock gradually changes to water-wet. At this point, the permeability and absorption are enhanced. Moreover, the introduction of surfactants can further change the hydrophilic properties of the rock surface. At the same time, surfactants can promote the separation of crude oil components from rock walls under the action of intermolecular forces. Therefore, molecular simulation is necessary to study the influence of surfactants on the adsorption characteristics of rocks. To study the influence of surfactant molecules on the adsorption characteristics of formation fluids on rock walls during infiltration and absorption, a molecular model was formulated using Material Studio software, as shown in Figure 8.
Formation fluids include crude oil and water, with C6–14 representing the crude oil component. The structure of the initial model was optimized using a compass force field through rock adsorption, and the polymer consistent force field was used to simulate the interlayer structure. The simulated temperature was 355 K, the truncation radius was set to 12.5 Å, and the simulated NVT was used in fully mechanized mining mode. To determine the effects of non-surfactant, anionic surfactant sodium dodecyl benzenesulfonate (SDBS), cationic surfactant dodecyl trimethyl ammonium bromide (DTAB) and nonionic surfactant polyoxyethylene octyl phenol ether-10 (OP-10) on the molecular adsorption of formation fluids on rock walls, the density distributions of formation fluids at different positions from the rock wall under different conditions are shown in Figure 9.
In Figure 9, the X-axis is the distance from the silica rock wall and the Y-axis is the density distribution of different fluids in the formation. Figure further suggests that the degree of adsorption on the rock wall surface with different percolating liquid systems considerably differs. When no surfactant was added, the oil strongly adsorbed on the silica surface; under the action of water, the density of crude oil first increased, then decreased and finally increased with the distance from the rock wall. Permeation and absorption were achieved by the interaction between the capillary forces of oil and water. Consequently, without the addition of surfactant, percolation and absorption drove only the oil droplets away from the rock wall, whereas the oil droplets adsorbed on the rock wall could not be percolated and absorbed. However, after the incorporation of different surfactants, the rock adsorption characteristics considerably changed. After the addition of the SDBS surfactant, the density difference between oil and water located 0–150 Å away from the rock surface was insignificant. In the range 150–200 Å from the rock surface, some of the crude oil components exhibited a high peak value. When the DTAB surfactant was added, the density of crude oil at a distance of 0–50 Å above the rock surface significantly decreased, indicating that the adsorption capacity of rock for crude oil had significantly decreased. Moreover, the density of crude oil molecules was higher at a distance 100–150 Å from the rock surface, indicating that the crude oil content at this location was also higher. The increase of the crude oil content meant that the DTAB surfactant could promote the separation of crude oil on the surface of the rock, which was conducive to the percolation, absorption and drainage of oil. Furthermore, when the OP-10 surfactant was added, the adsorption characteristics of the silica rock wall considerably changed. The adsorption tendency of water on the rock was greater than that of oil. The wettability of the rock fundamentally changed from oil-wet to water-wet, leading to a considerable increase in the production degree and absorption and infiltration rates.
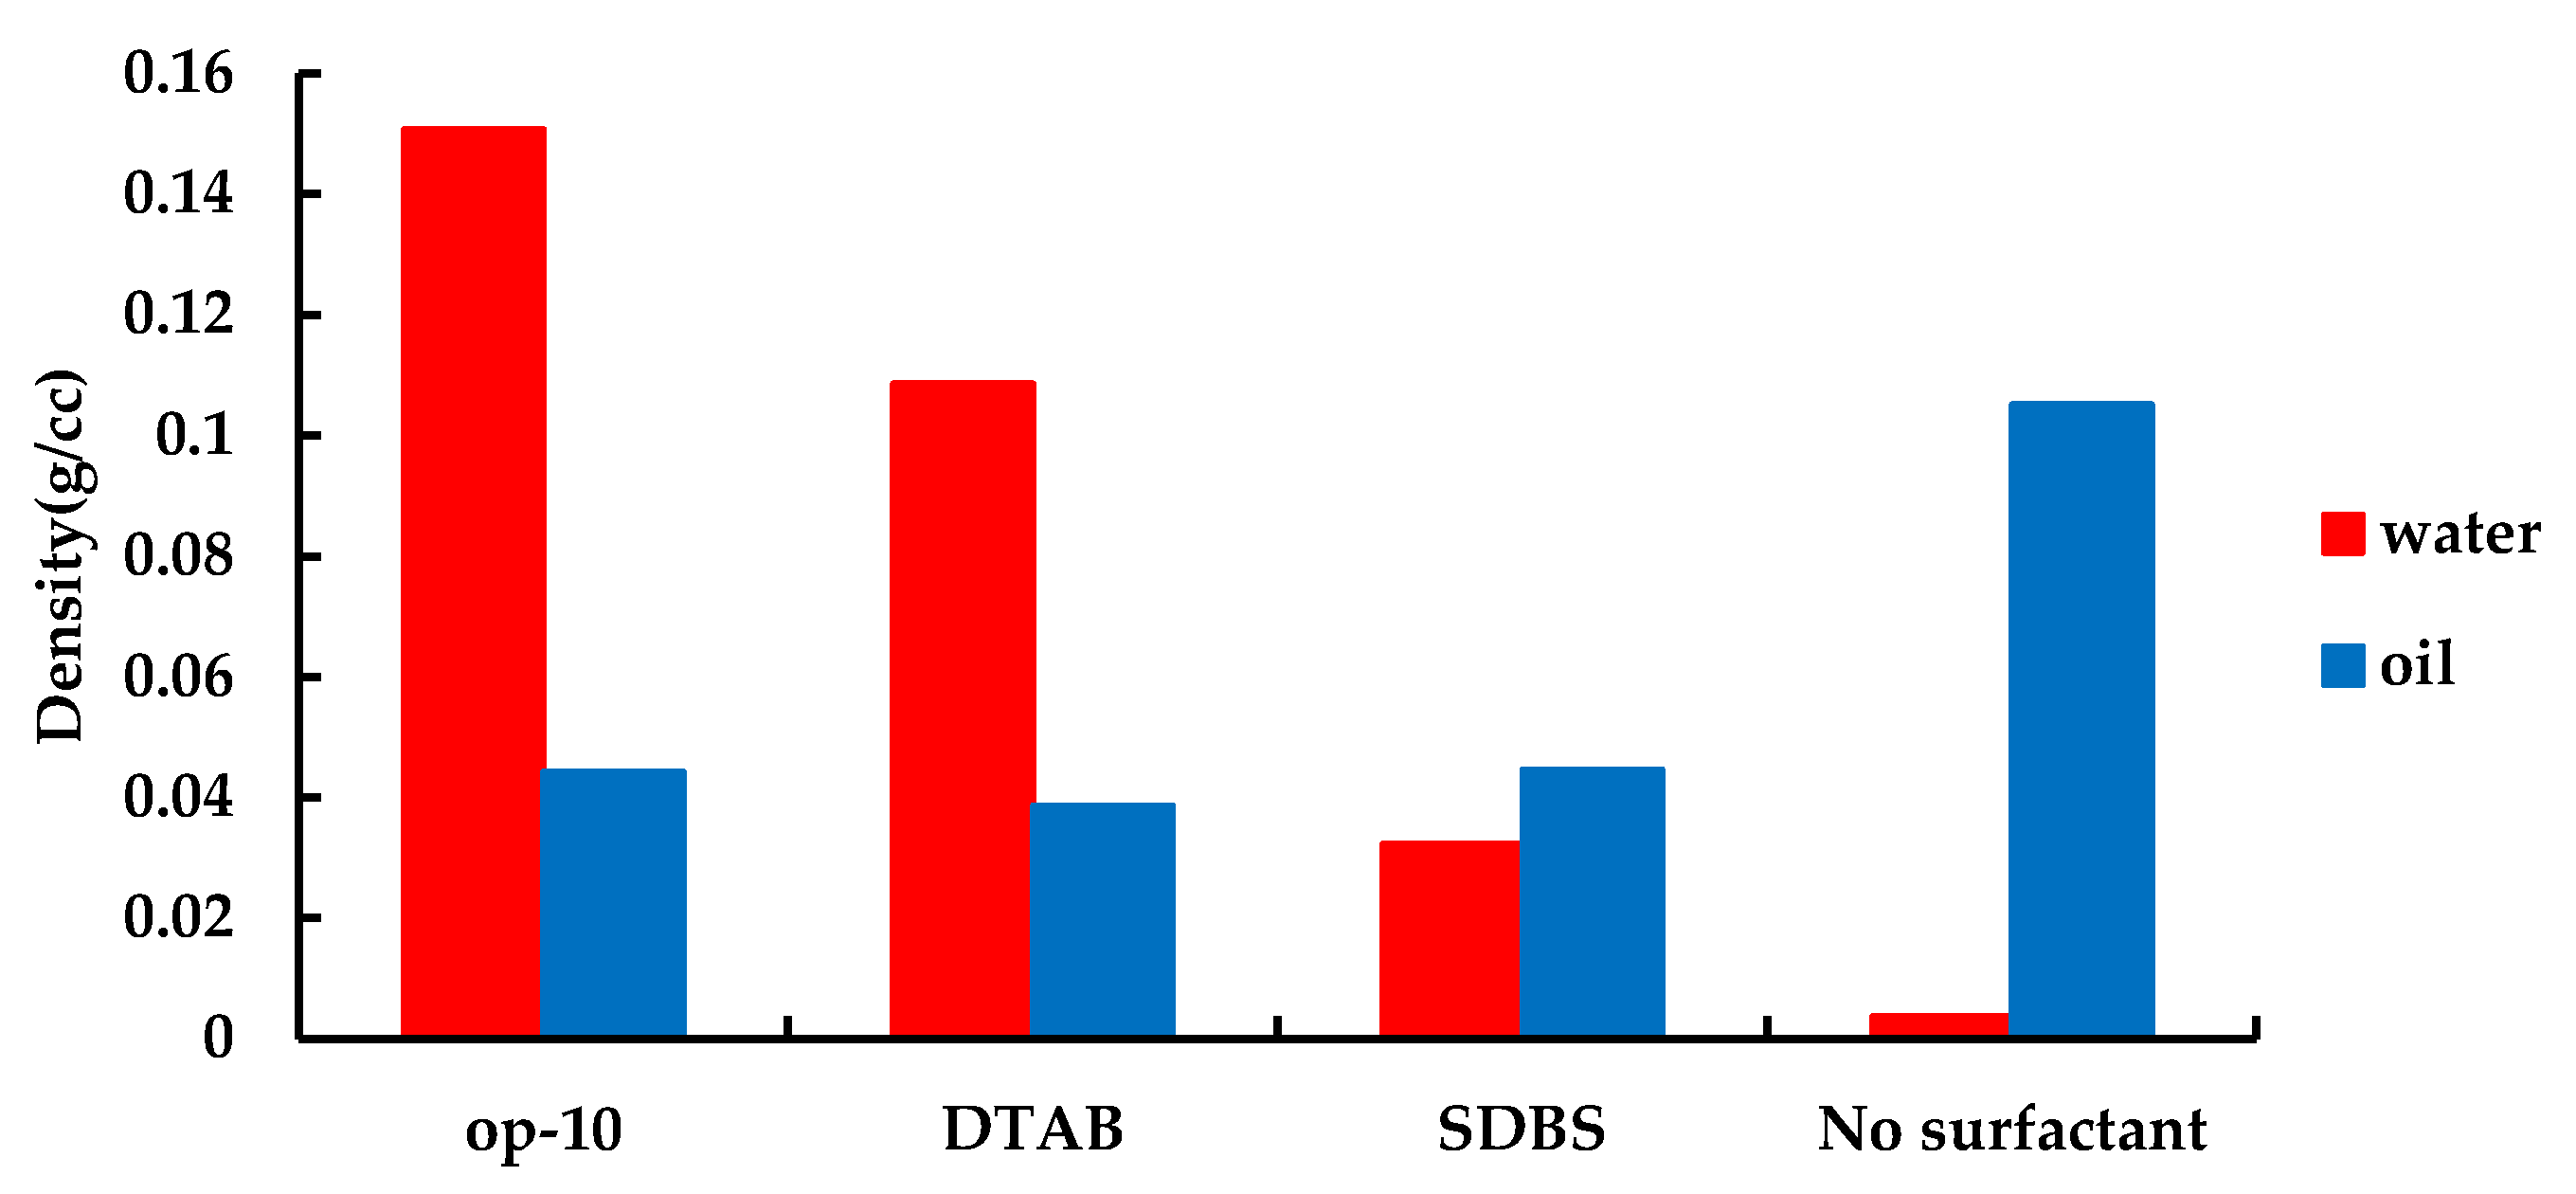
Given the complex composition of crude oil, the crude oil density was characterized by the average density of different types of crude oil molecules, and the various densities of oil and water on the rock surface under different conditions were obtained, as shown in Figure 10. Figure 10 suggests that the rock had a strong ability to absorb crude oil even without the addition of the surfactant. The introduction of surfactants considerably changed the wettability of the rocks. When OP-10 and DTAB surfactants were added, the wettability of the rocks fundamentally changed, i.e., from an oil-wet surface to a water-wet surface. The crude oil originally adsorbed on the rock surface was gradually separated from the rock surface under the action of van der Waals force, and the separated oil droplets drove into the surface cracks under the action of capillary forces, thus enhancing rock permeability and absorption capacity. However, the infiltration capacity was also affected by the interfacial tension between oil and water. Accordingly, the development of a surfactant system in the percolation and absorption medium will be an important future research direction.

4. Conclusions

(1)
The main principle of fracturing fluid percolation and oil absorption in tight oil reservoirs is that the surfactant in the fracturing fluid system changes the wettability of rock and gradually disperses the crude oil particles to avoid the rapid stabilization of the percolation and absorption system. The fluid carrying through the fracture wall can enhance the imbibition velocity and prolong the imbibition time;
(2)
The percolation and absorption times of surfactants with different concentrations in the percolation and absorption medium vary. Therefore, a reasonable surfactant concentration should be used to maximize the degree of infiltration and recovery; the optimum OP-10 concentration in the fracturing fluid was found to be 0.9%;
(3)
During the fracturing and permeability development of tight oil reservoirs, the combination of fracturing permeability and stimulation can be used to increase the flow frequency and velocity of fluids in fractures. Dispersing the crude oil into small droplets makes it easier for the crude oil to seep out, avoiding the equilibrium of capillary force in the pore duct and prolonging the stability time of seeping and absorbing;
(4)
The wettability of rocks fundamentally changed when OP-10 surfactants and DTAB surfactants were added. From the wet surface of the oil to the wet surface of water, the crude oil adsorbed on the rock surface gradually separates from the rock surface under the action of van der Waals force and the separated oil droplets drive into the surface cracks under the action of capillary forces.

Author Contributions

Writing—original draft preparation, review and editing, Y.B.; funding acquisition, G.C.; validation, G.W.; data curation, X.N. and Q.C.; software, T.D. and H.A. All authors have read and agreed to the published version of the manuscript.

Funding

This research was funded by the National Natural Science Foundation of China (No.51574089 and Heilongjiang Provincial Department of Education (TSTAU-R2018018) and the Innovative scientific research project for Postgraduates of Northeast Petroleum University (YJCX2016-013NEPU).

Acknowledgments

We gratefully acknowledge the support of the Key Laboratory of Enhanced Oil & Gas Recovery of the Ministry of Education at Northeast Petroleum University (Daqing, China).

Conflicts of Interest

The authors declare no conflict of interest.

References

  1. Al-Gharbi, M.; Blunt, M.J. 2D dynamic pore-scale network model of imbibition. Dev. Water Sci. 2004, 55, 71–82. [Google Scholar]
  2. Mason, G.; Morrow, N.R. Developments in spontaneous imbibition and possibilities for future work. J. Pet. Sci. Eng. 2013, 110, 268–293. [Google Scholar] [CrossRef]
  3. Benavente, D.; Pla, C.; Cueto, N.; Galvañ, S.; Martínez-Martínez, J.; Garcia-Del-Cura, M.A.; Ordóñez, S. Predicting water permeability in sedimentary rocks from capillary imbibition and pore structure. Eng. Geol. 2015, 195, 301–311. [Google Scholar] [CrossRef] [Green Version]
  4. Smirnov, N.; Nikitin, V.; Legros, J.; Istasse, E.; Schramm, L.; Wassmuth, F. Microgravity investigations of capillary-driven imbibition and drainage in inhomogeneous porous media. Acta Astronaut. 2004, 54, 39–52. [Google Scholar] [CrossRef]
  5. Rezaveisi, M.; Ayatollahi, S.; Rostami, B. Experimental Investigation of Matrix Wettability Effects on Water Imbibition in Fractured Artificial Porous Media. J. Pet. Sci. Eng. 2012, 86, 165–171. [Google Scholar] [CrossRef]
  6. Li, Y.; Flores, G.; Xu, J.; Yue, W.-Z.; Wang, Y.-X.; Luan, T.-G.; Gu, Q.-B. Residual air saturation changes during consecutive drainage–imbibition cycles in an air–water fine sandy medium. J. Hydrol. 2013, 503, 77–88. [Google Scholar] [CrossRef]
  7. Liu, G.; Zhang, M.; Ridgway, C.; Gane, P. Pore wall rugosity: The role of extended wetting contact line length during spontaneous liquid imbibition in porous media. Colloids Surfaces A Physicochem. Eng. Asp. 2014, 443, 286–295. [Google Scholar] [CrossRef]
  8. Fernø, M.A.; Haugen, A.; Wickramathilak, S.; Howard, J.; Graue, A.; Mason, G.; Morrow, N.R. Magnetic resonance imaging of the development of fronts during spontaneous imbibition. J. Pet. Sci. Eng. 2013, 101, 1–11. [Google Scholar] [CrossRef]
  9. Meng, M.; Ge, H.; Ji, W.; Wang, X.; Chen, L. Investigation on the variation of shale permeability with spontaneous imbibition time: Sandstones and volcanic rocks as comparative study. J. Nat. Gas Sci. Eng. 2015, 27, 1546–1554. [Google Scholar] [CrossRef]
  10. Garing, C.; Voltolini, M.; Ajo-Franklin, J.B.; Benson, S.M. Pore-scale Evolution of Trapped CO2 at Early Stages Following Imbibition Using Micro-CT Imaging. Energy Procedia 2017, 114, 4872–4878. [Google Scholar] [CrossRef]
  11. Wang, X.; Peng, X.; Zhang, S.; Du, Z.; Zeng, F. Characteristics of oil distributions in forced and spontaneous imbibition of tight oil reservoir. Fuel 2018, 224, 280–288. [Google Scholar] [CrossRef]
  12. Yang, B.; Kang, Y.; Lu, X.; You, L.; Zhang, H.; Chen, Z. Experimental investigation of the pore shape factor in fluid imbibition model-taking the Longmaxi shale in Sichuan Basin as Examples. J. Pet. Sci. Eng. 2020, 193. [Google Scholar] [CrossRef]
  13. Gambaryan-Roisman, T. Liquids on porous layers: Wetting, imbibition and transport processes. Curr. Opin. Colloid Interface Sci. 2014, 19, 320–335. [Google Scholar] [CrossRef]
  14. Ahmadi, S.; Hosseini, M.; Tangestani, E.; Mousavi, S.E.; Niazi, M. Wettability alteration and oil recovery by spontaneous imbibition of smart water and surfactants into carbonates. Pet. Sci. 2020, 17, 712–721. [Google Scholar] [CrossRef] [Green Version]
  15. Wang, G.; Zhao, Z.; Li, K.; Li, A.; He, B. Spontaneous Imbibition Laws and the Optimal Formulation of Fracturing Fluid during Hydraulic Fracturing in Ordos Basin. Procedia Eng. 2015, 126, 549–553. [Google Scholar] [CrossRef] [Green Version]
  16. Pitois, O.; Kaddami, A.; Langlois, V. Capillary imbibition in open-cell monodisperse foams. J. Colloid Interface Sci. 2020, 571, 166–173. [Google Scholar] [CrossRef]
  17. Guo, J.; Li, M.; Chen, C.; Tao, L.; Liu, Z.; Zhou, D. Experimental investigation of spontaneous imbibition in tight sandstone reservoirs. J. Pet. Sci. Eng. 2020, 193, 107395. [Google Scholar] [CrossRef]
  18. Feldmann, F.; Strobel, G.J.; Masalmeh, S.K.; AlSumaiti, A.M. An experimental and numerical study of low salinity effects on the oil recovery of carbonate rocks combining spontaneous imbibition, centrifuge method and coreflooding experiments. J. Pet. Sci. Eng. 2020, 190, 107045. [Google Scholar] [CrossRef]
  19. Mehraban, M.F.; Rostami, P.; Afzali, S.; Ahmadi, Z.; Sharifi, M.; Ayatollahi, S. Brine composition effect on the oil recovery in carbonate oil reservoirs: A comprehensive experimental and CFD simulation study. J. Pet. Sci. Eng. 2020, 191, 107149. [Google Scholar] [CrossRef]
  20. Sheng, M.; Tian, S.; Cheng, Z.; Ge, H. Insights into the influence of fluid imbibition on dynamic mechanics of tight shale. J. Pet. Sci. Eng. 2019, 173, 1031–1036. [Google Scholar] [CrossRef]
  21. Ghanbari, E.; Dehghanpour, H. Impact of rock fabric on water imbibition and salt diffusion in gas shales. Int. J. Coal Geol. 2015, 138, 55–67. [Google Scholar] [CrossRef]
  22. Yang, L.; Ge, H.; Shi, X.; Cheng, Y.; Zhang, K.; Chen, H.; Shen, Y.; Zhang, J.; Qu, X. The effect of microstructure and rock mineralogy on water imbibition characteristics in tight reservoirs. J. Nat. Gas Sci. Eng. 2016, 34, 1461–1471. [Google Scholar] [CrossRef]
  23. Li, J.; McDougall, S.; Sorbie, K. Dynamic pore-scale network model (PNM) of water imbibition in porous media. Adv. Water Resour. 2017, 107, 191–211. [Google Scholar] [CrossRef]
  24. Chapman, E.; Yang, J.; Crawshaw, J.; Boek, E. Pore Scale Models for Imbibition of CO2 Analogue Fluids in Etched Micro-model||junctions Using Micro-fluidic Experiments and Direct Flow Calculations. Energy Procedia 2013, 37, 3680–3686. [Google Scholar] [CrossRef] [Green Version]
  25. Xu, Z.; Cheng, L.; Cao, R.; Jia, P.; Wu, J. Simulation of counter-current imbibition in single matrix and field scale using radical integral boundary element method. J. Pet. Sci. Eng. 2017, 156, 125–133. [Google Scholar] [CrossRef]
  26. Liu, L.; Liu, Y.; Yao, J.; Huang, Z. Mechanistic study of cyclic water injection to enhance oil recovery in tight reservoirs with fracture deformation hysteresis. Fuel 2020, 271, 117677. [Google Scholar] [CrossRef]
  27. El-Amin, M.; Salama, A.; Sun, S.; El-Amin, M.F. Numerical and dimensional investigation of two-phase countercurrent imbibition in porous media. J. Comput. Appl. Math. 2013, 242, 285–296. [Google Scholar] [CrossRef]
  28. Cheng, C.-L.; Perfect, E.; Donnelly, B.; Bilheux, H.Z.; Tremsin, A.S.; McKay, L.; Distefano, V.; Cai, J.; Santodonato, L. Rapid imbibition of water in fractures within unsaturated sedimentary rock. Adv. Water Resour. 2015, 77, 82–89. [Google Scholar] [CrossRef] [Green Version]
  29. Haugen, A.; Fernø, M.A.; Mason, G.; Morrow, N. Capillary pressure and relative permeability estimated from a single spontaneous imbibition test. J. Pet. Sci. Eng. 2014, 115, 66–77. [Google Scholar] [CrossRef]
  30. Mirzaei-Paiaman, A. Analysis of counter-current spontaneous imbibition in presence of resistive gravity forces: Displacement characteristics and scaling. J. Unconv. Oil Gas Resour. 2015, 12, 68–86. [Google Scholar] [CrossRef]
  31. Amadu, M.; Pegg, M.J. Analytical solution to spontaneous imbibition under vertical temperature gradient based on the theory of spontaneous imbibition dynamics. J. Pet. Sci. Eng. 2019, 172, 627–635. [Google Scholar] [CrossRef]
  32. Roychaudhuri, B.; Tsotsis, T.; Jessen, K. An experimental investigation of spontaneous imbibition in gas shales. J. Pet. Sci. Eng. 2013, 111, 87–97. [Google Scholar] [CrossRef]
Figure 1. Oil absorption and drainage effect of oil absorption paper. (a) Oil absorption; (b) drainage.
Processes 08 00972 g001
Figure 2. Experimental infiltration phenomenon.
Processes 08 00972 g002
Figure 3. Changes in degree of percolation and recovery from tight core over time in different percolation and absorption liquid systems.
Processes 08 00972 g003
Figure 4. Changes in infiltration and absorption velocity of tight core with time in different infiltration and absorption liquid systems.
Processes 08 00972 g004
Figure 5. Permeation and oil recovery mechanism driven by capillary force. (a) Unbalanced osmotic absorption system; (b) balanced osmotic absorption system.
Processes 08 00972 g005
Figure 6. Carrying effect of fluid flow through fractures on crude oil in porous media, the pores with more invasion are marked with red circle.
Processes 08 00972 g006
Figure 7. Dispersion of surfactants in crude oil and drag force-carrying fluids through fractures.
Processes 08 00972 g007
Figure 8. Adsorbed surfactant on rock wall surface.
Processes 08 00972 g008
Figure 9. Density distribution of formation fluids at different positions from rock wall. (a) No surfactant; (b) with sodium dodecyl benzenesulfonate (SDBS); (c) with dodecyl trimethyl ammonium bromide (DTAB) (d) with polyoxyethylene octyl phenol ether-10 (OP-10).
Processes 08 00972 g009
Figure 10. Difference in oil and water densities on rock surface under different conditions.
Processes 08 00972 g010
Table 1. Formula of fracturing fluid used in experiment.
NameConcentration (%)NameConcentration (%)
Melon glue0.60Potassium persulfate0.50
NaCl0.03OP-100.50, 0.90
KCl0.03Borax (crosslinking liquid)0.80
Table 2. Effects of different surfactant concentrations on percolation recovery.
Experimental SchemesCore Length (cm)Porosity (%)Permeability (10−3 μm2)Interfacial Tension (mN/m)Core Contact Angle (°)Recovery (%)
Formation water7.811.320.155010.5254.261.46
Fracturing fluid1 (0.5% OP-10)8.59.670.34790.6716.8717.56
Fracturing fluid2 (0.9% OP-10)9.710.760.12970.4310.2348.93
Fracturing fluid3 (2% OP-10)9.49.540.26710.286.2419.31