Heat and Mass Transfer during Lignocellulosic Biomass Torrefaction: Contributions from the Major Components—Cellulose, Hemicellulose, and Lignin

Abstract
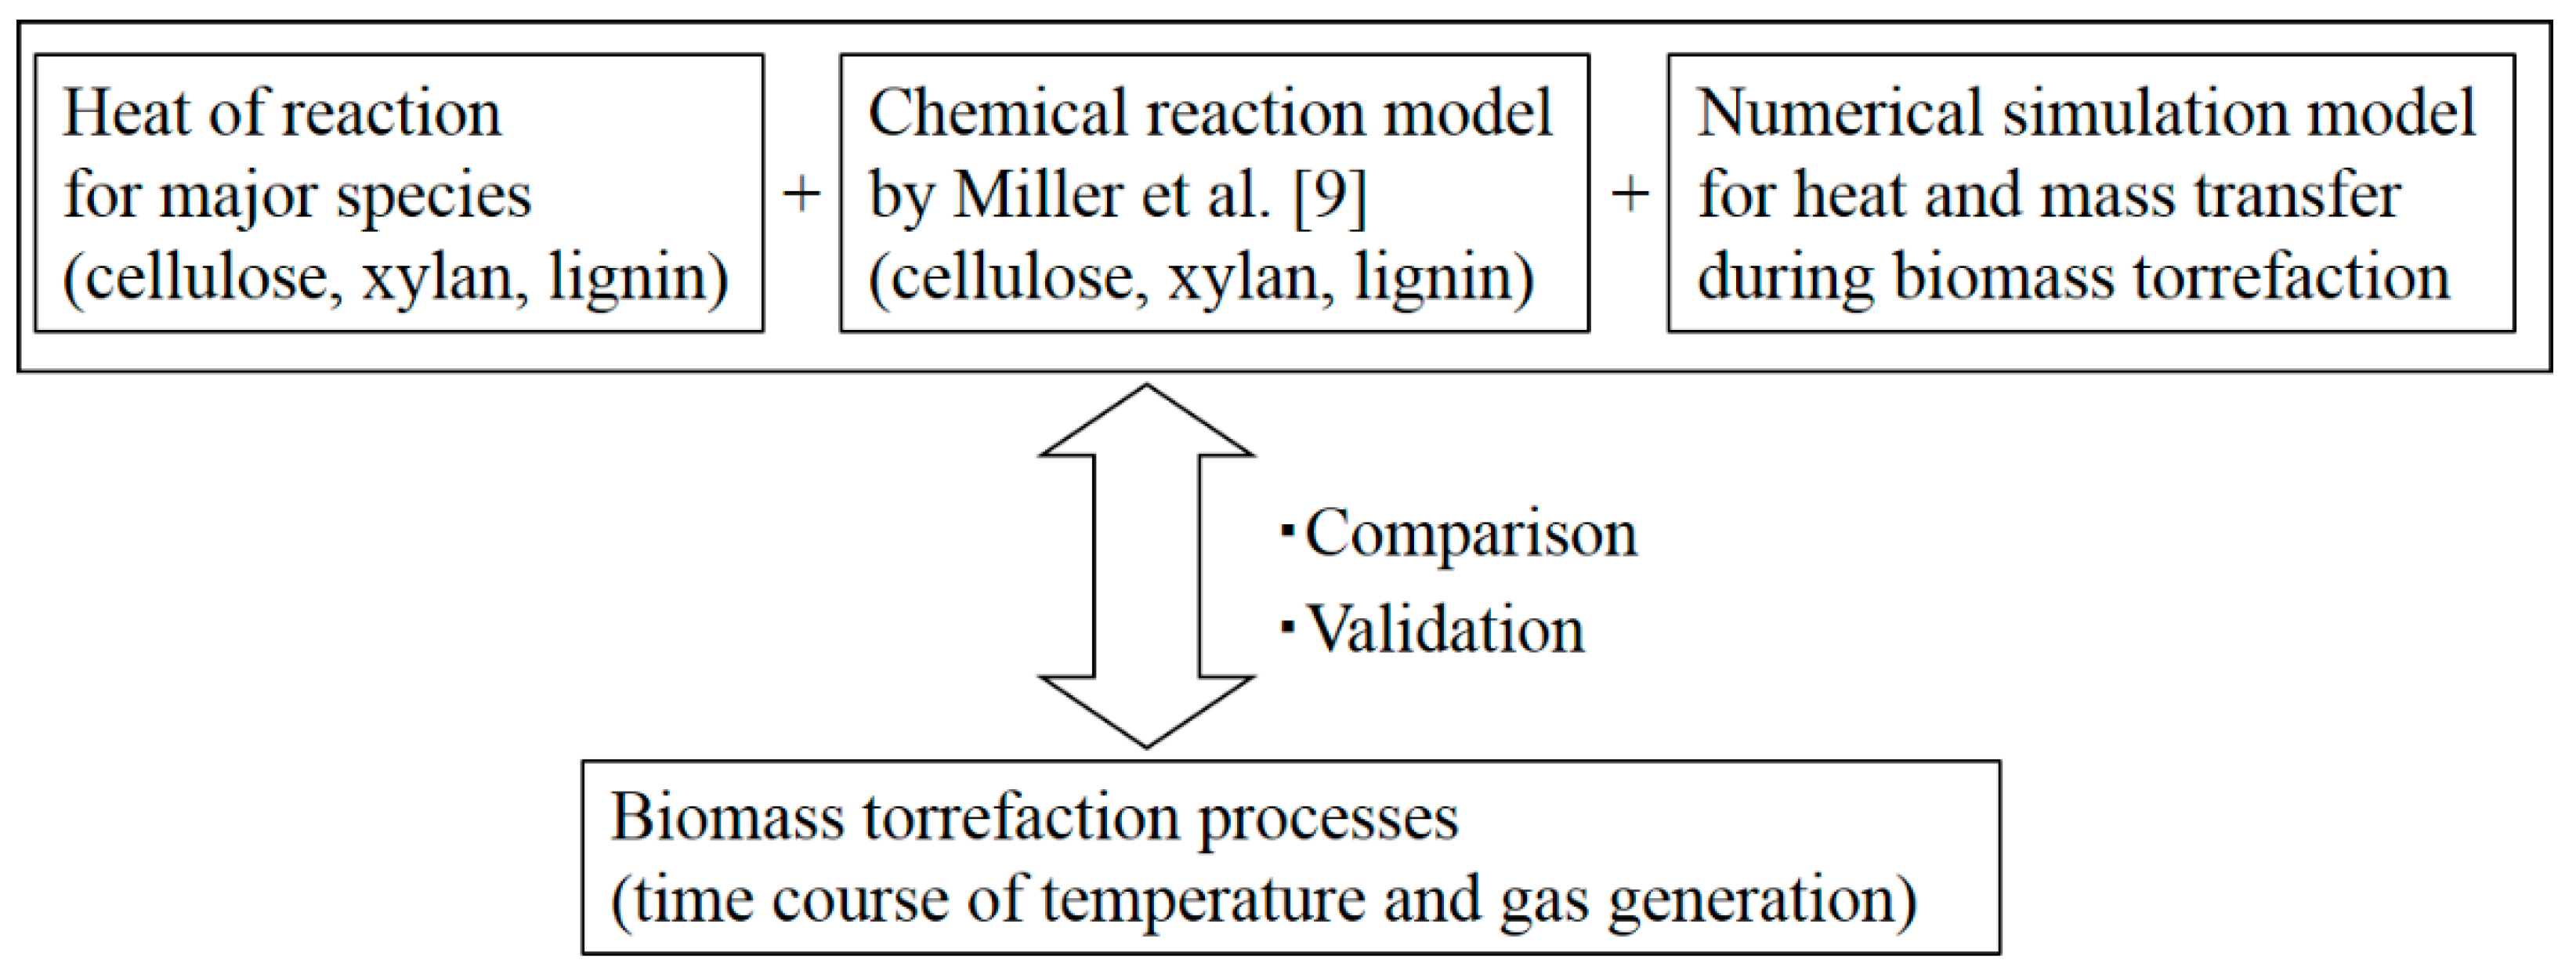
1. Introduction
2. Materials and Methods
2.1. Sample Preparation
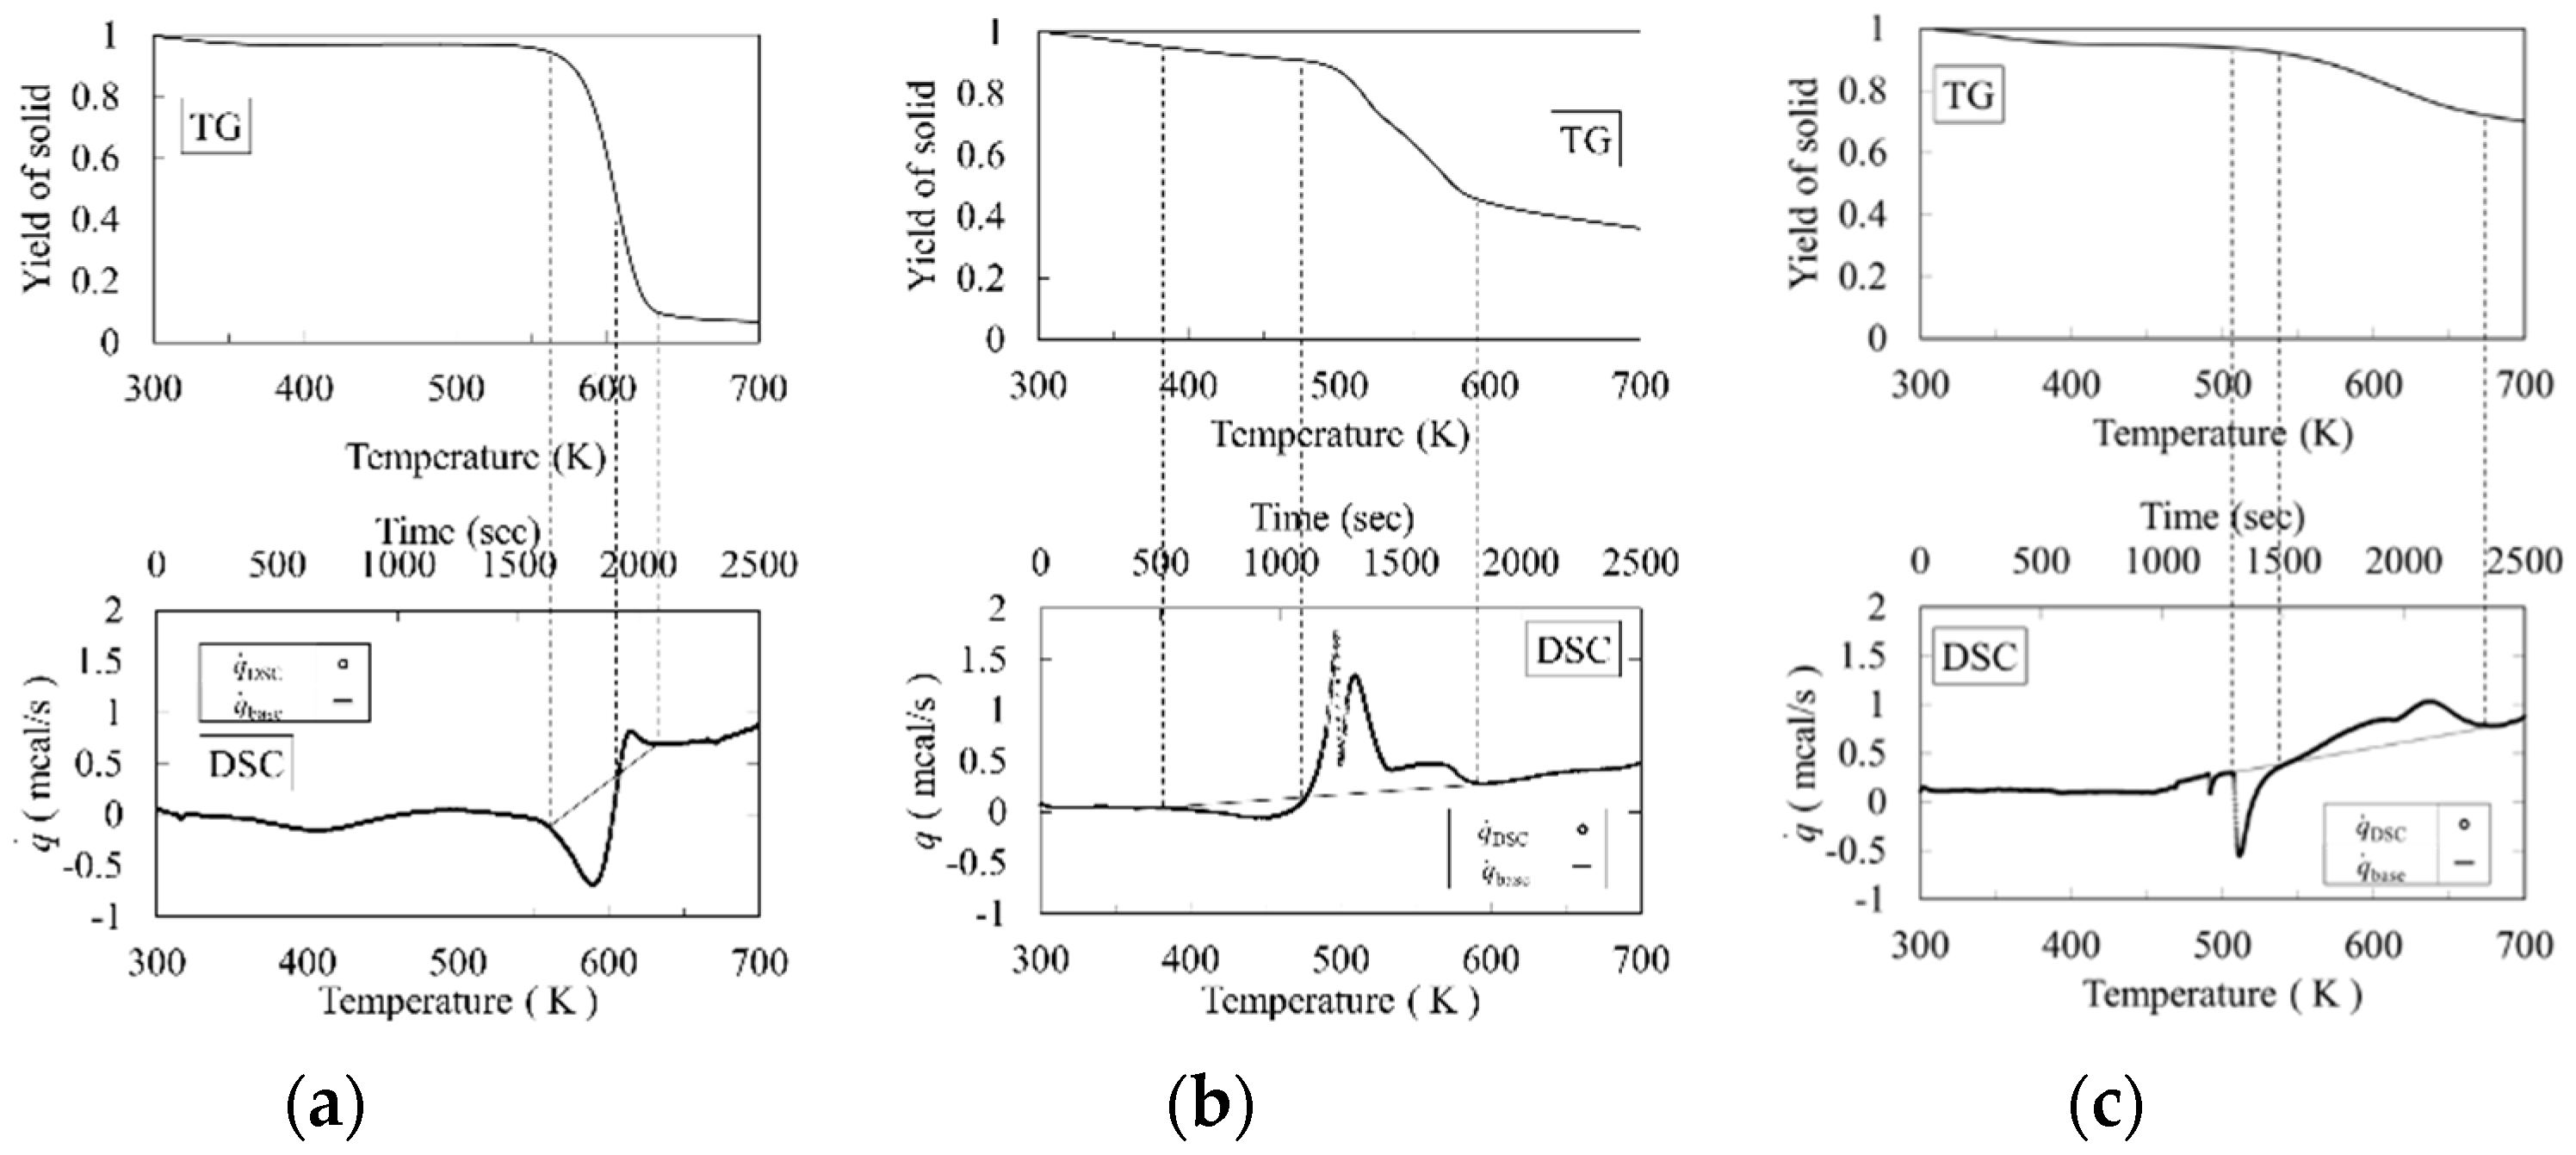
2.2. Thermogravimetric (TG) Analysis and Differential Scanning Calorimetry (DSC)
- (1)
- The time or temperature of the reaction start point tRS,i (TRS,i) and reaction end point tRE,i (TRE,i) were decided using the trend of the DSC and TG curves.
- (2)
- The base line between tRS,i and tRE,i was linearly drawn in the DSC diagram.
- (3)
- The cross point tshift,i (Tshift,i) between the DSC curve and the base line was defined as the shifted point from the endothermic chemical reaction to the exothermic chemical reaction.
- (4)
- The endothermic and exothermic heats of reactions were given by Equations (1) and (2).
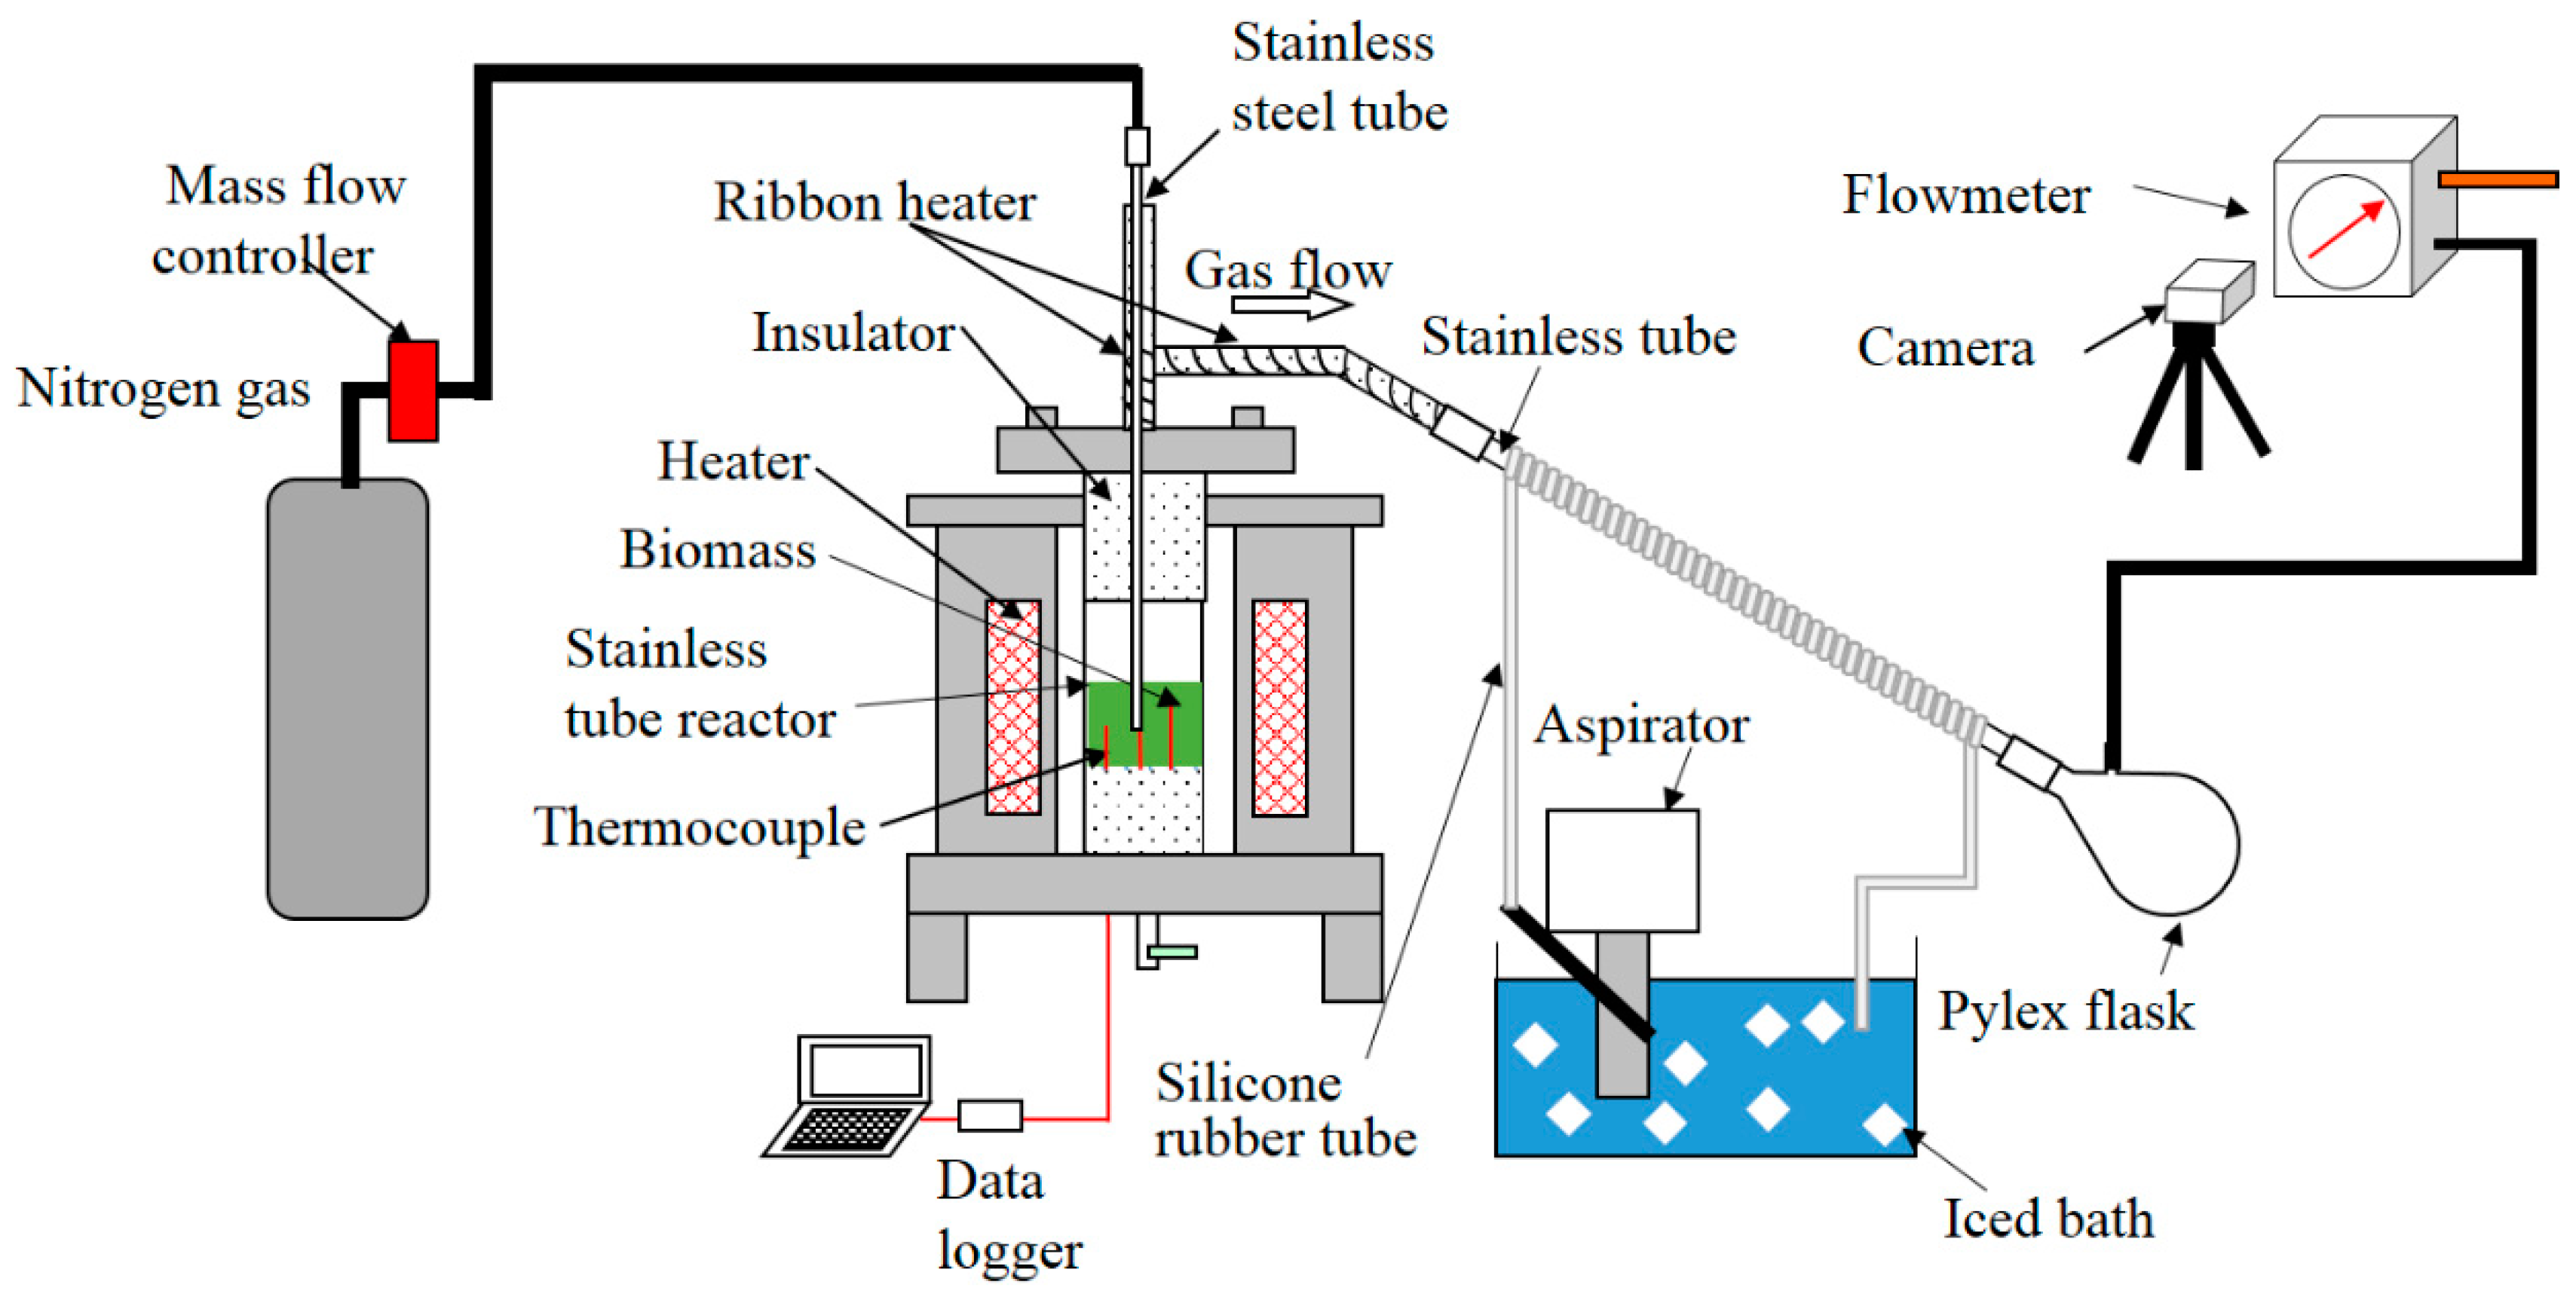
2.3. Experimental Apparatus and Procedure
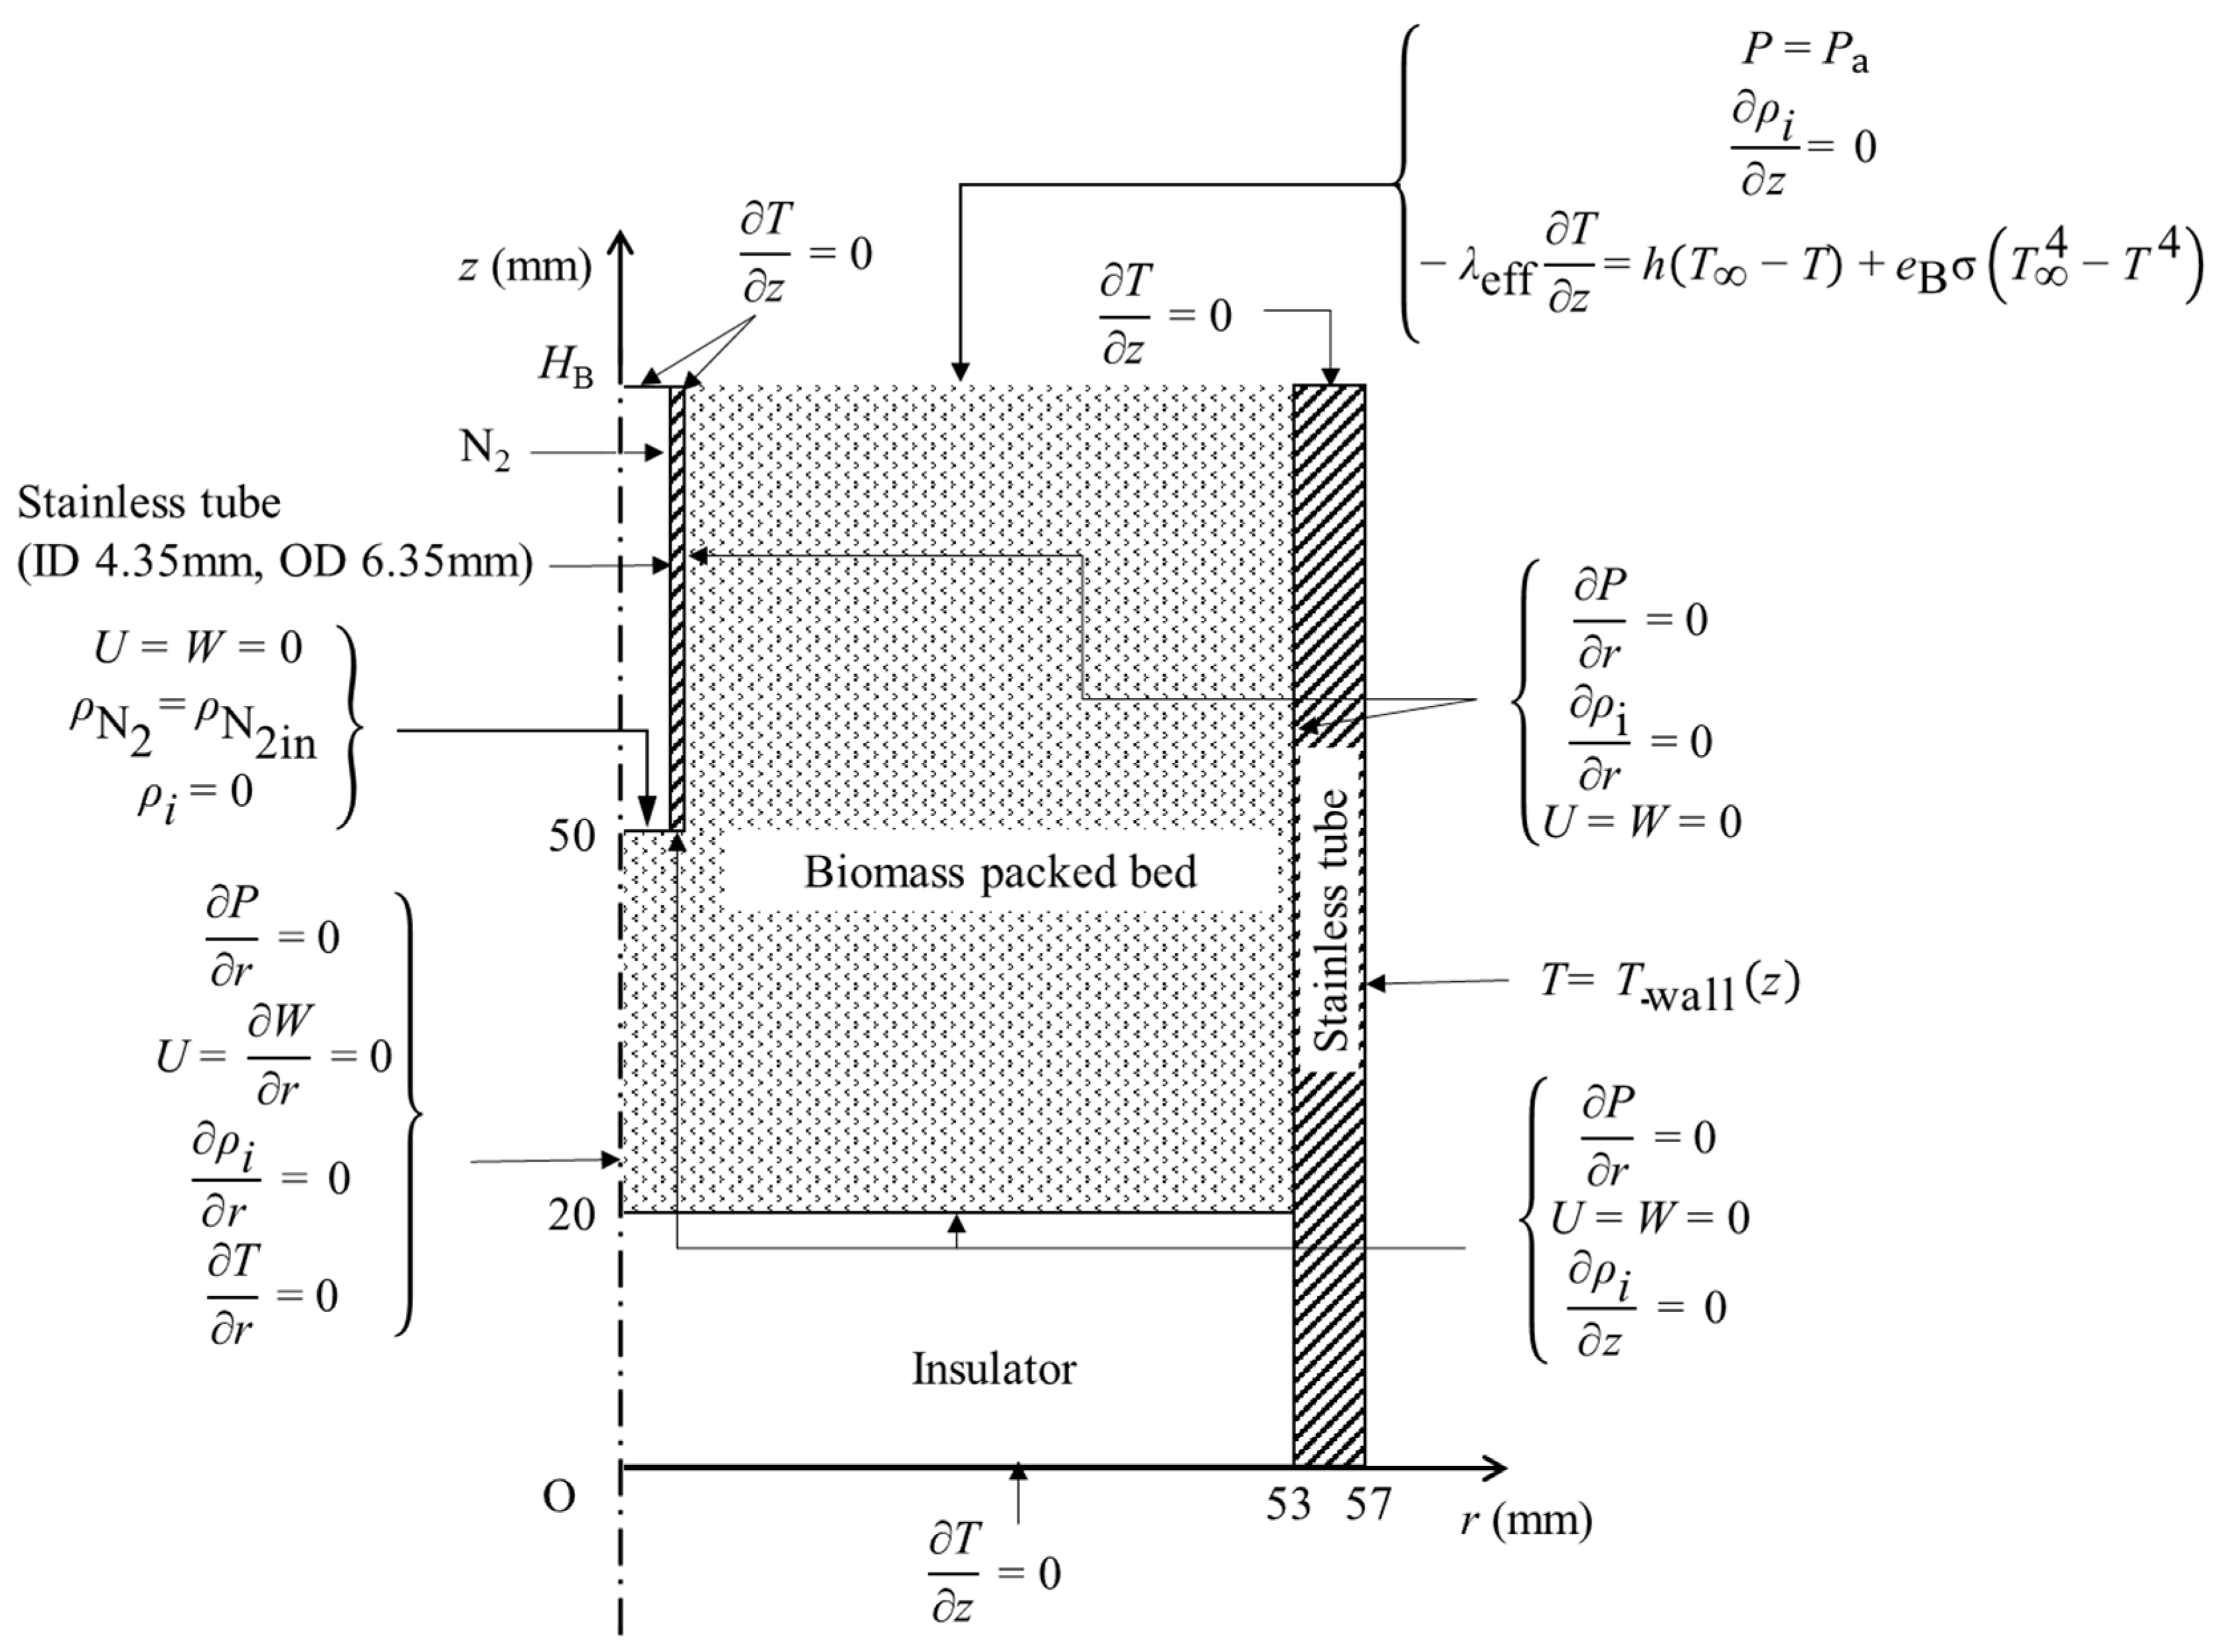
2.4. Numerical Simulation
3. Results and Discussion
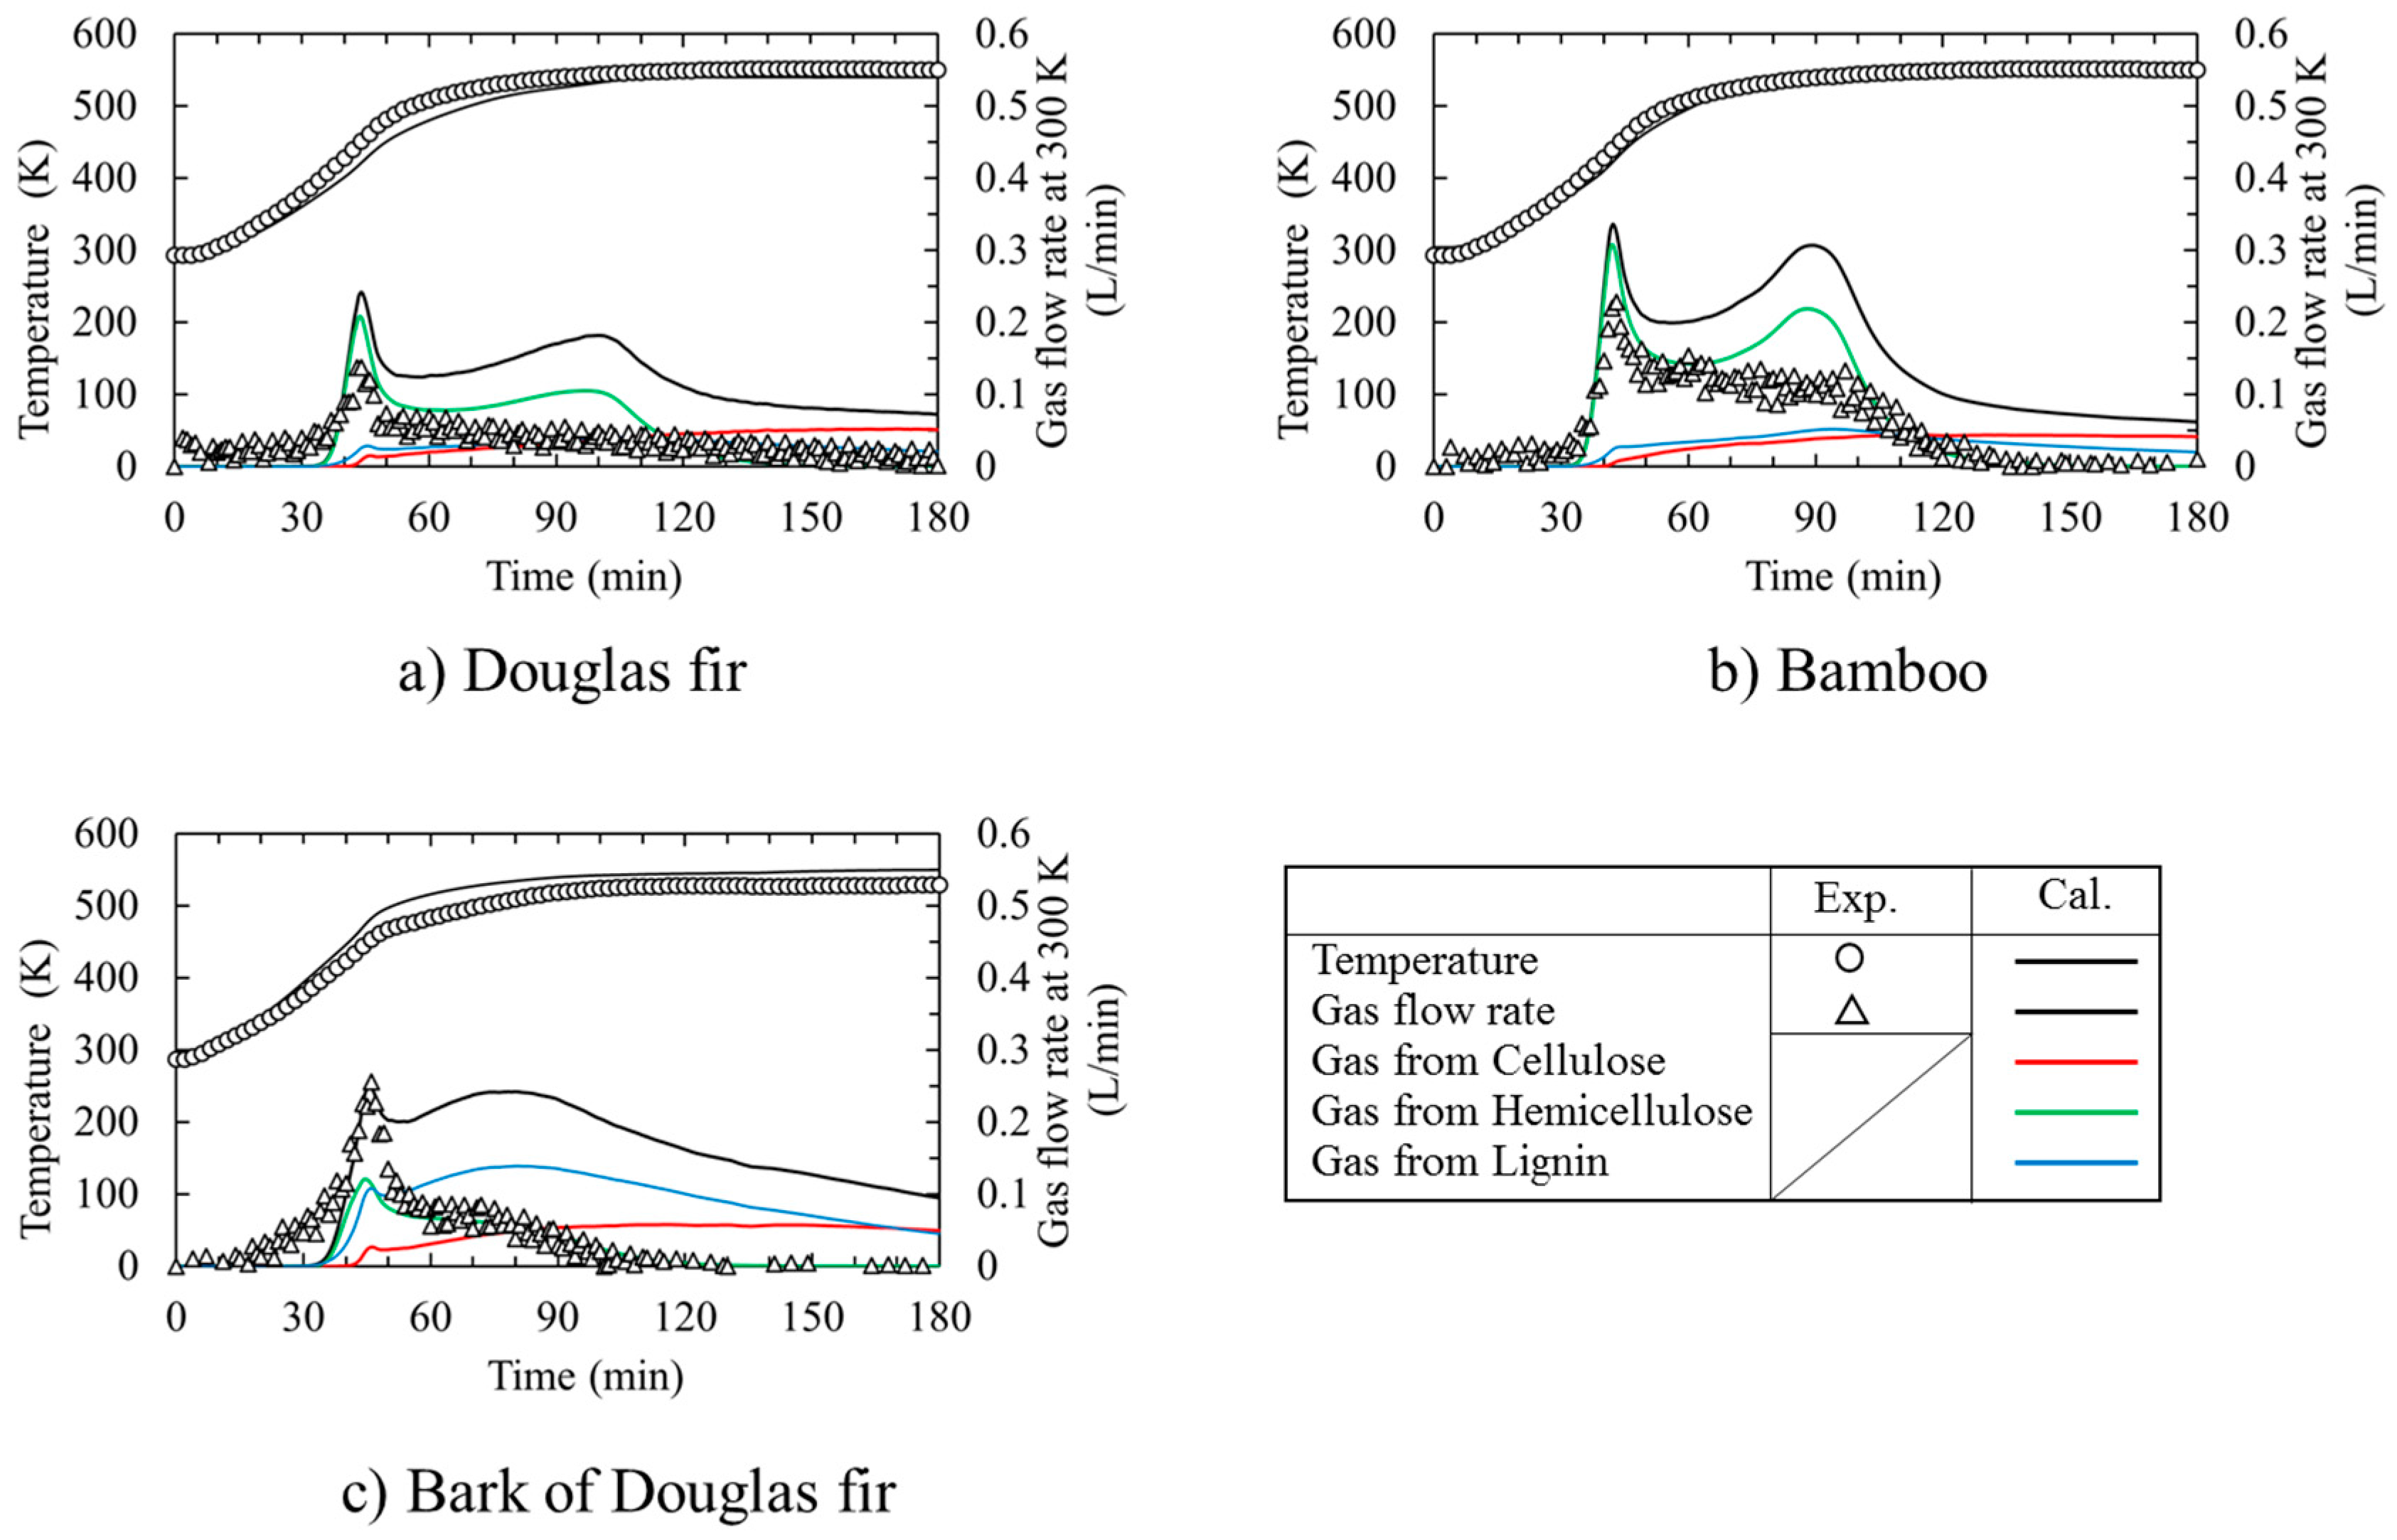
3.1. Time Course of Temperature and Gas Flow Rate during Torrefaction
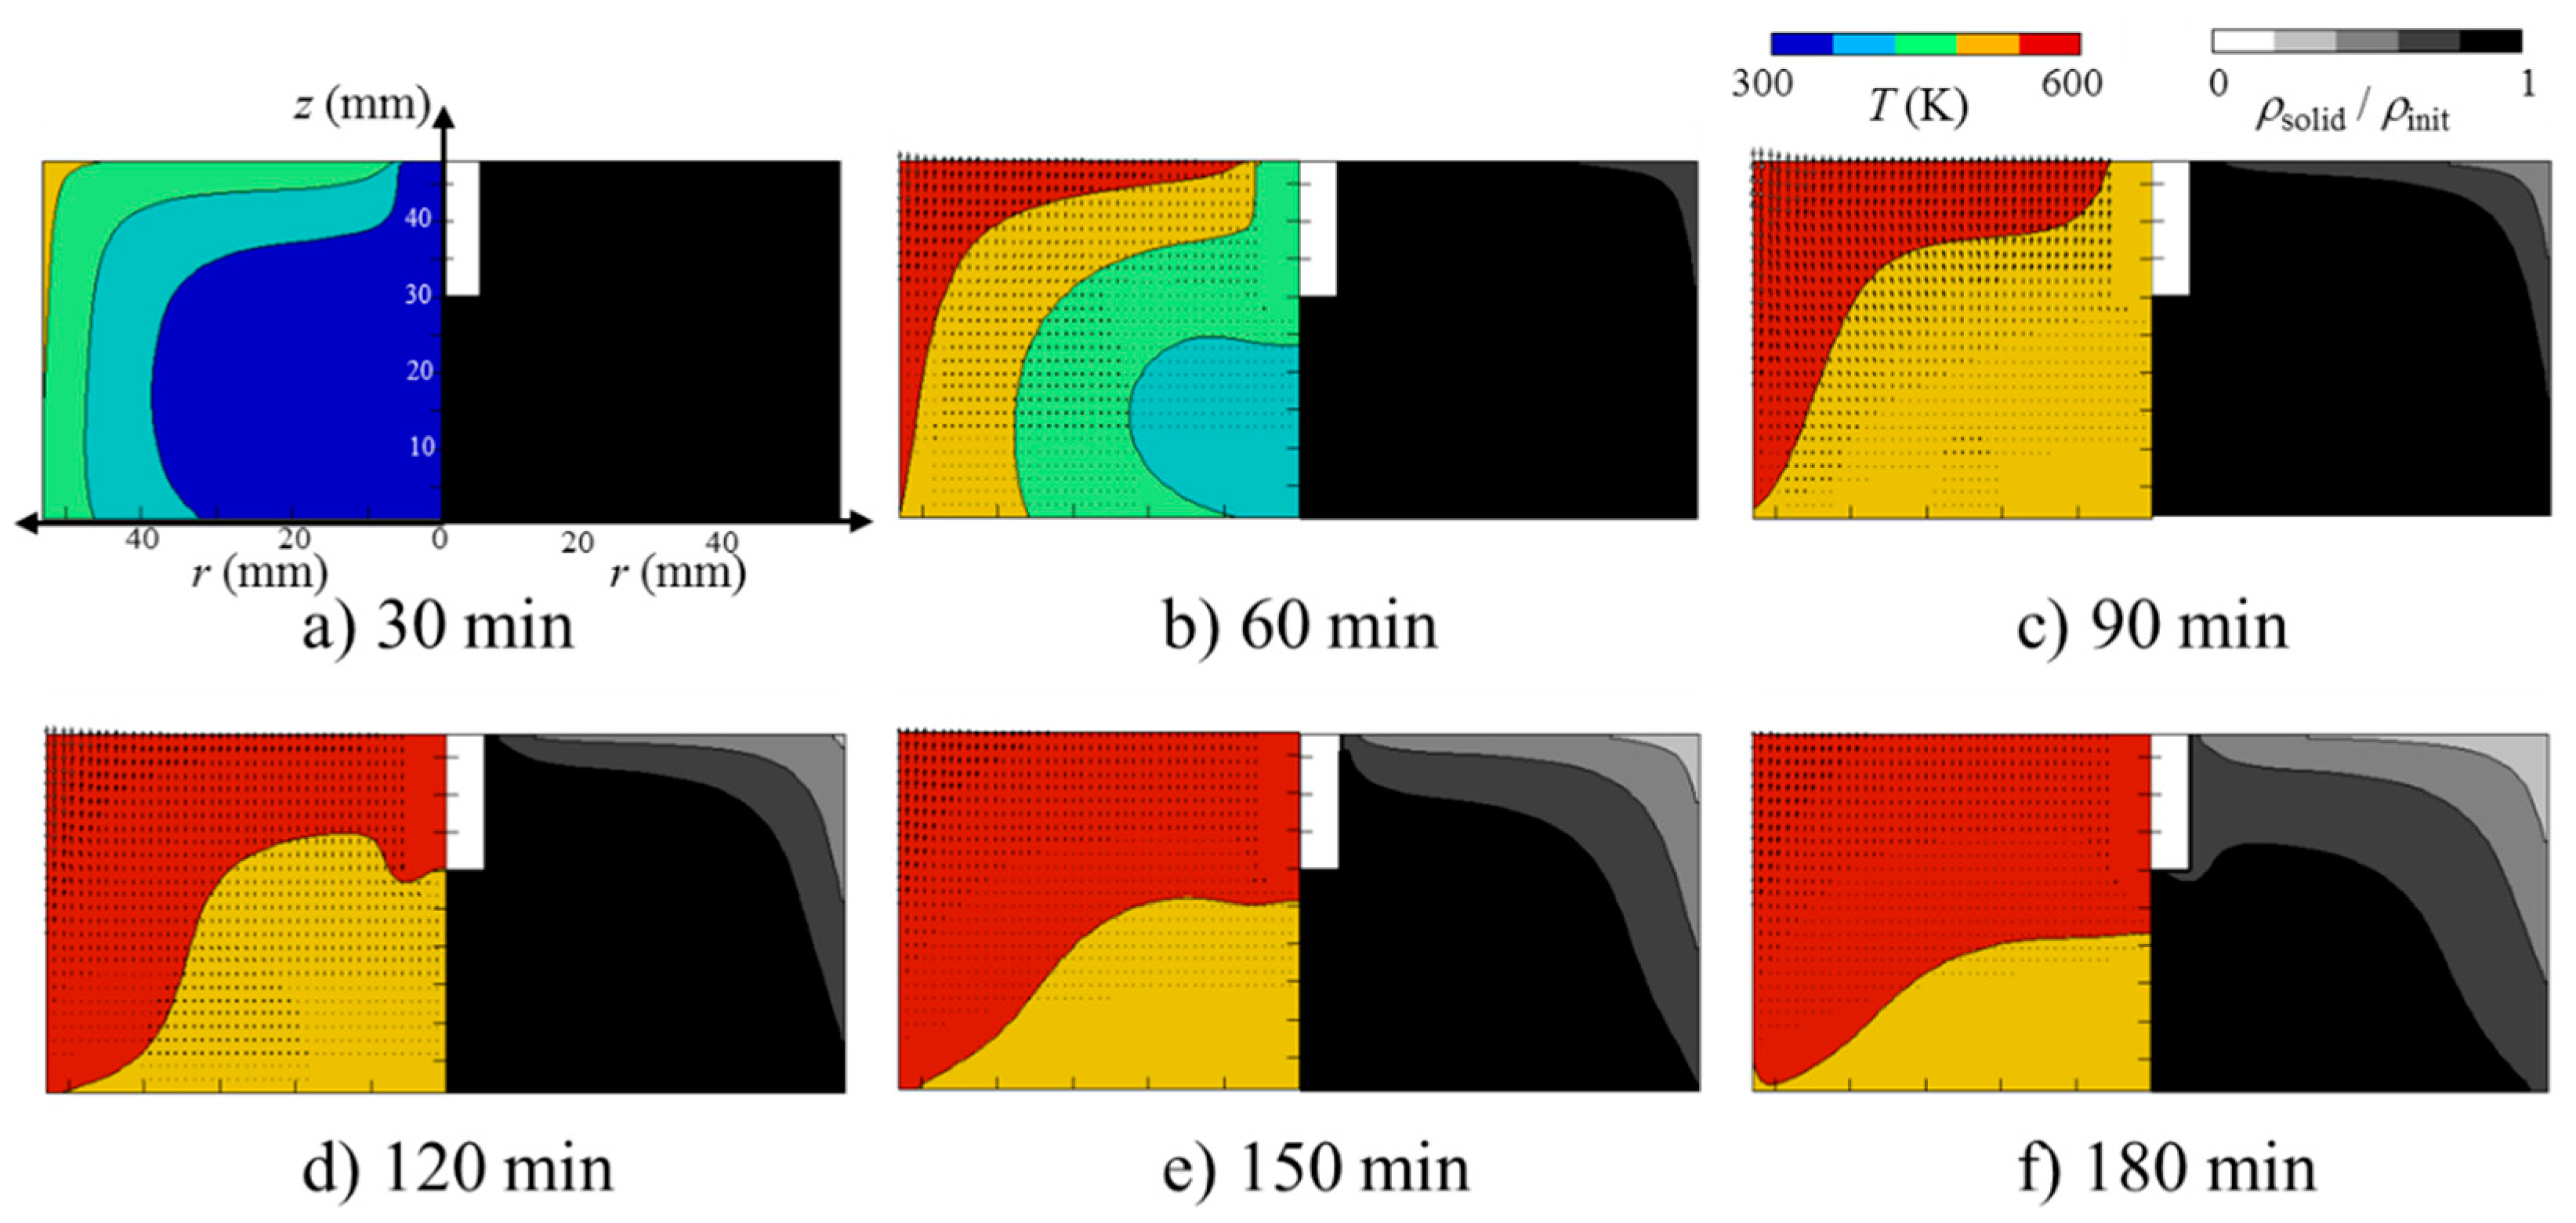
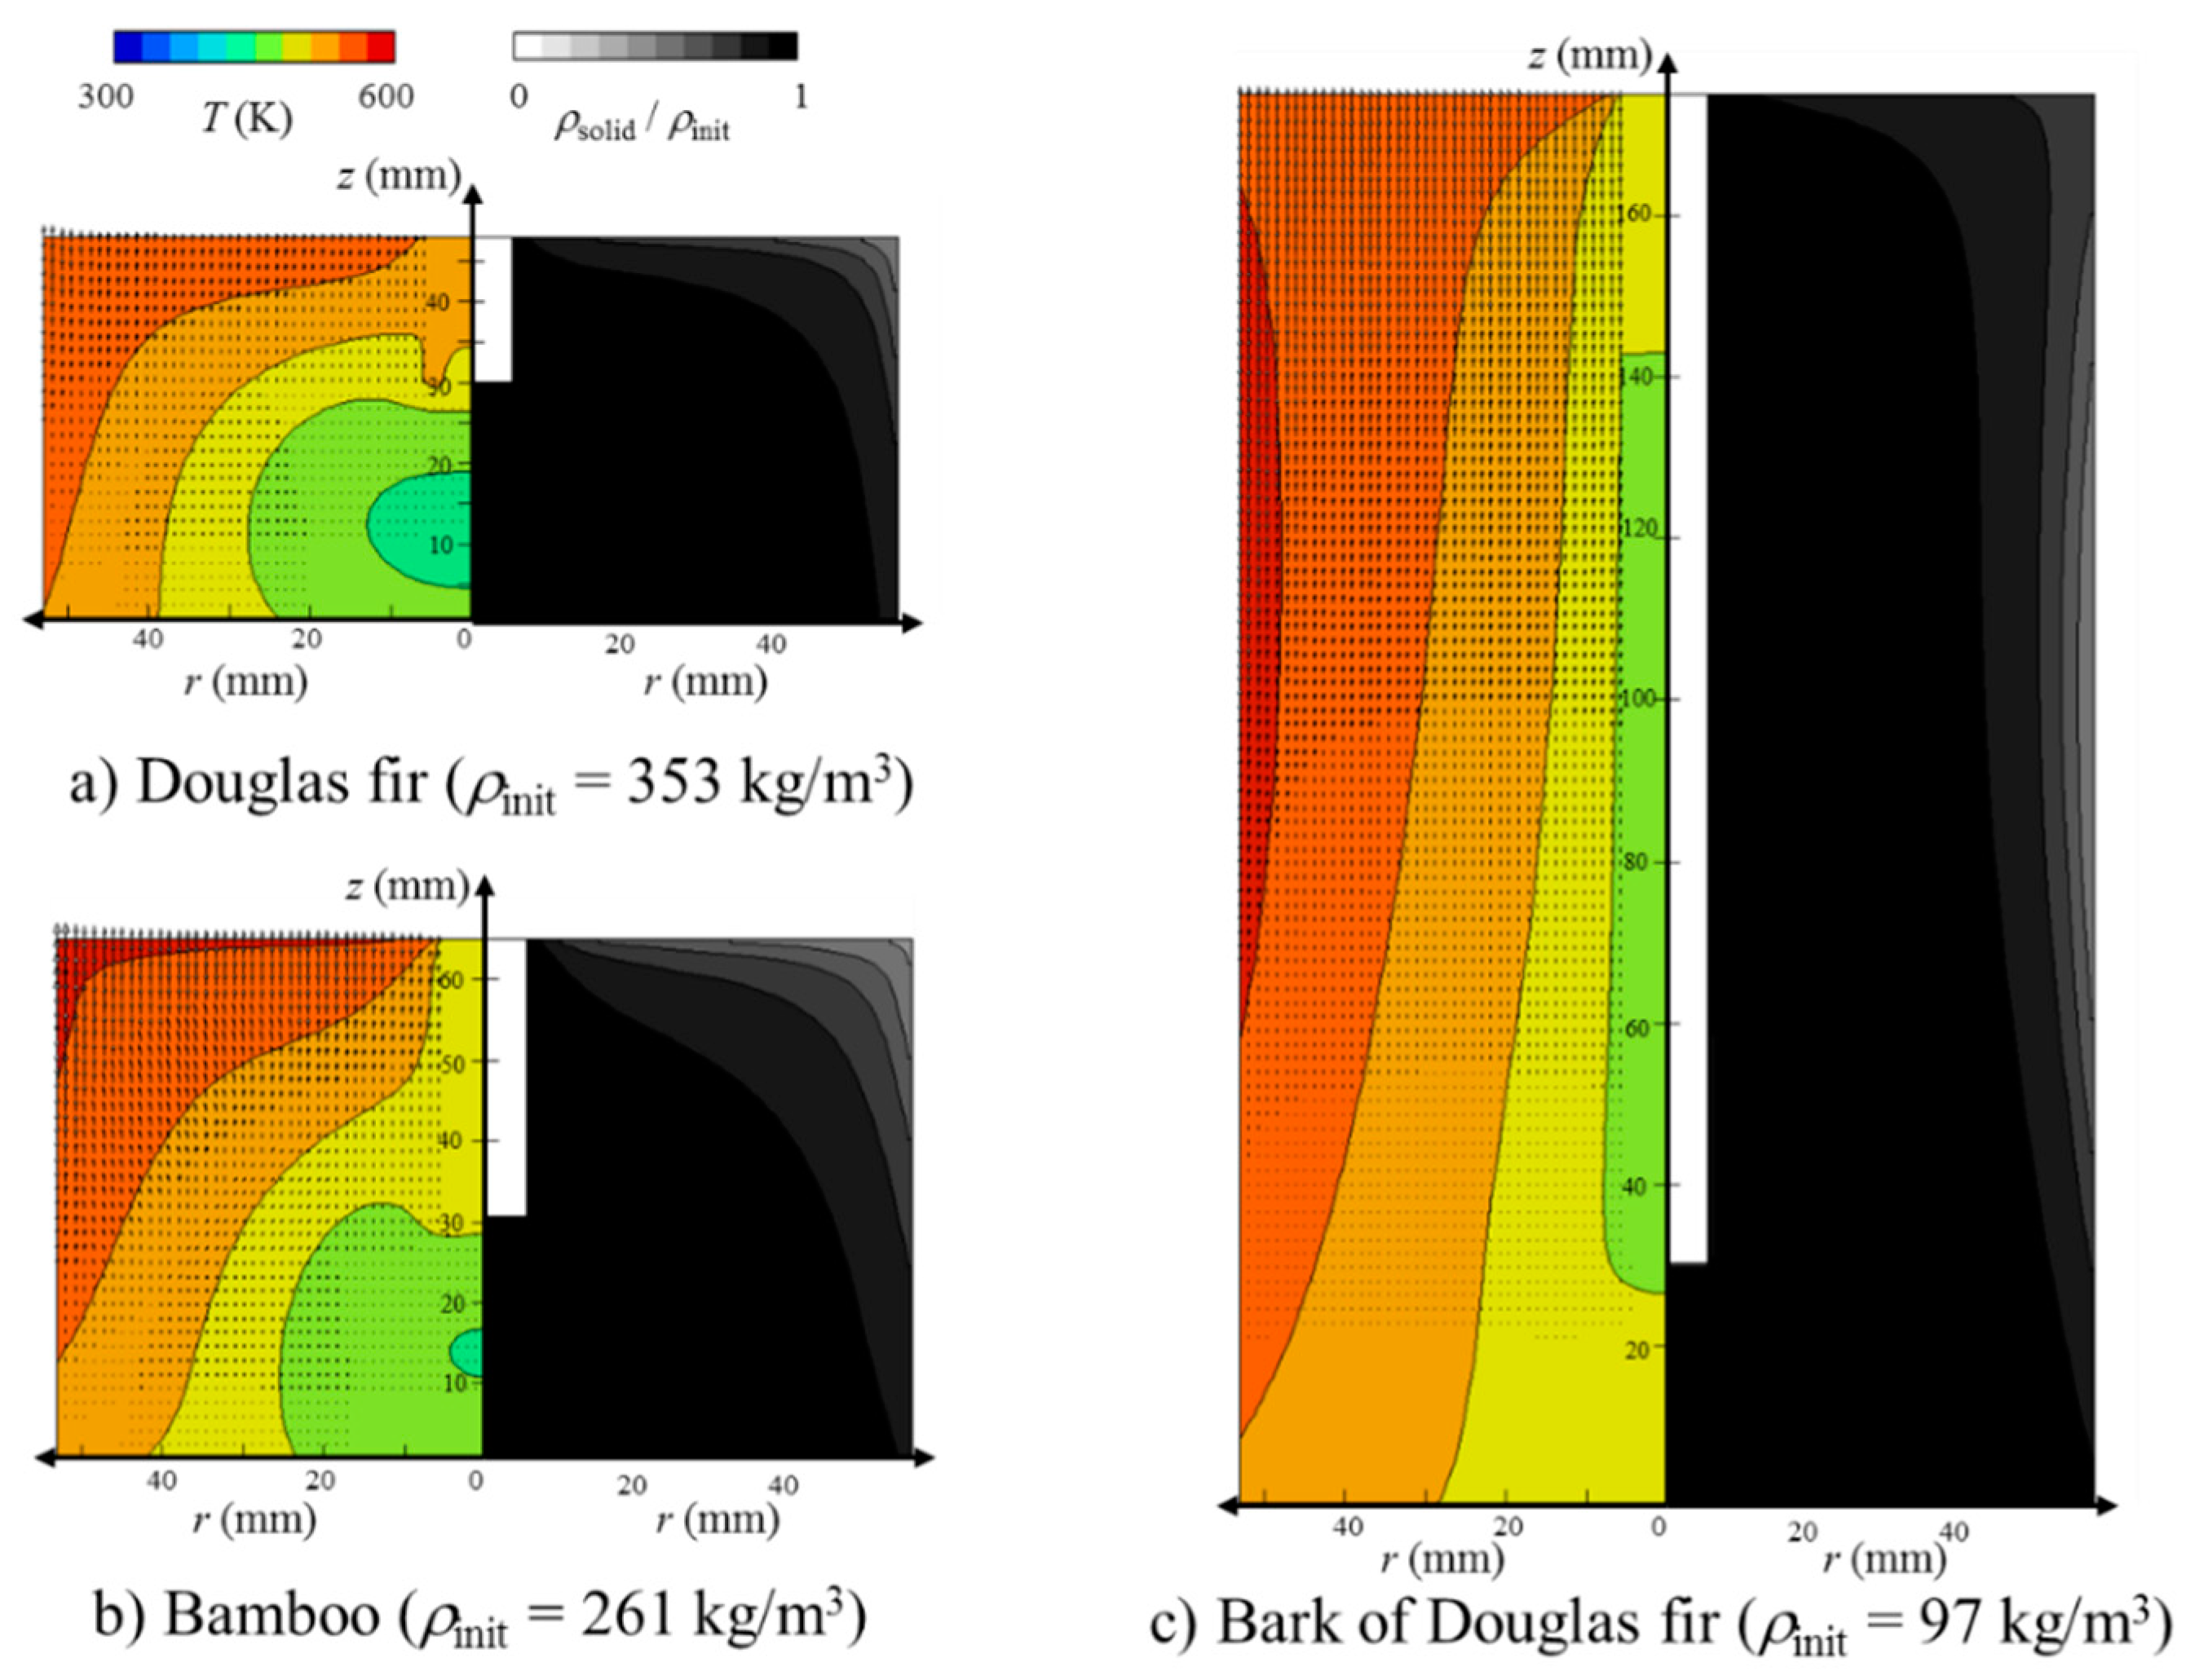
3.2. Heat and Mass Transfer during Torrefaction of Biomass
4. Conclusions
- (1)
- From DSC experiments, the cellulose pyrolysis was progressed mainly by endothermic reaction (s) while xylan pyrolysis and lignin pyrolysis were proceeded mainly by exothermic reaction (s).
- (2)
- Hemicellulose decomposition could be occurred firstly during Douglas fir torrefaction and bamboo torrefaction. And then lignin and cellulose decomposition would be occurred. So, a quasi-state gas flow rate could be observed. On the other hand, bark of Douglas fir torrefaction depends strongly on the lignin decomposition.
- (3)
- The time course of the temperature in the packed bed agreed well with that of the calculation by taking into account the heat of reaction for not only the Douglas fir, but also for bamboo and the bark of Douglas fir. On the other hand, the numerical calculation result of the gas generation flow rate during torrefaction was higher than the experimental one for all of the biomass species, because there are no data using Miller’s reaction model [9] in the low temperature range of 300 °C. It is also necessary to study the heat transfer and gas generation behavior of cellulose, lignin, and hemicellulose, which are the major components of biomass at around 300 °C. Furthermore, it is necessary to reexamine the pyrolysis model with reference to Di Blasi’s experiment [29] regarding the reaction rate constants k2 and k3 of the second step in the Miller model [9].
- (4)
- The zone at temperatures higher than 540 K prevailed (volume faction = 0.83) at 180 min. Together with the high temperature zone propagation, the local SD of the bed became smaller with a similar profile. Surprisingly, the decreased solid density (SD) propagation was not as significant as the temperature propagation in the bed. In other words, the SD decrease propagation showed a certain time delay of 60 to 90 min in comparison with the temperature profile propagation. This may be related to the sweep gas flow profile, time required for completing the reaction, or the difference between primary decomposition (k1) and secondary decomposition (k2 and k3) in the bed. In order to clarify this point of “what caused this delay?”, further investigation is required. As the temperature at the wall and top surface of the packed bed was higher than 500 K, the decomposition started from the corner of the top surface. With the elapsed time, the temperature near the region of the packed bed was higher than 500 K, and the decomposition was propagated. At t = 180 min, the Douglas fir packed bed at the region of the top and near the wall decomposed to about 70% of the initial packed bed, while the Douglas fir packed bed at the other region could not be pyrolyzed.
- (5)
- For the bamboo powder torrefaction, the temperature in the packed bed was higher than that for the Douglas fir torrefaction because of the bulk density. Furthermore, as the greatest mass percentage of the major component in the bamboo was xylan, the decomposition rate in the bamboo packed bed was higher than that in the Douglas fir packed bed. As the greatest mass percentage of the major component in the bark of Douglas fir was lignin, the decomposition rate was higher than that in the Douglas fir packed bed. The volume faction of the bed at temperatures higher than 500 K at 75 min was 0.89, 0.85, and 0.99 for bamboo, and Douglas fir and its bark, respectively. It was found that the effective thermal conductivity was the determining factor for this difference, because the effective thermal conductivity of the bed at temperatures higher than 540 K at 75 min was 0.0254, 0.0252, and 0.0303 W/(m2 K) for bamboo, and Douglas fir and its bark, respectively. Overall, the bamboo torrefaction was the highest in this study.
Author Contributions
Funding
Acknowledgments
Conflicts of Interest
Nomenclature
| C | Heat capacity (J/(kg K)) |
| e | Emissivity |
| HB | Height of biomass packed bed (m) |
| h | Heat transfer coefficient between biomass and gas (W/(m2K)) |
| ΔHR,endo.,i | Endothermic heat of reaction during pyrolysis of biomass major component i (J/kg) |
| ΔHR,exo.,i | Exothermic heat of reaction during pyrolysis of biomass major component i (J/kg) |
| i | Major component i of biomass (i = cellulose, hemicellulose, and lignin) |
| k1,i, k2,i, k3,i | Reaction rate constant in Miller’s chemical reaction model for component i [9] (1/s) |
| MTar | Molecular weight of tar (= 0.11 kg/mol [22]) |
| MGas | Molecular weight of gas (= 0.38 kg/mol [22]) |
| m0 | Input mass of TG and DSC experiments (kg) |
| N | Maximum grid number |
| P | Pressure (Pa) |
| qbase | Heat flow of the base line from the endothermic chemical reaction to the exothermic chemical reaction (J/s) |
| qDSC | Heat flow in DSC curve (J/s) |
| Ri | Reaction rates in Miller’s chemical reaction model for component i [9] (kg/(m3s)) |
| R0 | Universal gas constant (= 8.314 J/(mol K)) (J/(mol K)) |
| r | r coordinate in the packed bed (mm) |
| STar | Reaction rate of tar for component i (kg/(m3s)) |
| SGas | Reaction rate of gas for component i (kg/(m3s)) |
| T | Temperature (K) |
| TRS,i | Temperature at reaction start time in TG curve for component i (K) |
| TRE,i | Temperature at reaction end time in TG curve for component i (K) |
| Tshift,i | Temperature at the shifted time from the endothermic chemical reaction to the exothermic chemical reaction in TG curve for component i (K) |
| tRS,i | Reaction start time in TG curve for component i (s) |
| tRE,i | Reaction end time in TG curve for component i (s) |
| tshift,i | Shifted time from the endothermic chemical reaction to the exothermic chemical reaction in the TG curve for component i (s) |
| U | Volume averaged Darcy’s velocity along the r-axis in the packed bed (m/s) |
| W | Volume averaged Darcy’s velocity along the z-axis in the packed bed (m/s) |
| z | z coordinate in the packed bed (mm) |
| Greek symbol | |
| βi | kinetic parameter in Miller’s chemical reaction model for component i [9] |
| ε | Porosity in the packed bed |
| κ | Permeability in the packed bed (m2) |
| λ | Thermal conductivity (W/(mK)) |
| μ | Viscosity (Pa s) |
| ρ | Density (kg/m3) |
| σ | Stefan–Boltzman constant (= 5.669 × 10⁻⁸ W/m2K4) (W/m2K4) |
| Subscript | |
| a | Atmosphere |
| Char | Char |
| eff | Effective |
| Gas | Gas |
| im | Intermediate material |
| init | Initial value |
| N2 | Nitrogen |
| r | r component |
| s | Solid |
| Tar | Tar |
| v | Volatile |
| wall | Wall of the stainless-steel tube |
| z | z component |
| ∞ | Environmental condition on the wall of the stainless-steel tube |
References
- Hisam, S.M.; Uemura, Y.; Tazli, A.M. Effects of Temperature and Concentration of Oxygen on Torrefaction of Empty Fruit Bunches. J. Jpn. Inst. Energy 2016, 95, 1110–1114. [Google Scholar]
- Yoshida, T.; Kubojima, Y.; Kamikawa, D.; Kiguchi, M.; Tanaka, K.; Miyago, M.; Masui, M.; Ohyabu, Y.; Kobayashi, A.; Igarashi, H. Production Test of Torrefied Woody Biomass Solid Fuel in an Original Small-scale Plant. J. Jpn. Inst. Energy 2018, 97, 231–235. [Google Scholar] [CrossRef]
- Chen, W.H.; Chen, J.; Peng, J.; Bi, X.T. A state-of-the-art review of biomass torrefaction, densification and applications. Renew. Sustain. Energy Rev. 2015, 44, 847–866. [Google Scholar] [CrossRef]
- Ribeiro, J.M.C.; Godina, R.; Matias, J.C.D.O.; Nunes, L.J.R. Future perspectives of biomass torrefaction: Review of the current state-of-the-art and research development. Sustainability 2018, 10, 2323. [Google Scholar] [CrossRef]
- Rodrigues, A.; Loureiro, L.; Nunes, L.J.R. Torrefaction of woody biomasses from poplar SRC and Portuguese roundwood: Properties of torrefied products. Biomass Bioenergy 2018, 108, 55–65. [Google Scholar] [CrossRef]
- Nunes, L.J.; Matias, J.C. Biomass Torrefaction as a Key Driver for the Sustainable Development and Decarbonization of Energy Production. Sustainability 2020, 12, 922. [Google Scholar] [CrossRef]
- Loureiro, L.M.; Nunes, L.J.; Rodrigues, A.M. Woody biomass torrefaction: Fundamentals and potential for Portugal. Silva Lusit. 2017, 25, 35–63. [Google Scholar]
- Filipe dos Santos Viana, H.; Martins Rodrigues, A.; Godina, R.; Carlos de Oliveira Matias, J.; Jorge Ribeiro Nunes, L. Evaluation of the physical, chemical and thermal properties of Portuguese maritime pine biomass. Sustainability 2018, 10, 2877. [Google Scholar] [CrossRef]
- Miller, R.S.; Bellan, J. A Generalized Biomass Pyrolysis Model Based on Superimposed Cellulose, Hemicellulose and Liqnin Kinetics. J. Comb. Sci. Tech. 1997, 126, 97–137. [Google Scholar] [CrossRef]
- Di Blasi, C. Numerical simulation of cellulose pyrolysis. Biomass Bioenergy 1994, 7, 87–98. [Google Scholar] [CrossRef]
- Kawamoto, H. Reactions and molecular mechanics of cellulose pyrolysis. Mokuzai Gakkaishi 2015, 61-1, 1–24. [Google Scholar] [CrossRef]
- Mok, W.S.L.; Antal, M.J., Jr. Effects of pressure on biomass pyrolysis. II. Heats of reaction of cellulose pyrolysis. Themochimica Acta 1983, 68, 165–186. [Google Scholar] [CrossRef]
- Milosavljevic, I.; Oja, V.; Suuberg, E.M. Thermal Effects in Cellulose Pyrolysis: Relationship to Char Formation Processes. Ind. Eng. Chem. Res. 1996, 35, 653–662. [Google Scholar] [CrossRef]
- Ratha, J.; Wolfingera, M.G.; Steinera, G.; Krammera, G.; Barontinib, F.; Cozzanib, V. Heat of wood pyrolysis. Fuel 2003, 82, 81–91. [Google Scholar] [CrossRef]
- Gomez, C.; Velo, E.; Barontini, F.; Cozzani, V. Influence of Secondary Reactions on the Heat of Pyrolysis of Biomass. Ind. Eng. Chem. Res. 2009, 48, 10222–10233. [Google Scholar] [CrossRef]
- Joungmo, C.; Jeffrey, M.D.; George, W.H. The Intrinsic Kinetics and Heats of Reactions for Cellulose Pyrolysis and Char Formation. ChemSusChem 2010, 3, 1162–1165. [Google Scholar]
- Richard, B.B.; Ahmed, F.G. Biomass torrefaction: Modeling of reaction thermochemistry. Bioresour. Technol. 2013, 134, 331–340. [Google Scholar]
- Yang, H.; Yan, R.; Chen, H.; Lee, D.H.; Zheng, C. Characteristics of hemicellulose, cellulose and lignin pyrolysis. Fuel 2007, 86, 1781–1788. [Google Scholar] [CrossRef]
- Di Blasi, C. Modeling chemical and physical processes of wood and biomass pyrolysis. Prog. Ener. Comb. Sci. 2008, 34, 47–90. [Google Scholar] [CrossRef]
- Pyle, D.L.; Zaror, C.A. Heat transfer and kinetics in the low temperature pyrolysis of solids. Chem. Eng. Sci. 1984, 39-1, 147–158. [Google Scholar] [CrossRef]
- Koufopanos, C.A.; Papayannakos, N. Modelling of the Pyrolysis of Biomass Particles. Studies on Kinetics, Thermal and Heat Transfer Effects. Can. J. Chem. Eng. 1991, 69, 908–915. [Google Scholar] [CrossRef]
- Won, C.P.; Arvind, A.; Howard, R.B. Experimental and theoretical investigation of heat and mass transfer processes during wood pyrolysis. Combust. Flame 2010, 157, 481–494. [Google Scholar]
- Okekunle, P.O.; Pattanotai, T.; Watanabe, H.; Okazaki, K. Numerical and Experimental Investigation of Intra-Particle Heat Transfer and Tar Decomposition during Pyrolysis of Wood Biomass. J. Therm. Sci. Technol. 2011, 6, 360–375. [Google Scholar] [CrossRef]
- Tanoue, K.; Suetomi, T.; Nishimura, T.; Taniguchi, M.; Sasauchi, K. Thermal conduction and gas generation undergoing pyrolysis in the packed bed of woody biomass. J. Jpn. Inst. Energ. 2012, 91, 976–984. (In Japanese) [Google Scholar] [CrossRef]
- Tanoue, K.; Suetomi, T.; Uemura, Y.; Nishimura, T.; Taniguchi, M.; Sasauchi, K. Effect of Tar Decomposition On Gas Generation During Pyrolysis in Packed Bed of Woody Biomass. Int. J. Biomass Renew. 2013, 2, 1–6. [Google Scholar]
- Tanoue, K.; Hamaoka, Y.; Nishimura, T.; Taniguchi, M.; Sasauchi, K. Influence of Volume Shrinkage and Water Evaporation on Heat Transfer and Chemical Reactions During the Pyrolysis of A Cellulose-Powder-Packed Bed. Int. J. Biomass Renew. 2018, 7, 1–16. [Google Scholar]
- Zhang, S.; Su, Y.; Ding, K.; Zhu, S.; Zhang, H.; Liu, X.; Xiong, Y. Effect of inorganic species on torrefaction process and product properties of rice husk. Bioresour. Technol. 2018, 265, 450–455. [Google Scholar] [CrossRef]
- Sluiter, A.; Hames, B.; Scarlata, R.C.; Sluiter, J.; Templeton, D.; Crocker, D. Determination of structural carbohydrates and lignin in biomass. Lab. Anal. Proced. 2008, 1617, 1–16. [Google Scholar]
- Di Blasi, C.; Lanzetta, M. Intrinsic kinetics of isothermal xylan degradation in inert atmosphere. J. Anal. Appl. Pyrolysis 1997, 40, 287–303. [Google Scholar] [CrossRef]


| Biomass Species | Component (wt%) | |||||
|---|---|---|---|---|---|---|
| Cellulose | Hemicellulose | Lignin | Others | |||
| Xylan | Arabinan | Mannan | ||||
| Bamboo | 34.1 | 25.2 | 2.3 | 0.2 | 24 | 14.2 |
| Douglas fir | 42.5 | 2.8 | 1.1 | 14 | 22 | 17.6 |
| Bark of Douglas fir | 25.4 | 3.3 | 0.9 | 3.9 | 51 | 15.5 |
| Component i | TRS,i (K) | TRE,i (K) | Tshift,i (K) | −ΔHR,endo.,i (kJ/kg) | −ΔHR,exo.,i (kJ/kg) |
|---|---|---|---|---|---|
| Cellulose | 560 | 638 | 607 | −125.8 | 22.6 |
| Xylan | 371 | 602 | 477 | −56.4 | 245.0 |
| Lignin | 491 | 682 | 549 | −62.9 | 127.1 |
| Biomass Species | Particle Size (µm) | Bulk Density (kg/m3) | Height of Biomass Packed Bed, HB (mm) |
|---|---|---|---|
| Bamboo | 196 | 254 | 85 |
| Douglas fir | 317 | 311 | 68 |
| Bark of Douglas fir | 222 | 122 | 170 |
| Chemical Reaction Model [9] |  |
|---|---|
| Energy balance | where, |
| Mass balance for component i | |
| Mass balance for intermediate material of component i | |
| Mass balance for char i | |
| Mass balance for tar i | |
| Mass balance for gas i | |
| Pressure equation | |
| Darcy’s law |
© 2020 by the authors. Licensee MDPI, Basel, Switzerland. This article is an open access article distributed under the terms and conditions of the Creative Commons Attribution (CC BY) license (http://creativecommons.org/licenses/by/4.0/).
Share and Cite
Tanoue, K.-i.; Hikasa, K.; Hamaoka, Y.; Yoshinaga, A.; Nishimura, T.; Uemura, Y.; Hideno, A. Heat and Mass Transfer during Lignocellulosic Biomass Torrefaction: Contributions from the Major Components—Cellulose, Hemicellulose, and Lignin. Processes 2020, 8, 959. https://doi.org/10.3390/pr8080959
Tanoue K-i, Hikasa K, Hamaoka Y, Yoshinaga A, Nishimura T, Uemura Y, Hideno A. Heat and Mass Transfer during Lignocellulosic Biomass Torrefaction: Contributions from the Major Components—Cellulose, Hemicellulose, and Lignin. Processes. 2020; 8(8):959. https://doi.org/10.3390/pr8080959
Chicago/Turabian StyleTanoue, Ken-ichiro, Kentaro Hikasa, Yuuki Hamaoka, Akihiro Yoshinaga, Tatsuo Nishimura, Yoshimitsu Uemura, and Akihiro Hideno. 2020. "Heat and Mass Transfer during Lignocellulosic Biomass Torrefaction: Contributions from the Major Components—Cellulose, Hemicellulose, and Lignin" Processes 8, no. 8: 959. https://doi.org/10.3390/pr8080959
APA StyleTanoue, K.-i., Hikasa, K., Hamaoka, Y., Yoshinaga, A., Nishimura, T., Uemura, Y., & Hideno, A. (2020). Heat and Mass Transfer during Lignocellulosic Biomass Torrefaction: Contributions from the Major Components—Cellulose, Hemicellulose, and Lignin. Processes, 8(8), 959. https://doi.org/10.3390/pr8080959