Article

Hydrogenation of Trans,Trans-Muconic Acid to Bio-Adipic Acid: Mechanism Identification and Kinetic Modelling

by
Alessandro Rosengart
1,†,
Carlo Pirola
2 and
Sofia Capelli
2,*,†
1
Chemistry Department, Università degli Studi di Milano, Via Golgi 19, 20133 Milan, Italy
2
VTU Engineering, Via G. di Vittorio n. 16, 39100 Bolzano, Italy
*
Author to whom correspondence should be addressed.
These Authors have equally contributed to the present work.
Processes 2020, 8(8), 929; https://doi.org/10.3390/pr8080929
Submission received: 13 July 2020 / Revised: 29 July 2020 / Accepted: 31 July 2020 / Published: 2 August 2020

Abstract

:
The hydrogenation of trans,trans-muconic acid was investigated on a Pt/C 5% (wt) catalyst in a batch slurry reactor at constant hydrogen pressure (4 bar) and temperature (323, 333 and 343 K), with the purpose of developing a kinetic model able to predict conversions and product distributions. A dual-site Langmuir–Hinshelwood–Hougen–Watson (LHHW) model with hydrogen dissociation provided good fitting of the experimental data. The model parameters were regressed by robust numerical methods to overcome the computational challenges of the model parameters’ collinearity. Different reaction mechanisms were tested; the best model involved two subsequent hydrogenation steps. The first step yielded from trans,trans-muconic acid a monounsaturated intermediate (trans-2-hexenedioic acid), which was further hydrogenated to adipic acid in the second step. The intermediate was subjected to an equilibrium isomerization with cis-2-hexenedioic acid. The activation energy values and the rate constants were calculated for the reactions, providing the first reference for trans,trans-muconic acid hydrogenation.

1. Introduction

Muconic acid (MA) is a bio-derived dicarboxylic acid, which has the potential for becoming a strategic intermediate for the polyamide and polyester industry [1,2,3]. Intensive biotechnological research has identified a number of genetically engineered strains able to produce cis,cis-muconic acid (ccMA) in quantitatively significant amounts from different feedstock [4,5,6]. Some engineered strains have achieved the best conversions to date, in particular, strains of Escherichia coli starting from glucose [7,8] and of Pseudomonas putida from aromatics [9,10]. The feedstock flexibility is particularly relevant as both the cellulosic and lignin fractions of the biomass could be employed as cheap and abundant raw materials, opening the door to second generation biorefinery applications for fully sustainable adipic acid production [11]. Additionally, Saccharomyces cerevisiae was proved effective in converting sugars to MA, paving the way to future low-cost industrial fermentations [12,13]. The reason for the strong interest toward the efficient production of ccMA and its cis,trans and trans,trans isomers is explained by the versatility of these compounds for the production of strategic bulk chemicals. For example, MA and its partially hydrogenated derivative 3-hexenedioic acid can be used for the production of unsaturated polyesters (UPE) [14,15,16]. Upon undergoing the Diels–Alder reaction, MA provides a class of aromatic monomers including terephthalic acid and esters [17,18]. However, the most attractive application in the short term is the possibility to use MA to produce adipic acid (AA) [19], the main building block in the polyamide industry (PA6 and PA6,6). This can be achieved by performing a complete hydrogenation of the unsaturated MA bonds [6]. The bio-derived AA would enter a market of 2.6 Mton/year, offering a green alternative to the traditional petro-chemical process, which still causes serious safety and environmental concerns [20]. A consistent number of scientific publications has addressed the catalytic hydrogenation of MA: Table 1 provides a short overview of the most relevant contributions in the literature. Surprisingly, only qualitative insights into the reaction’s mechanism have been published to date [21], and very few attempts have been made to ensure the technological scalability of the reaction [22]. In fact, these early studies on catalyst selection aimed at demonstrating the reaction’s feasibility, rather than performing the optimization of the reaction’s parameters such as temperature, pressure catalyst/substrate ratio and reaction duration. Focusing on the data of Table 1, it is possible to see how the reaction scalability is subject to a complicated trade-off. As a general indication, to achieve good yields and short reaction times, high concentrations of noble catalysts or higher pressures and temperatures are required, which, however, would result in higher production costs. Additionally, the choice of the reaction solvent is important: organic solvents allow more concentrated reactions, but aqueous hydrogenations are still preferable due to safety and environmental reasons. Recently, the authors achieved the complete conversion of MA to AA on a commercial Pt/C (5% wt) catalyst in aqueous media, in a batch stirred reactor at mild temperature (50–70 °C) and mild hydrogen pressure (4 bar) [23]. These promising results, together with the development of robust analytical methods to identify the reaction intermediates [24], encouraged this first detailed kinetic study on muconic acid hydrogenation, here presented. The problem of estimating the hydrogenation kinetic constants has been treated only cursorily in the literature, focusing on limited data points and providing an indication of the sole muconic acid hydrogenation apparent activation energy [10]. Still, a kinetic study is a necessary step from the perspective of a scale up of the reaction, as the definition of a reaction model can provide also better insights into the pathways of MA hydrogenation by comparing different reaction mechanisms, leading to a rational optimization of the reaction conditions. Additionally, a reaction model can be useful for simulating and comparing industrial reactor configurations, to better assess the economics of catalytic hydrogenation against those of technologies concurrently under development, such as the recently proposed electrocatalytic hydrogenation [24].

2. Materials and Methods

2.1. Experimental

The used reactants were trans,trans-muconic acid (ttMA) (Sigma Aldrich) and ultra-high-purity hydrogen (Sapio 99.9%). AA was prepared by the hydrogenation of ttMA over a commercial 5% Pt/C catalyst (Sigma Aldrich). The catalyst is characterized by a mean grain size of about 40 µm. The hydrogenation of ttMA was performed in an autoclave equipped with temperature and pressure control. The catalyst (in the amount of 0.1 g) was pre-treated in a hydrogen atmosphere at 6 bar and 260 °C for 3 h. Then, it was cooled to room temperature, and 10 mL of a 0.07 M aqueous solution of ttMA (sodium salt) was added. The reaction mixture was heated at the desired temperature and stirred with a magnetic stirrer at 800 rpm. All the tests were performed at 4 bar of static hydrogen. The reaction was then quenched with nitrogen at different reaction times, and the catalyst was removed immediately by filtration. ttMA conversion was measured by UV-Vis analysis on the filtered sample, while selectivity was evaluated after performing a Fischer esterification reaction on the dried sample for 48 h in methanol. The analysis of the esterified products was performed with a gas chromatograph (GC Master Dani) equipped with a column Supelcowax 10 (60 m × 0.53 mm i.d., 1 µm) and a thermal conductivity detector (TCD) detector. Details of the UV-Vis and GC/TCD analyses, together with an extensive characterization of the catalyst and the reaction equipment, are reported by Capelli et al. [23]. The reactor was demonstrated to guarantee a kinetic regime, which excludes any mass transfer limitation between the gas, liquid and solid phases [23].
The kinetic experimental points were taken by tracking the conversion profiles at different temperatures (323, 333 and 343 K), maintaining the other reaction conditions unaltered. The dissolved-hydrogen-in-water values were calculated in PRO/II 9.1 (Invensys systems Inc) using the NRTL model with Henry’s law expression. As the hydrogen pressure was kept constant (4 bar) and the solvent/substrate ratio was high (70:1 by weight), the dissolved hydrogen concentration could be assumed to be constant throughout the reaction [31]. Finally, the kinetic study was performed only on the ttMA isomer, to simplify the design of experiments and reduce the degrees of freedom of the reaction. An application on a real fermentation broth would probably deal with mixtures of MA isomers (cis,cis/cis,trans/trans,trans), because the MA-producing microorganisms yield the cis,cis form, which can isomerize during the product recovery steps [32].
However, the analysis of the sole ttMA has many advantages. In the first place, due to the lower solubility and higher heat of formation, ttMA is the most stable of the possible isomers [24].
Hence, the temperature and pressure optimized for ttMA hydrogenation can be readily applied for the other isomers, leaving space for further optimization. Second, the formation of other possible intermediates (i.e., 3-hexanedioic acid), which were detected during ccMA hydrogenation [21], is limited, as their amount is negligible during ttMA reduction [28,33]. Third, with the purpose of mechanism modelling, the use of ttMA allows the exclusion of the sterically hindered isomerization equilibria between cis,cis, cis,trans and trans,trans, which allows the removal of parallel or concurrent pathways. This further simplifies the parameter regression. The original dataset used for the model parameter regression is reported in Table S1.

2.2. Kinetic Modelling

The Langmuir–Hinshelwood–Hougen–Watson (LHHW) model was selected to define the reaction rate equations, assuming the reaction on the surface as the rate-determining step [34]. This expression decomposes the adsorption–reaction–desorption mechanism occurring on the catalyst surface into several elementary steps, allowing the consideration of the competitive adsorption equilibria of the species and the testing of the hypotheses of molecular or dissociated hydrogen reactions on the active metal. A preliminary study at constant temperature identified an LHHW competitive adsorption with a hydrogen dissociation mechanism [33]. The generic reaction rate equation is [34]:
R j = k j · C t · K H 2 · C H 2 · K i · C i ( 1 + k K k · C k ) n
K H 2 and K i are the adsorption constants for hydrogen and the species i, respectively. C i is the concentration of the species i, k j is the kinetic constant of reaction j, and Ct is concentration of the active sites. According to the parameter tables developed by Yang and Hougen, n = 3 expresses the hydrogen dissociation mechanism.
The temperature dependence of the kinetic constant can be expressed using the Arrhenius equation:
k j = A j · e x p ( E a t t , j R · T )
The adsorption constant K k ‘s temperature dependence can be modelled using the Van’t Hoff equation, but in the case of high surface coverage, the temperature dependence of the adsorption can be neglected, operating a liquid-phase hydrogenation [35]; the number of parameters can therefore be reduced. However, even if LHHW is one of the most used models in reaction engineering, its mathematical structure is barely suitable for application in nonlinear regression, because of the strongly collinear nature of the parameters, which leads to ill-conditioning problems [36]. This means that while carrying out the parameter regression, the minimization of the squared error becomes challenging even for robust solvers, and the obtained results can be deeply affected by small perturbations of the input data, which are inevitable due to the experimental error. These weaknesses are particularly important for models with many adaptive parameters and reaction steps, which involve the solution of large-size nonlinear regression problems, together with the dynamic solution of the stiff ordinary differential equations (ODEs) system derived from the material balances of the chemical species.
To reduce the computational work, a common and well-established approach is the re-parametrization of the model and the removal of the less significant parameters when possible. Equation (1) was therefore re-parametrized as:
R j = k j C i C H 2 ( 1 + k K k · C k ) 3
where the kinetic constant of the numerator   ( k j ) is expressed as a modified Arrhenius formula (Equation (4)):
k j = e x p [ A j ˜ E a t t , j R ( 1 T 1 T ¯ ) ]
where T ¯ is the average of the explored temperatures (i.e., 333 K). The constant contributions in the numerator of Equation (1) (i.e., K H 2 , K t t M A and C t ) were all combined in the factor A j ˜ , which appears as one of the arguments of the exponential function. Equation (4) is therefore equivalent to Equation (2), but, from a mathematical viewpoint, it helps in reducing the number of conditions by simplifying the optimization problem [36]. These equations could be further re-parametrized, but this would result in a difficult interpretation of the parameters, which does not allow the definition of physical constraints to the kinetic constants. The advantage of Equation (3) is that the adsorption constants of the LHHW model (or the activation energies of the Arrhenius equations) can be constrained in the known ranges available in the literature. In particular, a range between 10 and 120 kJ mol−1 for the apparent activation energy of double-bond hydrogenations on noble metal catalysts can be considered [10,31,37,38,39]. As for the adsorption constants, concentration values between 10−1 and 104 L mol−1 can be taken into account [31,40,41]. This broad range is sufficient to considerably reduce the convergence time.
The calculation of the parameters can be performed by minimizing the objective function, which is the sum of squared errors (SSE):
S S E = i ( C i , e x p C i , c a l c ) 2
where C i , c a l c and C i , e x p are, respectively, the calculated and the experimental concentration of species i.
The quality of the model was evaluated by comparing the final value of the SSE and the coefficient of determination, defined as:
R 2 ( % ) = 1 S S E i ( C i , e x p C i , e x p ¯ ) 2
where C i , e x p ¯ is the average experimental value.
The optimization method used to reach the best parameter optimization is based on the class of robust minimization of the C++ language and BzzMath library [36]. The least squares method analysis tools were used to calculate the 95% confidence interval on the regressed. Finally, to confirm the results, different solvers were used in Matlab (lsqnonlin function) and C++ (BzzMath nonLinReg).

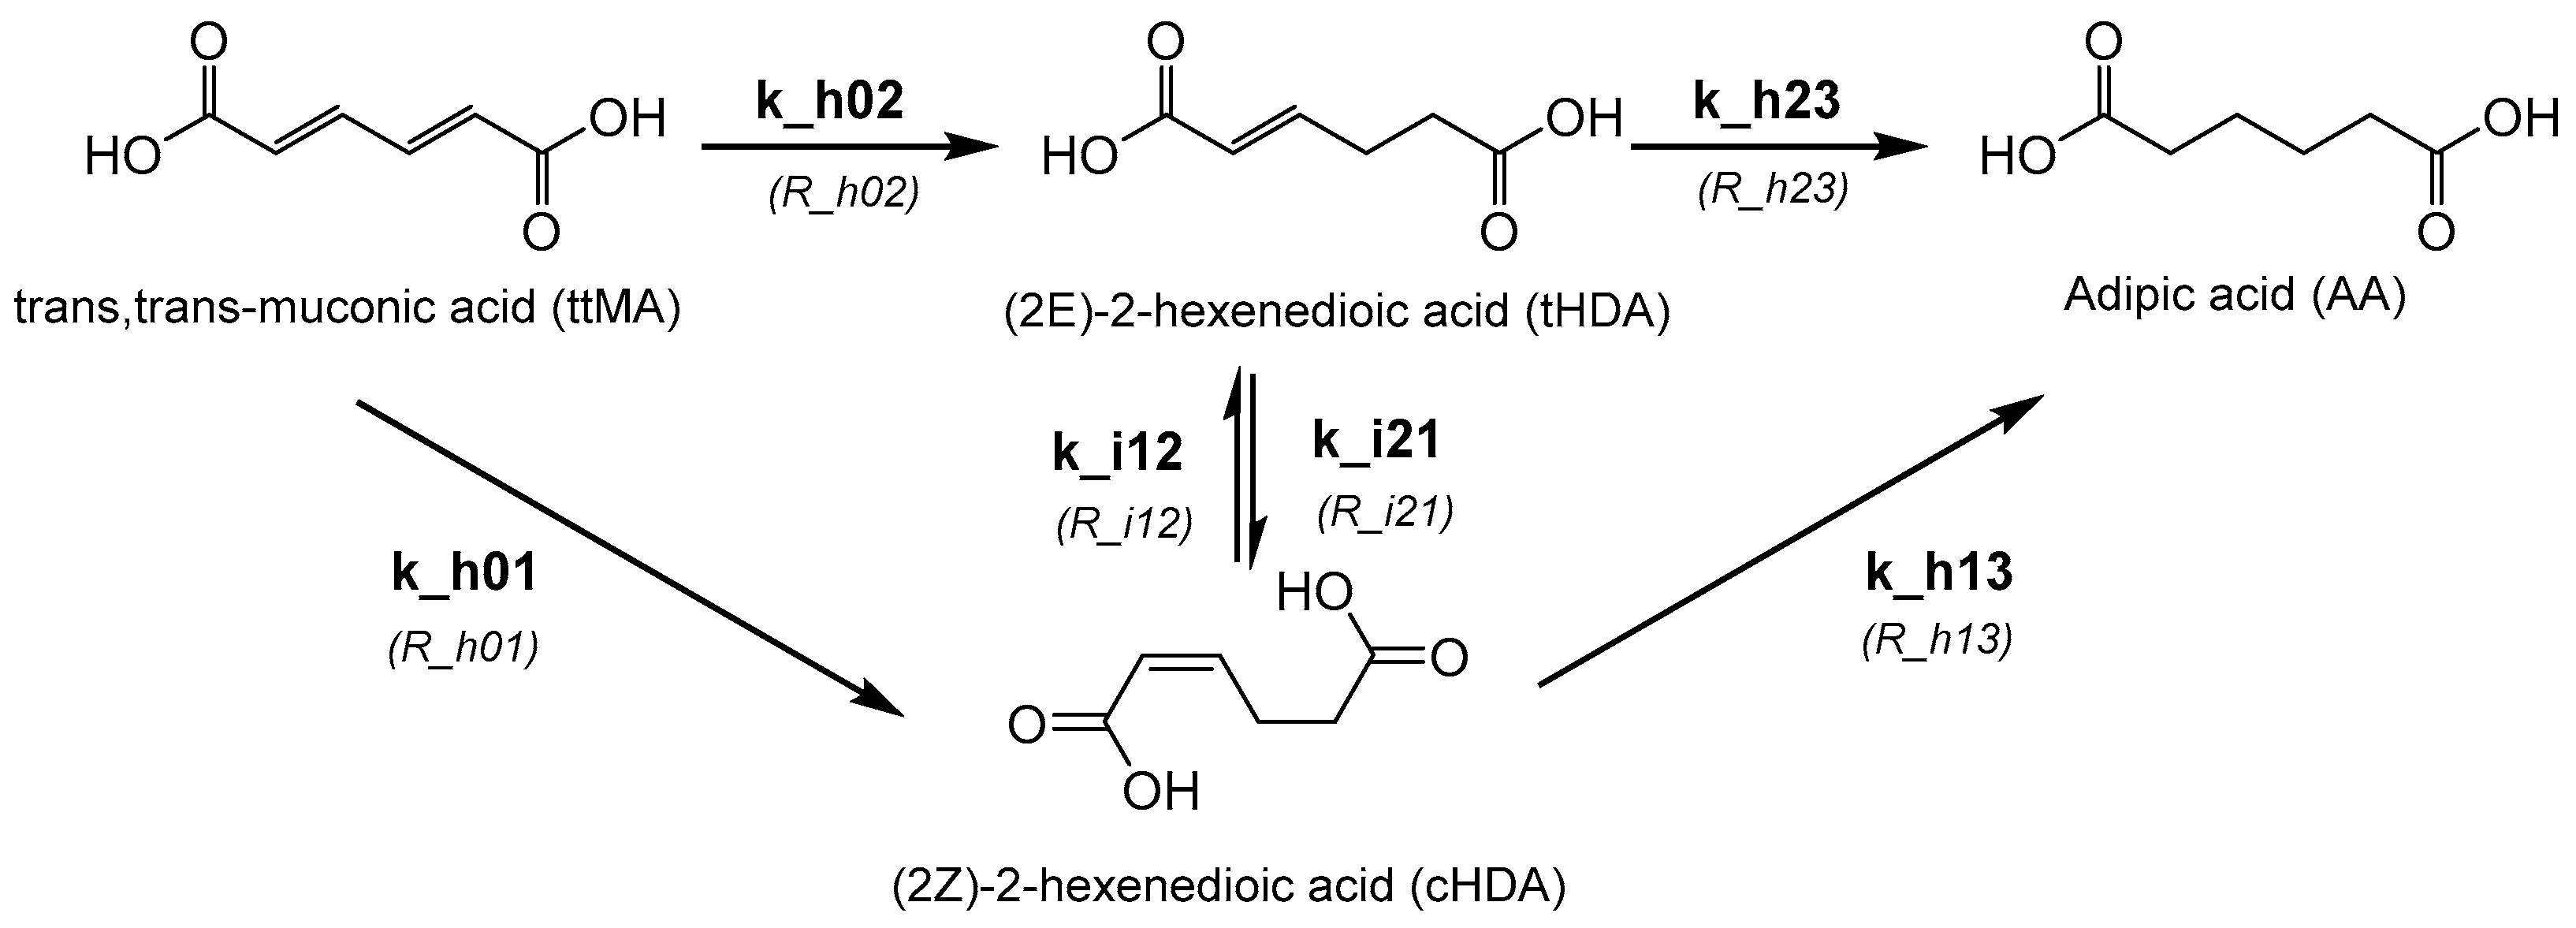
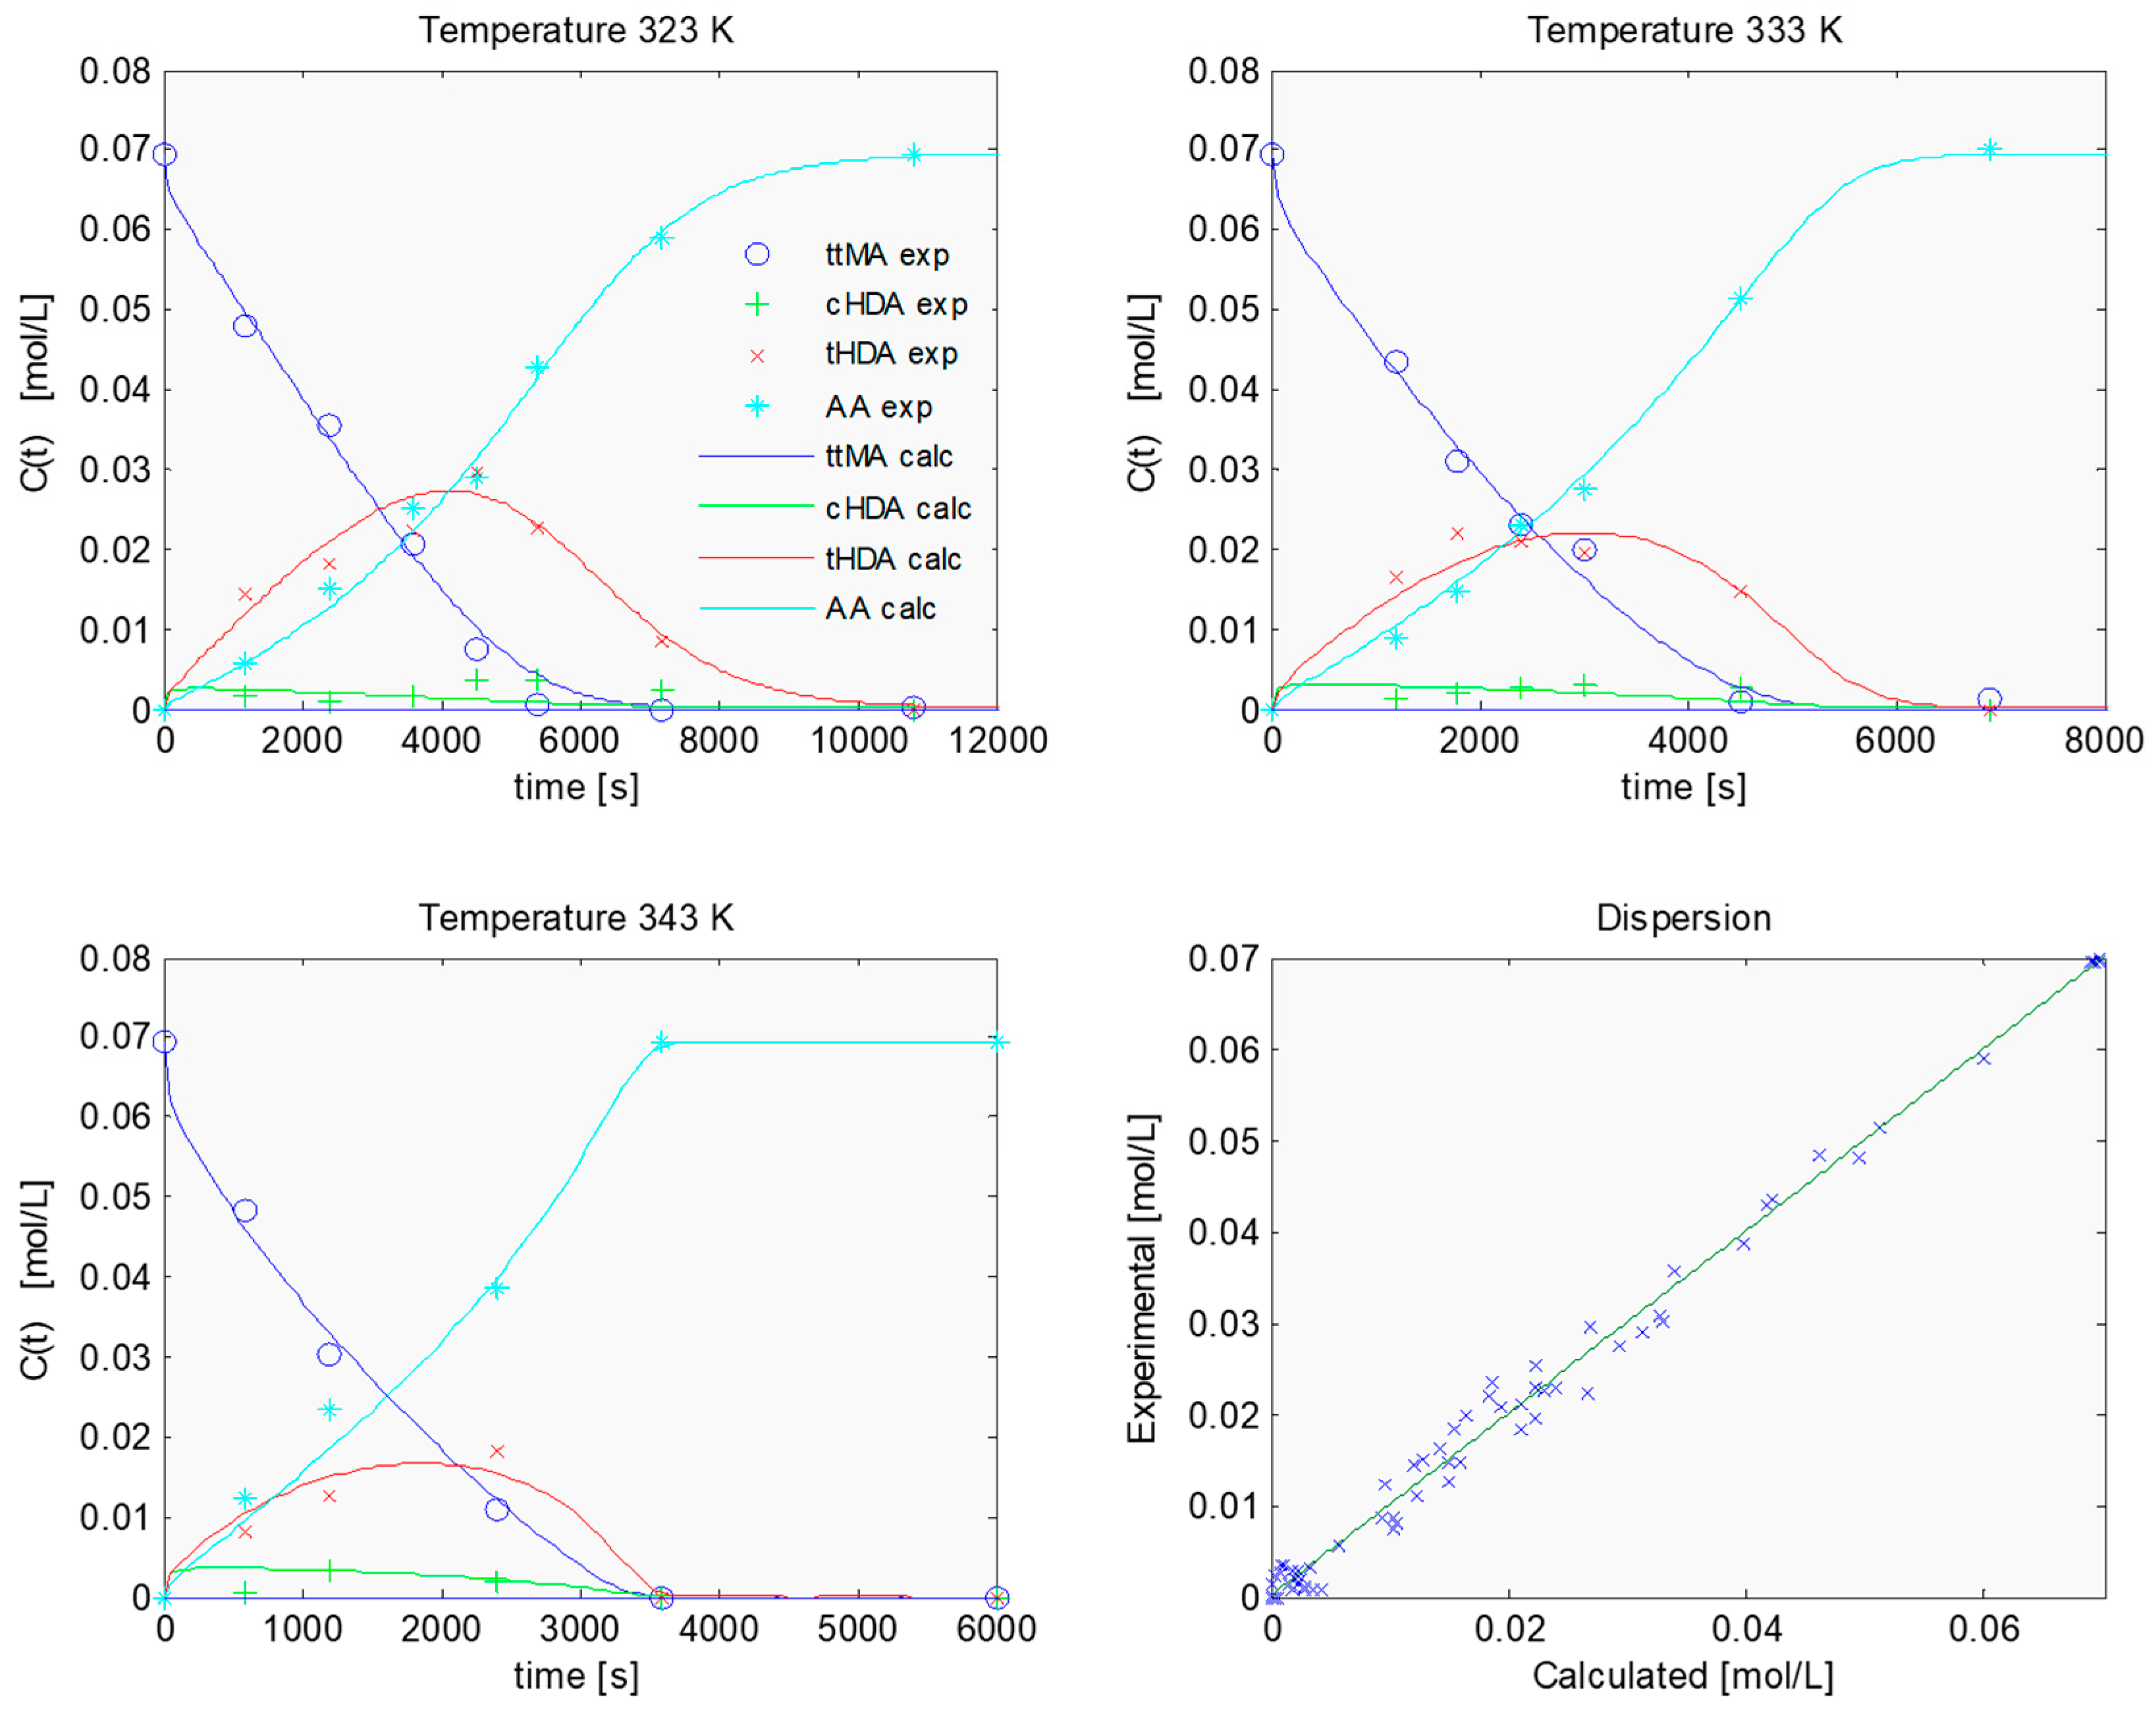
3. Results and Discussion

Figure 1 shows the hypothesized reaction mechanism obtained after several preliminary tests [33]. The first step converts ttMA to two isomers ((2Z)-2-hexenedioic acid (tHDA) and (2E)-2-hexenedioic acid (cHDA)). The reactions R_h01 and R_h02 are assumed to be irreversible. The concentration of the intermediates is regulated by an equilibrium isomerization reaction (R_i12). The second step of the reaction leads to the formation of adipic acid from both the intermediates (R_h13 and R_h23).
The set of ordinary differential equations defines the above mechanism (LHHW_17P), and it has 17 adaptive parameters (Table 2).
The results of the regression are listed in Table S2 and appear encouraging (supporting information). An R2 close to 99% was obtained, and the results of the fitting can be also appreciated considering the concentration profiles and the dispersion diagram (Figure 2).
However, the statistical analysis on the obtained parameters showed little consistency, with a large value of the confidence interval for all the parameters. This result underlines the limit of the available experimental data, which lack the calculation of the experimental error due to the long and difficult experimental workup (72 h per point).
In addition, the wide confidence intervals point out the limits of this flexible model that is able to follow the concentration profile in virtue of the many adaptive parameters (which, in case of Eah01, are also close to the boundary limit). Therefore, the LHHW_17P model was abandoned, with the view of chasing a simpler and more stable formulation.
The model was reformulated in the following way: the R_h01 reaction was excluded from the mechanism, obtaining a model with 15 parameters. In fact, the R_h01 reaction combines ttMA hydrogenation with its isomerization. However, an isomerization to a higher-energy structure in a strong reducing environment is unlikely to occur.
Despite the model LHHW_15P having a lower number of parameters, the coefficient of determination decreased by only 0.6%. At the same time, the uncertainty of the parameters sensibly decreased. Moreover, the apparent energy values were lower and in line with the value previously calculated. On the other hand, the results of the confidence limits were still unsatisfactory for gaining a reliable indication of the kinetic constants, and the model needed further simplification.
The contribution of the group K H 2 C H 2 can be neglected considering a constant H2 concentration and the value of the adsorption constant, which are small and close to lower limit [31]. Additionally, the group K A A C A A was neglected, since the adsorption constants of unsaturated compounds are much higher than those of the saturated ones.
Even though it was simplified in subsequent steps, the approximated model formulation (LHHW_13P) proved to be far more stable than the others, with a strong decrease in parameter collinearity. Only Ah02 shows unacceptable values of confidence intervals, but in this case, the reason should be identified in merely numerical disturbances, as this parameter converges to a value close to 0. The susceptibility of Arrhenius constants to numerical issues can be found in the formulation of A ˜ j, itself, which combines all those catalyst properties not explicitly included in the model formulation (as number of active sites). Another reason is the position of the adsorption constants of the reacting species at the numerator, which makes their value little interpretable by physical or chemical reasoning. A numerical sensitivity analysis on the regressed parameter was therefore performed, constraining the lower limit of Ah02 to the values of 10−5, 10−3 and 10−1 (this latter with the same order of magnitude of the similar parameter Ah23). The results are reported in Table 3; as predictable, the solver always converges to the boundary value for Ah0. Noticeably, the other parameters do not vary substantially with the major fluctuations of the other Arrhenius pre-exponential parameters, which, as already stated, carry all the approximations of the model simplification. Still, the quality of the regression did not worsen in any of the three cases, which makes all the sets of parameters acceptable. On the other hand, the third case becomes more interesting considering the narrower 95% confidence intervals. The regression results are graphically shown in Figure S1. In conclusion, it is possible to use the results of the sensitivity analysis to draw some reasonable boundaries for the estimates of the activation energy of muconic acid hydrogenation. Eah02 (ttMA to tHDA) is between the values of 27.3 and 27.5 kJ/mol, Eah23 (tHDA to AA) is between 39.7 and 40.1 kJ mol−1, Eai12 (cHDA to tHDA) is between 20.5 and 29.2 kJ mol−1, and Eai21 (tHDA to cHDA) is between 751 and 825 kJ mol−1. Taking into consideration the isomerization reaction, it is evident how the cis to trans reaction is favored. Considering the overall results, the regression shows how the estimated activation energy of the hydrogenation reaction R_h02 (first double bond) is lower than the R_h23 one (complete hydrogenation). This means that the first hydrogenation reaction is the fastest reaction step, while to completely hydrogenate the intermediates, more energy is required [42]. This also explains the measured longer persistency of the intermediate tHDA with respect to ttMA. The ease of the isomerization of cHDA to tHDA explains instead why no cHDA accumulation was observed even at low temperature. Therefore, reactions R_h01, R_i12 and R_h13 are disadvantaged using 5%Pt/AC and water as reaction media, and also can be possibly excluded when modelling the hydrogenation of cis,cis muconic acid.

4. Conclusions

A temperature-dependent dual-site LHHW model was successfully applied to the case of the dissociative hydrogenation of ttMA salts to obtain adipic acid. The hypothesized mechanism involves a two-step reaction with the formation of two intermediates, (2Z)-2-hexenedioic acid and (2E)-2-hexenedioic acid, that are in isomerization equilibrium. As expected, the use of a dual-site dissociative LHHW model led to computational regression issues, which were overcome by simplifying the model to reduce the number of regressed parameters, without losing the model’s representativeness. The final model is able to well fit the experimental data, providing the first set of reference intervals for the kinetic constants of this hydrogenation reaction, in line with the values of other similar systems. This study opens the door to further investigations, to integrate the proposed LHHW model with, for example, direct estimates of the species adsorption constants or with extended reaction conditions, paving the way toward a sustainable adipic acid industry.

Supplementary Materials

The following are available online at https://www.mdpi.com/2227-9717/8/8/929/s1. Figure S1: Results of the regression with the model LHHW_13P (Case 3). Table S1: Experimental data at different temperatures for trans,trans-muconic acid hydrogenation on Pt/C 5% at 4 bar of hydrogen. Table S2: Calculated values for the different models with 95% confidence intervals and regression metrics.

Author Contributions

Conceptualization, A.R. and S.C.; methodology, A.R.; software, A.R.; formal analysis S.C.; writing—original draft preparation, A.R. and S.C.; writing—review and editing, S.C. and C.P.; supervision, C.P. All authors have read and agreed to the published version of the manuscript.

Funding

This research received no external funding.

Conflicts of Interest

The authors declare no conflict of interest.

Abbreviations

ttMAtrans,trans-muconic acid
tHDA(2E)-2-hexenedioic acid
cHDA(2Z)-2-hexenedioic acid
AAadipic acid
LHHWLangmuir–Hinshelwood–Hougen–Watson model
SSEsum of squared errors
R2coefficient of determination

References

  1. Bart, J.C.J.; Cavallaro, S. Transiting from adipic acid to bioadipic acid. 1, Petroleum-based processes. Ind. Eng. Chem. Res. 2015, 54, 1–46. [Google Scholar] [CrossRef]
  2. Becker, J.; Lange, A.; Fabarius, C.; Wittmann, C. Top value platform chemicals: Bio-based production of organic acids. Curr. Opin. Biotechnol. 2015, 36, 168–175. [Google Scholar] [CrossRef]
  3. Collias, D.I.; Harris, A.M.; Nagpal, V.; Cottrell, L.W.; Schultheis, M.W. Biobased terephthalic acid technologies: A literature review. Ind. Biotechnol. 2014, 10, 91–105. [Google Scholar] [CrossRef]
  4. Xie, N.-Z.; Liang, H.; Huang, R.-B.; Xu, P. Biotechnological production of muconic acid: Current status and future prospects. Biotechnol. Adv. 2014, 32, 615–622. [Google Scholar] [CrossRef] [PubMed]
  5. Kruyer, N.S.; Peralta-Yahya, P. Metabolic engineering strategies to bio-adipic acid production. Curr. Opin. Biotechnol. 2017, 45, 136–143. [Google Scholar] [CrossRef] [PubMed]
  6. Polen, T.; Spelberg, M.; Bott, M. Toward biotechnological production of adipic acid and precursors from biorenewables. J. Biotechnol. 2013, 167, 75–84. [Google Scholar] [CrossRef] [PubMed]
  7. Bui, V.; Lau, M.K.; Macrare, D.; Schweitzer, D. Methods for Producing Isomers of Muconic Acid and Muconate Salts. U.S. Patent 20130030215 A1, 1 January 2013. [Google Scholar]
  8. Niu, W.; Draths, K.M.M.; Frost, J.W.W. Benzene-free synthesis of adipic acid. Biotechnol. Prog. 2002, 1, 201–211. [Google Scholar] [CrossRef] [PubMed]
  9. Johnson, C.W.; Salvachúa, D.; Khanna, P.; Smith, H.; Peterson, D.J.; Beckham, G.T.; Salvachua, D.; Khanna, P.; Smith, H.; Peterson, D.J.; et al. Enhancing muconic acid production from glucose and lignin-derived aromatic compounds via increased protocatechuate decarboxylase activity. Metab. Eng. Commun. 2016, 3, 111–119. [Google Scholar] [CrossRef] [PubMed]
  10. Vardon, D.R.; Franden, M.A.; Johnson, C.W.; Karp, E.M.; Guarnieri, M.T.; Linger, J.G.; Salm, M.J.; Strathmann, T.J.; Beckham, G.T. Adipic acid production from lignin. Energy Environ. Sci. 2015, 8, 617–628. [Google Scholar] [CrossRef]
  11. Tuck, C.O.; Perez, E.; Horváth, I.T.; Sheldon, R.A.; Poliakoff, M. Valorization of biomass: Deriving more value from waste. Science 2012, 337, 695–699. [Google Scholar] [CrossRef]
  12. Averesch, N.J.H.; Krömer, J.O. Tailoring strain construction strategies for muconic acid production in S. Cerevisiae and E. Coli. Metab. Eng. Commun. 2014, 1, 19–28. [Google Scholar] [CrossRef]
  13. Suástegui, M.; Yu Ng, C.; Chowdhury, A.; Sun, W.; Cao, M.; House, E.; Maranas, C.D.; Shao, Z. Multilevel engineering of the upstream module of aromatic amino acid biosynthesis in saccharomyces cerevisiae for high production of polymer and drug precursors. Metab. Eng. 2017, 42, 134–144. [Google Scholar] [CrossRef] [PubMed]
  14. Rorrer, N.A.; Dorgan, J.R.; Vardon, D.R.; Martinez, C.R.; Yang, Y.; Beckham, G.T. Renewable unsaturated polyesters from muconic acid. ACS Sustain. Chem. Eng. 2016, 4, 6867–6876. [Google Scholar] [CrossRef]
  15. Rorrer, N.A.; Vardon, D.R.; Dorgan, J.R.; Gjersing, E.J.; Beckham, G.T. Biomass-derived monomers for performance-differentiated fiber reinforced polymer composites. Green Chem. 2017, 19, 2812–2825. [Google Scholar] [CrossRef]
  16. Matthiesen, J.E.; Suàstegui, M.; Wu, Y.; Viswanathan, M.; Qu, Y.; Cao, M.; Rodriguez-Quiroz, N.; Okerlund, A.; Kraus, G.; Raman, D.R.; et al. Electrochemical conversion of biologically produced muconic acid: Key considerations for scale-up and corresponding technoeconomic analysis. ACS Sustain. Chem. Eng. 2016, 4, 7098–7109. [Google Scholar] [CrossRef] [Green Version]
  17. Lu, R.; Lu, F.; Chen, J.; Yu, W.; Huang, Q.; Zhang, J.; Xu, J.; Rui, L.; Lu, F.; Chen, J.; et al. Production of diethyl terephthalate from biomass-derived muconic acid. Angew. Chemie Int. Ed. 2015, 55, 249–253. [Google Scholar] [CrossRef]
  18. Frost, J.W.; Miermont, A.; Schweitzer, D.; Bui, V.; Wicks, D.A. Terephthalic and Trimellitic Based Acids and Carboxylate Derivatives Thereof. U.S. Patent US8367858 B2, 5 February 2013. [Google Scholar]
  19. Capelli, S.; Motta, D.; Evangelisti, C.; Dimitratos, N.; Prati, L.; Pirola, C.; Villa, A. Bio Adipic Acid Production from Sodium Muconate and Muconic Acid: A Comparison of Two Systems. ChemCatChem 2019, 11, 3075–3084. [Google Scholar] [CrossRef]
  20. Bart, J.C.J.; Cavallaro, S. Transiting from adipic acid to bioadipic acid. part II. Biosynthetic pathways. Ind. Eng. Chem. Res. 2015, 54, 567–576. [Google Scholar] [CrossRef]
  21. Vardon, D.R.; Rorrer, N.A.; Salvachua, D.; Settle, A.E.; Johnson, C.W.; Menart, M.J.; Cleveland, N.S.; Ciesielski, P.N.; Steirer, K.X.; Dorgan, J.R.; et al. Cis,cis-muconic acid: Separation and catalysis to bio-adipic acid for nylon-6,6 polymerization. Green Chem. 2016, 18, 3397–3413. [Google Scholar] [CrossRef]
  22. Scelfo, S.; Pirone, R.; Russo, N. Highly efficient catalysts for the synthesis of adipic acid from cis,cis-muconic acid. Catal. Commun. 2016, 84, 98–102. [Google Scholar] [CrossRef]
  23. Capelli, S.; Rosengart, A.; Villa, A.; Citterio, A.; Di Michele, A.; Bianchi, C.L.L.; Prati, L.; Pirola, C. Bio-adipic acid production by catalysed hydrogenation of muconic acid in mild operating conditions. Appl. Catal. B Environ. 2017, 218, 220–229. [Google Scholar] [CrossRef]
  24. Matthiesen, J.E.; Carraher, J.M.; Vasiliu, M.; Dixon, D.A.; Tessonnier, J.P. Electrochemical conversion of muconic acid to biobased diacid monomers. ACS Sustain. Chem. Eng. 2016, 4, 3575–3585. [Google Scholar] [CrossRef]
  25. Draths, K.M.; Frost, J.W. Environmentally compatible synthesis of adipic acid from D-glucose. J. Am. Chem. Soc. 1994, 116, 399–400. [Google Scholar] [CrossRef]
  26. Thomas, J.M.; Raja, R.; Johnson, B.F.G.; O’Connell, T.J.; Sankar, G.; Khimyak, T. Bimetallic nanocatalysts for the conversion of muconic acid to adipic acid. Chem. Commun. 2003, 1126–1127. [Google Scholar] [CrossRef]
  27. Li, X.; Wu, D.; Lu, T.; Yi, G.; Su, H.; Zhang, Y. Highly efficient chemical process to convert mucic acid into adipic acid and DFT studies of the mechanism of the rhenium-catalyzed deoxydehydration. Angew. Chemie -Int. Ed. 2014, 53, 4200–4204. [Google Scholar] [CrossRef]
  28. She, X.; Brown, H.M.; Zhang, X.; Ahring, B.K.; Wang, Y. Selective hydrogenation of trans,trans-muconic acid to adipic acid over a titania-supported rhenium catalyst. ChemSusChem 2011, 4, 1071–1073. [Google Scholar] [CrossRef]
  29. Shiramizu, M.; Toste, F.D. Expanding the scope of biomass-derived chemicals through tandem reactions based on oxorhenium-catalyzed deoxydehydration. Angew. Chemie Int. Ed. 2013, 52, 12905–12909. [Google Scholar] [CrossRef]
  30. Sirasani, G.; Tong, L.; Balskus, E.P. A biocompatible alkene hydrogenation merges organic synthesis with microbial metabolism. Angew. Chemie-Int. Ed. 2014, 53, 7785–7788. [Google Scholar] [CrossRef] [Green Version]
  31. Neri, G.; Musolino, M.G.; Milone, C.; Galvagno, S. Kinetic modeling of 2,4-dinitrotoluene hydrogenation over Pd/C. Ind. Eng. Chem. Res. 1995, 34, 2226–2231. [Google Scholar] [CrossRef]
  32. Carraher, J.M.; Pfennig, T.; Rao, R.G.; Shanks, B.H.; Tessonnier, J.-P. Cis,cis-muconic acid isomerization and catalytic conversion to biobased Cyclic-C6-1,4-Diacid monomers. Green Chem. 2017, 21–25. [Google Scholar] [CrossRef] [Green Version]
  33. Rosengart, A.; Capelli, S.; Pirola, C.; Citterio, A.; Bianchi, C.L.; Prati, L.; Villa, A. Renewable adipic acid from the hydrogenation of trans, trans-muconic acid: Selection of a three phases kinetic model. Chem. Eng. Trans. 2017, 57, 931–936. [Google Scholar] [CrossRef]
  34. Froment, G.F.; Bischoff, K.B.; De Wilde, J. Chemical Reactor Analysis and Design, 3rd ed.; Wiley: New York, NY, USA, 2011. [Google Scholar]
  35. Lylykangas, M.S.; Rautanen, P.A.; Krause, A.O.I. Hydrogenation and deactivation kinetics in the liquid-phase hydrogenation of isooctenes on Pt/Al2O3. Ind. Eng. Chem. Res. 2004, 43, 1641–1648. [Google Scholar] [CrossRef]
  36. Buzzi-Ferraris, G.; Manenti, F. Interpolation and Regression Models for the Chemical Engineer: Solving Numerical Problems; John Wiley & Sons: Hoboken, NJ, USA, 2010. [Google Scholar]
  37. Veldsink, J.W.; Bouma, M.J.; Schöön, N.H.; Beenackers, A.C.M. Heterogeneous hydrogenation of vegetable oils: A literature review. Catal. Rev. 1997, 39, 253–318. [Google Scholar] [CrossRef]
  38. Rajashekharam, M.V.; Nikalje, D.D.; Jaganathan, R.; Chaudhari, R.V. Hydrogenation of 2,4-dinitrotoluene using a Pd/Al2O3 catalyst in a slurry reactor: A molecular level approach to kinetic modeling and nonisothermal effects. Ind. Eng. Chem. Res. 1997, 36, 592–604. [Google Scholar] [CrossRef]
  39. Jones, W.H. Catalysis in Organic Syntheses; Science, E., Ed.; Academic Press: Cambridge, MA, USA, 2013. [Google Scholar] [CrossRef]
  40. Chaudhari, R.V.; Rode, C.V.; Deshpande, R.M.; Jaganathan, R.; Leib, T.M.; Mills, P.L. Kinetics of hydrogenation of maleic acid in a batch slurry reactor using a bimetallic Ru-Re/C catalyst. Chem. Eng. Sci. 2003, 58, 627–632. [Google Scholar] [CrossRef]
  41. Zhan, Z.; Jackson, J.E.; Miller, D.J.; Zhang, Z. Kinetics of aqueous-phase hydrogenation of lactic acid to propylene glycol. Ind. Eng. Chem. Res. 2002, 41, 691–696. [Google Scholar] [CrossRef]
  42. Feng, Y.; Zhou, L.; Wan, Q.; Lin, S.; Guo, H. Selective Hydrogenation of 1,3-Butadiene Catalyzed by a Single Pd Atom Anchored on Graphene: The Importance of Dynamics. Chem. Sci. 2018, 9, 5890–5896. [Google Scholar] [CrossRef] [Green Version]
Figure 1. Reaction pathway of model LHHW_17P.
Processes 08 00929 g001
Figure 2. Results of the regression with the model LHHW_17P.
Processes 08 00929 g002
Table 1. Selected publications on muconic acid catalytic hydrogenation.
CatalystT (°C)P (bar)Time (h)Conversion (%)AA yield (%)SolventRef.
Pt/C 10%253.5310090Water[25]
Pt/C 10%25342.510097Water[8]
Ru10Pt2/SiO2803059196Ethanol[26]
Pt/C 5%160n.a.12n.a.99Pentanol[27]
Re/TiO221068510090Methanol[28]
Pd/C 10%2574n.a.62n-butanol[29]
Royer372518n.a.75 [30]
Pd/C 1%24240.3>97>97Water[10]
Ni/Al2O3 14.2%60105100>99 [22]
Ni electrode2525150<5Acidic solution[24]
Pt/C 5%6042.5100100Water[23]
Table 2. Material balance equations solved for the model LHHW_17P.
SpeciesKinetic Equation
ttMA d C t t M A d t = R h 01 R h 02 = k h 01 · C t t M A · C H 2 ( 1 + K i C i ) 3 k h 02 · C t t M A · C H 2 ( 1 + K i C i ) 3 (7)
cHDA d C c H D A d t = + R h 01 R h 13 R i 12 = k h 01 · C t t M A · C H 2 ( 1 + K i C i ) 3 k h 13 · C c H D A · C H 2 ( 1 + K i C i ) 3 k i 12 ·   C c H D A k i 12 ·   C t H D A · ( 1 + K i C i ) 3       (8)
tHDA d C t H D A d t = + R h 01 R h 23 + R i 12 = k h 02 · C t t M A · C H 2 ( 1 + K i C i ) 3 k h 23 · C t H D A · C H 2 ( 1 + K i C i ) 3 k i 12 ·   C c H D A k i 12 ·   C t H D A · ( 1 + K i C i ) 3 (9)
AA d C A A d t = R h 13 + R h 23 = k h 13 · C c H D A · C H 2 ( 1 + K i C i ) 3 k h 23 · C t H D A · C H 2 ( 1 + K i C i ) 3 (10)
H2 d C H 2 d t = 0 (11)
Table 3. Sensitivity analysis performed on the constrained regression increasing the lower acceptable value of parameter Ah02 to three test values: 1.00 × 10⁻⁵ 1.00 × 10⁻³ and 1.00 × 10⁻¹. The divergence columns highlight the little limited variation on the calculated parameters despite imposing new boundary limits to Ah02.
LHHW_13PCase 1Case 2Case 3
Reference ParametersCalculated ParametersDivergenceCalculated ParametersDivergenceCalculated ParametersDivergence
KttMA9.40 × 1009.40 × 1000.00%9.41 × 100+0.11%9.85 × 100+4.79%
KcHDA3.44 × 1043.21 × 104−6.69%3.59 × 10⁴+4.36%4.95 × 10⁴+43.90%
KtHDA2.28 × 1012.27 × 101−0.44%2.28 × 1010.00%2.52 × 101+10.53%
Ah028.86 × 10−61.00 × 10⁻⁵limited1.00 × 10−3limited1.00 × 10−1limited
Eah022.75 × 1042.75 × 1040.00%2.75 × 1040.00%2.73 × 10⁴−0.73%
Ah231.39 × 10−11.39 × 10−10.00%1.40 × 10⁻¹+0.72%2.40 × 10⁻¹+72.66%
Eah234.01 × 1044.01 × 1040.00%4.01 × 1040.00%3.97 × 10⁴−1.00%
Ai122.23 × 1012.23 × 1010.00%2.23 × 1010.00%2.30 × 101+3.14%
Ai215.17 × 1005.23 × 100+1.16%5.24 × 100+1.35%5.02 × 100−2.90%
Eai122.95 × 1042.05 × 104−30.51%2.92 × 10⁴−1.02%2.60 × 10⁴−11.86%
Eai217.63 × 1057.53 × 105−1.31%7.51 × 10⁵−1.57%8.25 × 10⁵+8.13%
Ah138.66 × 1008.66 × 1000.00%8.72 × 100+0.69%8.89 × 100−2.66%
Eah133.89 × 1043.29 × 104−15.42%3.80 × 10⁴−2.31%4.67 × 10⁴+20.05%
RR7.76 × 10−47.69 × 10⁻⁴ 7.69 × 10⁻⁴ 7.71 × 10⁻⁴

