Numerical Analysis of the Flow around Two Square Cylinders in a Tandem Arrangement with Different Spacing Ratios Based on POD and DMD Methods


Abstract
:1. Introduction
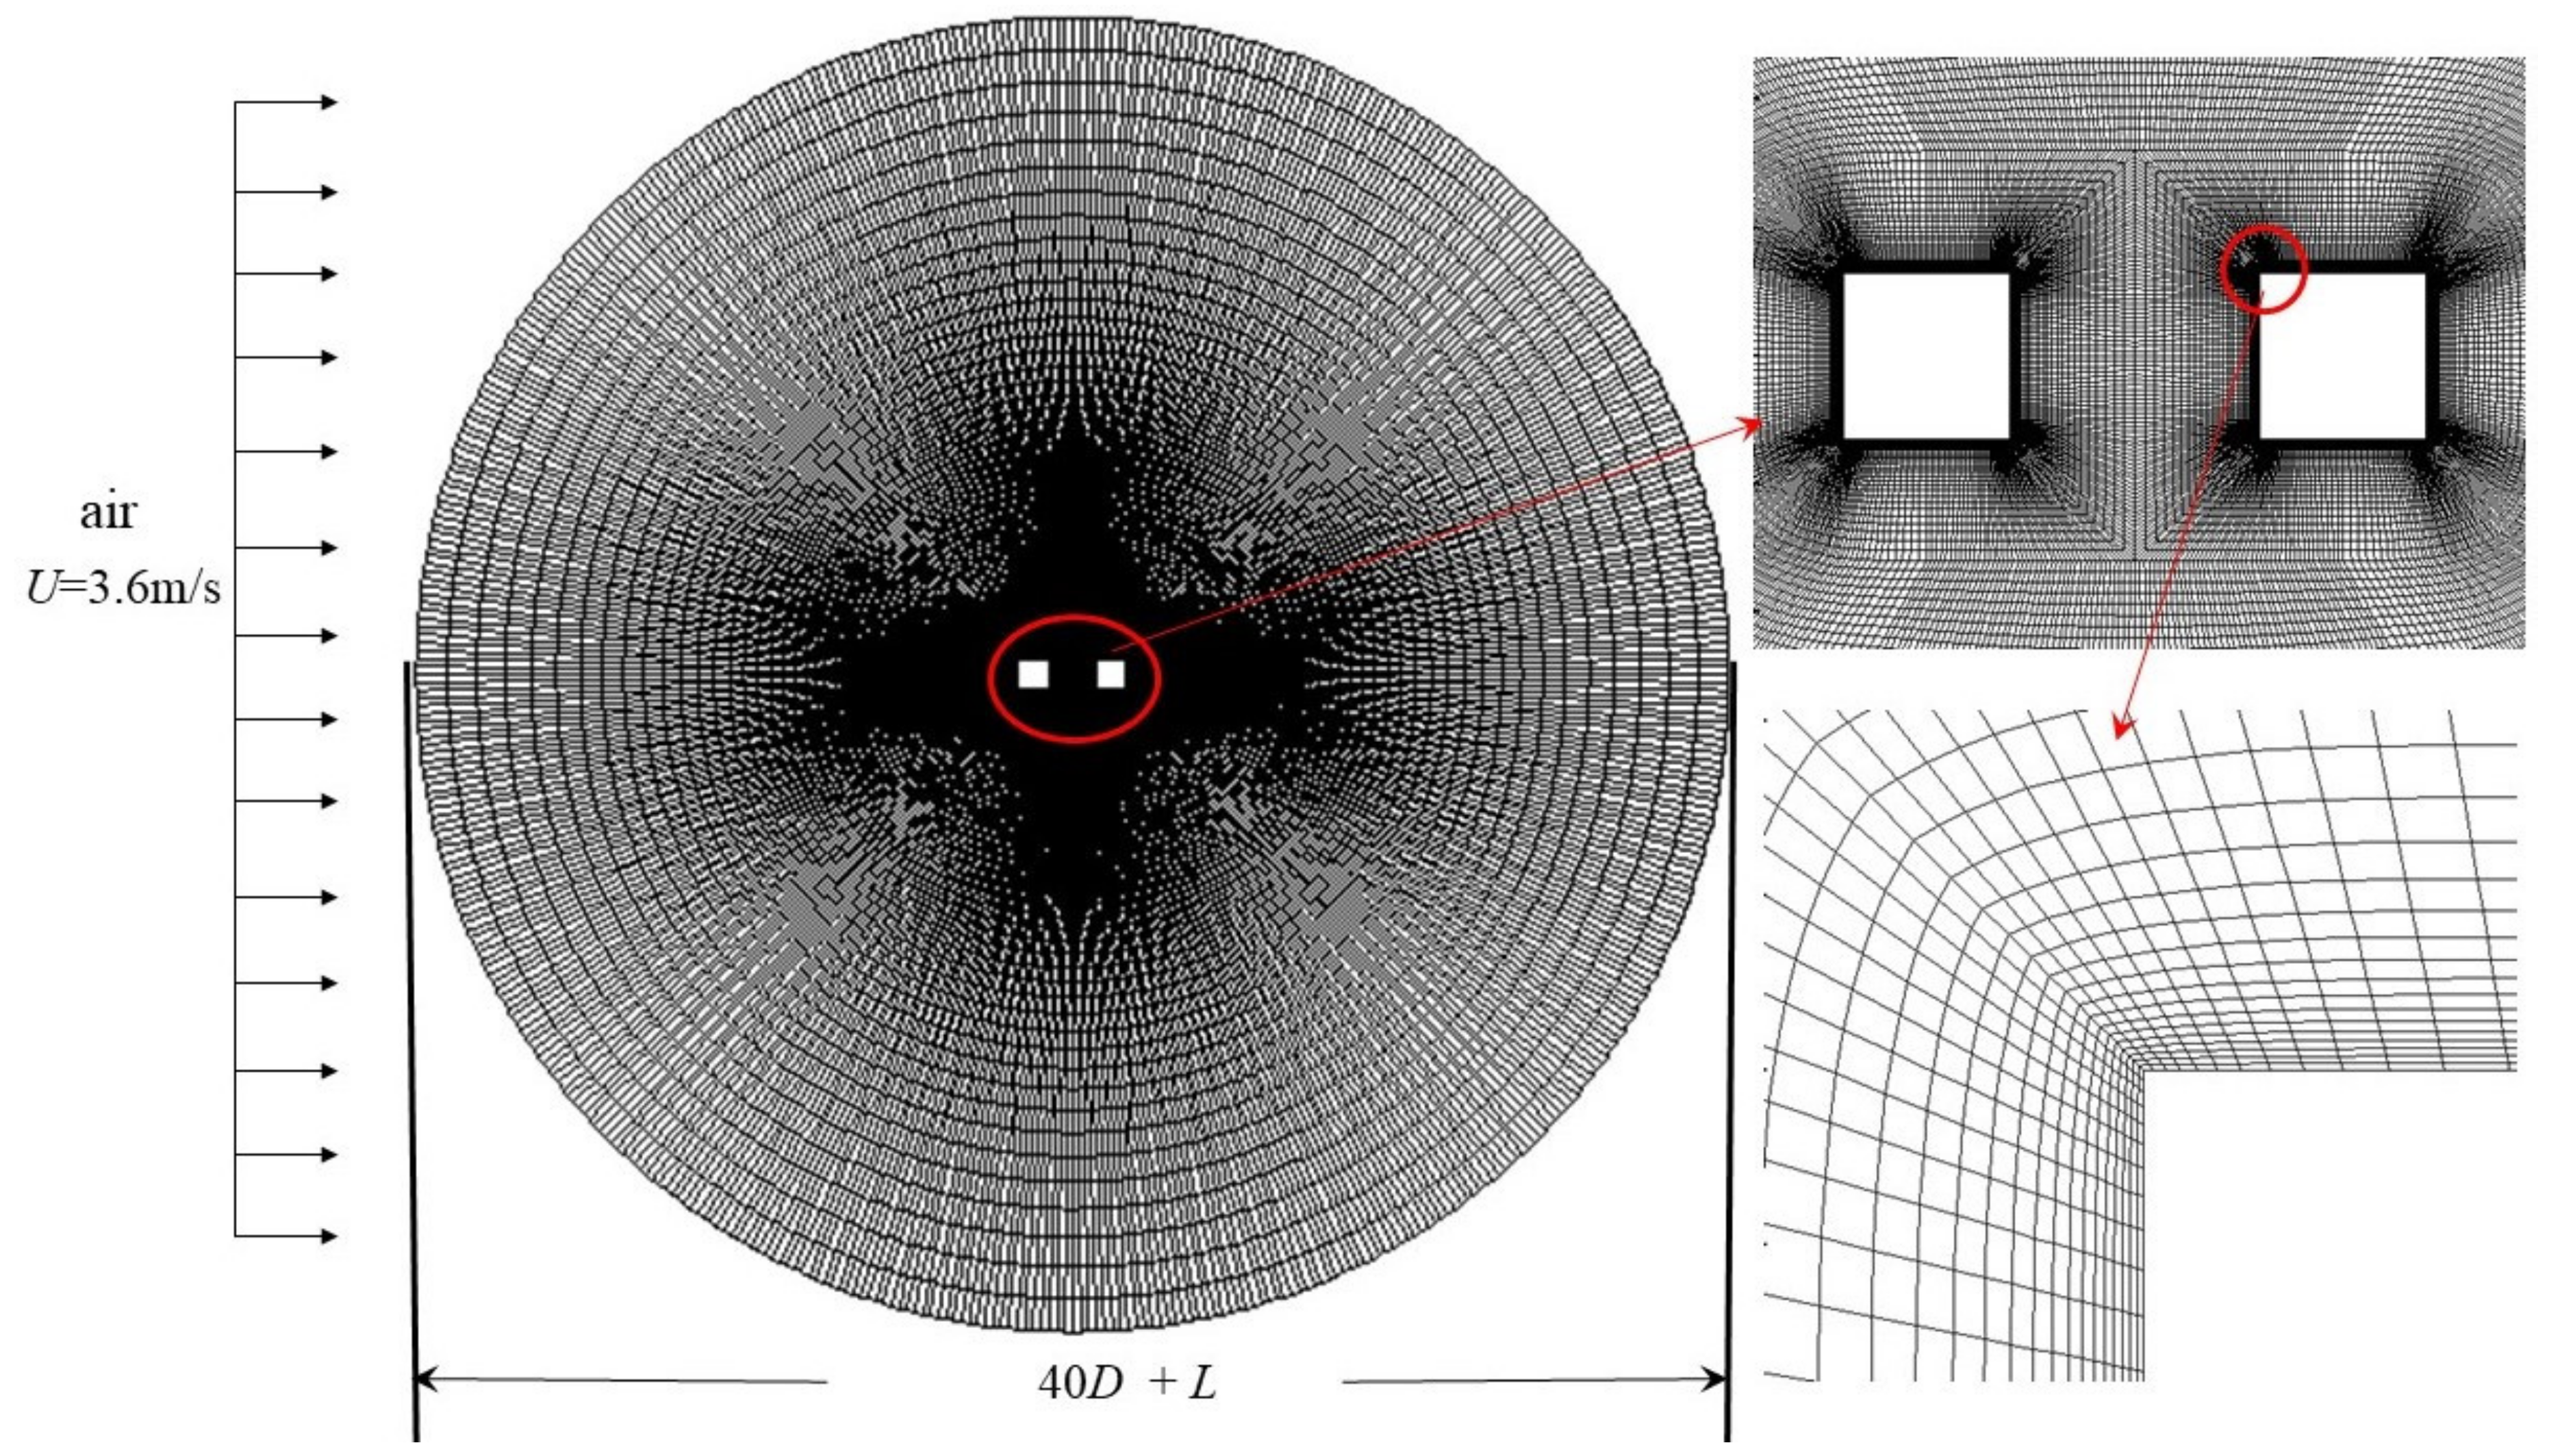
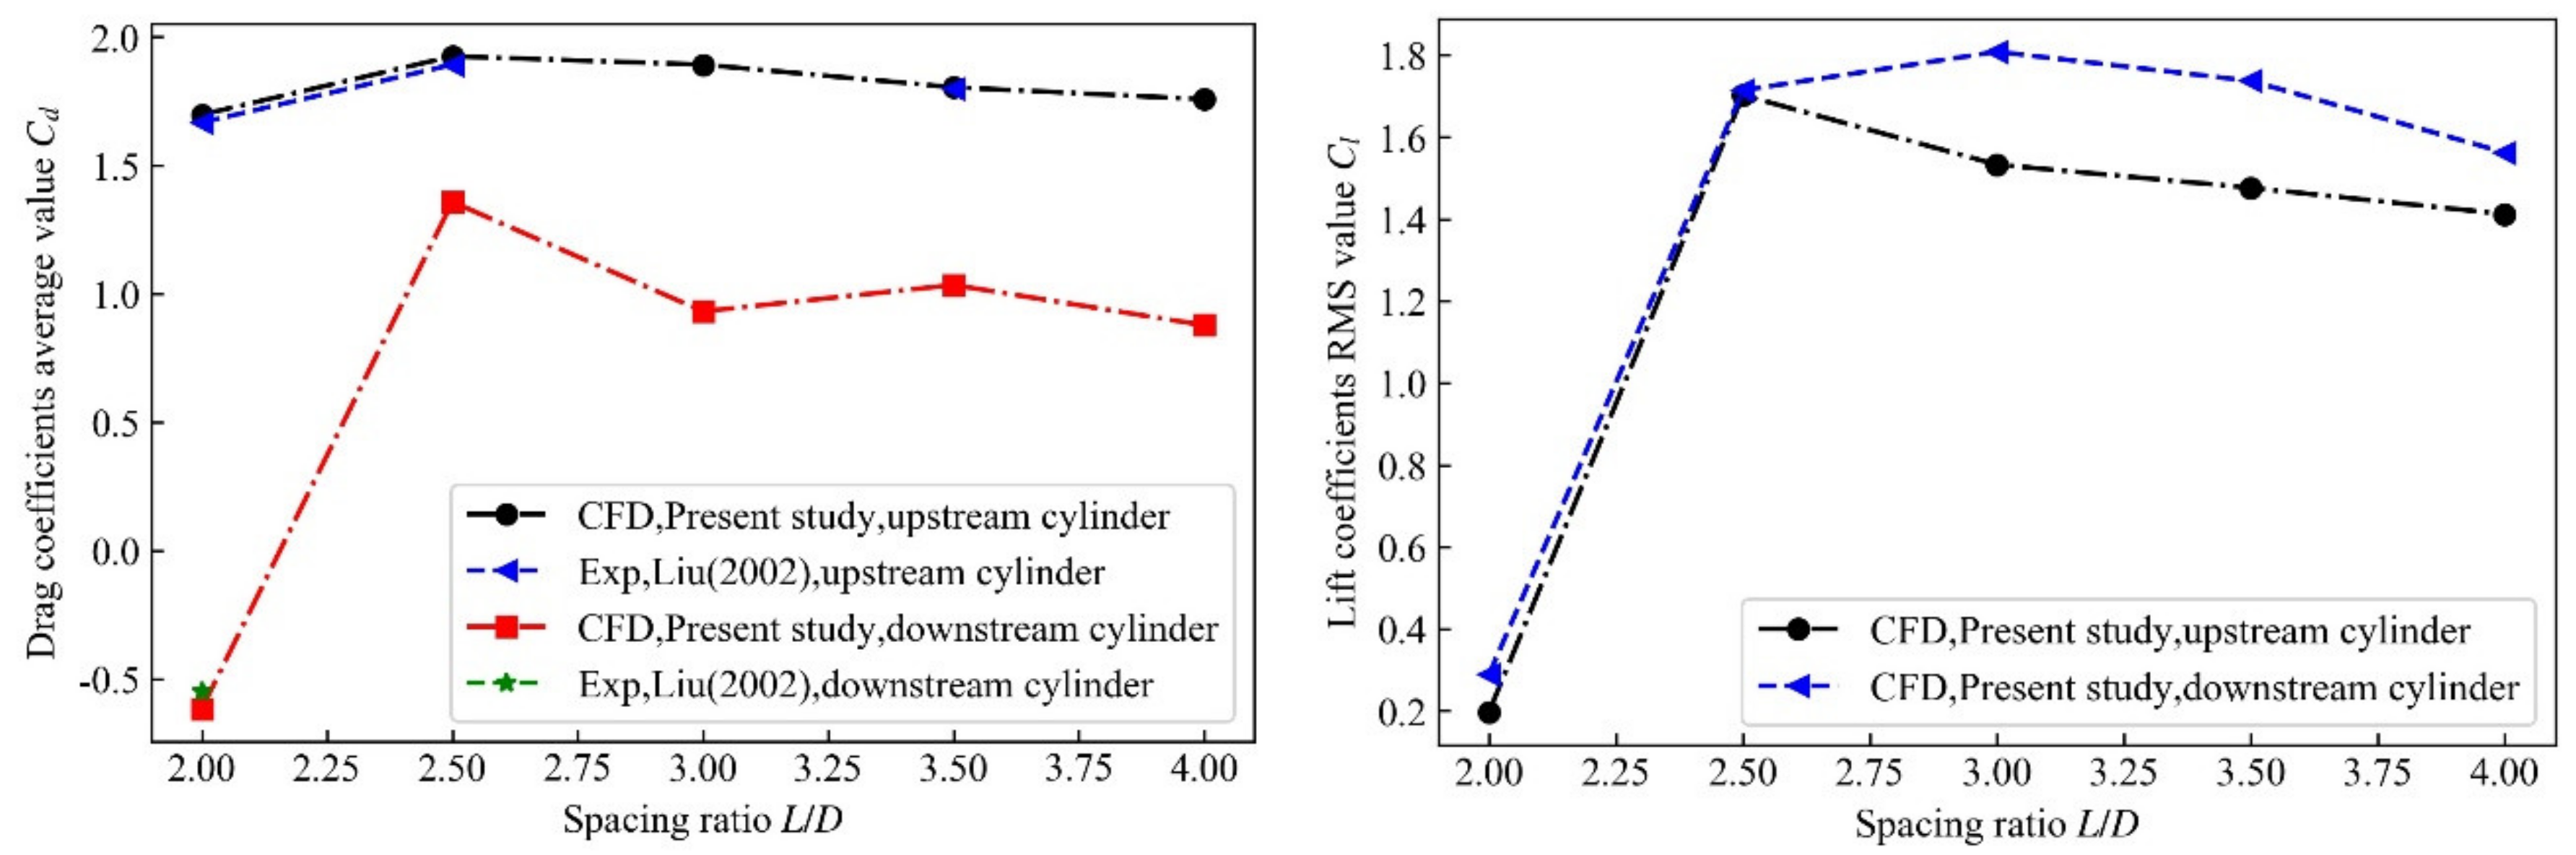
2. CFD Simulation
3. POD and DMD Methods
3.1. Proper Orthogonal Decomposition
3.2. Dynamic Mode Decomposition
4. Results and Discussion
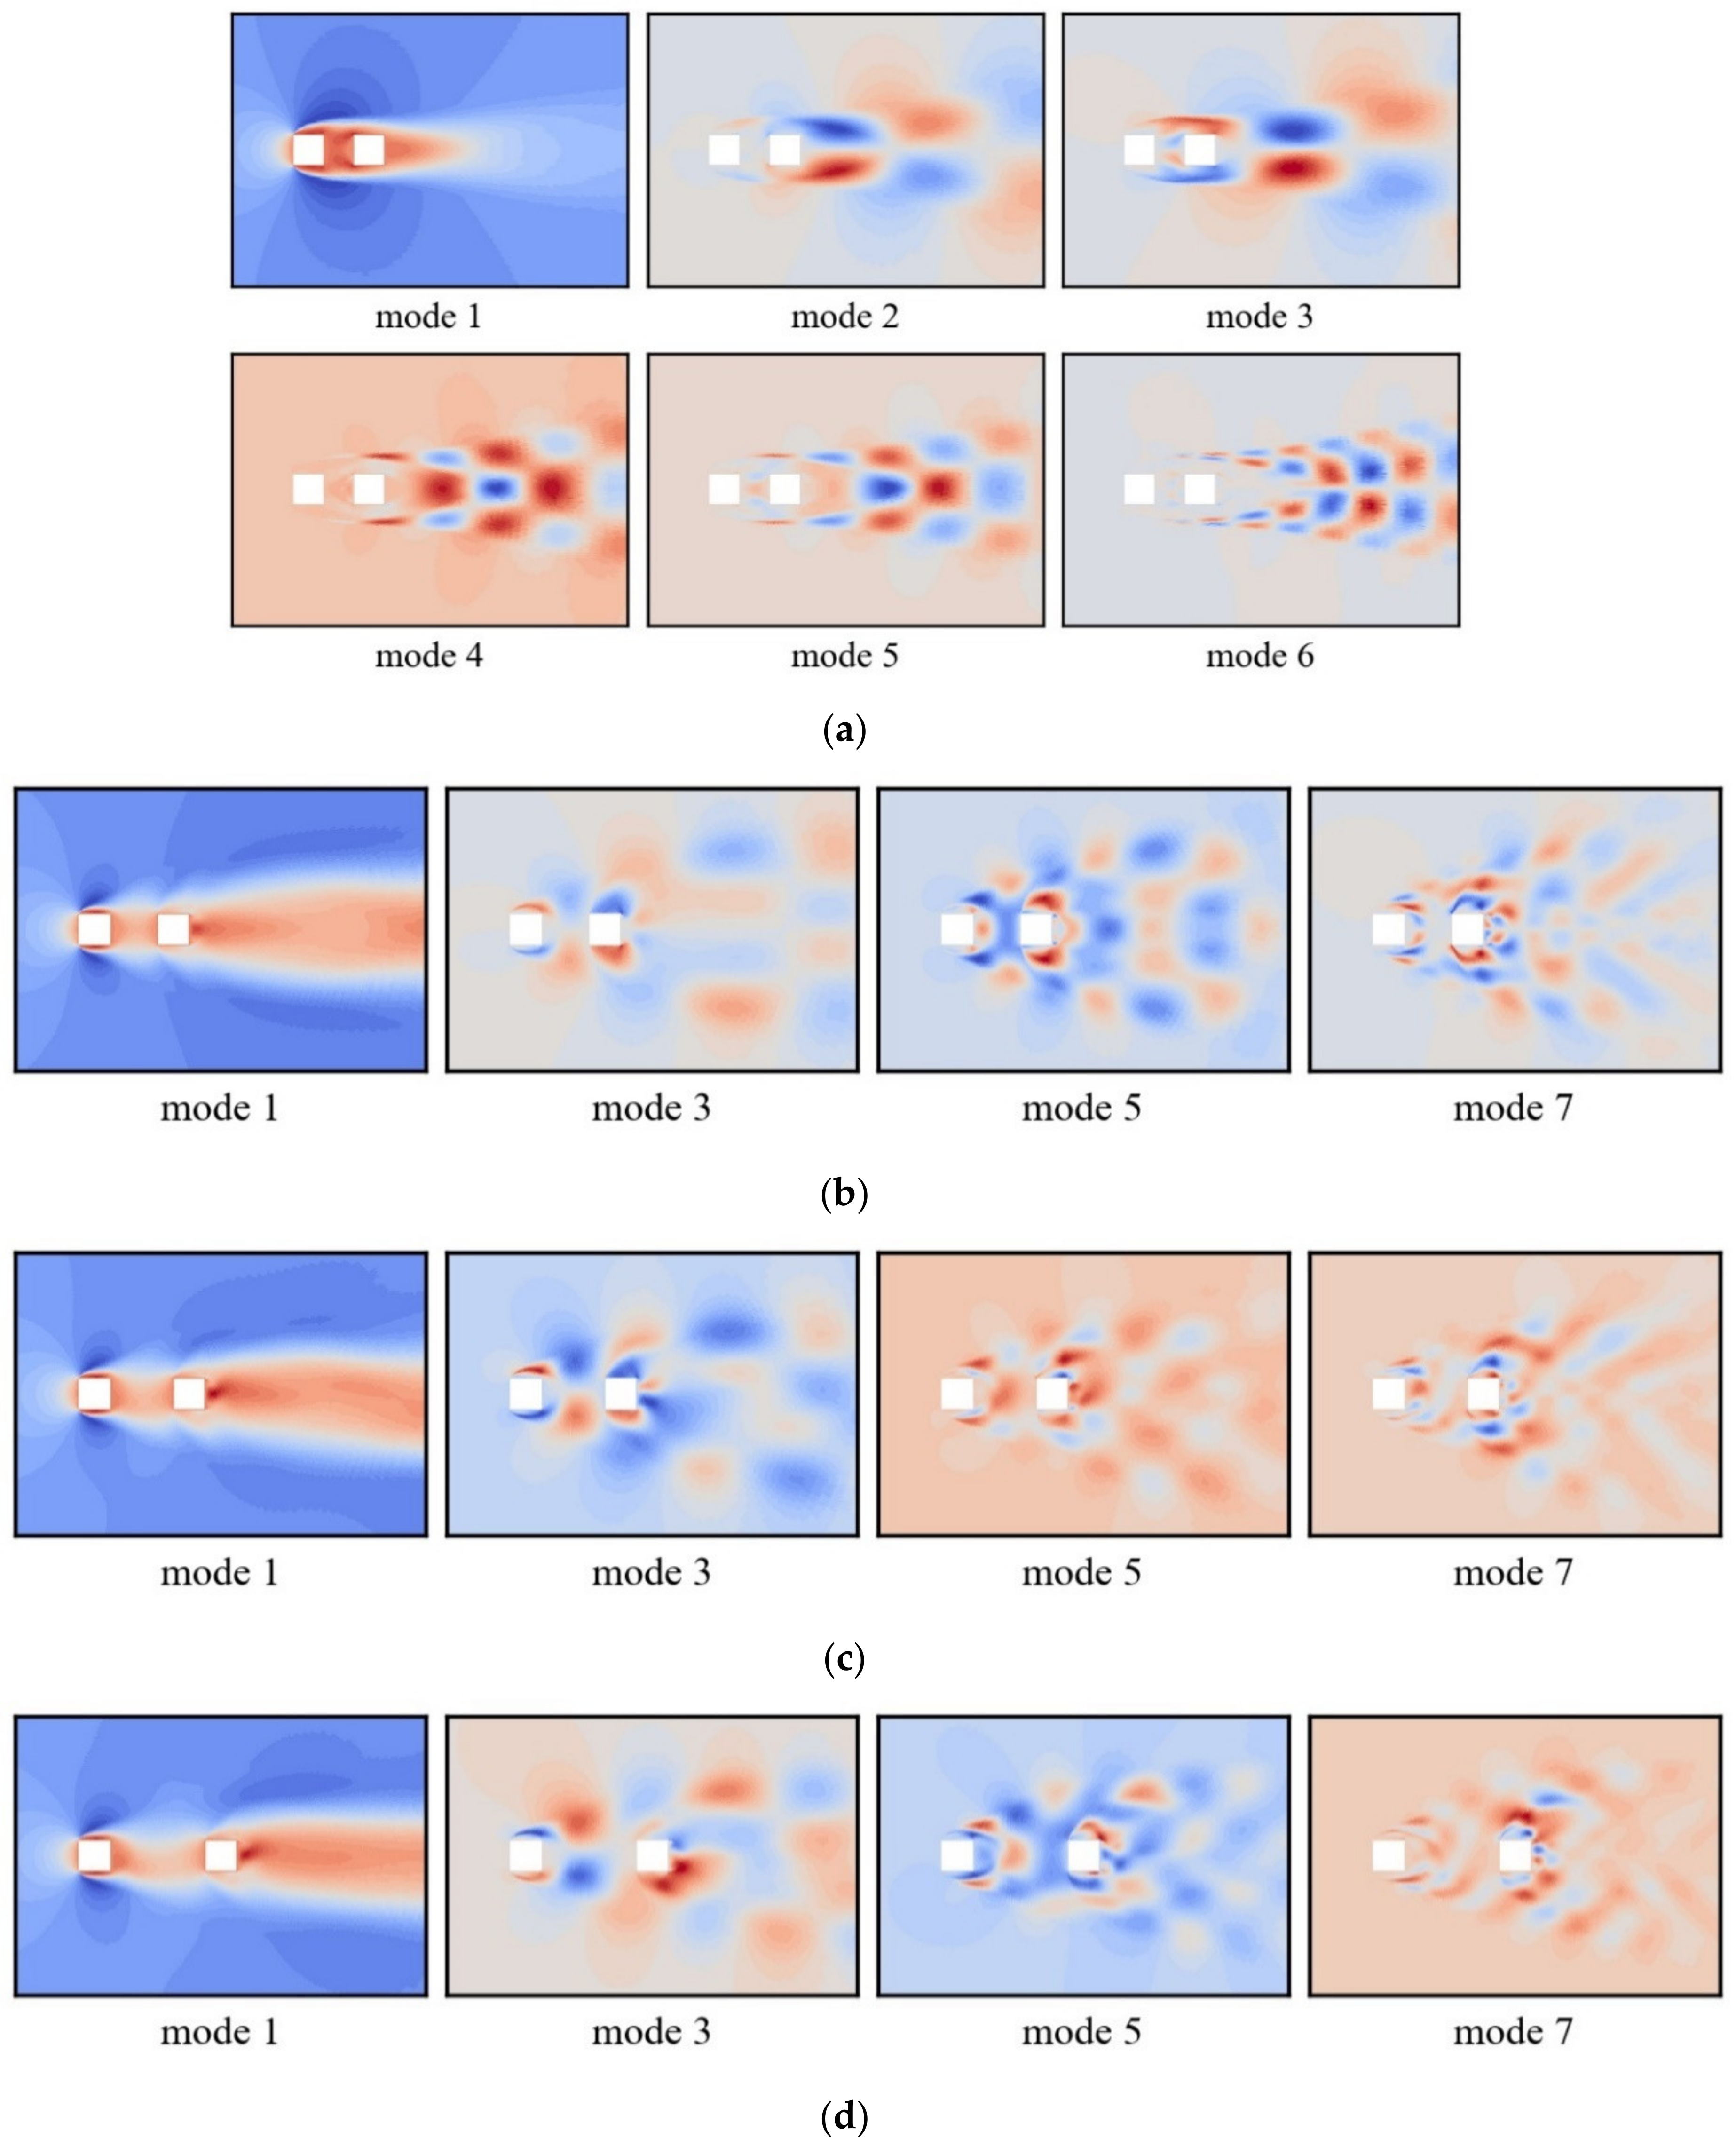
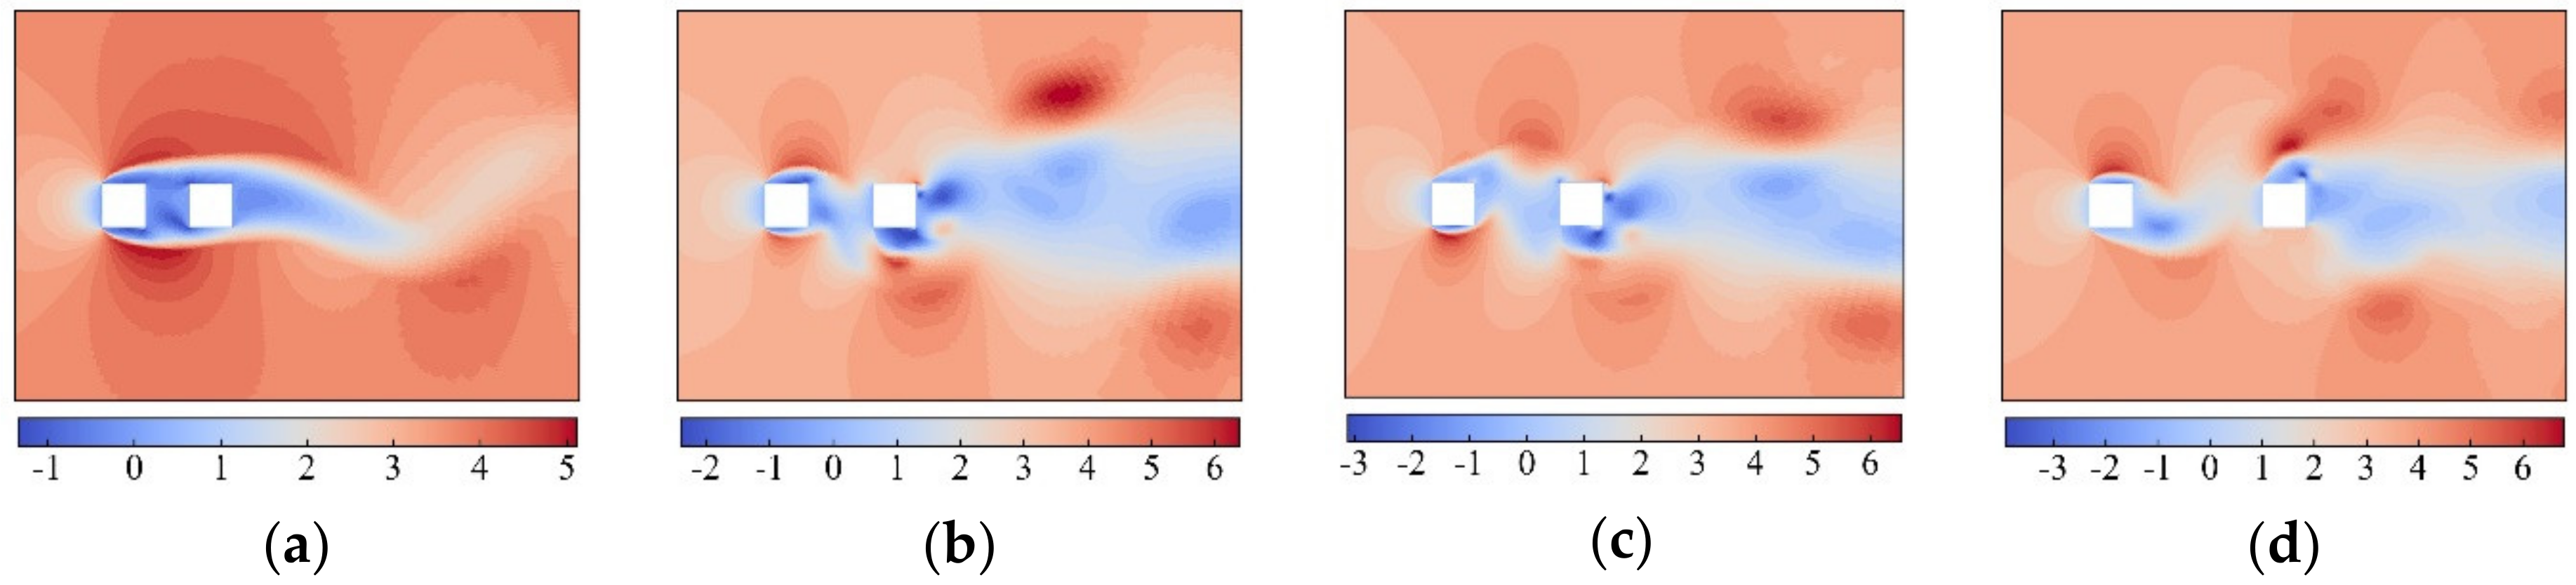
4.1. POD Analysis of Two Square Cylinders With Different Spacing Ratios Under Re = 1.6 × 10⁴
4.2. DMD Analysis of Two Square Cylinders With Different Spacing Ratios Under Re = 1.6 × 10⁴
5. Conclusions
Author Contributions
Funding
Acknowledgments
Conflicts of Interest
Nomenclatures
| coefficient of POD mode | |
| Cd | drag coefficient average value |
| Cl’ | lift coefficient RMS value |
| D | square cylinder length (m) |
| F | conversion matrix of DMD |
| f | frequency corresponding to DMD mode (Hz) |
| fs | snapshot sampling frequency (Hz) |
| g | DMD modes growth rate (decay rate) |
| L | distance between the square cylinders’ centroids (m) |
| N | total number of samples |
| Re | Reynolds number |
| S | energy ratio of each POD mode |
| U | velocity value of inlet (m/s) |
| U | mode matrix |
| V | time series corresponding to each order mode |
| W | variable matrix |
| WA | first N-1 snapshot matrix |
| WB | last N-1 snapshot matrix |
| y1 | height of the first layer near the wall (m) |
| y+max | max height of the dimensionless first layer near the wall |
| μj | eigenvalue of DMD |
| Λj | the eigenvector of DMD |
| Snapshot data matrix | |
| POD modes | |
| DMD modes | |
| energy of each DMD modes |
References
- Liu, C.H.; Chen, J.M. Observations of hysteresis in flow around two square cylinders in a tandem arrangement. J. Wind Eng. Ind. Aerodyn. 2002, 90, 1019–1050. [Google Scholar] [CrossRef]
- Sakamoto, H.; Haniu, H.; Obata, Y. Fluctuating forces acting on two square prisms in a tandem arrangement. J. Wind Eng. Ind. Aerodyn. 1987, 26, 85–103. [Google Scholar] [CrossRef]
- Kim, M.K.; Kim, D.K.; Yoon, S.H.; Lee, D.H. Measurements of the flow fields around two square cylinders in a tandem arrangement. J. Mech. Sci. Technol. 2008, 22, 397–407. [Google Scholar] [CrossRef]
- Yen, S.C.; San, K.C.; Chuang, T.H. Interactions of tandem square cylinders at low Reynolds numbers. Exp. Therm. Fluid Sci. 2008, 32, 927–938. [Google Scholar] [CrossRef]
- Lv, Q.B.; Yang, B.; Yang, Z.C.; Li, P.H. Numerical Simulation of Flow around Two Square Cylinders in Tandem Arrangement. J. Chongqing Jiaotong Univ.(Nat. Sci.) 2013, 32, 1010–1013. (In Chinese) [Google Scholar]
- Li, C.Z.; Zhang, X.S.; Hu, X.F.; Li, W.; You, Y.X. The study of flow past multiple cylinders at high reynolds numbers. J. Theor. Appl. Mech. 2018, 50, 233–243. (In Chinese) [Google Scholar]
- Sohankar, A.; Ahmad, A. LES study of the flow interference between tandem square cylinder pairs. Theor. Comput. Fluid Dyn. 2014, 28, 531–548. [Google Scholar] [CrossRef]
- Lankadasu, A.; Vengadesan, S.; Vengadesan, S. Interference effect of two equal-sized square cylinders in tandem arrangement: With planar shear flow. Int. J. Numer. Methods Fluids 2008, 57, 1005–1021. [Google Scholar] [CrossRef]
- Hunt, J.C.; Wray, A.; Moin, P. Eddies, streams, and convergence zones in turbulent flows. In Studying Turbulence Using Numerical Simulation Databases 2; NASA: Washington, DC, USA, 1988; pp. 193–208. [Google Scholar]
- Hussain, A.K.M.F.; Hayakawa, M. Eduction of large-scale organized structures in a turbulent plane wake. J. Fluid Mech. 1987, 180, 193–229. [Google Scholar] [CrossRef]
- Liu, C.Q.; Wang, Y.Q.; Yang, Y.; Duan, Z.W. New omega vortex identification method. Sci. China-Phys. Mech. Astron. 2016, 59, 684711. [Google Scholar] [CrossRef]
- Zhang, Q. PIV Measurements of Unsteady Characteristic of Separated and Reattaching Flow on Finite Blunt Plane-Vortex Dynamics Analysis Using Proper Orthogonal Decomposition and Dynamic Mode Decomposition. Ph.D. Thesis, Shanghai Jiao Tong University, Shanghai, China, 2015. (In Chinese). [Google Scholar]
- Holmes, P.; Lumley, J.L.; Berkooz, G.; Rowley, C.W. Turbulence, Coherent Structures, Dynamical Systems and Symmetry: Symmetry; Cambridge University Press: Cambridge, UK, 2012. [Google Scholar]
- Tamura, Y.; Ueda, H.; Kikuchi, H.; Hibi, K.; Suganuma, S.; Bienkiewicz, B. Proper orthogonal decomposition study of approach wind-building pressure correlation. J. Wind Eng. Ind. Aerodyn. 1997, 72, 421–431. [Google Scholar] [CrossRef]
- Wang, F.; Lam, K.M.; Zu, G.B.; Cheng, L. Coherent structures and wind force generation of square-section building model. J. Wind Eng. Ind. Aerodyn. 2019, 188, 175–193. [Google Scholar] [CrossRef]
- Tan, Z.X.; Xu, Y.L.; Zhu, L.D.; Zhu, Q. POD-based modelling of distributed aerodynamic and aeroelastic pressures on bridge decks. J. Wind Eng. Ind. Aerodyn. 2018, 179, 524–540. [Google Scholar] [CrossRef]
- Perrin, R.; Braza, M.; Cid, E.; Cazin, S.; Chassaing, P.; Mockett, C.; Reimann, T.; Thiele, F. Coherent and turbulent process analysis in the flow past a circular cylinder at high Reynolds number. J. Fluids Struct. 2008, 24, 1313–1325. [Google Scholar] [CrossRef]
- Kikitsu, H.; Okuda, Y.; Ohashi, M.; Kanda, J. POD analysis of wind velocity field in the wake region behind vibrating three-dimensional square prism. J. Wind Eng. Ind. Aerodyn. 2008, 96, 2093–2103. [Google Scholar] [CrossRef]
- Villegas, A.; Diez, F.J. Effect of vortex shedding in unsteady aerodynamic forces for a low Reynolds number stationary wing at low angle of attack. J. Fluids Struct. 2016, 64, 138–148. [Google Scholar] [CrossRef]
- Liu, Y.Z.; Shi, L.L.; Zhang, Q.S. Proper orthogonal decomposition of wall-pressure fluctuations under the constrained wake of a square cylinder. Exp. Therm. Fluid Sci. 2011, 35, 1325–1333. [Google Scholar] [CrossRef]
- Prothin, S.; Djeridi, H.; Billard, J.-Y. Coherent and turbulent process analysis of the effects of a longitudinal vortex on boundary layer detachment on a NACA0015 foil. J. Fluids Struct. 2014, 47, 2–20. [Google Scholar] [CrossRef] [Green Version]
- Li, D.; Gong, C.; Da Ronch, A.; Chen, G.; Li, Y. An efficient implementation of aeroelastic tailoring based on efficient computational fluid dynamics-based reduced order model. J. Fluids Struct. 2019, 84, 182–198. [Google Scholar] [CrossRef] [Green Version]
- Schmid, P.J.; Sesterhenn, J. Dynamic Mode Decomposition of numerical and experimental data. J. Fluid Mech. 2008, 656, 5–28. [Google Scholar] [CrossRef] [Green Version]
- Zhang, Q.; Liu, Y.; Wang, S. The identification of coherent structures using proper orthogonal decomposition and dynamic mode decomposition. J. Fluids Struct. 2014, 49, 53–72. [Google Scholar] [CrossRef]
- Higham, J.E.; Brevis, W.; Keylock, C.J. Implications of the selection of a particular modal decomposition technique for the analysis of shallow flows. J. Hydraul. Res. 2018, 56, 796–805. [Google Scholar] [CrossRef]
- Yu, M.; Wang, B.; Wang, Z.J.; Farokhi, S. Evolution of vortex structures over flapping foils in shear flows and its impact on aerodynamic performance. J. Fluids Struct. 2018, 76, 116–134. [Google Scholar] [CrossRef]
- Zhang, H.; Xin, D.; Ou, J. Wake control using spanwise-varying vortex generators on bridge decks: A computational study. J. Wind Eng. Ind. Aerodyn. 2019, 184, 185–197. [Google Scholar] [CrossRef]
- Chong, P.; Yu, D.; Wang, J. Dynamical mode decomposition of Gurney flap wake flow. Theor. App. Mech. Lett. 2011, 1, 012002.1–012002.5. [Google Scholar]
- Goza, A.; Colonius, T. Modal decomposition of fluid-structure interaction with application to flag flapping. J. Fluids Struct. 2018, 81, 728–737. [Google Scholar] [CrossRef] [Green Version]
- Mannini, C.; Šoda, A.; Schewe, G. Unsteady RANS modelling of flow past a rectangular cylinder: Investigation of Reynolds number effects. Comput. Fluids 2010, 39, 1609–1624. [Google Scholar] [CrossRef] [Green Version]
- Jung, D. An investigation of the Reynolds-number dependence of the axisymmetric jet mixing layer using a 138 hot-wire probe and the POD. Ph.D. Thesis, State University of New York at Buffalo, Buffalo, NY, USA, 2001. [Google Scholar]
- Sirovich, L. Turbulence and the Dynamics of Coherent Structures Part II: Symmetries and Transformations. Q. Appl. Math. 1987, 45, 573–582. [Google Scholar] [CrossRef] [Green Version]
- Wu, Y.D.; Li, T.; Lai, S.Z. Analysis of rotating instability characteristics in compressor with different tipclearances by POD and DMD methods. J. Aerosp. Power 2019, 34, 2018–2026. (In Chinese) [Google Scholar]
- Kou, J.; Zhang, W. An improved criterion to select dominant modes from dynamic mode decomposition. Eur. J. Mech. B Fluids 2017, 62, 109–129. [Google Scholar] [CrossRef]
- Hu, W.L.; Yu, J.; Liu, H.K.; Yang, C. Dynamic modal analysis of circular-arc airfoil transonic flow. J. Beijing Univ. Aeronaut. Astronaut. 2019, 045, 1026–1032. (In Chinese) [Google Scholar]
- Wang, Y.G.; Cheng, J.X.; Xian, S.C. Analysis and research of two-dimensional square column flow field with low Reynolds number based on POD method. J. Northwestern Polytech. Univ. 2014, 32, 612–617. (In Chinese) [Google Scholar]


| Cell Number | Cd1 | Cd2 | Cl1’ | Cl2’ | |
|---|---|---|---|---|---|
| coarse | 38,280 | 1.923 | 1.777 | 1.666 | 1.589 |
| medium | 70,984 | 1.924 | 1.358 | 1.702 | 1.714 |
| fine | 104,833 | 1.925 | 1.254 | 1.712 | 1.787 |
| Single Square | Cd | Cl ‘ | St |
|---|---|---|---|
| Re = 1.6 × 10⁴ (CFD) | 1.966 | 1.332 | 0.139 |
| Re = 2.2 × 10⁴ (CFD) | 2.001 | 1.436 | 0.136 |
| Re = 2.2 × 10⁴ (Exp [6]) | 2.100–2.210 | 1.210 | 0.130 |
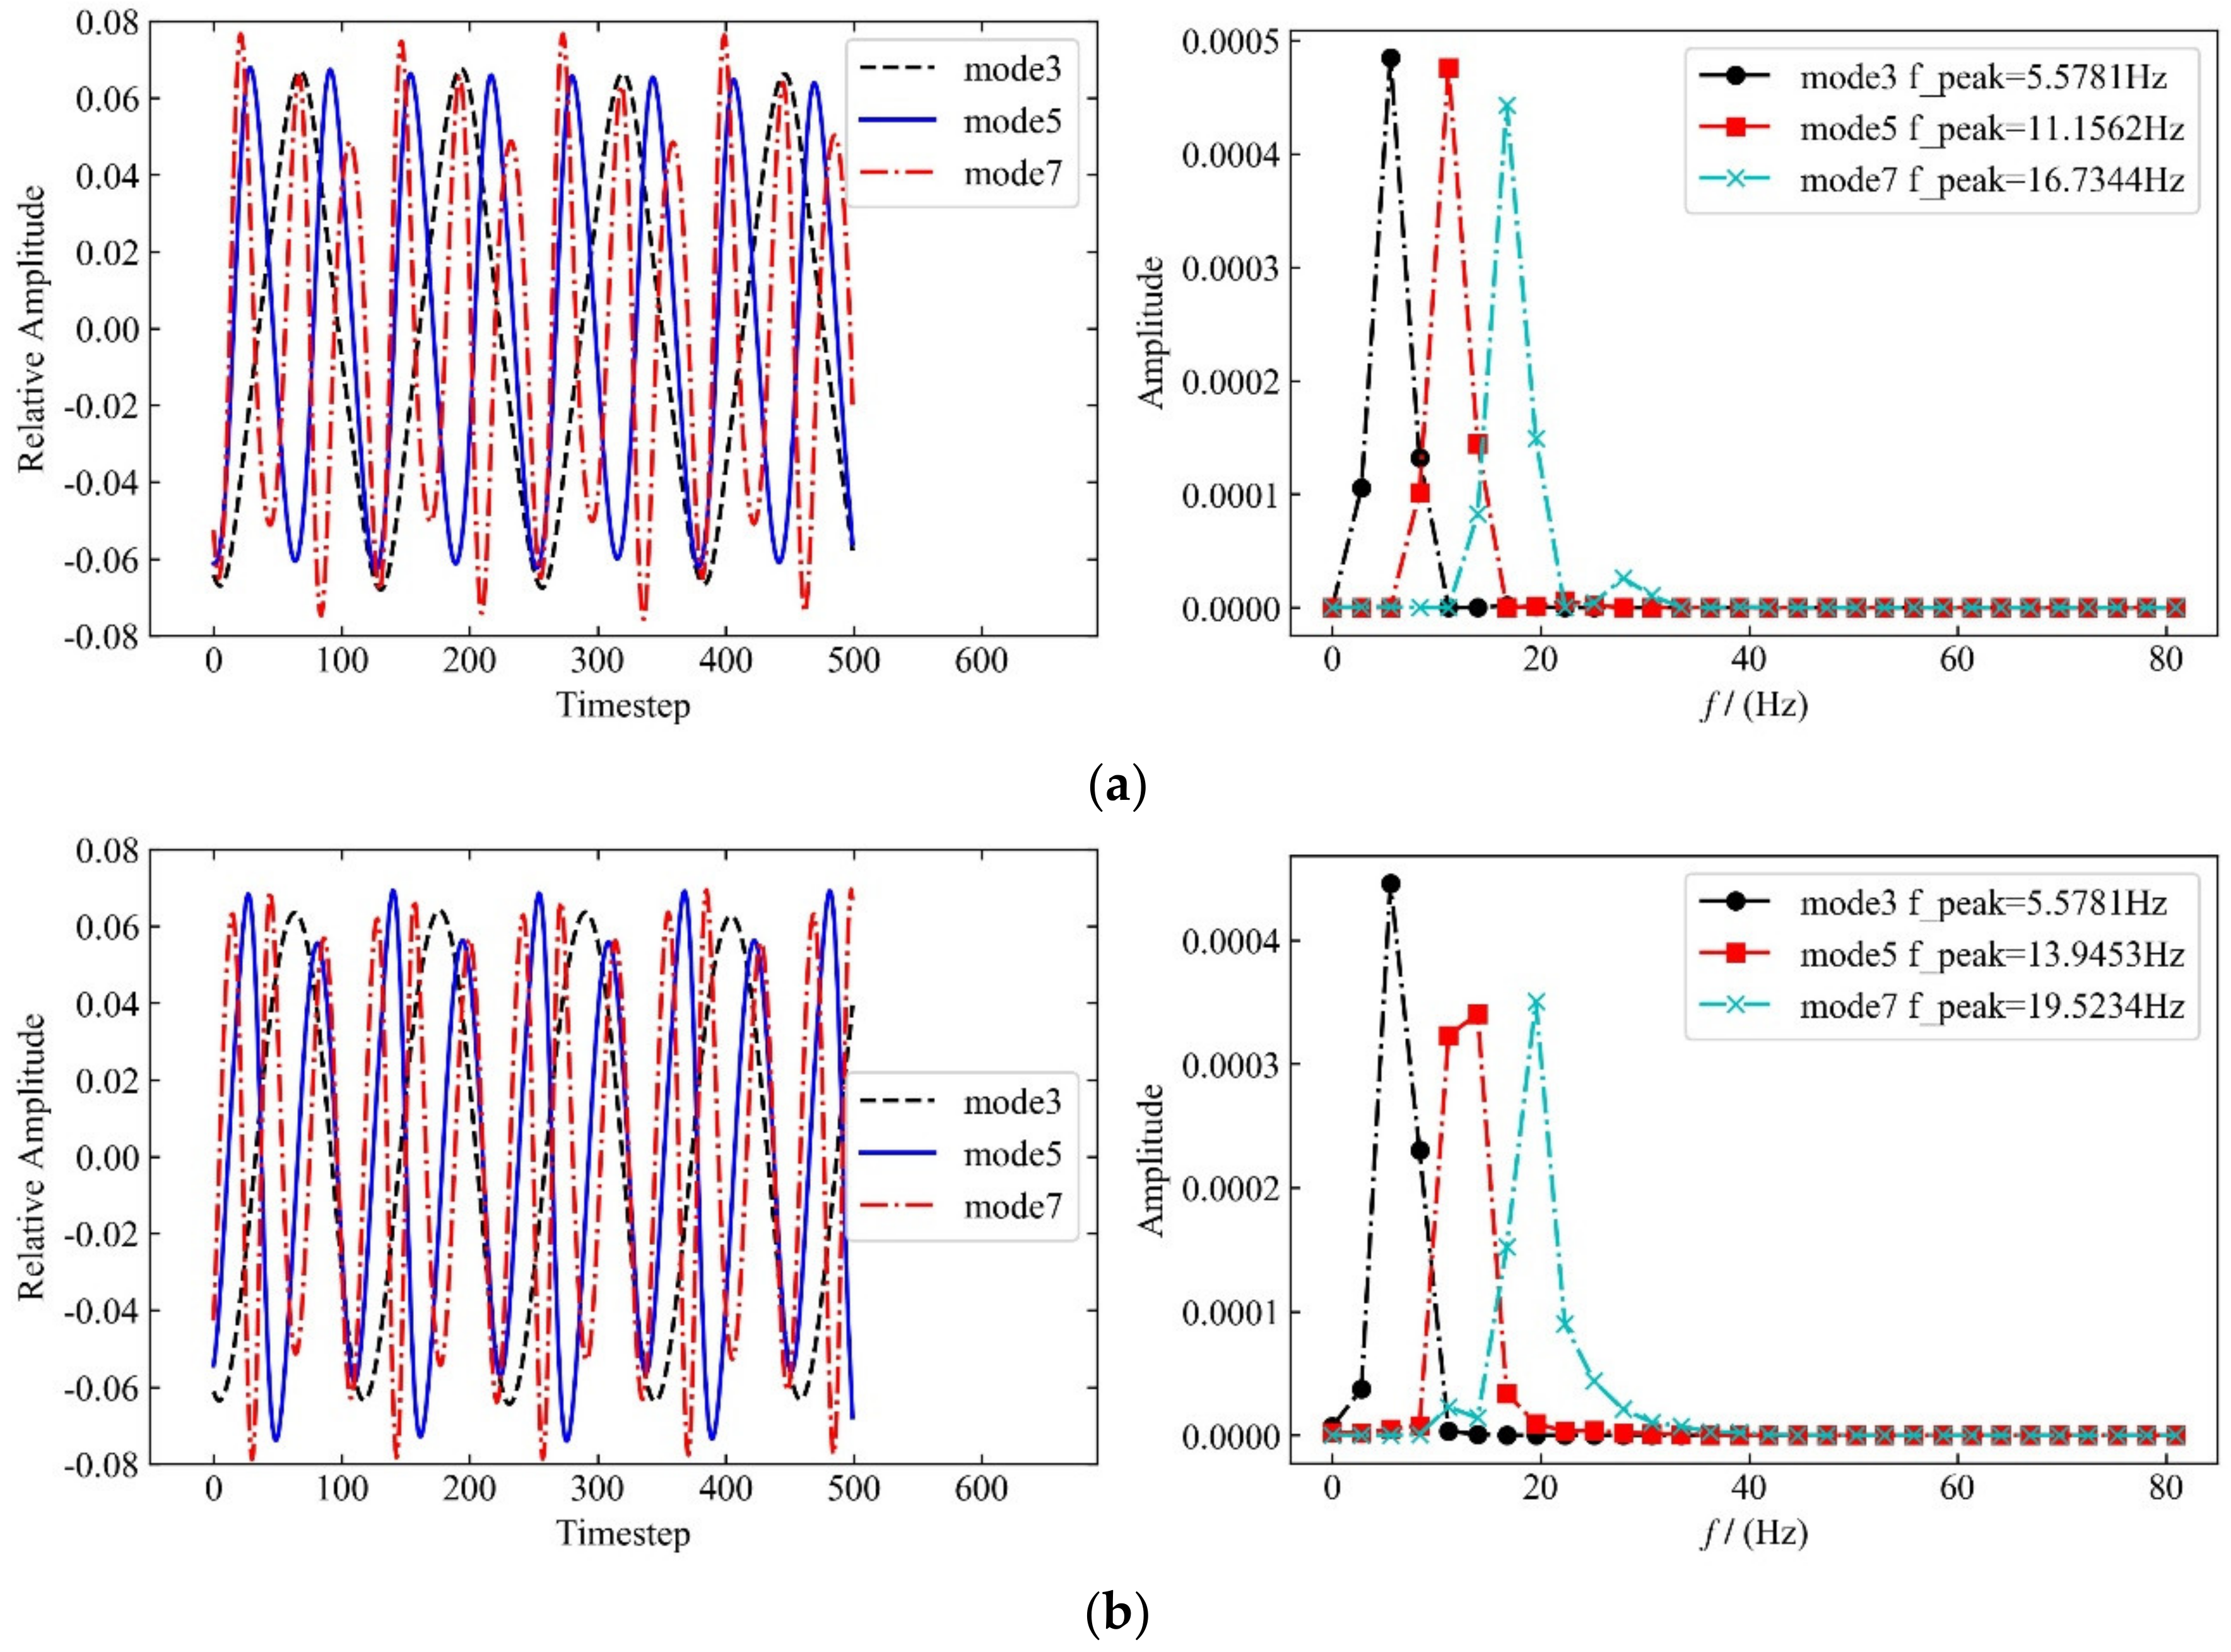
| Spacing Ratio | Mode 3 | Mode 5 | Mode 7 | Frequency of Vortex Shedding of Upstream Cylinder | Frequency of Vortex Shedding of Downstream Cylinder |
|---|---|---|---|---|---|
| L/D = 2 | 5.5781 | 11.1562 | 16.7344 | 5.6030 | 5.6003 |
| L/D = 2.5 | 5.5781 | 11.1562 | 16.7344 | 5.6250 | 5.6252 |
| L/D = 3 | 5.5781 | 11.1562 | 16.7344/19.5234 | 5.8496 | 5.8496 |
| L/D = 3.5 | 5.5781 | 11.1562/13.9353 | 19.5234 | 6.1817 | 6.1817 |
| L/D = 4 | 5.5781 | 13.9353 | 19.5234 | 6.3822 | 6.3822 |
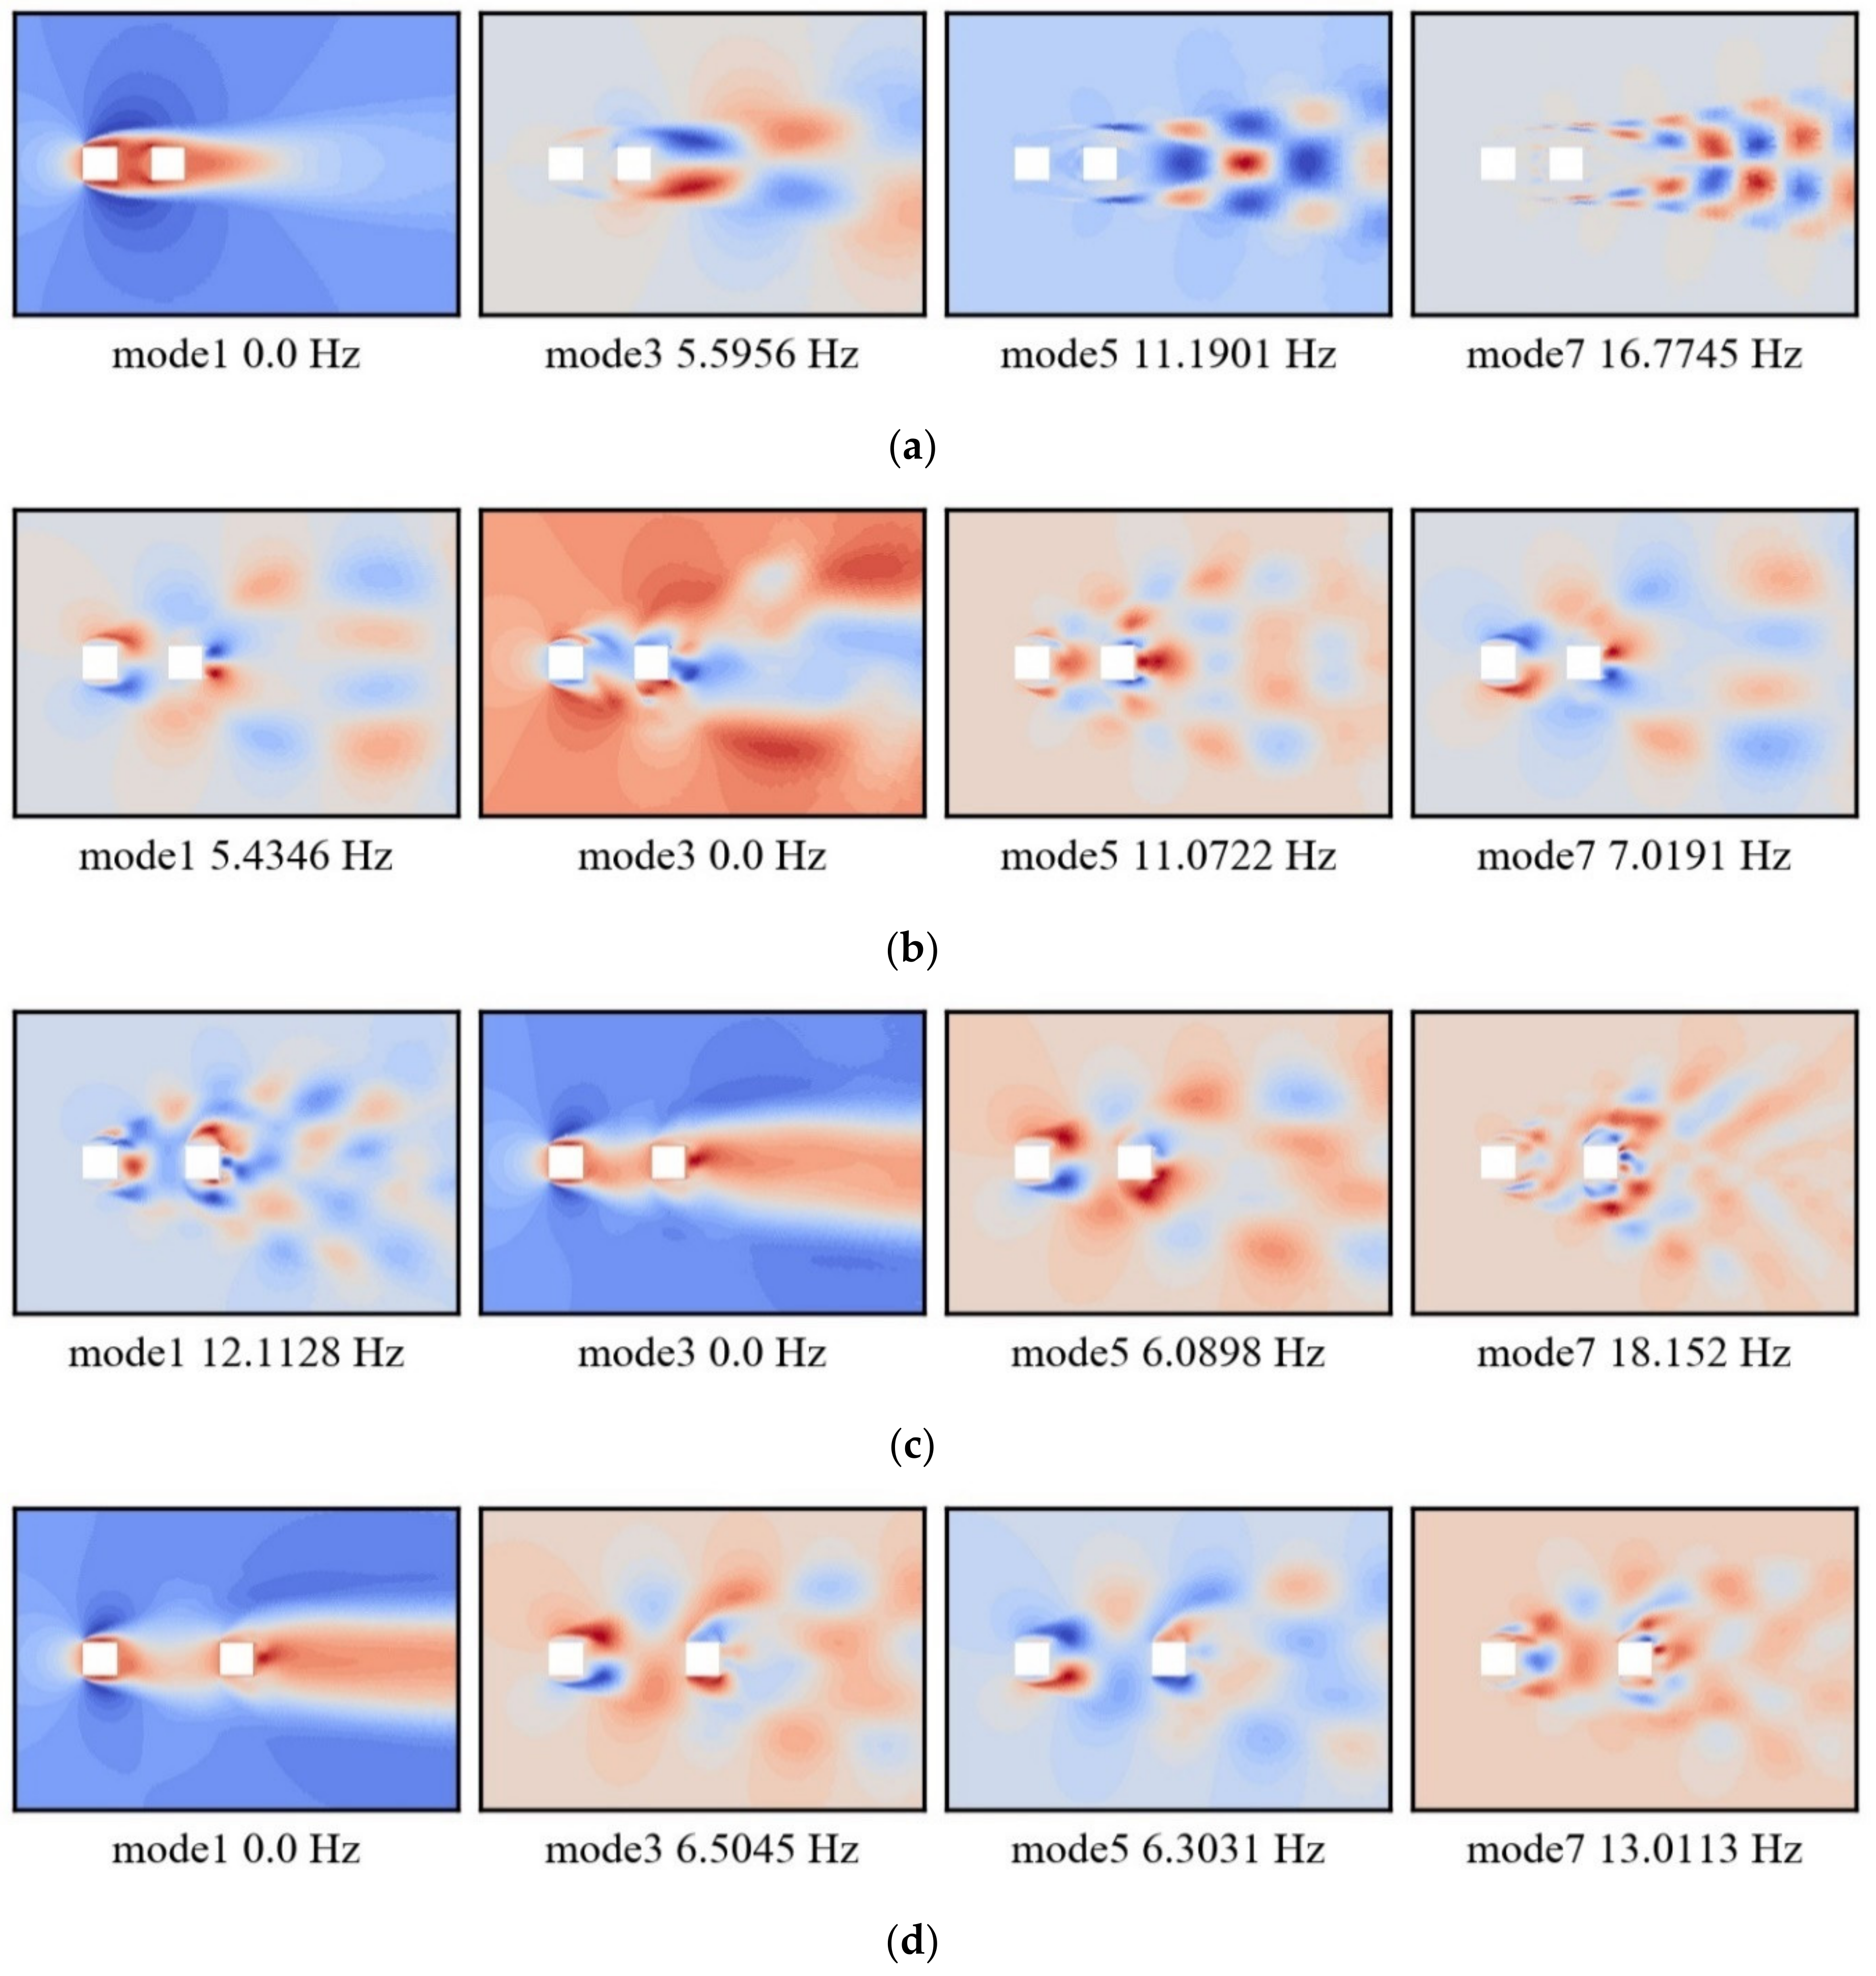
| Spacing Ratio | Mode 1 | Mode 3 | Mode 5 | Mode 7 |
|---|---|---|---|---|
| L/D = 2 | 0.000038 | 0.007276 | 0.021934 | 0.01921 |
| L/D = 2.5 | –2.46957 | –0.0512 | –5.14639 | 0.007418 |
| L/D = 3 | 0.011701 | 0.000499 | –0.1858 | 0.034145 |
| L/D = 4 | 0.000179 | 1.239718 | –2.3864 | 1.131636 |
© 2020 by the authors. Licensee MDPI, Basel, Switzerland. This article is an open access article distributed under the terms and conditions of the Creative Commons Attribution (CC BY) license (http://creativecommons.org/licenses/by/4.0/).
Share and Cite
Wang, F.; Zheng, X.; Hao, J.; Bai, H. Numerical Analysis of the Flow around Two Square Cylinders in a Tandem Arrangement with Different Spacing Ratios Based on POD and DMD Methods. Processes 2020, 8, 903. https://doi.org/10.3390/pr8080903
Wang F, Zheng X, Hao J, Bai H. Numerical Analysis of the Flow around Two Square Cylinders in a Tandem Arrangement with Different Spacing Ratios Based on POD and DMD Methods. Processes. 2020; 8(8):903. https://doi.org/10.3390/pr8080903
Chicago/Turabian StyleWang, Feng, Xiaodong Zheng, Jianming Hao, and Hua Bai. 2020. "Numerical Analysis of the Flow around Two Square Cylinders in a Tandem Arrangement with Different Spacing Ratios Based on POD and DMD Methods" Processes 8, no. 8: 903. https://doi.org/10.3390/pr8080903
APA StyleWang, F., Zheng, X., Hao, J., & Bai, H. (2020). Numerical Analysis of the Flow around Two Square Cylinders in a Tandem Arrangement with Different Spacing Ratios Based on POD and DMD Methods. Processes, 8(8), 903. https://doi.org/10.3390/pr8080903