1. Introduction
Wastewater treatment is an important process ensuring sustainable development of human society. On average, 144 L of water per person per day is supplied by households in Europe [
1]. Most of this water, along with the water from the industry, will become wastewater after use. This water is discharged to wastewater treatment plants (WWTPs). In the process of wastewater treatment to purified water, we also get other products that we need to handle, as gravel, sand, screenings and sewage sludge. Gravel and sand are usually landfilled, incinerated, used for reclamation or construction purposes. Screenings are generally landfilled or incinerated [
2], and sewage sludge remains as a product for wastewater treatment. Typical sewage sludge production in wastewater treatment varies from 35 to 85 g dry solids per population equivalent per day [
3]. Sewage sludge should not be perceived as waste with problematic uses but as a valuable and well-utilized source of nutrients and energy. In recent years, sewage sludge has been mostly applied to the agricultural land as a fertilizer as it contains about 5% of nitrogen, phosphorus, and iron and 2% of potassium [
4]. Today, however, due to the high content of heavy metals and the presence of xenobiotic compounds, the use of sludge is being abandoned, and other possible alternatives are being sought [
5]. Incineration of sludge is economically demanding due to the need to reduce the water content. Gasification, pyrolysis, combustion, and wet oxidation are used for the energy utilization of sewage sludge [
4]. The disadvantage is the large quantity of flue gas and ash formed during sewage sludge incineration and the emissions of dioxins, furans, mercury, and other heavy metals, NO
x, N
2O, and CO [
4]. Anaerobic sewage sludge stabilization is a method by which energetically utilizable biogas while reducing sludge mass is produced. An essential parameter for sludge stabilization is the temperature and hydraulic retention time (HRT) at which the stabilization process takes place [
6]. The usual HRT for anaerobic sewage sludge stabilization ranges from 18 to 30 days. Some wastewater treatment plants undergo anaerobic sludge stabilization at mesophilic conditions. The advantage is the stability of the whole process, low costs of operating the reactors, and better sludge dewatering. The disadvantage is a longer HRT and lower biogas production. The thermophilic process produces higher amounts of biogas, possibly a higher percentage of methane in biogas, lower levels of pathogenic microorganisms in the sludge and shorter HRTs. The disadvantage is then worse drainability and worse process stability. These facts are described in many literary sources [
7,
8,
9,
10,
11]. Also, lower methanogenic diversity in plants, operating at thermophilic temperatures was reported [
12,
13]. However, it is necessary to understand the essence of the whole process, the interplay of different groups of microorganisms, whose final product of metabolism is methane.
Beside the fact, that temperature has important impact on whole microbial diversity in fermenters, in this work, we were interested, how the composition of methanogenic community’s changes depending on the full range of temperatures at which biogas transformation takes place and how the temperature range from 20 °C to 60 °C affects the production and quality of the biogas produced. The diversity of specific methanogens at such a wide temperature range of this anaerobic process has not yet been published in the literature. The detailed knowledge of the involvement of different methanogen groups, and their temperature requirements associated with maximum methane production, will enable the optimization of the input parameters in the anaerobic sewage sludge stabilization process at each wastewater treatment plant.
2. Materials and Methods
2.1. Analytical Methods
Dry matter (DM) content was determined by drying at 105 °C ± 5 °C to constant weight followed by cooling in a desiccator. Organic dry matter (oDM) content was determined by incineration of the samples in a muffle furnace at 550 °C ± 5 °C using a furnace LMH 11/12 (LAC Ltd., Židlochovice, Czech Republic). For pH, redox, conductivity determination multi-parameter instrument WTW 3410 (Xylem Analytics Germany Sales GmbH & Co. KG, WTW, Weilheim, Germany) was used. For fatty acids and ammonia determination, ITP/CZE IONOSEP 2005 Analyzer (RECMAN Ltd., Ostrava, Czech Republic) was used.
2.2. Biomethanation Assay
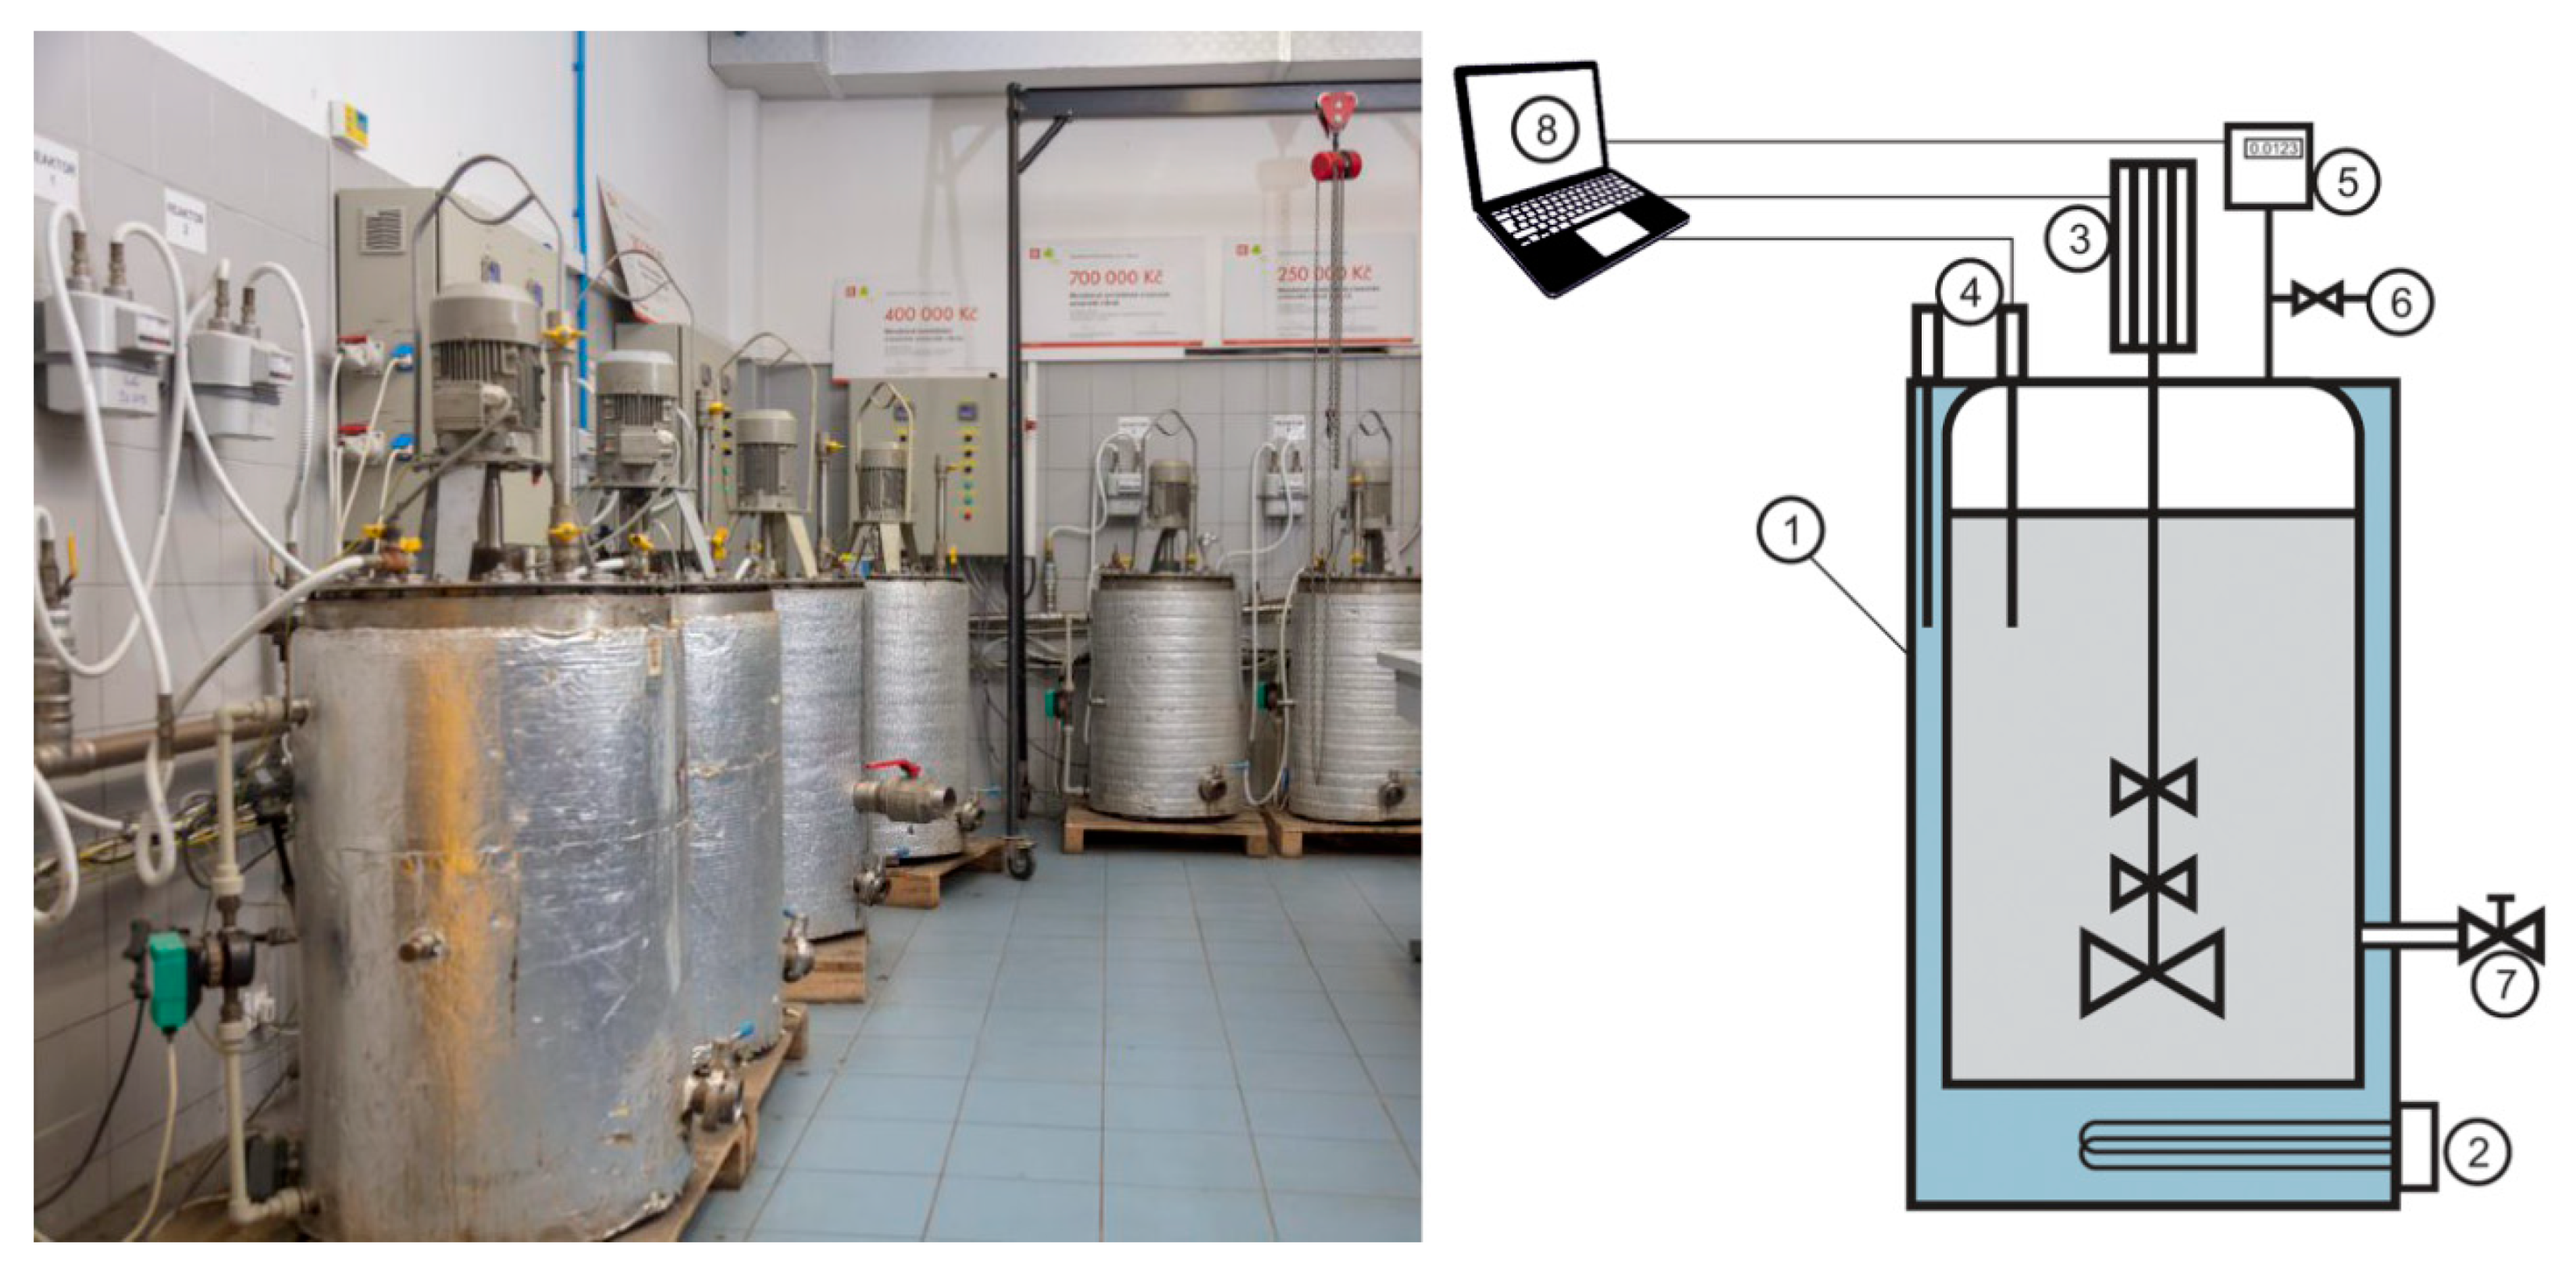
Biomethanation assay was performed in accordance with standard VDI 4613. Eight fermenters with the volume of 120 L each, were used (
Figure 1).
In the first day (day 0) of experiments, all fermenters were filled up with 50 L of inoculum (sludge from anaerobic stabilization) and 50 L of primary sludge, as a source of nutrients. Sludge samples were collected at wastewater treatment plant 513,000 PE, Modřice, Czech Republic. WWTP Modřice anaerobic sewage sludge stabilization is operated at mesophilic temperature (34 °C). Anaerobic sewage sludge mixture characteristics were pH = 7.2, dry matter (DM) content 2.64% and organic dry matter (oDM) content 56.90%. Before the biomethanation assay starts, the fermenters were tempered to the desired temperature. Fermenters No. 1, 2 (60 °C ± 0.5 °C), fermenters No. 3, 4 (50 ± 0.5 °C), fermenters No. 5, 6 (40 ± 0.5 °C), fermenter No. 7 and 8 (20 ± 0.5 °C). The retention time (RT) was 21 days, and the low-speed agitator was operated at 60 rpm with 1 minute agitation time alternated with 60 minutes of resting time. During the biomethanation assay quality of the biogas was determined daily using Dräger X-am 5600 gas analyzer (Drägerwerk AG & Co. KGaA, Lübeck, Germany). The concentration of CH4, CO2, H2S and H2 in the produced biogas was measured. The accuracy of the gas analyzer was checked daily by calibration gas mixture 60% CH4/40% CO2 (Drägerwerk AG & Co. KGaA, Lübeck, Germany). Quantity of biogas produced was measured by the gasometer PREMGAS BK G4 (Elster, Lotte, Germany) and calculated to standard conditions (T0 = 273.15 K and p0 = 101,325 Pa).
2.3. PCR Amplification of mcrA Gene and Sequencing
During the sewage sludge collection (day 0) at the WWTP Modřice, 4 × 50 mL of the sample from anaerobic stabilization tank were taken for DNA isolation. The methanogens can be directly targeted using molecular microbiological methods. The final step of biological methane synthesis is catalyzed by the enzyme methyl-coenzyme M reductase (MCR). Methyl-coenzyme M reductase (
mcrA) can be used to detect the methanogens in the samples. This sample gives us the information about the inoculum microbiome composition unaffected by temperature in the batch fermenters during the biomethanation assay. After 18 days of biomethanation assay, the samples for DNA isolation were collected from batch fermenters operated at different temperatures. Fermenter content was mixed prior to the sample collection. From each fermenter, 4 × 50 mL of liquid sample was collected to conical centrifuge tube. DNA extracted from 13 sludge samples by QIAamp PowerFecal DNA Kit (Qiagen, Hilden, Germany) were used as a template in PCRs with primers MLA-mod-F and mcrA-rev-R [
14] containing Illumina adapter overhang nucleotide sequences (MLA,
Table 1). PCR amplification was performed in a 25 µL reaction volume containing KAPA HiFi HotStart ReadyMix (Kapa Biosystems, Wilmington, MA, USA), 0.3 µM primers, and 4.0 µL of isolated DNA. The PCR program consisted of a hot start at 95 °C for 3 min, followed by 30 cycles of denaturation at 95 °C for 30 s, primer annealing at 60 °C for 30 s with a 50% thermal ramp, and extension at 72 °C for 30 s. PCR was terminated by a final extension at 72 °C for 5 min. After PCR, the amplification products were purified using an UltraClean PCR Clean-Up Kit (Qiagen, Hilden, Germany) according to the manufacturer’s instructions. Next, 5 µL of each of the purified PCR samples was tagged with NEXTERA indexes using the Nextera XT Indexes Kit (Illumina, San Diego, CA, USA) and the KAPA HiFi HotStart ReadyMix (Kapa Biosystems) in a 25 µL reaction volume according to the Illumina protocol. PCR products were purified using a GeneRead DNA size selection Kit (Qiagen, Hilden, Germany) according to the manufacturer’s protocol. Samples were eluted with 17 µL of 1xTE buffer, quantified using the Kapa Library Quantification Kit (Kappa Biosystems), and diluted to 4 nM concentrations. The final library was subjected to NGS using a MiSeq
® Reagent Kit v3 (2 × 300 paired-end sequencing) and an Illumina MiSeq sequencer according to the manufacturer’s instructions (Illumina, San Diego, CA, USA).
2.4. Sequences Analysis
Raw fastq reads were processed using the DADA2 [
16] package (version 1.16.0) in R (version 4.0.0). The analysis was carried out according to the standard operating procedure [
17]. Generally, results gained using DADA2 are comparable with older bioinformatics platforms such as QIIME [
18], but DADA2 as opposed to other pipelines does not cluster similar sequences into OTUs, but instead uses its algorithms to infer real biological amplicon sequence variants (ASVs) observed in samples. Briefly, reads were first filtered and trimmed (maximum of 5 ambiguous bases, expected error threshold of 5 and the last 20 bases truncated). Filtered reads were then de-replicated (unique sequences were extracted) and de-noised (identified sequencing errors were removed using learned error rates and quality profiles of reads). Reads were then merged, chimaeras removed, and taxonomy was assigned by the RDP naive Bayesian classifier method [
19] against an improved version of mcrA reference database [
20]. A phylogenetic tree was built using the phangorn [
21] package with the DECIPHER [
22] package used for multiple alignments.
The phyloseq [
23] and vegan [
24] packages were used for subsequent phylogenetic and statistical analyses, and the package ggplot2 [
25] was used for the graphical outputs. Datasets generated and analyzed during the current study are available in the SRA under project number BioProject ID: PRJNA641808XX.
2.5. Statistical Analysis
Using the experimental data, the basic statistical parameters (M—mean, SD—standard deviation, M ± SD) were calculated. The plots were built by software package Origin7.0 (Northampton, UK).
3. Results
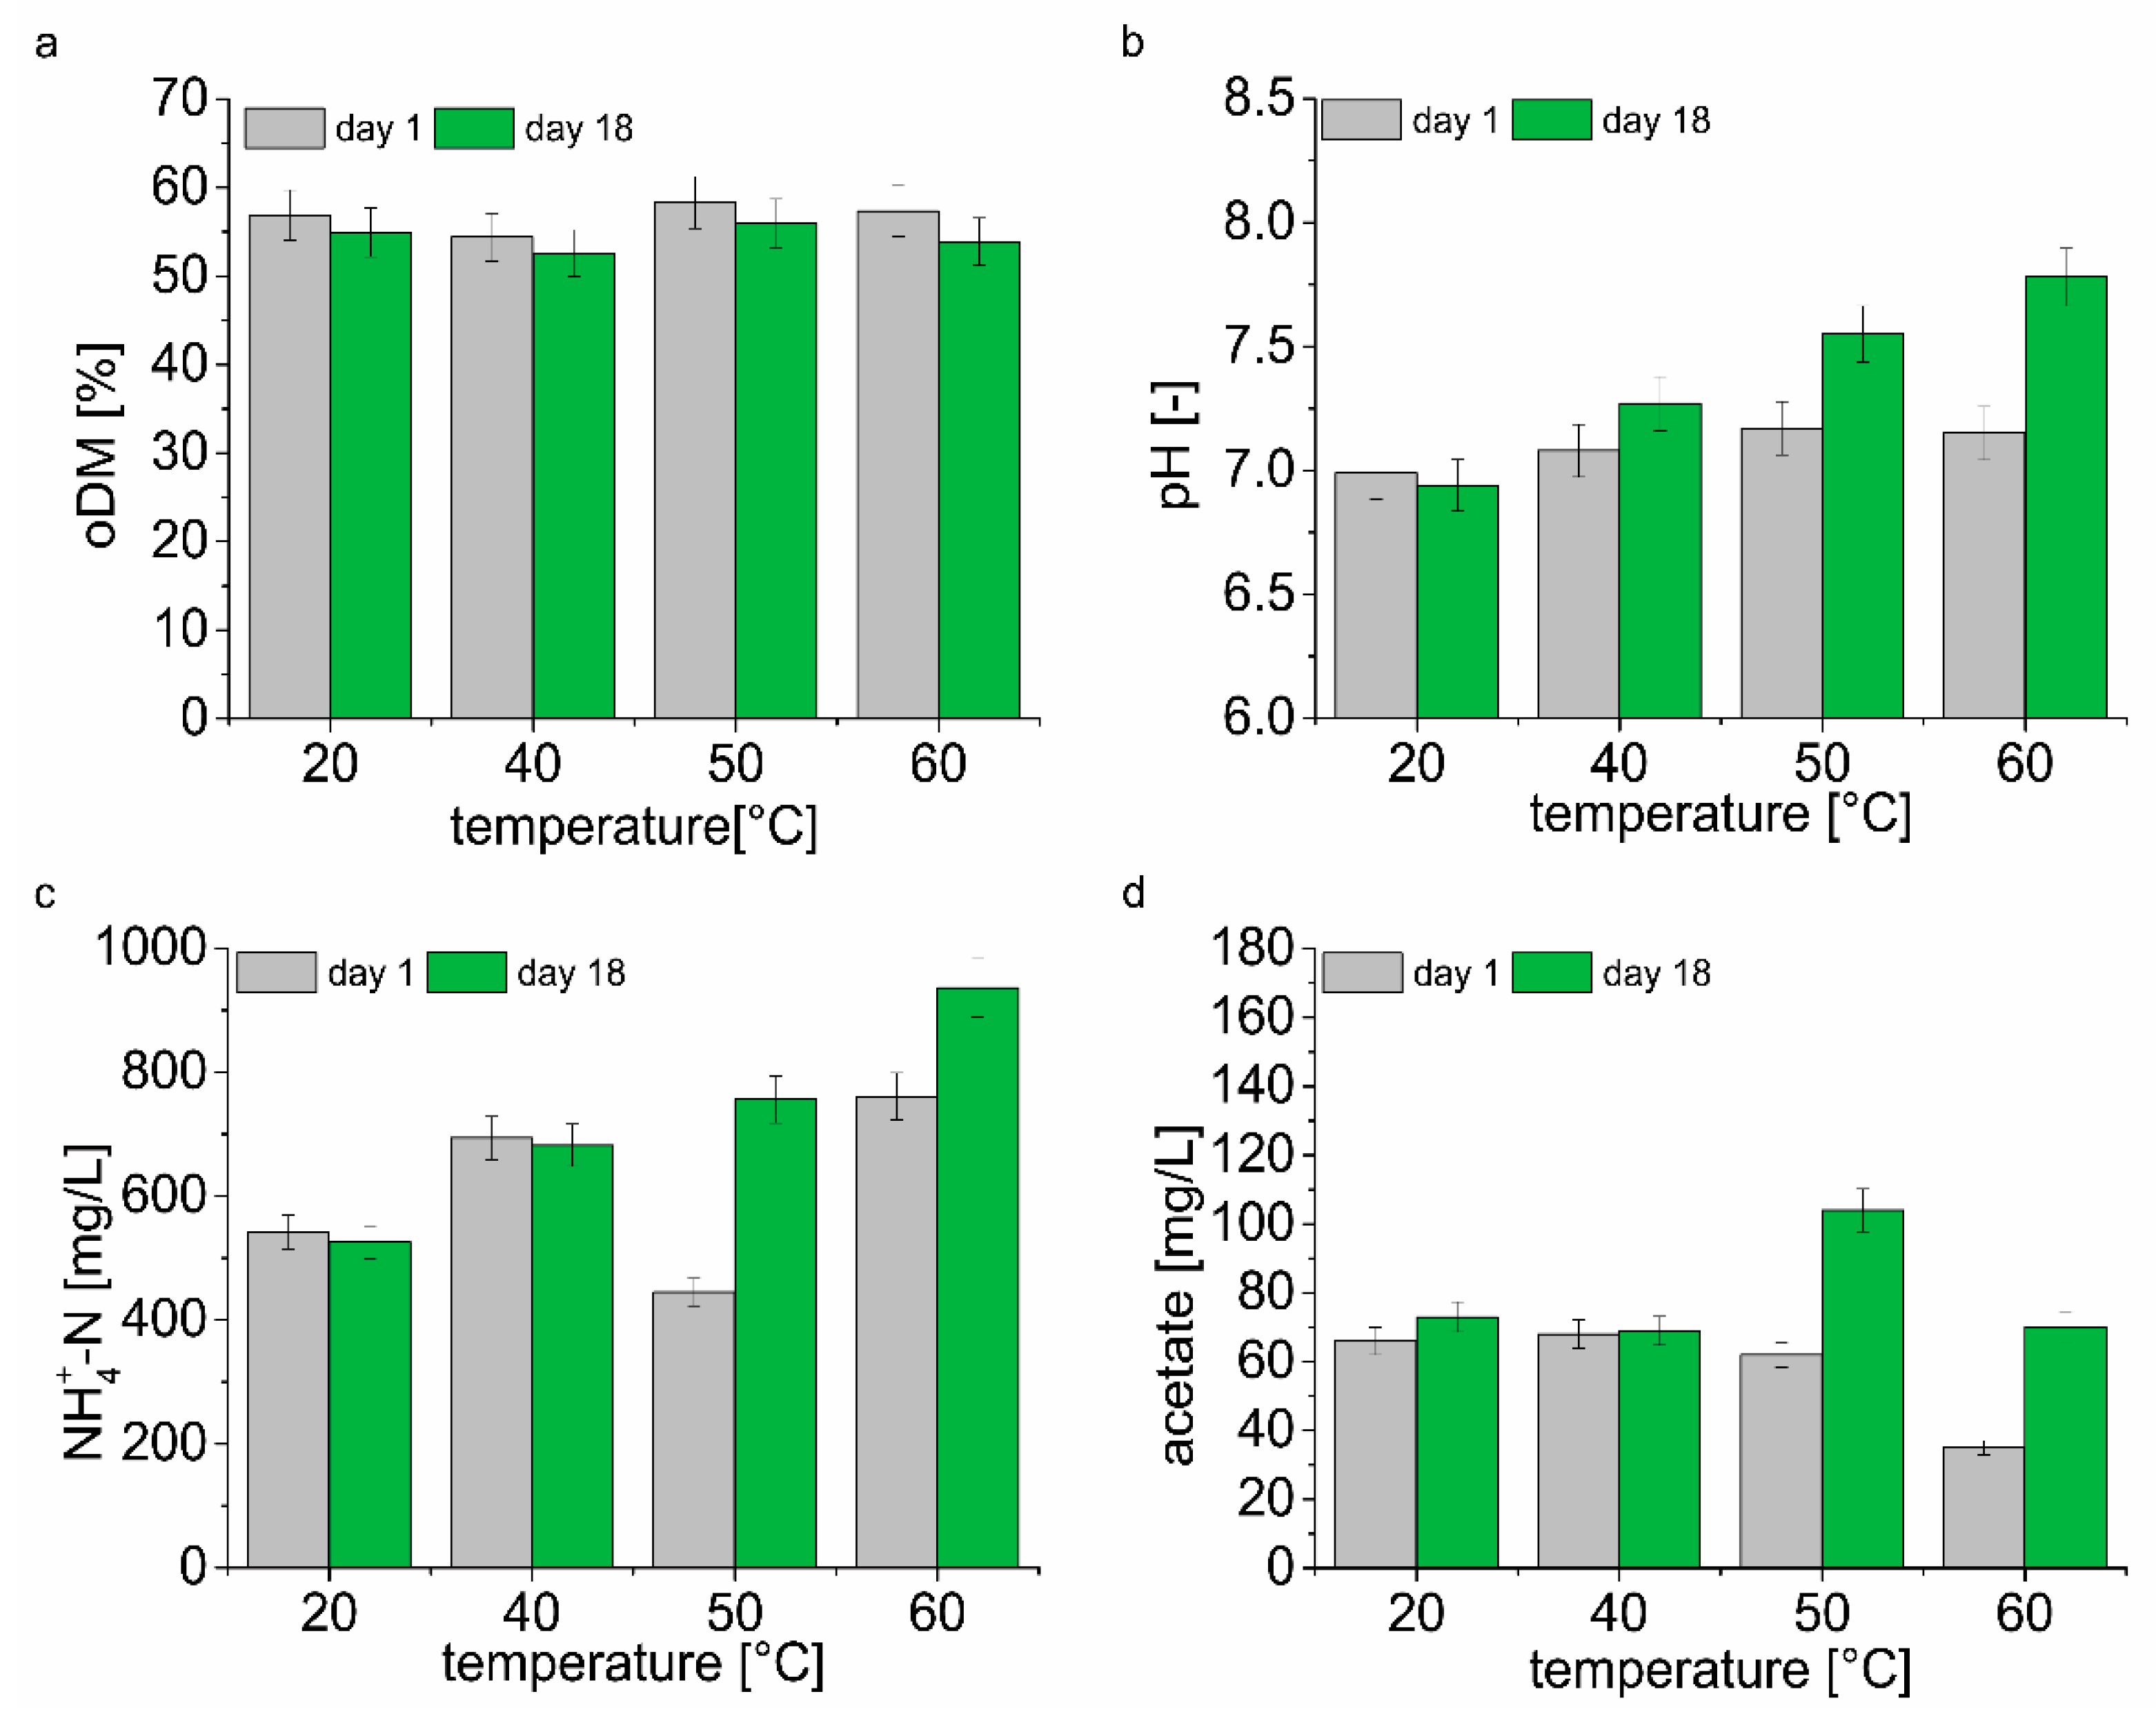
A comparison of the physical and chemical parameters in the second day (day 1) of biomethanation assay and on the day of sampling for DNA analysis (day 18) is shown in
Figure 2 and
Table S1. The results show the dependency between the temperatures and organic dry matter content degradation (
Figure 2a). The degradation of organic dry matter decreases with the drop in temperature. The highest oDM degradation of 6% was found at 60 °C, the lowest oDM degradation of 3.4% at 20 °C. Significant differences between pH of samples were determined only at 60, 50, and 40 °C after 18 days (
Figure 2b). At 60 and 50 °C, an increase in NH
4+-N concentration of 23% and 70%, respectively, was observed. On the contrary, at 40 and 20 °C decrease in NH
4+-N by 1.7% and 3%, respectively, was observed (
Figure 2c). There was a significant difference in acetate concentration in samples taken on day 1 and day 18 from fermenters operated at various temperature. During the biomethanation assay, an approximately twofold increase in acetate concentration was observed at 60 and 50 °C. At 20 and 40 °C, the increase in acetate concentration represented 10% and 1.5% of the original measured value (
Figure 2d). Concentrations of propionate, valerate and butyrate did not show any significant differences between sampling days at any temperature (
Table S1). Although there was an increase in the acetate concentration in the samples, there was no decrease in pH, on the contrary, the pH value increased or did not change significantly (20 °C) after 18 days of the experiment.
Tukey HSD (Honestly Significant Difference) test was performed, to compare changes in biogas composition on day 1 and day 18 of the biomethanation assay, (
Table S2). On day 1, the concentration of methane in the biogas differed significantly in fermenters operated at 40 and 50 °C and 20 and 60 °C. The hydrogen concentration was significantly different only in fermenter operated at 20 °C. There was no difference in hydrogen sulfide concentration between temperatures.
On day 18 a difference in the concentration of methane in biogas was found only for a temperature of 20 °C, (62% vol). The hydrogen and hydrogen sulfide concentrations were different only in fermenter operated at 60 °C on day 18. Results show that there was a decrease in hydrogen concentration when compare day 1 and day 18 values for all temperatures, except 20 °C, where no significant difference was found. Hydrogen sulfide showed the opposite trend, increase in concentration was found between day 1 and day 18 for fermenters operated at 60, 50, and 40 °C, an exception was fermenter operated at 20 °C, where no significant difference was found.
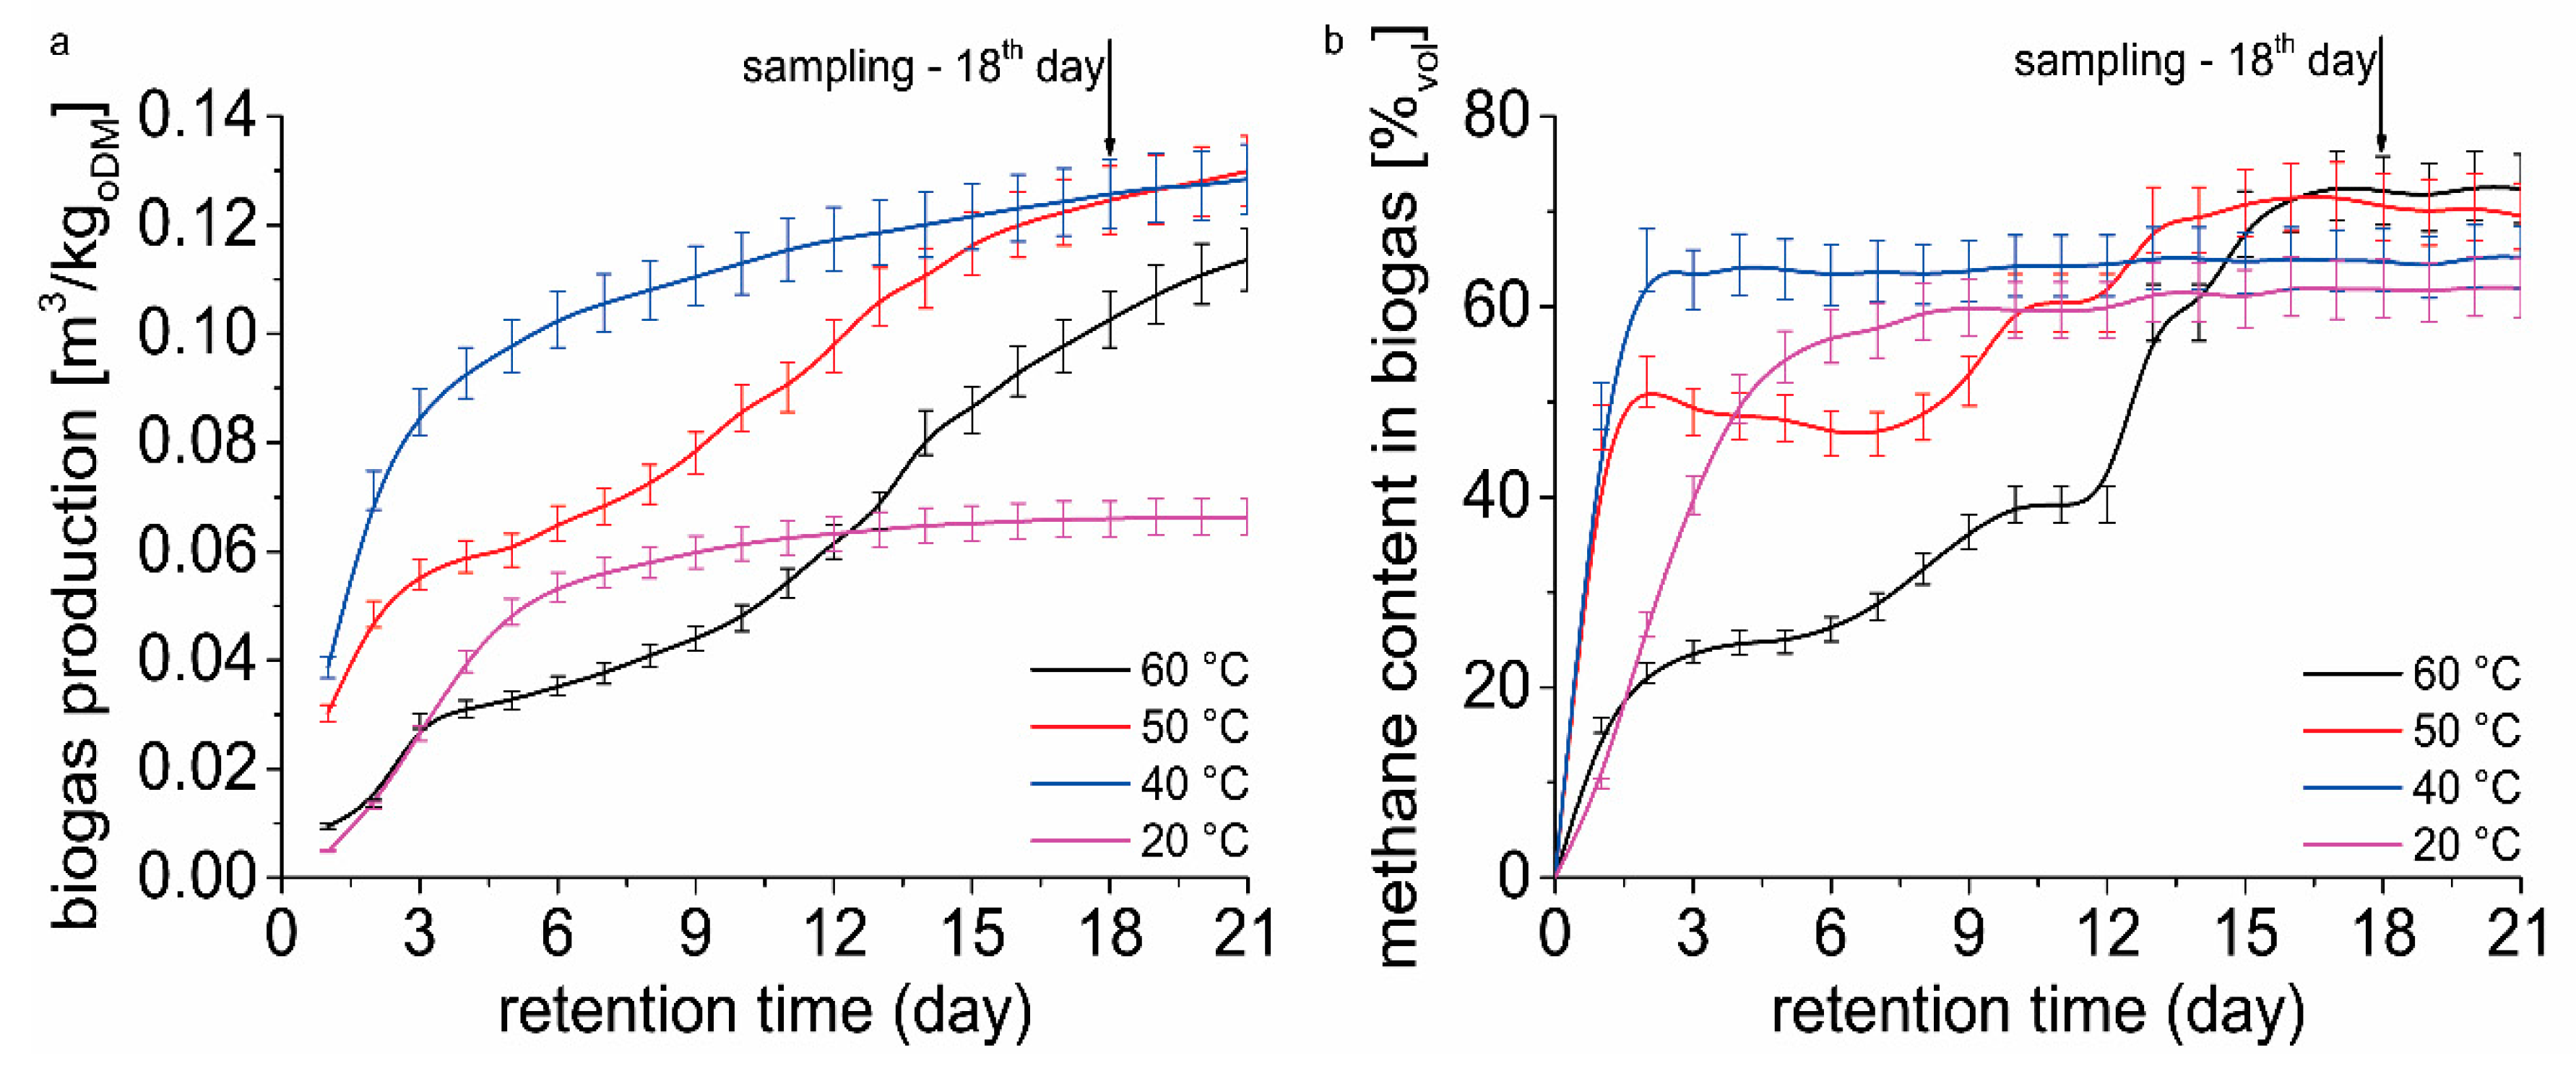
Figure 3a shows the cumulative biogas yield over 21 days of retention time. The figure shows the reason for choosing the sampling day for DNA isolation. On day 18, biogas production and quality (
Figure 3b) were assessed as stable and most suitable for sampling. We proceeded from the hypothesis that microbiome is already adapted to the conditions in the fermenter at individually tested temperatures. The effect of temperature on methane production can be clearly seen in
Figure 3. Fermenters operated at 20, 50, and 60 °C showed acclimation period for microbiome adaptation on the environment in the fermenter. There was no acclimation period observed in fermenter operated at 40 °C. When the temperature increased to 50 and 60 °C, the community adaptation lasted 8 and 12 days, respectively (acclimatization period). When temperature decreased to 20 °C the community adaptation lasted 2 days. After 21 days significant difference in biogas yield is evident (
Figure 3a). The lowest biogas yield was determined for the temperature of 20 °C. Despite the presence of organic matter in the fermenter, at 20 °C after 8 days of assay daily biogas yield increments were very low. Fermenters operated at 40 and 50 °C showed the highest biogas yield after 21 days. These temperatures showed different biogas yield course, caused by acclimation period at 50 °C. In fermenters operated at 60 °C, an acclimation period followed by the continuous increase of biogas yield was observed.
From the results (
Figure 3b), it is clear that a different temperature in the fermenter has an impact on the course of methane content in biogas. At 20 and 40 °C the stationary methane content in biogas was observed after 6 and 3 days of biomethanation assay, respectively. Increased temperature caused a slowdown in methane content in biogas after 2 days of the biomethanation assay. A continual increase in methane content in biogas was observed again after 8 and 12 days in fermenters operated at 50 and 60 °C, respectively. After 21 days of retention time, a significant difference in methane content was found only in fermenters operated at 20 °C.
A metagenomic study of the effect of temperature on the methanogenic archaea composition was performed. The structure of the methanogenic archaeal community was analyzed by sequencing the PCR products of the mcrA gene amplified by MLA-mod-F and mcrA-rev-R primer pair [
14] in 13 samples from three independent fermentations at four different temperatures (20, 40, 50, and 60 °C). Illumina sequencing produced 2,160,454 unjoined reads which were further analyzed by DADA2 package. DADA2, representing a bioinformatic package that attempts to correct sequencing errors to determine real biological sequences at single-nucleotide resolution by generating amplicon sequence variants (ASVs) instated of clustering of reads into operational taxonomic units (OTUs), was used. After joining, combining the sequences passing quality control filters, chimaera removal, and verifying the identity of the sequences as mcrA sequences 116,154 usable paired sequencing reads were obtained with a total number of 175 unique ASVs (
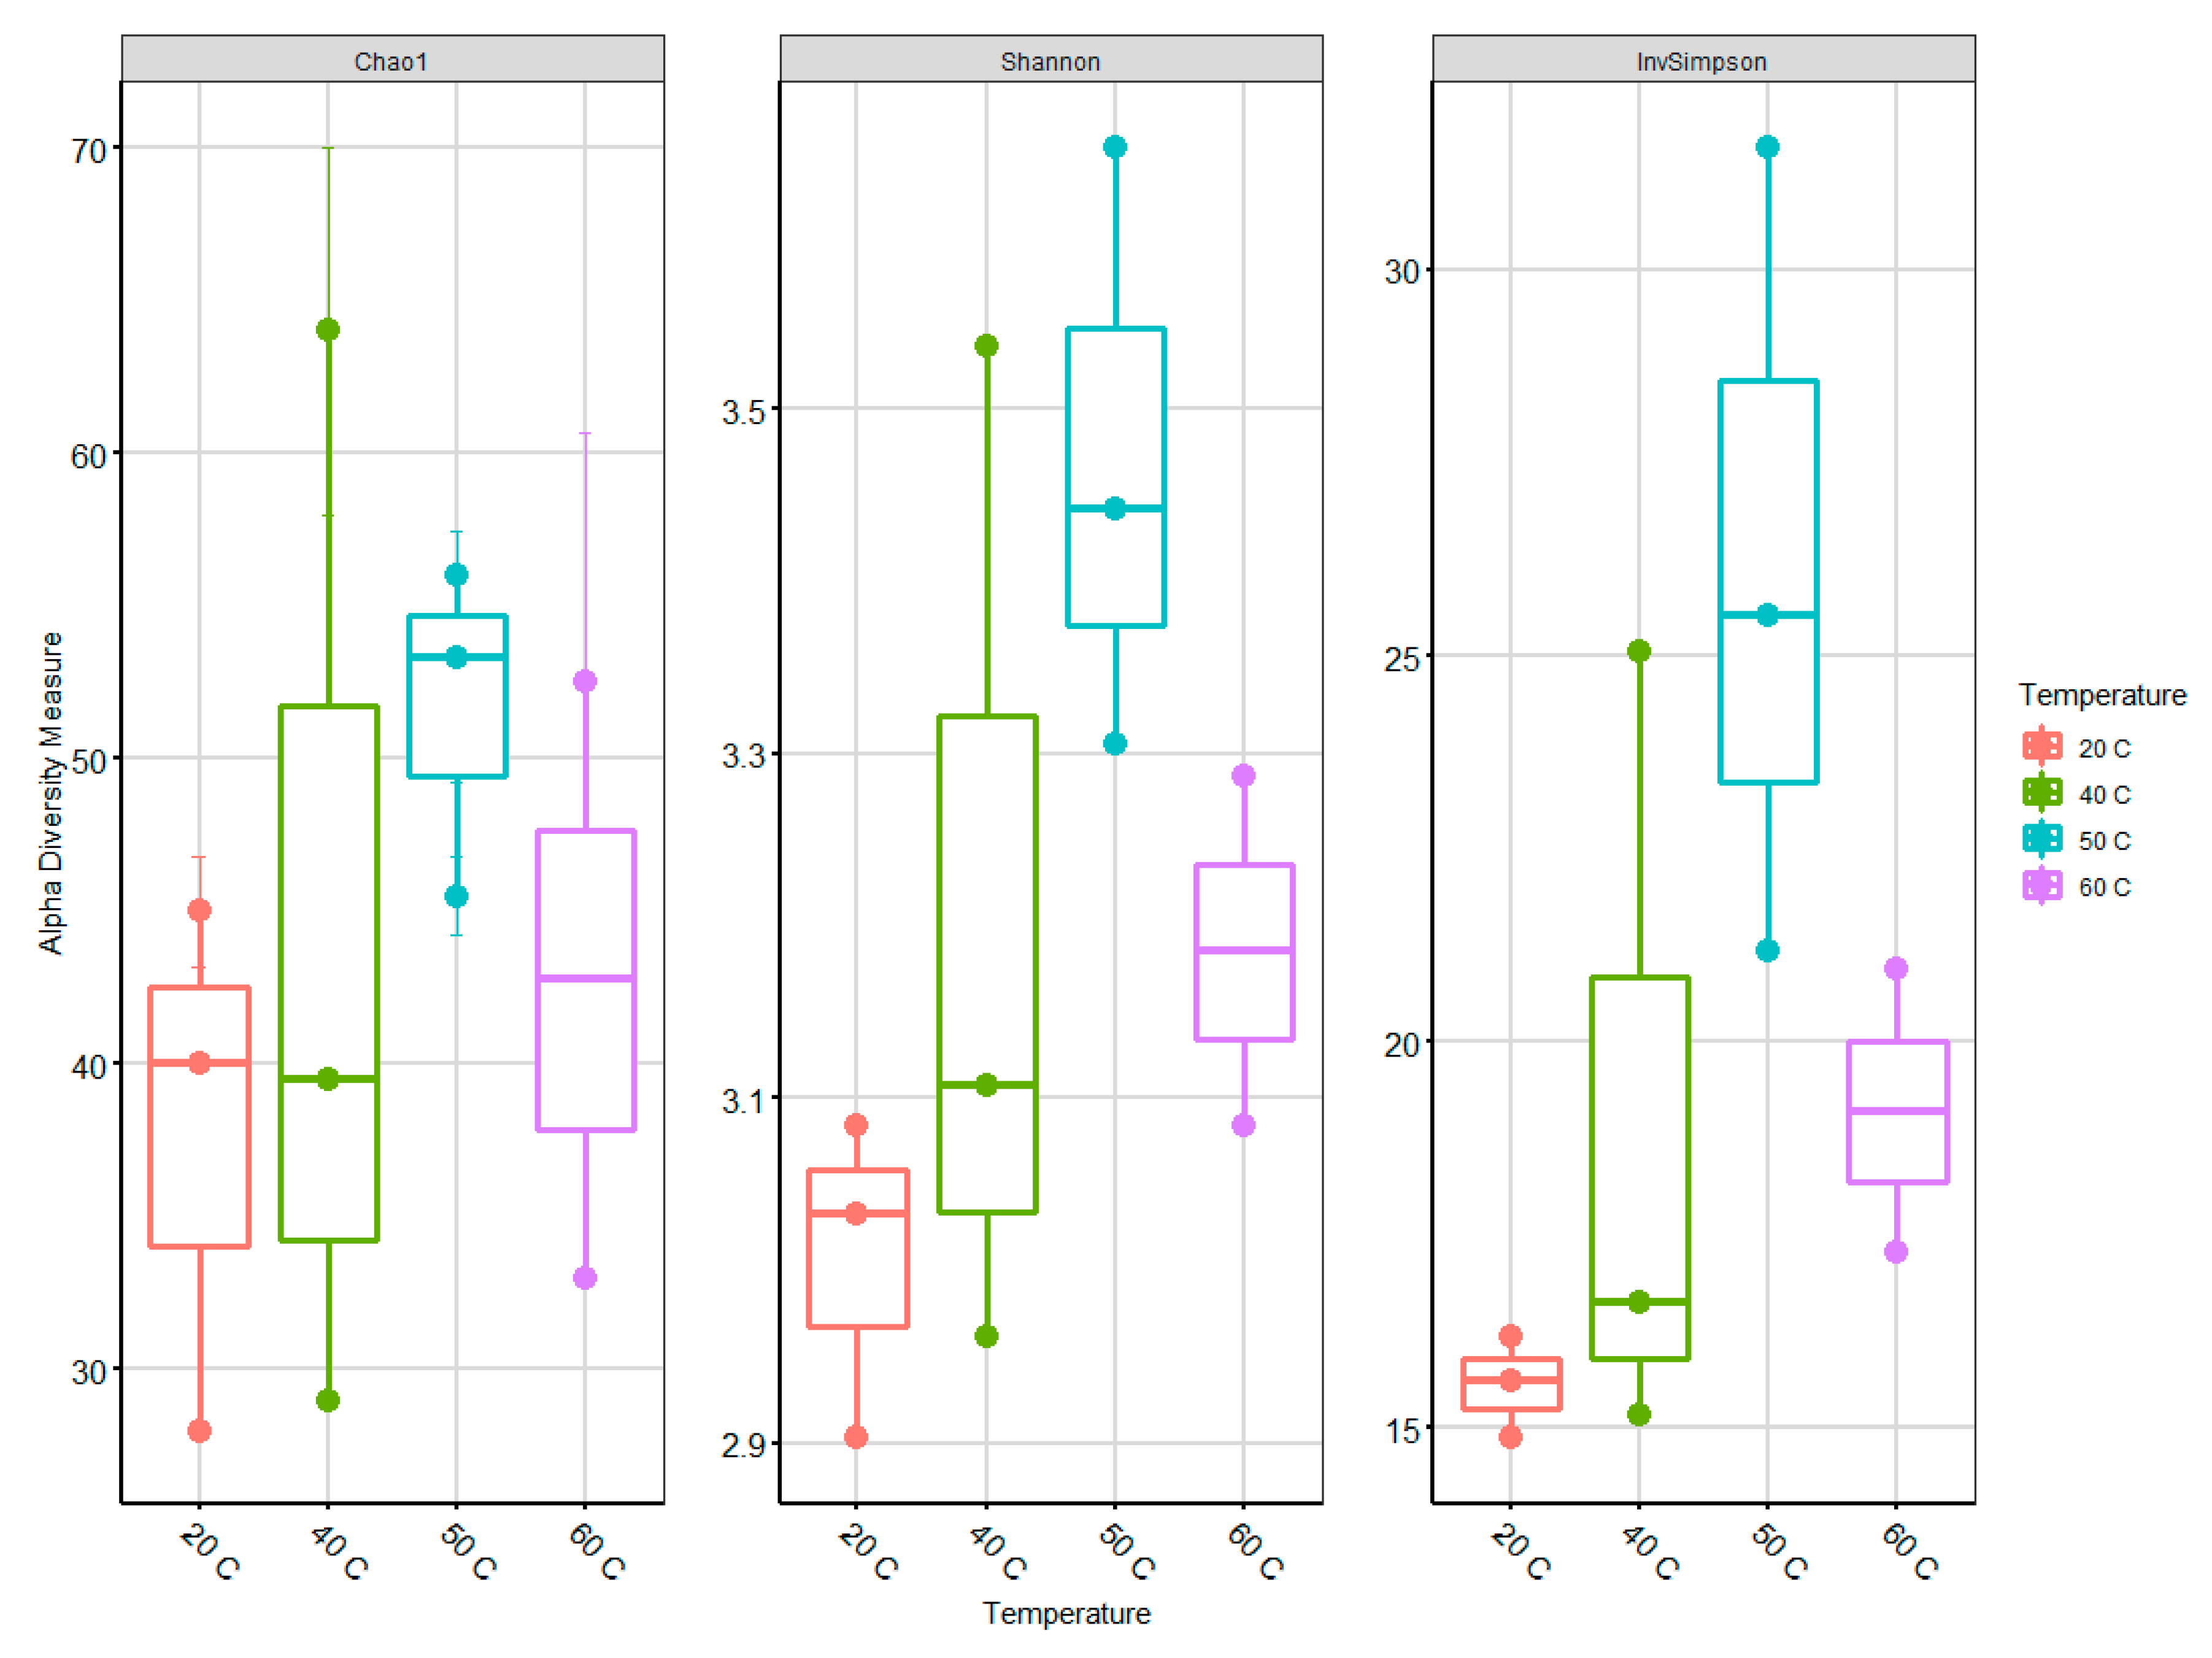
Table S3). One sample at 60 °C was excluded because of the very low numbers of sequences per samples. The mean length was 480 bp per sequence, and the sequences were subsampled (n = 5650) to ensure that a consistent and equal number of sequences from each sample be used for further analysis. The alpha diversity was calculated with normalized rarefaction values in collected samples from bioreactors to describe the archaeal community richness. In the case of species richness (estimated by Chao index) and diversity (determined by Shannon and InvSimpson indices), an increasing trend from 20 to 50 °C is evident with a marked decrease at 60 °C (
Figure 4).
Identification of nucleotide sequence identity of the representative sequences of the cluster with the naive-Bayes of DADA2 and improved version of mcrA reference database identified four classes, nine families, and 22 archaeal species in the analyzed samples (
Table S3).
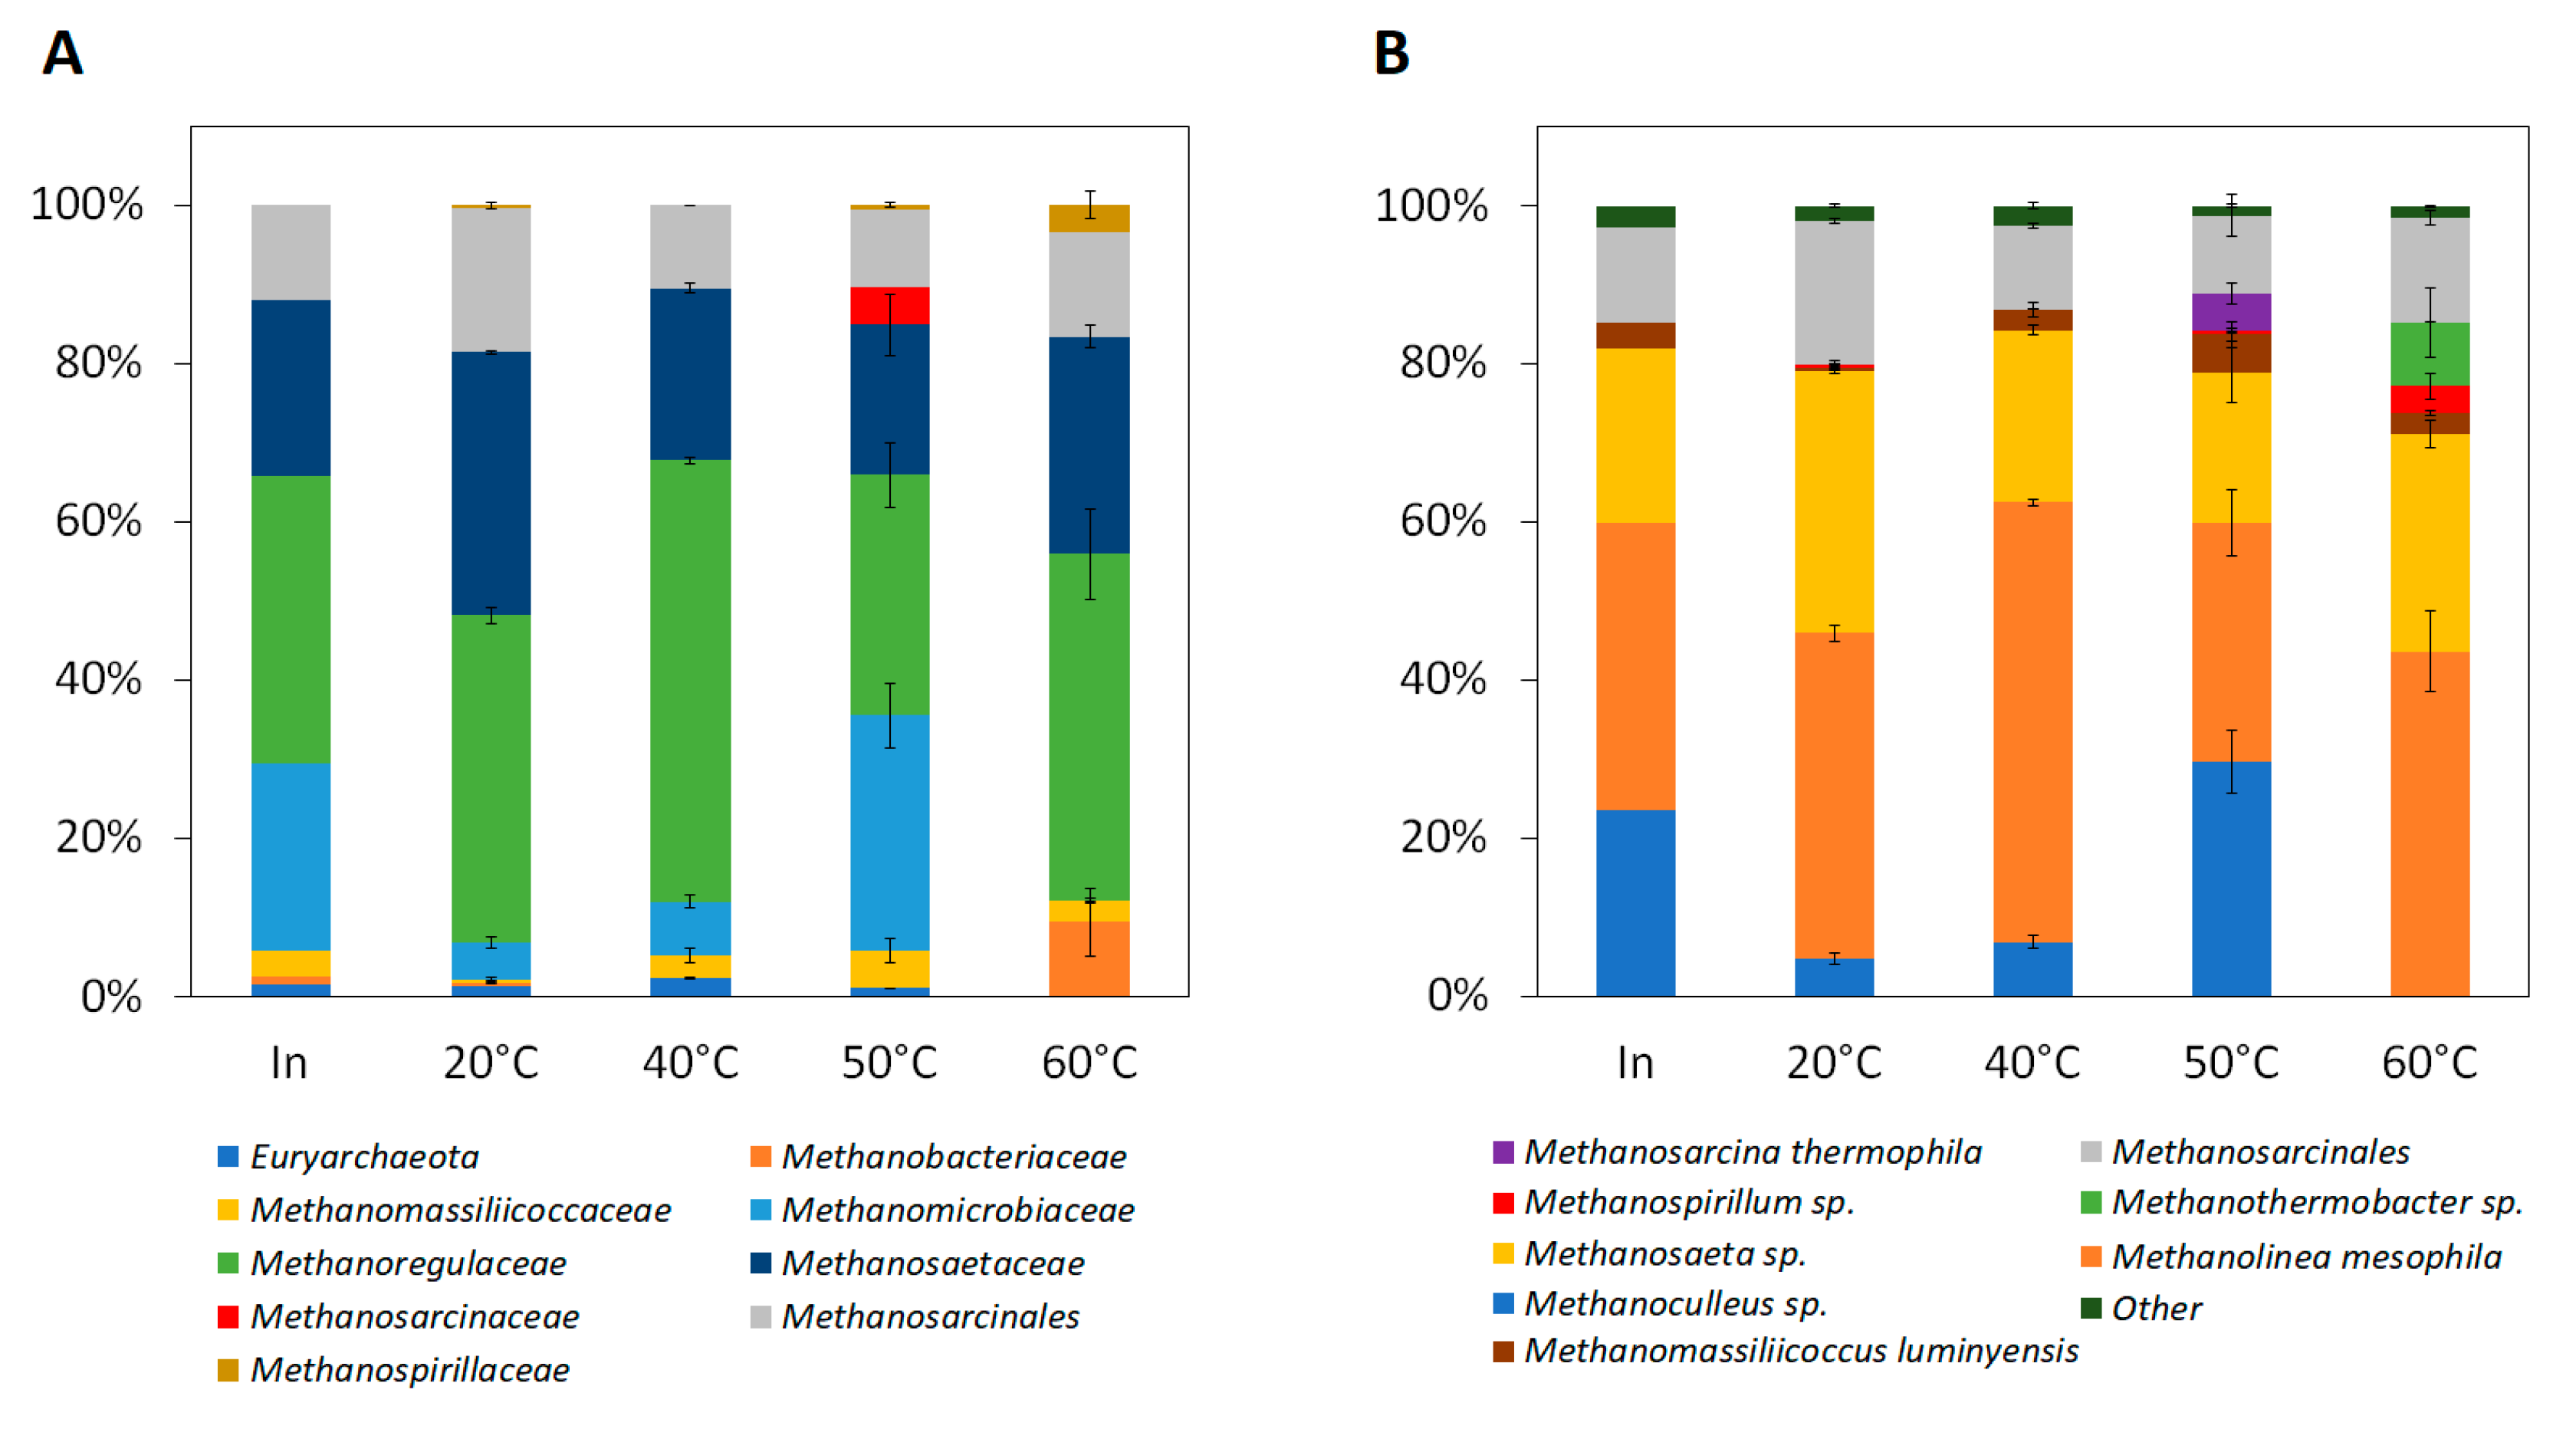
Figure 5 shows the archaea community and population shifts in the fermenters operated at different temperatures. Inoculum taken the first day of experiment directly from sewage sludge anaerobic stabilization tank at WWTP Modřice operated at mesophilic temperature 34 °C mostly resemble fermenters operated at 40 °C with moderately higher representation of family
Methanomicrobiaceae (24%) (
Figure 5A). Families
Methanoregulaceae,
Methanosaetaceae, and
Methanosarcinales represented 60–93% in all samples taken from fermenters. The methanogenic archaeal community did not differ significantly in fermenters operated at 20 and 40 °C, but in fermenters operated at 50 °C a substantially higher representation of
Methanomicrobiaceae (30%) together with the appearance of
Methanosarcinaceae (5%) was observed. Noticeably, in fermenters operated at 60 °C, there was an increase of
Methanobacteriaceae (9%) and
Methanospirilaceae (3%) with the simultaneous disappearance of the
Methanomicrobiaceae (
Figure 5A).
Comparing the results on the species level (
Figure 5B) the control sample (inoculum) was composed of hydrogenotrophic
Methanolinea mesophila (36%), acetoclastic
Methanosaeta sp. (22%), various representations of
Methanosarcinales and
Methanoculleus sp. (
Figure 5B). The community at 20 °C differs not significantly from the community at 40 °C. The difference was only in a higher abundance of
Methanolinea mesophila and
Methanomassiliicoccus luminyensis at 40 °C (
Figure 5B). On the other hand, a further shift in temperature resulted in a more pronounced change in community composition. At the temperature of 50 °C, a higher representation of
Methanoculleus sp. (comparable to those in the inoculum) was observed together with the presence of
Methanosarcina thermophila and
Methanospirillium sp. (
Figure 5B). Finally, at 60 °C, there was the most significant change in the methanogenic archaeal community. The
Methanothermobacter sp. were present in large numbers (
Figure 5B) while members of the
Methanoculleus sp. (present at all different temperatures) and
Methanosarcina thermophila (present only at 50 °C) disappeared (
Figure 5B).
4. Discussion
The results show the dependency between the temperatures and organic dry matter content degradation. This general fact was described by many authors [
26,
27]. Another phenomenon was also observed; free ammonia concentration increased with increasing temperature due to the deamination of amino acids. Accumulation of ammonia causes increase in pH. Several authors have found that when high ammonia-containing substrates are fermented, the inhibition will more easily occur at thermophilic temperatures than at mesophilic temperatures [
28,
29].
When the temperature drops to 20 °C, a significant decrease in methane production can be observed. It is generally known that biogas production in psychrophilic conditions is low. However, the concentration of methane in biogas on the day of collection is comparable to other temperatures. The process reached stable methane production on day 10 of the experiment. At this low temperature, representatives of the
Methanoregulaceae and
Methanosaetaceae families prevailed. Prevailing methanogens in the lowest tested temperature of 20 °C were
Methanolinea genus members, especially
Methanolinea mesophila. On the contrary, there was a 15% and 8% increase in
Methanosaeta sp. and
Methanosarcinales, respectively, in comparison with the temperature of 40 °C. Strictly the acetoclastic
Methanosaeta genus was predominant during processes characterized by both low acetate and ammonium concentration [
12] during the mesophilic anaerobic digestion of sludge.
Temperatures of 40 and 50 °C represent the environment that enables the growth of many various strains of methanogens when the diversity of the methanogenic archaea population has slightly increased (
Figure 5). The relative abundance of genus
Methanolinea seems to be on the same level through all measured temperatures. Another situation occurs in the case of the genus
Methanoculleus. This genus belongs to the family
Methanomicrobiaceae. In literature, it is described as mesophilic methanogenic microorganism living in marine environments, and it is ubiquitous in bioreactors, landfills, cow rumen, and wastewater [
30].
Methanoculleus genus members are prevalently hydrogenotrophic using H
2 + CO
2 and use formate as electron donors for methane production. These microorganisms are not able to metabolize acetate. Acetate concentration can be lowered due to the syntrophic acetate oxidizing bacteria (SAOB) in fermenters. For example,
Thermacetogenium phaeum was reported as an syntrophic acetate-oxidizing bacterium, isolated from a thermophilic (55 °C) anaerobic methanogenic fermenter [
31]. Hydrogen or formate can serve as interspecies electron carriers that are utilized by syntrophic partners, methanogens, or sulfate-reducing bacteria (SRB) [
32]. Syntrophic acetate oxidizing bacteria are operating the Wood-Ljungdahl pathway for acetate oxidation with simultaneously hydrogen production [
33]. Acetate is an important intermediate in the anaerobic degradation of organic matter, and up to 80% of produced methane on Earth can derive from acetate [
34,
35]. In anaerobic digestion processes, syntrophy is an important interspecies relationship that is of benefit to all contributing partners, and it is essential for the methanogenesis of organic matter [
36]. At the 50 °C the accumulation of acetate was observed. This can be caused by lack of population oxidizing acetate to hydrogen and carbon dioxide. When the temperature rises to 60 °C, a drop in acetate concentration occurred. This can be explained by microbial community shift and presence of SAOB. At the same time, hydrogen sulfide concentration in biogas increased as dissimilatory sulfate reduction (DSR) product of SRB bacteria.
In a fermenter operated at 60 °C, a significant decrease in methane production can be observed until the 12th day of fermentation (
Figure 3a). After 12 days, a slight increase in biogas production can be seen, which is, however, significantly lower compared to biogas production at 40 and 50 °C. This is correlated with authors who also observed the effect of temperature on biogas production and methane content [
26,
27,
37]. However, the concentration of methane in biogas on the day of collection is comparable to other temperatures. At this temperature, the most significant change in the composition of the methanogens community occurred, when compared between all tested temperatures. Representatives of the
Methanoregulaceae family predominate. Hydrogenotrophic
Methanolinea mesophila represents 44% methanogenic archaea at this temperature. The second prevailing genus (27%) in this thermophilic environment is
Methanosaeta, especially strain
Methanosaeta concilii (17%). This microorganism belongs to the order
Methanosarcinales.
Methanosaeta members can metabolize acetate as their sole source of energy.
Methanosarcinales can use acetoclastic and hydrogenotrophic pathways [
38], also with a higher growth rate concerning
Methanosaeta [
38]. As seen in other environments, the relative abundance of these two groups resulted also regulated by feeding rates [
38]. Presumably, due to their efficient adhesion,
Methanosaeta showed and higher resistance in digesters with high feeding rates.
On the other hand,
Methanosarcina is less tolerant of mixing. For this reason, generally dominated in fixed bed reactors [
38]. Exciting and expected is the presence of
Methanothermobacter representatives in samples fermented in the temperature of 60 °C. This thermophilic environment is for that methanogens typical.
M. marburgensis was present in 10% of all methanogens in those samples. This thermophilic hydrogenotrophic methanogen was for the first time isolated from anaerobic sewage sludge in Marburg, Germany [
39] as a member of
Methanobacteriales family.


