Article

Alternative Briquette Material Made from Palm Stem Biomass Mediated by Glycerol Crude of Biodiesel Byproducts as a Natural Adhesive

1
Departement of Chemical Engineering, Universitas Riau, Pekanbaru 28293, Indonesia
2
Department of Chemistry, Faculty of Mathematics and Natural Sciences, Universitas Syiah Kuala, Banda Aceh 23111, Indonesia
3
Department of Statistics, Faculty of Mathematics and Natural Sciences, Universitas Syiah Kuala, Banda Aceh 23111, Indonesia
4
Departement of Mechanical Engineering, Universitas Riau, Pekanbaru 28293, Indonesia
5
Department of Chemical Engineering, Faculty of Engineering, Universitas Syiah Kuala, Banda Aceh 23111, Indonesia
6
Department of Informatics, Faculty of Mathematics and Natural Sciences, Universitas Syiah Kuala, Banda Aceh 23111, Indonesia
7
School of Information, Systems and Modelling, Faculty of Engineering and Information Technology, University of Technology Sydney Ultimo, Ultimo, NSW 2007, Australia
*
Author to whom correspondence should be addressed.
Processes 2020, 8(7), 777; https://doi.org/10.3390/pr8070777
Submission received: 24 April 2020 / Revised: 24 June 2020 / Accepted: 29 June 2020 / Published: 2 July 2020
(This article belongs to the Special Issue Progress in Thermochemical Conversion of Solid Fuels)

Abstract

:
Recently, the global population has increased sharply, unfortunately, the availability of fossil fuel resources has significantly decreased. This phenomenon has become an attractive issue for many researchers in the world so that various studies in the context of finding renewable energy are developing continuously. Relating to this challenge, this research has been part of scientific work in the context of preparing an energy briquette employing palm oil stems and glycerol crude of biodiesel byproducts as inexpensive and green materials easily found in the Riau province, Indonesia. Technically, the palm oil stems are used for the production of charcoal particles and the glycerol crude as an adhesive compound in the production of energy briquettes. The heating value of palm oil stem is 17,180 kJ/kg, which can be increased to an even higher value through a carbonization process followed by a densification process so that it can be used as a potential matrix to produce energy briquettes. In detail, this study was designed to find out several parameters including the effect of sieve sizes consisting of 60, 80, and 100 mesh, respectively, which are used for the preparation of charcoal particles as the main matrix for the manufacture of the briquettes; the effect of charcoal-adhesive ratios (wt) of 60:40, 70:30, and 80:20; and the effect of varied pressures of 100, 110, and 120 kg/cm2 on the briquette quality. The quality of the obtained briquettes is analyzed through the observation of important properties which involve the heating value and the compressive strength using Response Surface Methodology (RSM). The results showed that the produced briquettes had an optimum heating value of 30,670 kJ/kg, while their loaded charcoal particles resulted from the mesh sieve of 80, in which there was a charcoal loading of 53 g and it pressed at 93.1821 bar, whereas, the compressive strength value of the briquette was 100,608 kg/cm2, which loaded charcoal particles from the mesh sieve of 100, the charcoal-adhesive ratio of 53:47 (wt) and the pressure of 93.1821 bar.

Graphical Abstract

1. Introduction

Along with economic growth, population, regional development, and development from year to year, the need for energy fulfillment from all sectors is also increased. Based on energy consumption released by the National Energy Board, it was proved that fuel consumption in 2009 increased rapidly by 18.1% in 5 years [1]. This increasing energy consumption has directly impacted oil prices, which has resulted in unstable oil prices so that some industrial energy has been switched to coal, including the energy of several industrial companies existing in Indonesia.
Coal is one of the important minerals widely found in Indonesia, therefore it has been used as the energy source for running industrial activity in many fields. As a matter of fact, the high consumption of coal in many fields (industry, transportation, etc.) has faced the depletion of these fuel resources in maintaining energy sustainability for people. This can be understood because the coal cannot be reproduced naturally (non-renewable fossil fuel). According to The Indonesian Coal Mining Association (APBI) and Price Waterhouse Coopers (PwC), the availability of coal was only 8.3 billion tons in 2015, and this source will be finished in the next few years while it is used continuously. It can be understood that the decreasing national energy resources and the increasing energy consumption (coal and fuel) have driven Indonesia to increase the import value of coal and fuel as the real strategy to maintain energy safety for domestic consumption [2]. Based on this situation, some efforts in order to find alternative renewable energy sources are certainly needed.
Supported by its geological situation, Indonesia is one of the potential countries with high potential renewable energy resources such as geothermal [3,4,5,6,7,8,9], hydro [10], biomass [11,12,13], solar [14,15,16], biofuel [17,18,19], and wind [20]. Indonesia has recorded 75,091 MW of geothermal energy, 29,164, 769.69 MW of mini/micro hydro-energy, 2.3 million SBM of biogas energy, 3000 MW of municipal waste, 480 kWh/m2/day of solar power, 3–6 m/s of wind power, and 161.5 million SBM of biofuels [21]. However, those renewable energy resources are not exploited optimally because this requires high technological skills and investigation. On the other hand, biofuel has been an attractive resource as a renewable, green, and economical energy source to maintain energy sustainability in Indonesia. For this purpose, the Indonesian government policy through Presidential Instruction No. 1 of 2006 accompanied by the Minister of Energy and Mineral Resources Regulation No. 25 of 2013 has been revealed to trigger the national concern on biofuel ISO. The regulation has been an obligation to use biofuel sources produced from biomass as an alternative fuel for maintaining domestic energy needs [22]. This means that the utilization of biofuel derived from biomass needs to be increased so that it can comply with national needs and support the government programs in realizing sustainable development for providing renewable resources for Indonesian people [22,23].
Supported by tropical diversity, the Indonesian rain forest provides many biomass resources. Every single part of the plant (root, stem, and shell) contains energy from carbon compounds such as lignin [24], cellulose [25], pectin [26,27,28], etc., which can be transformed into biofuel [29]. Among the many plants, the palm has the most potential as a biomass resource. As the main country in palm oil production, Indonesia is known as the largest country for palm oil production in the world [30]. This will naturally produce a large amount of biomass waste, including palm stem waste that can be used as a green biomass for energy briquette construction. Based on released data by the Director-General of Plantation, the palm area in the Riau Province is around 2.4 million hectares, with a total production in 2014 of 7,442,557 tons [31]. As an illustration, while 140 million palm oil stems can be planted in one hectare of land, the replanting process in the same plantation land results in 140 million palm oil stems as biomass waste. In addition, the biomass amount is expected to increase due to the increasing demand for palm oil plantation each year [32].
Based on several scientific investigations, some palm plant byproducts such as palm stems can be used as a biomass precursor converted into renewable energy materials. The application of the biomass could have several advantages, as follows: First, it is a renewable energy source that can guarantee the sustainability of production. Second, Indonesia is a major producer of palm oil, so the availability of raw materials will be guaranteed, and the industry is based on domestic production. Third, the development of these alternatives is an environmentally friendly production process. Fourth, it is also a form of optimization of resources used to increase added value.
Generally, carbon material conversion can be performed through several processes, such as densification [33], gasification [34], and pyrolysis [35]. The densification method can increase the calorific value per volume by compression and obtain a uniform shape that makes it easier to store and distribute. The criteria for fossil fuel substitutes are economically feasible, sustainable, and environmentally friendly. The production of briquettes from the palm biomass through the densification process can be a real and competitive solution in renewable energy production for substituting solid fuels such as coal.
It should be understood that the addition of additive components to the production of the briquettes has a positive impact on the heating value of the produced briquettes. Relating to this aspect, crude glycerol, which is noticed as a biodiesel byproduct, could possibly be utilized as a natural additive compound for briquette production. [36] Concerning some advantages of using palm stem materials and crude glycerol as it has been explained above, this research proposed the idea of combining palm stem biomass and crude glycerol from byproducts as adhesives for constructing energy briquettes. It can be assumed that the utilization of glycerol (without purification), which has a calorific value of 25,175.98 kJ/kg, can be useful as an enhancer of the combustion heat value, which leads to a reduction in processing costs [37].
It is important to find levels of particle size, adhesive composition, and pressing pressure factors which generate optimum scores of heating value and compressive strength. For achieving this, Response Surface Methods (RSM) can be applied. A study was performed to analyze the effect of the torrefaction factor on calorific value with a response surface model. The results were levels of factors which reached optimum calorific values [38]. Then, another study was conducted to identify the temperature and time levels of calorific value as an alternative energy source, and the result was a temperature and time value which maximized the optimum processing condition [39]. Furthermore, another study has been conducted to produce a high quality briquette with RSM. Central Composite Design (CCD) was used to identify the levels of temperature, time, and size which can produce the optimum heating value, mass yield, and energy yield. The result was a biomass especially in Empty Fruit Bunches (EFB) which can be upgraded [40].
In our research, we predict that optimum points can be identified by a second-order response surface model because characteristics of the analysis can determine the stationary point which is a point of maximum or minimum response or saddle point. One of the designs for fitting the second-order model is the Central Composite Design (CCD). This is the most popular class of designs used for fitting these models (Montgomery). Generally, the CCD consists of a 2k factorial with nF factorial runs, 2k axial runs, and nc center runs. Figure 1 describes CCD for k = 3 factors so it has 8 factorial runs, 6 axial runs, and 6 center runs. In fact, there is another design for fitting response surfaces, the Box–Bhenken Designs. These designs are formed by combining 2k factorials with incomplete block designs. The result of the designs is very efficient in the number of runs.
We think that CCD is more interesting than the Box–Bhenken Design. When we determine minimum and maximum levels of factors, CCD has bigger values in maximum levels and smaller values in minimum levels, although we have to use more runs than those of the Box–Bhenken Design.

2. Materials and Methods
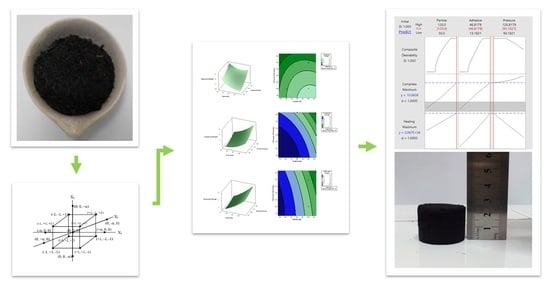
The supply of palm stem materials were obtained from local palm trees around the University of Riau campus while the crude glycerol by-product biodiesel was obtained from PT. Wilmar Bioenergy Indonesia. The equipment used consisted of reliable fuel manufacturing and testing units. The solid fuel manufacturing unit consisted of an analytical balance, furnaces, and presses, while the testing unit consisted of a Universal Testing Machine and a bomb calorimeter. The method used was the Central Composite Design (CCD) which is one of the Response Surface Methods (RSM). The analysis uses the DOE menu in a statistics package.

3. Experiment

The palm stem process consisted of cleaning, sizing, soaking, and drying. Firstly, the palm stems were divided into pieces and cleaned to remove any dirt on the surface. Then, those palm stems were carbonized in a furnace (Chemical Engineering Workshop of Bandung Insitute of Technology, Bandung, Indonesia) at 400 °C for 2 h, as it reported previously [42]. Furthermore, those charcoal particles prepared from palm oil stems were classified into three groups, and each group was sieved using a mesh size of 60, 80, and 100, respectively. Each charcoal powder was mixed with crude glycerol by-product biodiesel with a weight ratio of 60:40, 70:30, and 80:20 wt resulting in suspension products with different matrix ratios. The briquette molding was constructed by using a hydraulic press with a variation pressure of 100, 110, and 120 kg/cm2 and a pressure time of 10 s [42]. The tools were made by the Energy Conversion Laboratory at Universitas Riau. The obtained briquettes were dried naturally under the sun’s light exposure for 5 h. Finally, the briquette product was tested for heating value by using a bomb calorimeter and compressive strength using a Universal Testing Machine (A&D Company, Tensilon RTF-2430, Capacity 30 KN, Tokyo, Japan).

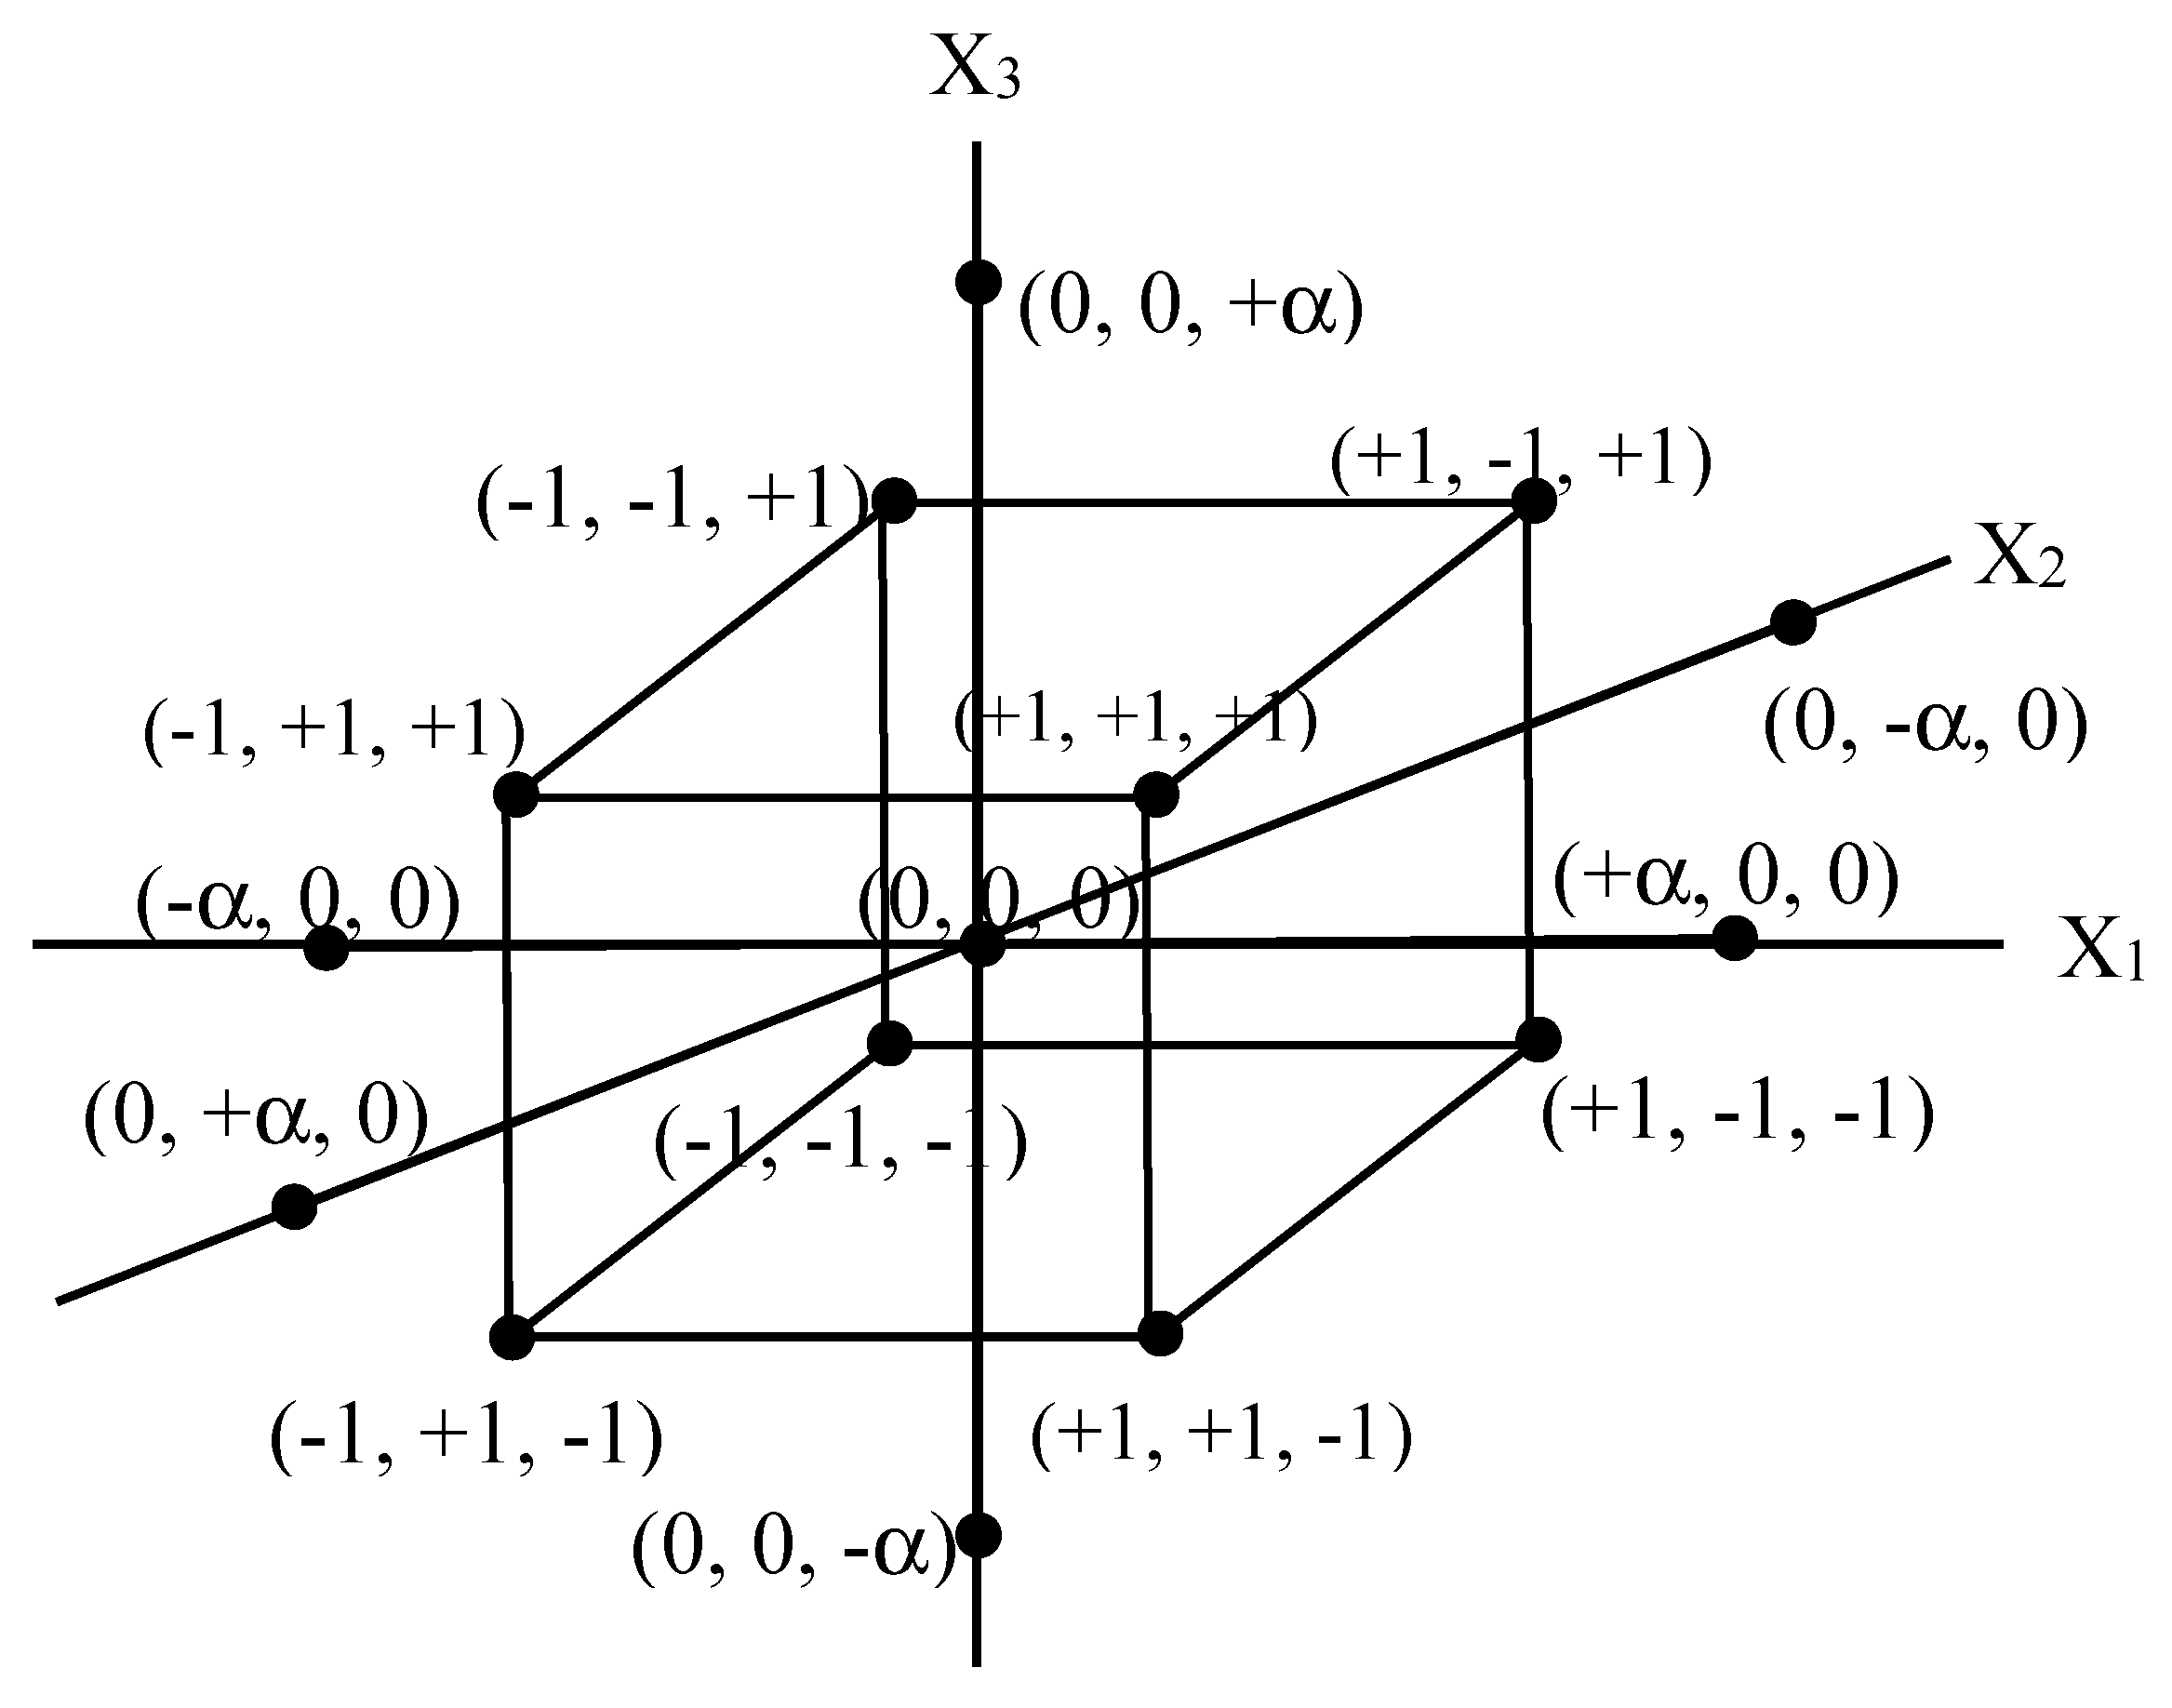
4. Central Composite Design (CCD)

The Central Composite Design (CCD) was applied to investigate the linear, quadratic, cubic, and cross-product effects of the three process variables (particle size, adhesive composition, and pressure pressing) on the calorific value and compressive strength (response) of the obtained briquettes in this experiment. Table 1 listed the range and levels of the three independent variables which were studied in this experiment. Relations between coded variables and uncoded variables can be shown in Equations (1)–(3). The purpose of the research was to identify particle size, adhesive composition, and pressure pressing levels which generate the optimum heating value and compressive strength. This purpose can be reached by CCD. The CCD comprised twenty points from a two-level factorial design or cube points (2k = 23 = 8 points), six axial or star points, and six center points. The two level was represented by 2k (one minimum level and one maximum level) which was powered k, where k was the number of factors, the other words were (−1,−1,−1), (−1,−1,1), (−1,1,−1), (−1,1,1), (1,−1,−1), (1,−1,1), (1,1,−1), and (1,1,1). Six axial points consisted of (−α,0,0), (+α,0,0), (0,−α,0), (0,α,0), (0,0,−α), and (0,0,+α). Six center points were six (0, 0, 0) points. The value of an alpha (α) for this CCD was fixed at 1.68. The value was from α = ( n F ) 1 / 4 , where n F was the number of cube points [41]. The combination of the cube points, the axial points, and center points are shown in Figure 1.
X 1 = P a r t i c l e   s i z e ( P a r t i c l e   s i z e [ l o w ] + P a r t i c l e   s i z e [ h i g h ] ) / 2 ( P a r t i c l e   s i z e [ h i g h ] P a r t i c l e   s i z e [ l o w ] ) / 2 = ξ 1 80 20
X 2 = A d h e s i v e   c o m p . ( A d h e s i v e   c o m p . [ l o w ] + A d h e s i v e   c o m p . [ h i g h ] ) / 2 ( A d h e s i v e   c o m p . [ h i g h ] A d h e s i v e   c o m p . [ l o w ] ) / 2 = ξ 2 30 10
X 3 = P r e s s u r e   p r e s s i n g ( P r e s s u r e   p r e s s i n g [ l o w ] + P r e s s u r e   p r e s s i n g [ h i g h ] ) / 2 ( P r e s s u r e   p r e s s i n g [ h i g h ] P r e s s u r e   p r e s s i n g [ l o w ] ) / 2 = ξ 3 110 10
Each response of the process was used to develop a mathematical model that correlated the calorific value and compressive strength process variables which were studied through first order, second order, and interaction terms, according to the following second-order polynomial equation:
Y = β0 + β1X1 + β2X2 + β3X3 + β11X12 + β22X22 + β33X32 + β12X1X2 + β13X1X3 + β23X2X3
where Y is the predicted heating value and compressive strength, Xi and Xj represent the variables in code, b0 is the offset term, bj is the linear effect, bij is the first-order interaction effect, and bjj is the squared effect.
Equation (4) can be written in matrix notation [43]:
y ^ = β ^ 0 + x b + x B x
where
x = [ x 1 x 2 x k ]   b = [ β ^ 1 β ^ 2 β ^ k ]   B = [ β ^ 11 β ^ 12 / 2 β ^ 22 β ^ 1 k / 2 β ^ 2 k / 2 sym β ^ kk ] .
The stationary point or the solution of Equation (1) is
x s = 1 2 B 1 b

5. Results and Discussion

5.1. Raw Material and Product Characterization

The palm stem, which is noted as a raw material in this experiment, has been characterized to evaluate its heating value and proximate analysis. The proximate analysis included water content, ash content, volatile matter content, and carbon bound content. The characterization results of palm stem charcoal and palm stem briquettes are shown in Table 2. The characteristics were evaluated at the Oleochemical Technology Laboratory at Universitas Riau except heating value and compressive strength which were evaluated at the Energy Conversion Laboratory at Universitas Riau.
The heating value of oil palm stems after treatment by the carbonization process increased by 19.73%. The increasing carbon content influenced the increase in the heating value of the oil palm charcoal. This fact is consistent with previous research reported by [43] in which the carbonization process enhanced the carbon content and the heat value by 44.6%. However, water and volatile contents decreased by 71.15% and 63.04%, respectively, due to the carbonization treatment. It can be realized that the lower water content and the volatile substances led to a greater calorific value, dealing with the previous report [44]. As considered, the densification process increased the calorific value of palm charcoal by 1.2–29.4% [42,45], however, the densification process increased the water content, the impact because of the crude glycerol still containing water substances, by 2–3% wt [46]. Meanwhile, ash levels and volatile substances decreased while the heating value increased [44].
Table 3 showed the summary of the response of the heating value and compressive strength, which was processed using one of the methods in the Respond Surface Method (RSM) that resulted in this experiment. The method was a CCD with three factors. The factors were particle size ( ξ 1 ) , adhesive composition ( ξ 2 ) , and pressure pressing ( ξ 3 ) . In Table 3, A = ξ 1 , B = ξ 2 and C = ξ 3 . ξ was transformed to X using Equations (2)–(4) in the CCD. For illustration, X 1 = ξ 1 80 20 = 60 ( 60 + 100 ) / 2 ( 100 60 ) / 2 = 60 80 20 = 1 , X 1 = ξ 1 80 20 = 80 ( 60 + 100 ) / 2 ( 100 60 ) / 2 = 80 80 20 = 0 , X 1 = ξ 1 80 20 = 100 ( 60 + 100 ) / 2 ( 100 60 ) / 2 = 100 80 20 = 1 , X 1 = α 80 20 = 50 ( 60 + 100 ) / 2 ( 100 60 ) / 2 = 50 80 20 = 1.5 , and X 1 = α 80 20 = 12 o ( 60 + 100 ) / 2 ( 100 60 ) / 2 = 120 80 20 = 2 . The code of X2 and X3 can be calculated in the same way.
The accuracy of the model can also be determined from the comparison of the actual value of the study with predictions from the standard deviation. The results of the model (predicted) were expressed as a straight line and the actual data of the research results (actual) were represented in the form of scattered boxes, as shown in Figure 2. This has excellent precision, so the data obtained did not have a far spread.
The value of the F table was F (α, df1, df2), and the probability level used was α = 0.05, where df was the degree of freedom. The F0 value for each response to the heating value can be seen in Table 4.
A summary of the results of the response curvature test in this study can be seen in Table 4. It can be seen that the p-values of the model for both responses fulfilled the p-value regression test requirements, p-values < α = 0.05. The p-value was the value used to test component influences against heating values and compressive strength variables. For the response of the heating value and compressive strength, the lack of fit p-values was not significant (see Table 4), they mean errors that are caused by choosing models that are not significant. The model of the heating value and compressive strength can be seen in Equations (5) and (6).
Model of heating value in uncoded is:
Heating Value = −42209 + 421 A + 904 B + 535 C + 0.037 A ∗ A + 0.76 B ∗ B + 0.32 C ∗ C − 0.32 A ∗ B − 3.76 A ∗ C − 7.10 B ∗ C
For example, using the model, if particle size = 100 mesh, adhesive composition = 30% wt, and pressure pressing = 50 kg/cm2 then the heating value is 25,205 kJ/kg, see equation below. The heating value is not a maximum point.
25205 k J k g = 42209 + 421 ( 100   m e s h ) + 904 ( 30 %   w t ) + 535 ( 50 k g c m 2 ) + 0.037 ( 100   m e s h ) ( 100   m e s h ) + 0.76 ( 30 %   w t ) ( 30 %   w t ) + 0.32 ( 50 k g c m 2 ) ( 50 k g c m 2 ) 0.32 ( 100   m e s h ) ( 30 %   w t ) 3.76 ( 100   m e s h ) ( 50 k g c m 2 ) 7.10 ( 30 %   w t ) ( 50 k g c m 2 )
Model of compressive strength in uncoded is:
Compressive Strength = 38.7 − 0.342 A − 0.437 B − 0.418 C + 0.000490 A∗A − 0.00138 B ∗ B + 0.00206 C ∗ C + 0.00782 A ∗ B + 0.00071 A ∗ C − 0.00045 B ∗ C
For example, using the model of compressive strength, if particle size = 100 mesh, adhesive composition = 30% wt, and pressure pressing = 50 kg/cm2 then the compressive strength is 5.633 kg/cm2, see equation below.
5.633 k g c m 2 = 38.7 0.342 ( 100   m e s h ) 0.437 ( 30 %   w t ) 0.418 ( 50 k g c m 2 ) + 0.000490 ( 100   m e s h ) ( 100   m e s h ) 0.00138 ( 30 %   w t ) ( 30 %   w t ) + 0.00206 ( 50 k g c m 2 ) ( 50 k g c m 2 ) + 0.00782 ( 100   m e s h ) ( 30 %   w t ) + 0.00071 ( 100   m e s h ) ( 50 k g c m 2 ) 0.00045 ( 30 %   w t ) ( 50 k g c m 2 )
In the heating value response variable model, the main effects of B and C, and the interaction effects of AC and BC were significant (Table 5, Figure 3, Figure 4 and Figure 5). The determination coefficient (R2) of the heating value was 90.5%, which means that the model could explain heating value accurately because it was near 100%. For compressive strength, the main effects of A, B, and C, and the interaction effect of AB were significant (Table 5, Figure 6 and Figure 7). The R2 of compressive strength was 87.6%, which means that the compressive strength could be largely explained by A, B, and C through the model. The Mean Absolute Percentage Errors (MAPEs) of the heating value and compressive strength were 1.681% and 27.575%, respectively, and the Root Mean Square Errors (RMSEs) were 708.304 and 0.836, respectively.

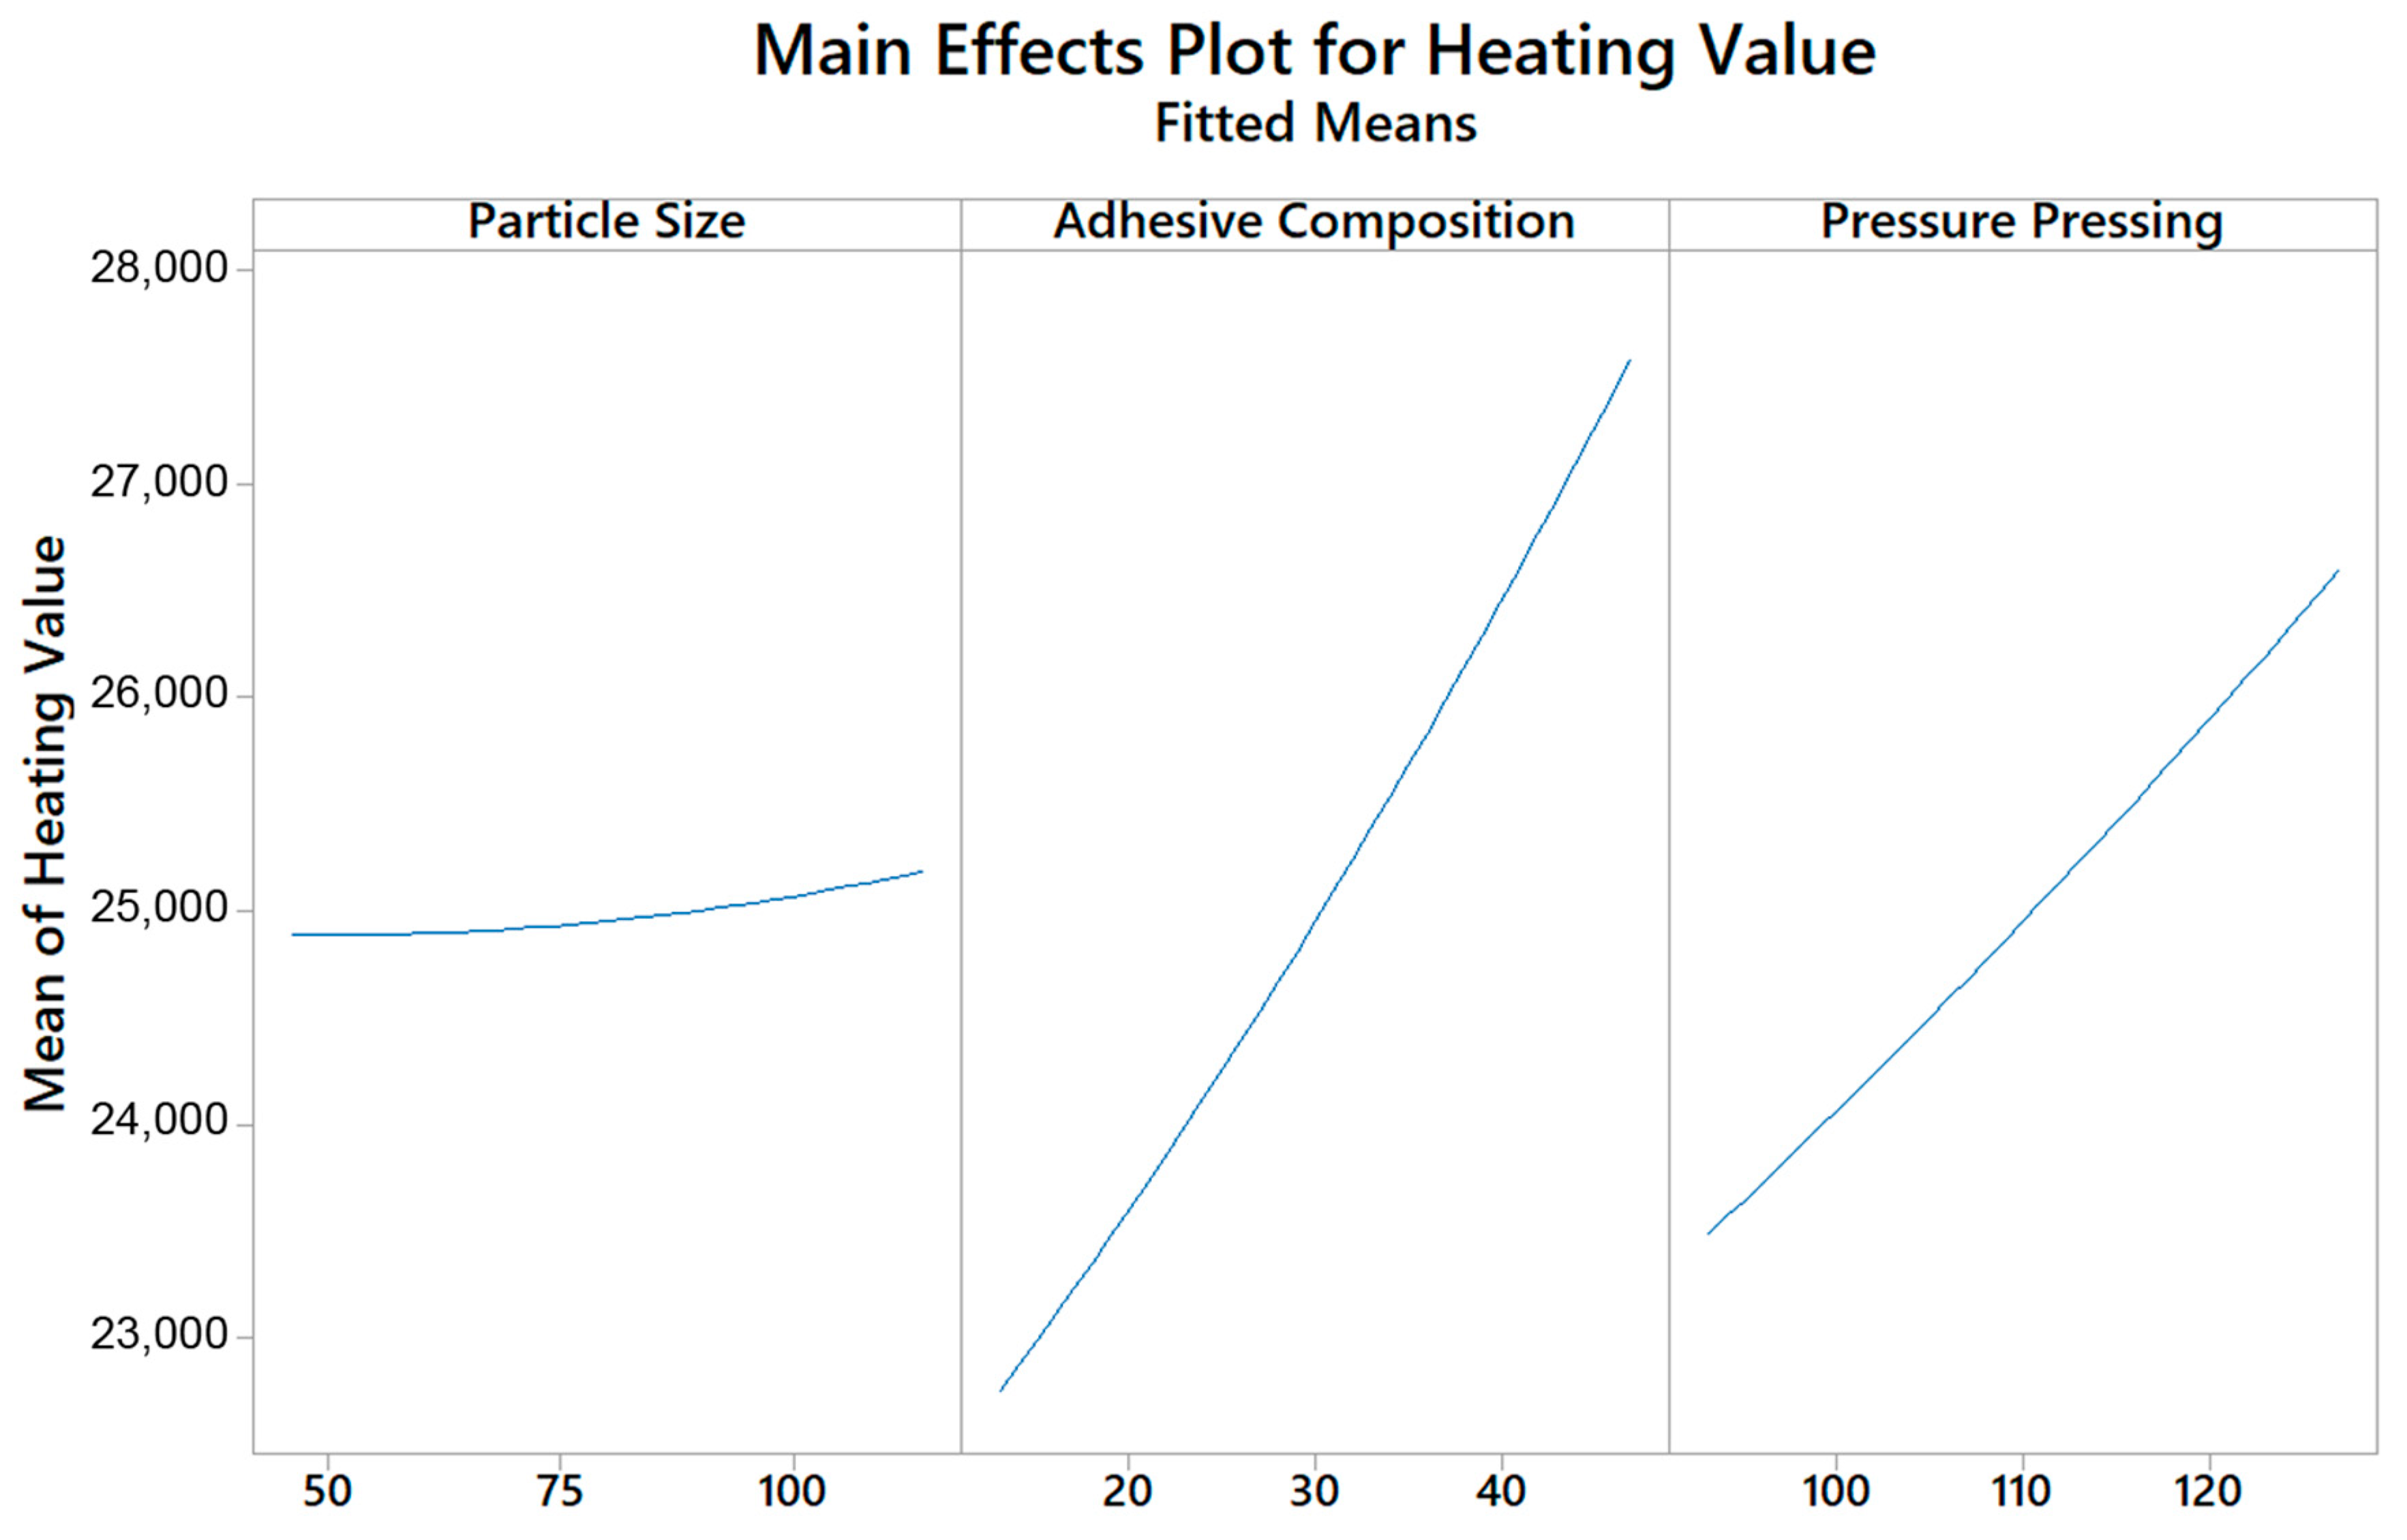
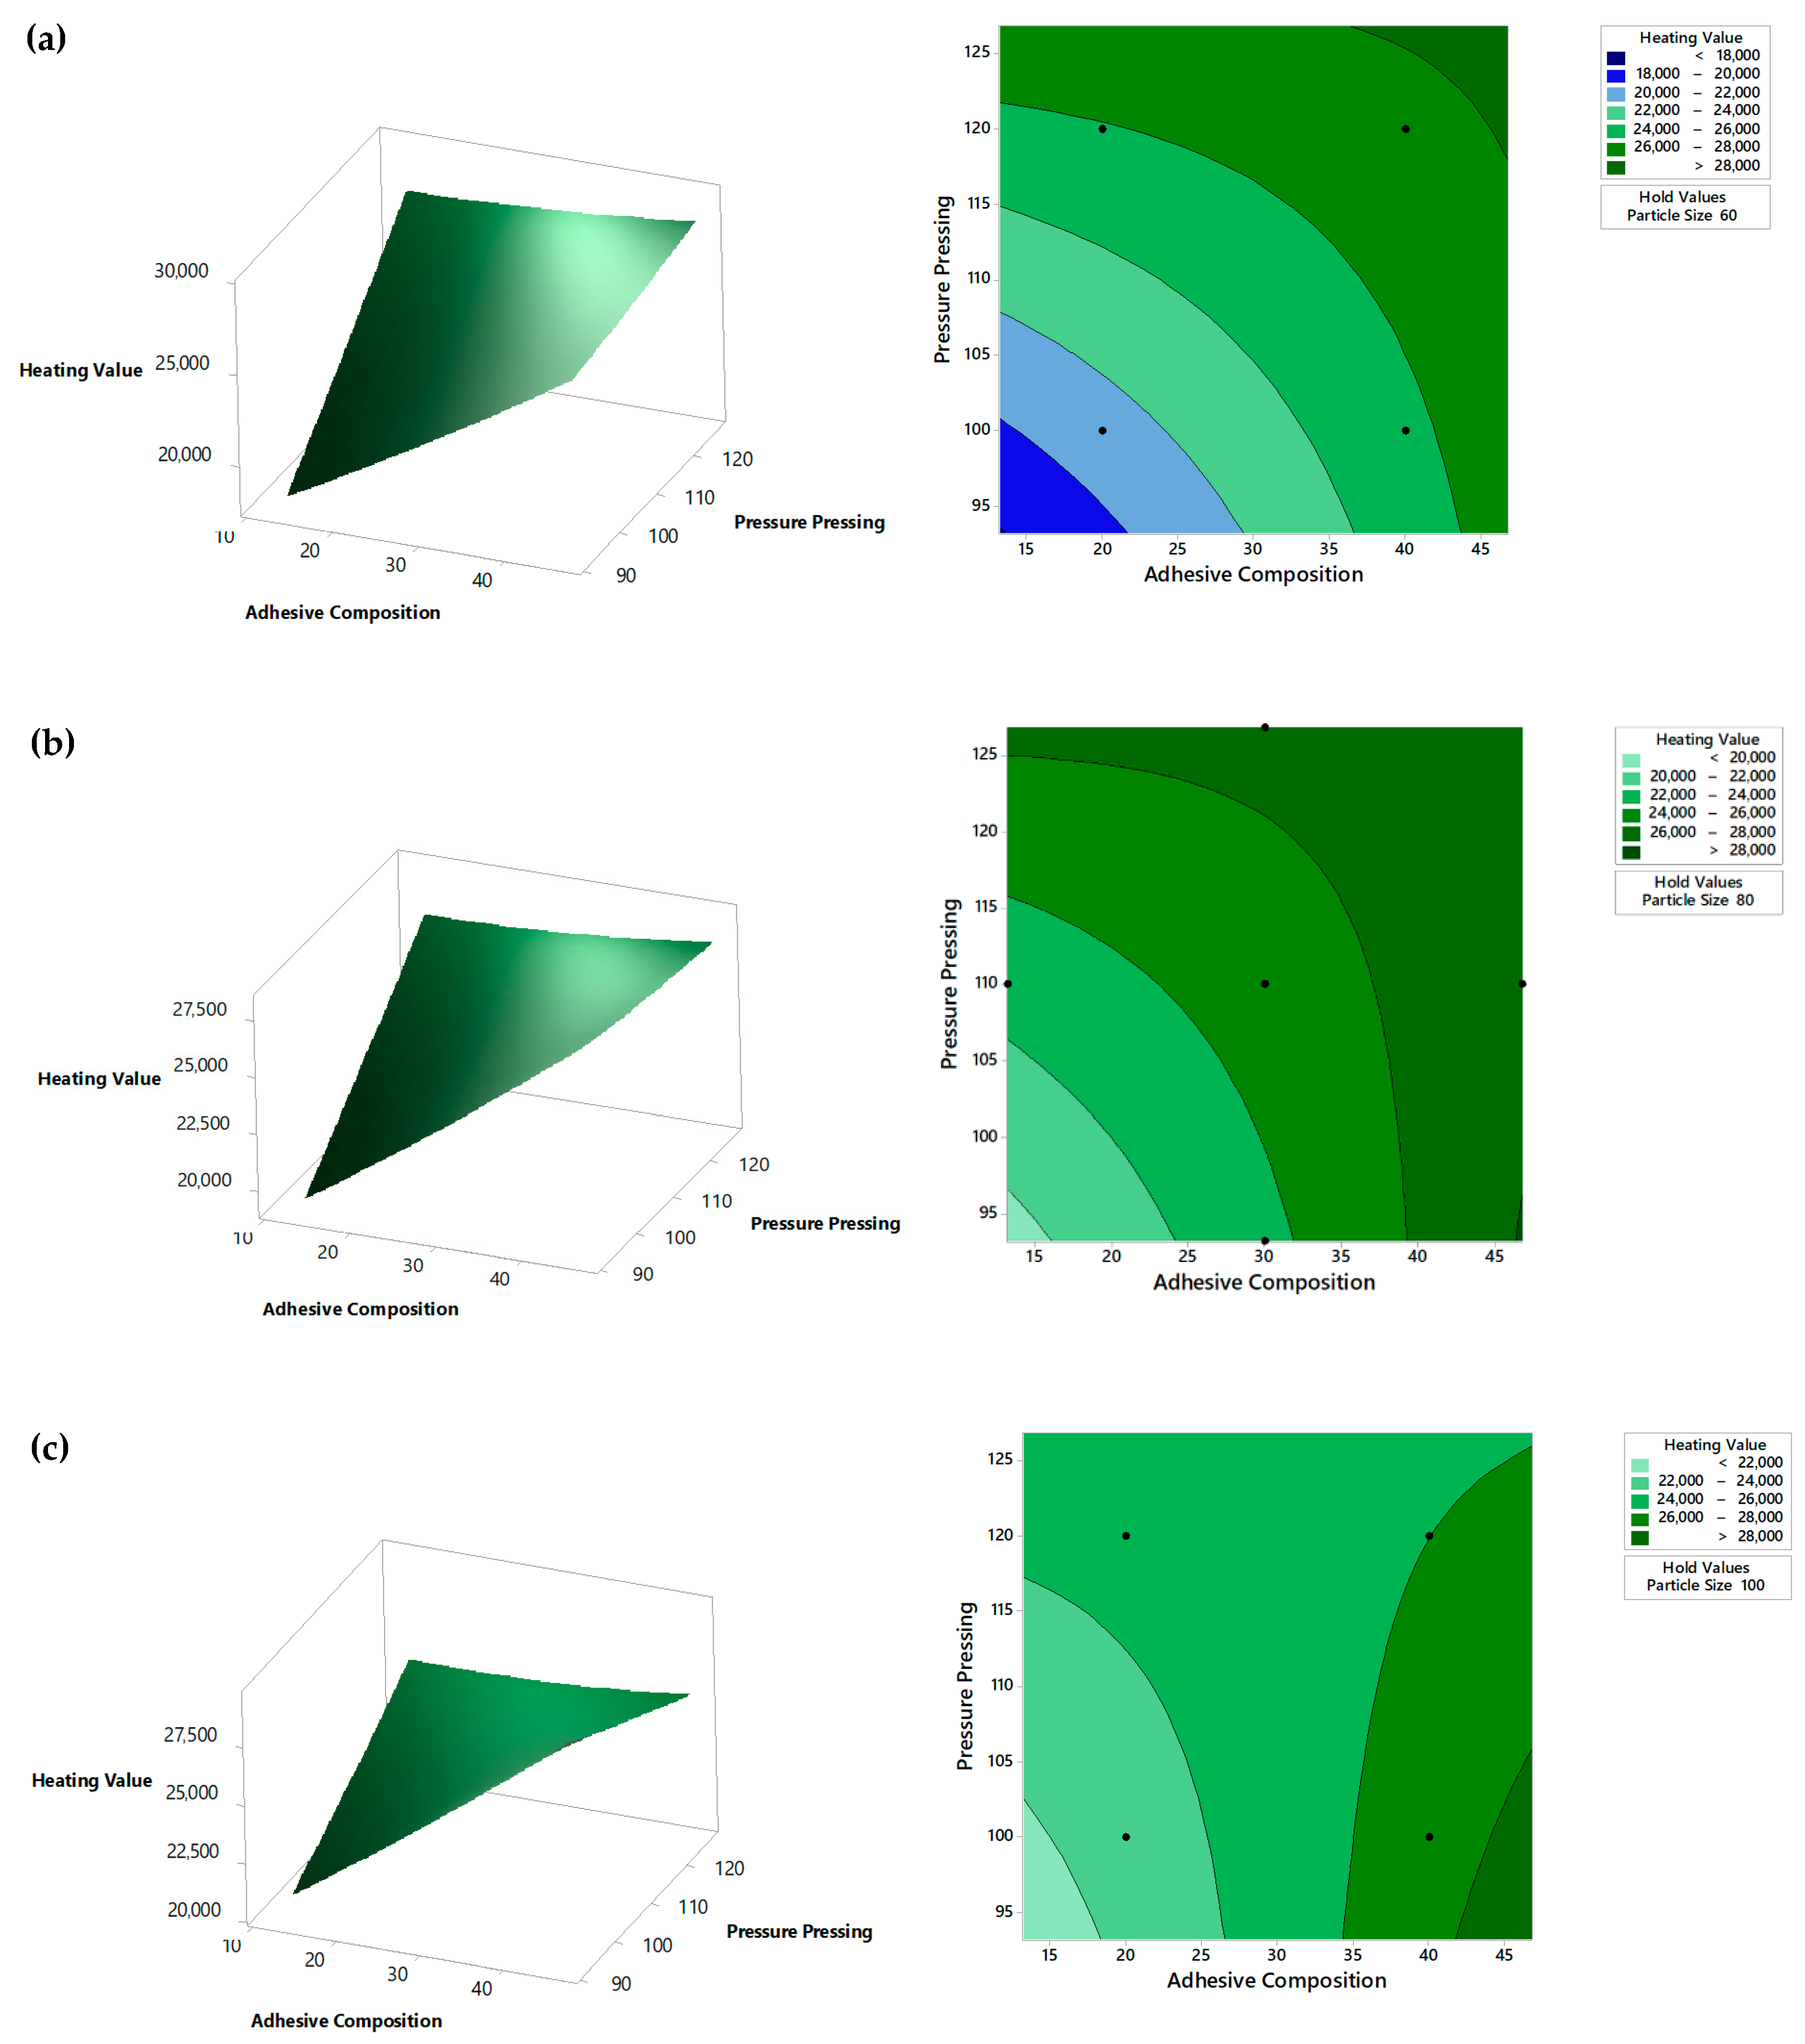
5.2. Heating Value Analysis

Figure 3 is a graph of the effect of variable conditions on the heating value. In the left part of Figure 3, it can be seen that the particle size did not have a significant effect on the heating value. This is evidenced by the absence of an up- or down-trend in the chart. The heating value was completely influenced by the carbon content, and the carbon content itself was an internal property of the material. Therefore particle size did not affect the carbon content of the material which means it also did not affect the heating value.
However, in the middle of Figure 3 and on the right of Figure 3, it can be seen that the adhesive composition and pressing pressure had a significant effect. The addition of adhesive in the form of crude glycerol increased the heating value by 29.4%, compared to the heating value of carbonized palm stems, from 21,699.59 kJ/kg increased to 28,089.6 kJ/kg [36]. On the right of Figure 3, it can also be seen that the effect of pressing pressure had a significant effect on the heating value. The greater the pressing pressure, the greater the briquette density will be so more charcoal will come into contact with the adhesive in the form of crude glycerol which will increase the heating value [43]. Inversely proportional to the adhesive composition and pressing pressure which gave a significant effect, the particle size did not affect the heating value of the briquettes produced. This can be seen from the p-value of the particle size of 0.6229. The p-value for the particle size variable exceeded the probability value > α = 0.05, so it can be concluded that the particle size did not have a significant effect on the heating value.
Surface response graphs that show interactions between adhesive composition (B) and pressing pressure (C) with the heating value in particle size 60, 80, and 100 mesh, respectively, can be seen in Figure 5. At the 60 mesh particle size, the highest heating value of 27,352.7 kJ/kg was obtained under the condition of the adhesive composition of the charcoal stem 60:40 and the pressing pressure of 120 kg/cm2, while the lowest heating value of 21,968.2 kJ/kg was obtained under conditions of an adhesive composition of 80:20 palm oil charcoal and a pressing pressure of 100 kg/cm2. At 80 mesh particle size, the highest heating value of 28,089.6 kJ/kg was found at an adhesive composition of palm stem charcoal 53:47 and a pressing pressure of 110 kg/cm2, and the lowest heating value of 22,445.7 kJ/kg was obtained in the adhesive composition against palm stem charcoal 87:13 and the pressing pressure of 110 kg/cm2. Likewise, with the particle size of 100 mesh, the highest heating value of 27,630.7 kJ/kg was obtained in the composition of the adhesive against charcoal palm 60:40 and the pressing pressure of 100 kg/cm2, while the lowest heating value of 22,889.2 kJ/kg was obtained at an adhesive composition of 80:20 and a pressing pressure of 100 kJ/cm2. Figure 5 shows that the changing particle size gave different heating values under the same pressing pressure conditions and adhesive composition.
Based on ANOVA data and Figure 5, it was shown that the composition of the adhesive and pressing pressure had a significant influence on the increase in the heating value. The more adhesives used and the larger the pressing pressure, the higher the heating value produced [36,43,47], so the adhesive composition and pressing pressure can increase the heating value.

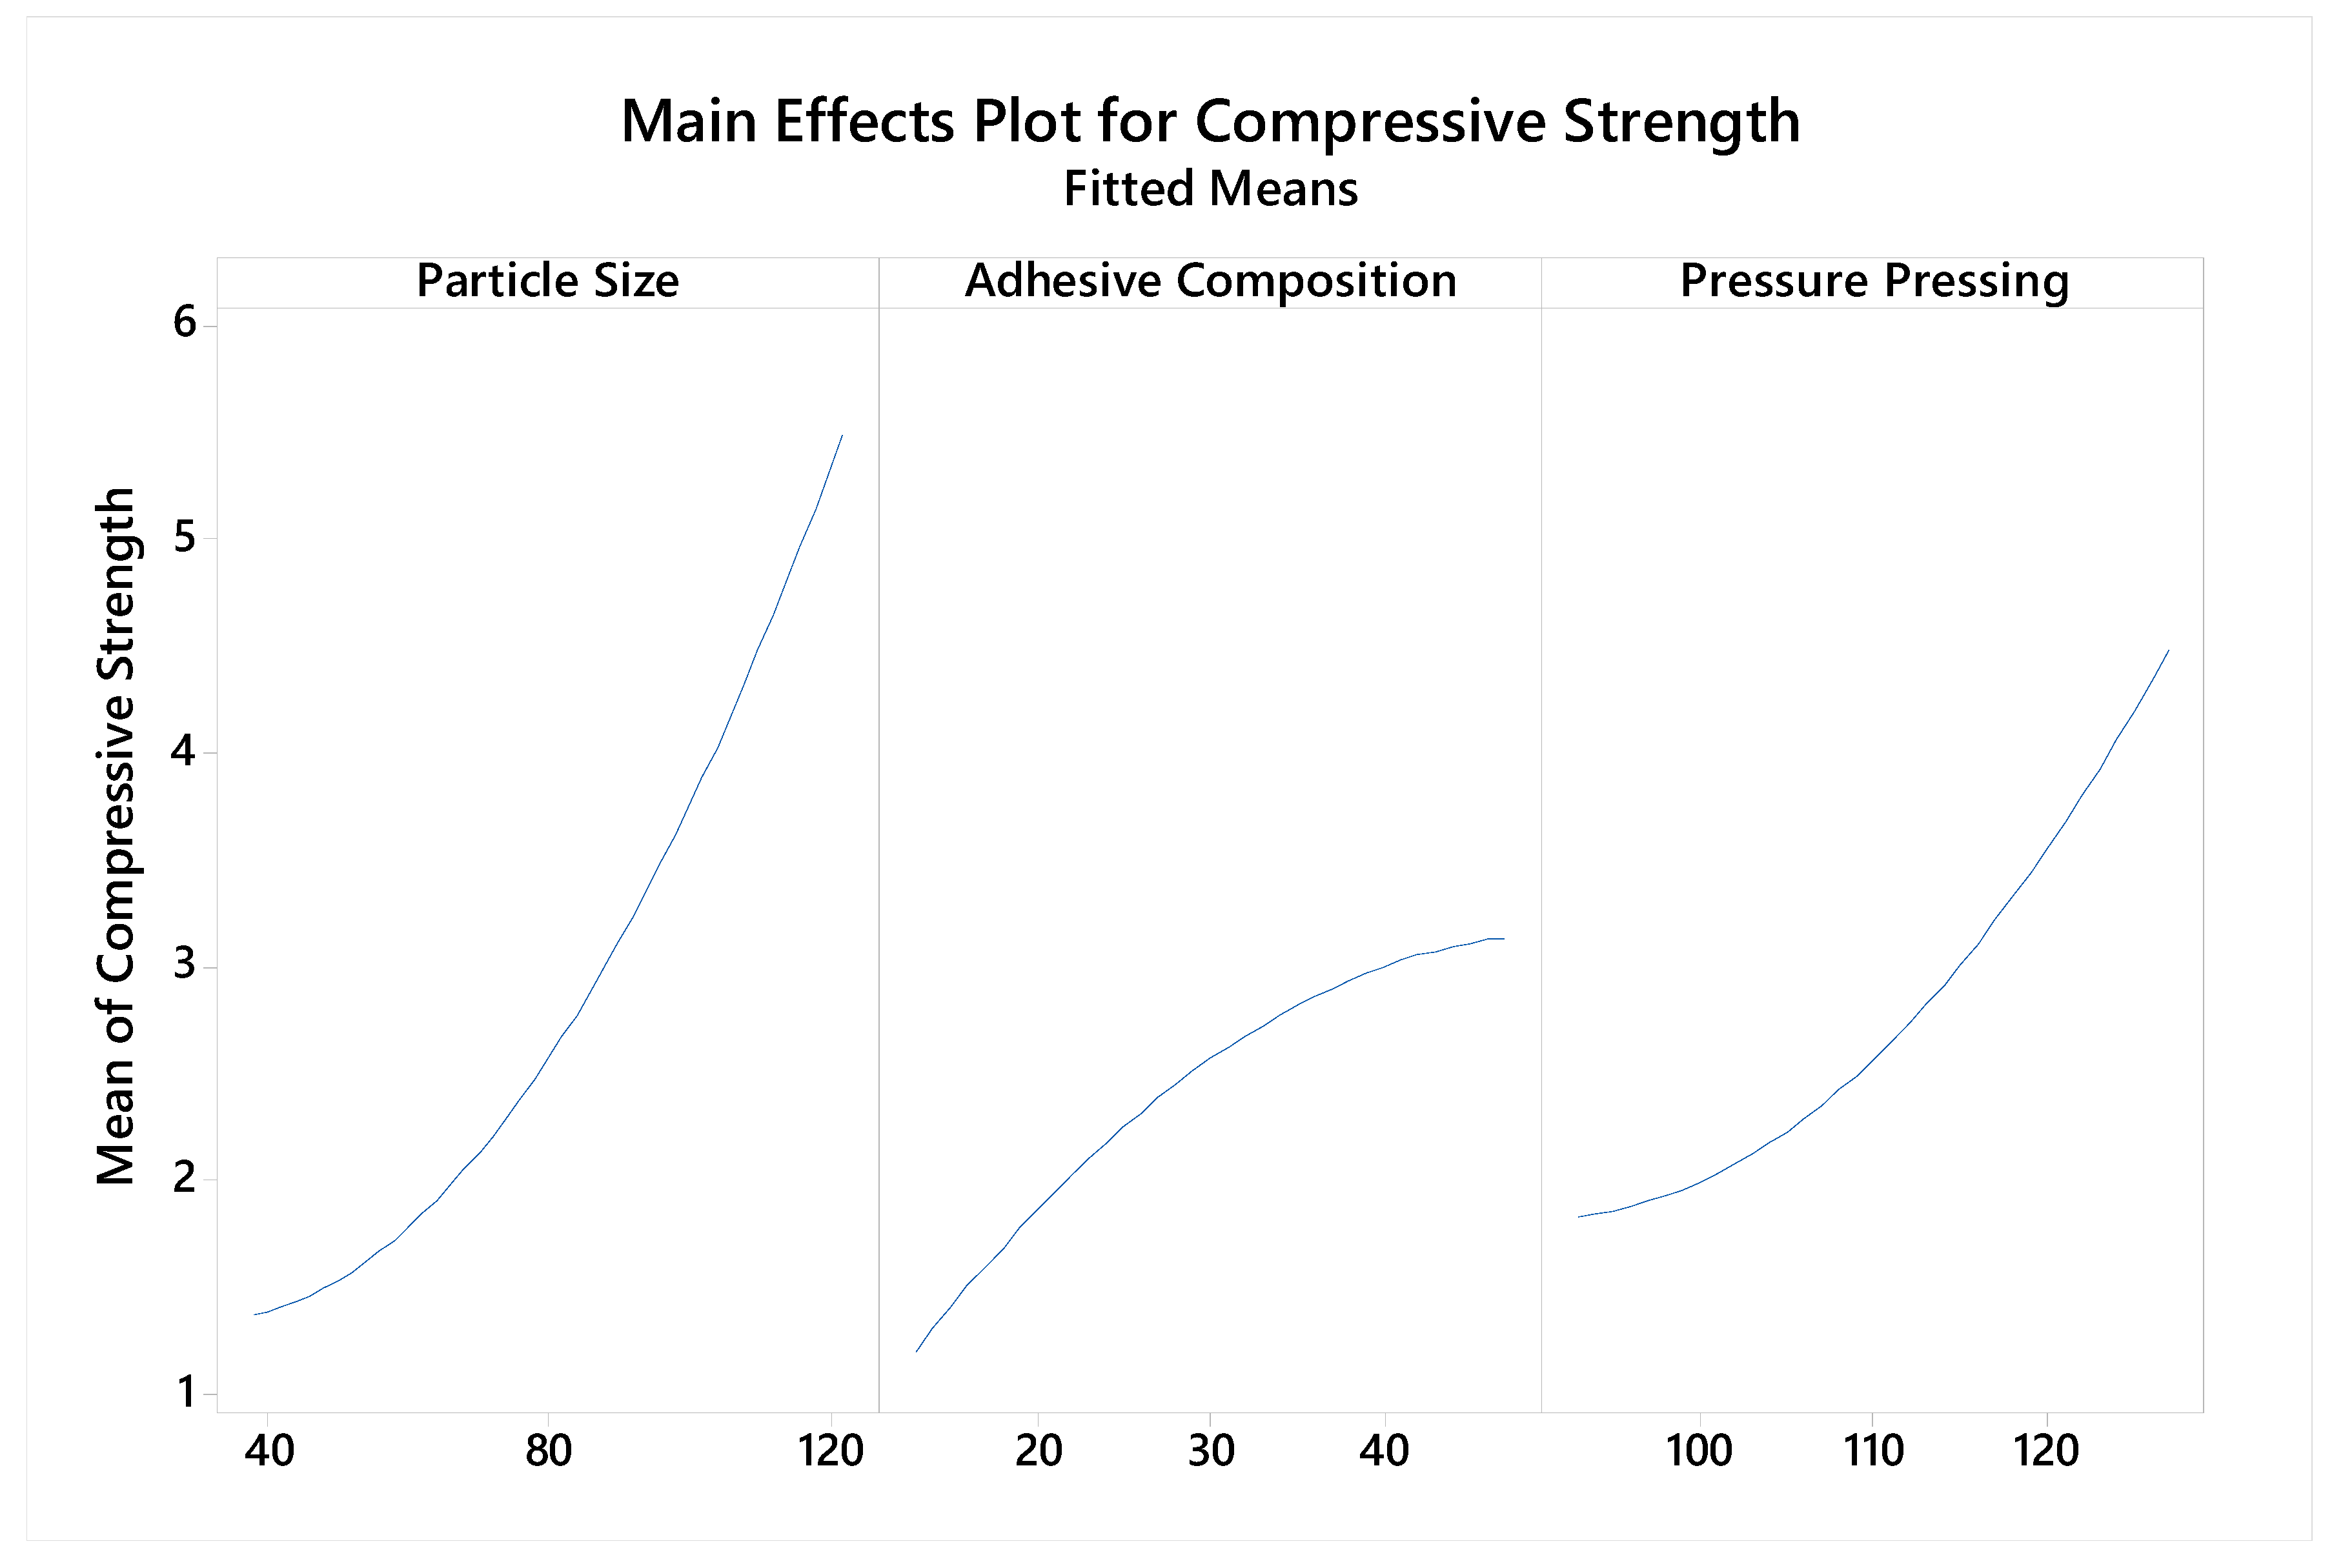
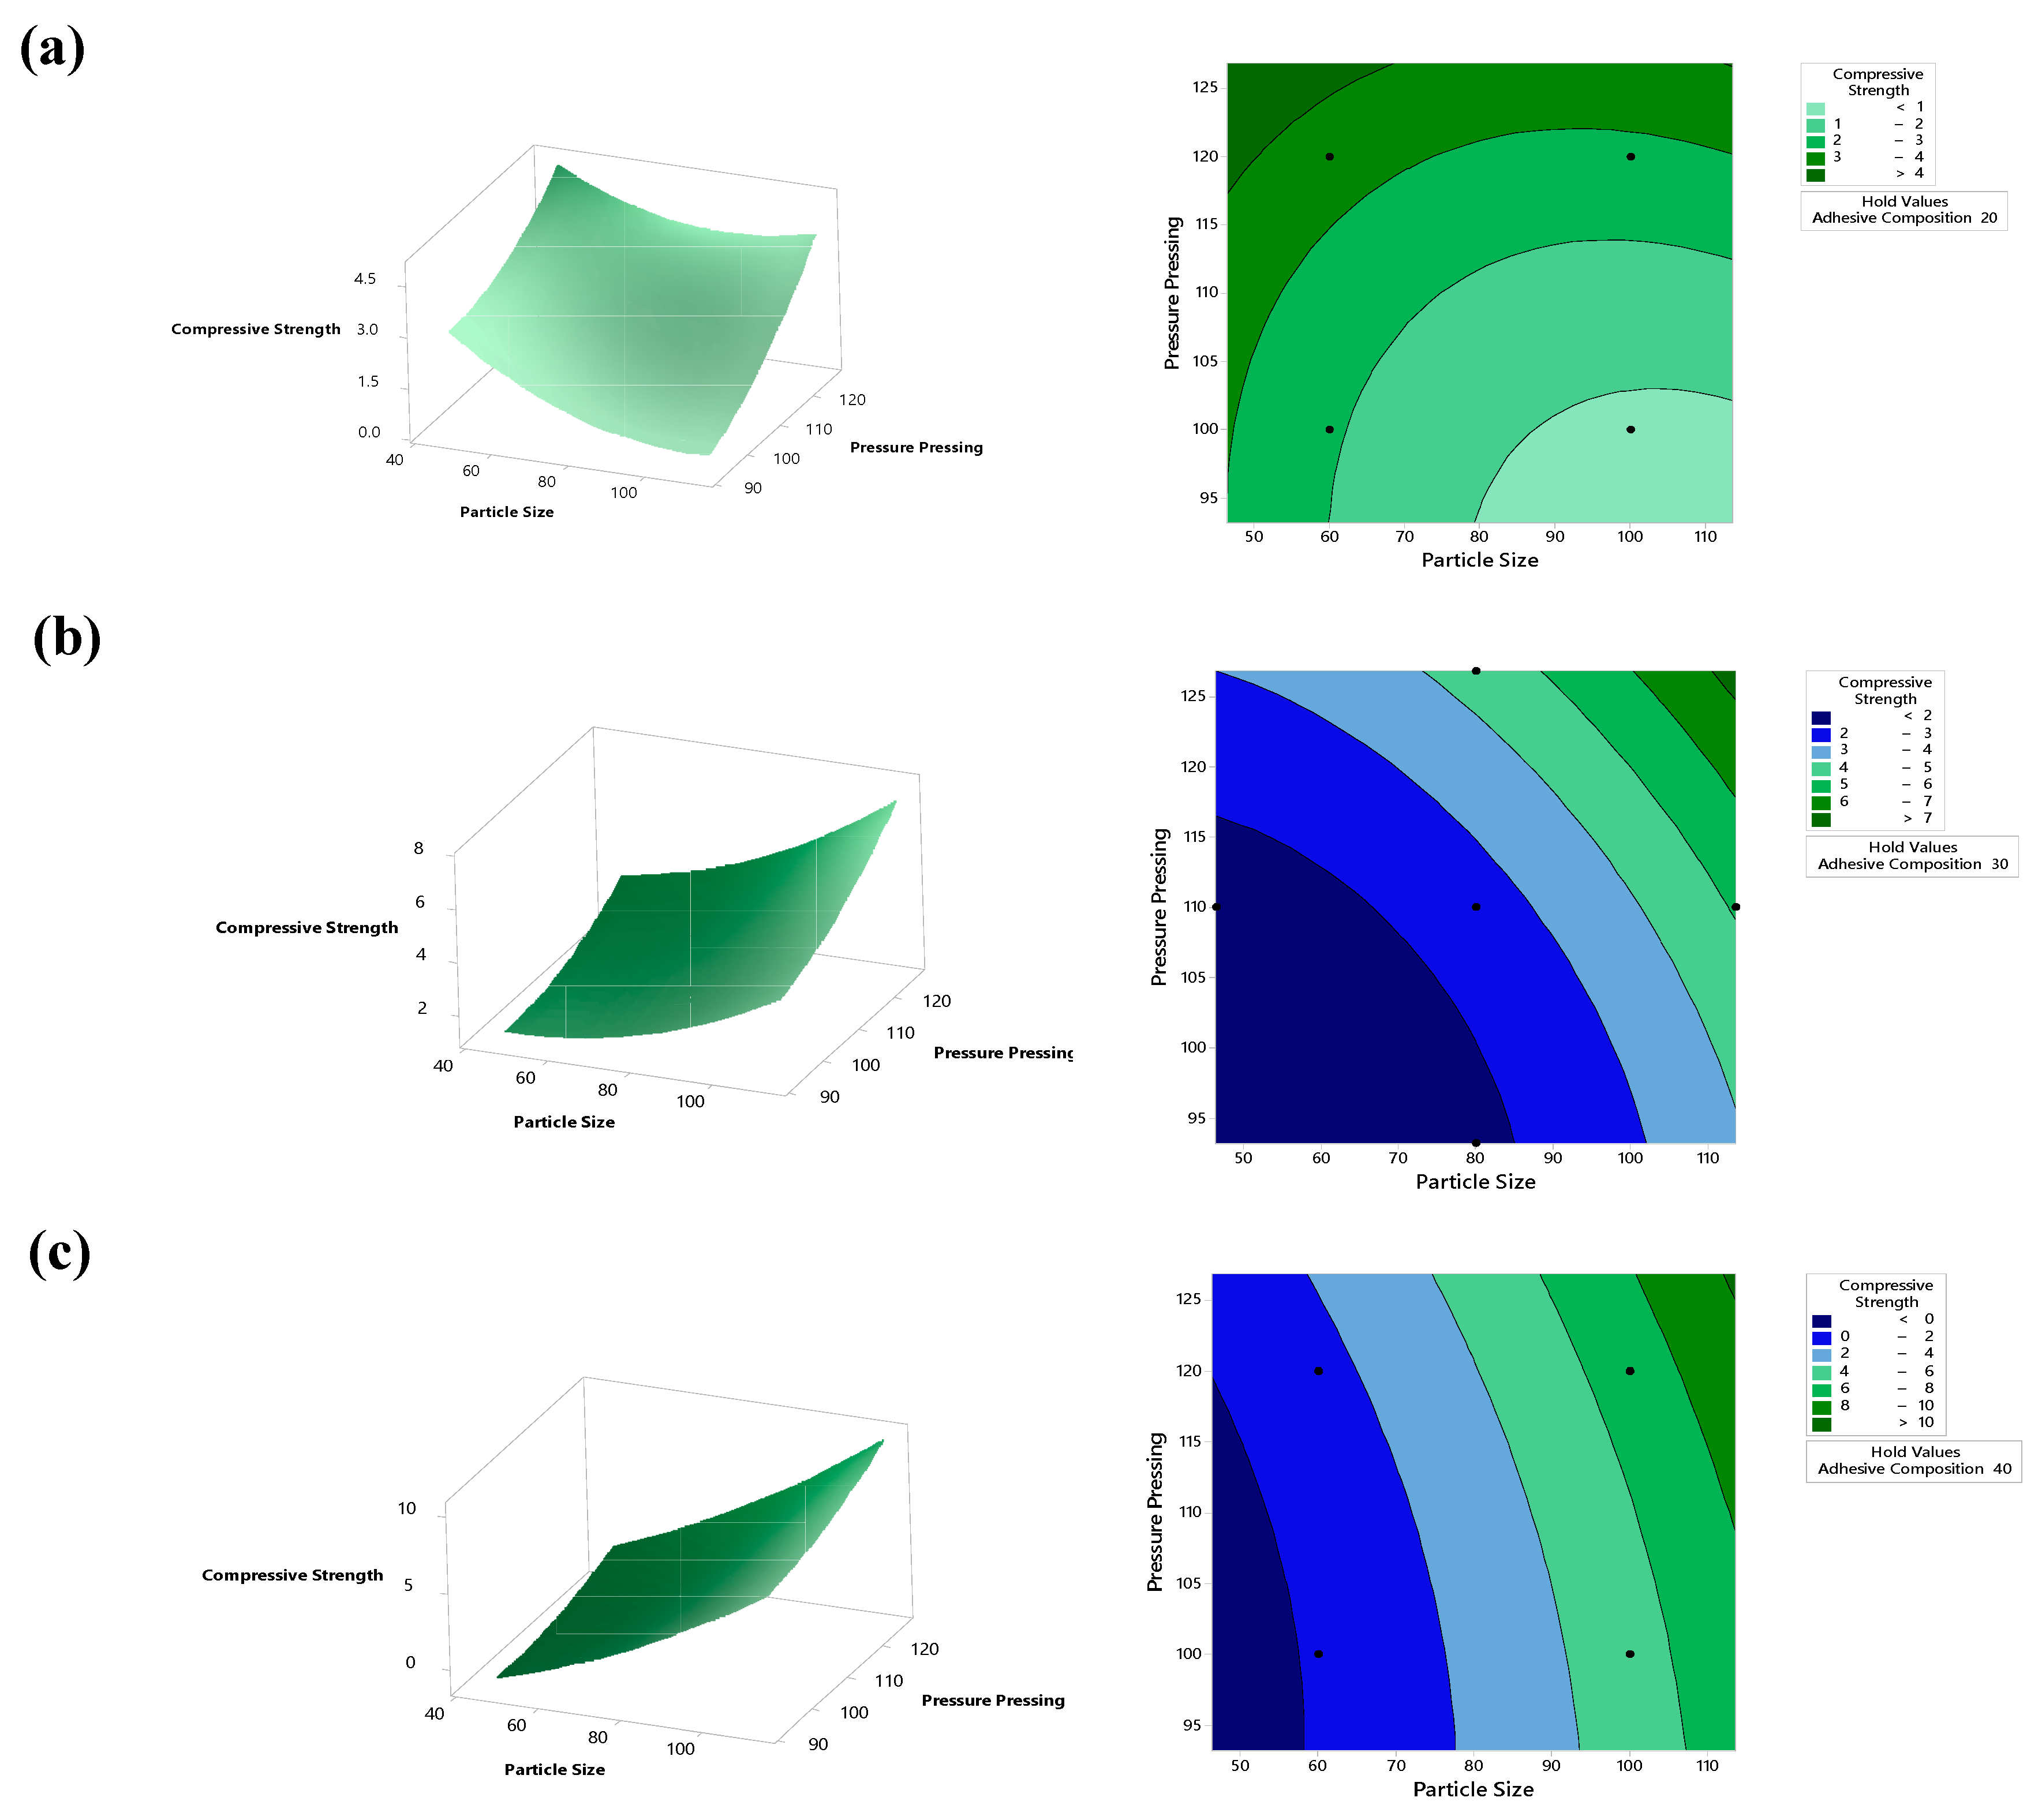
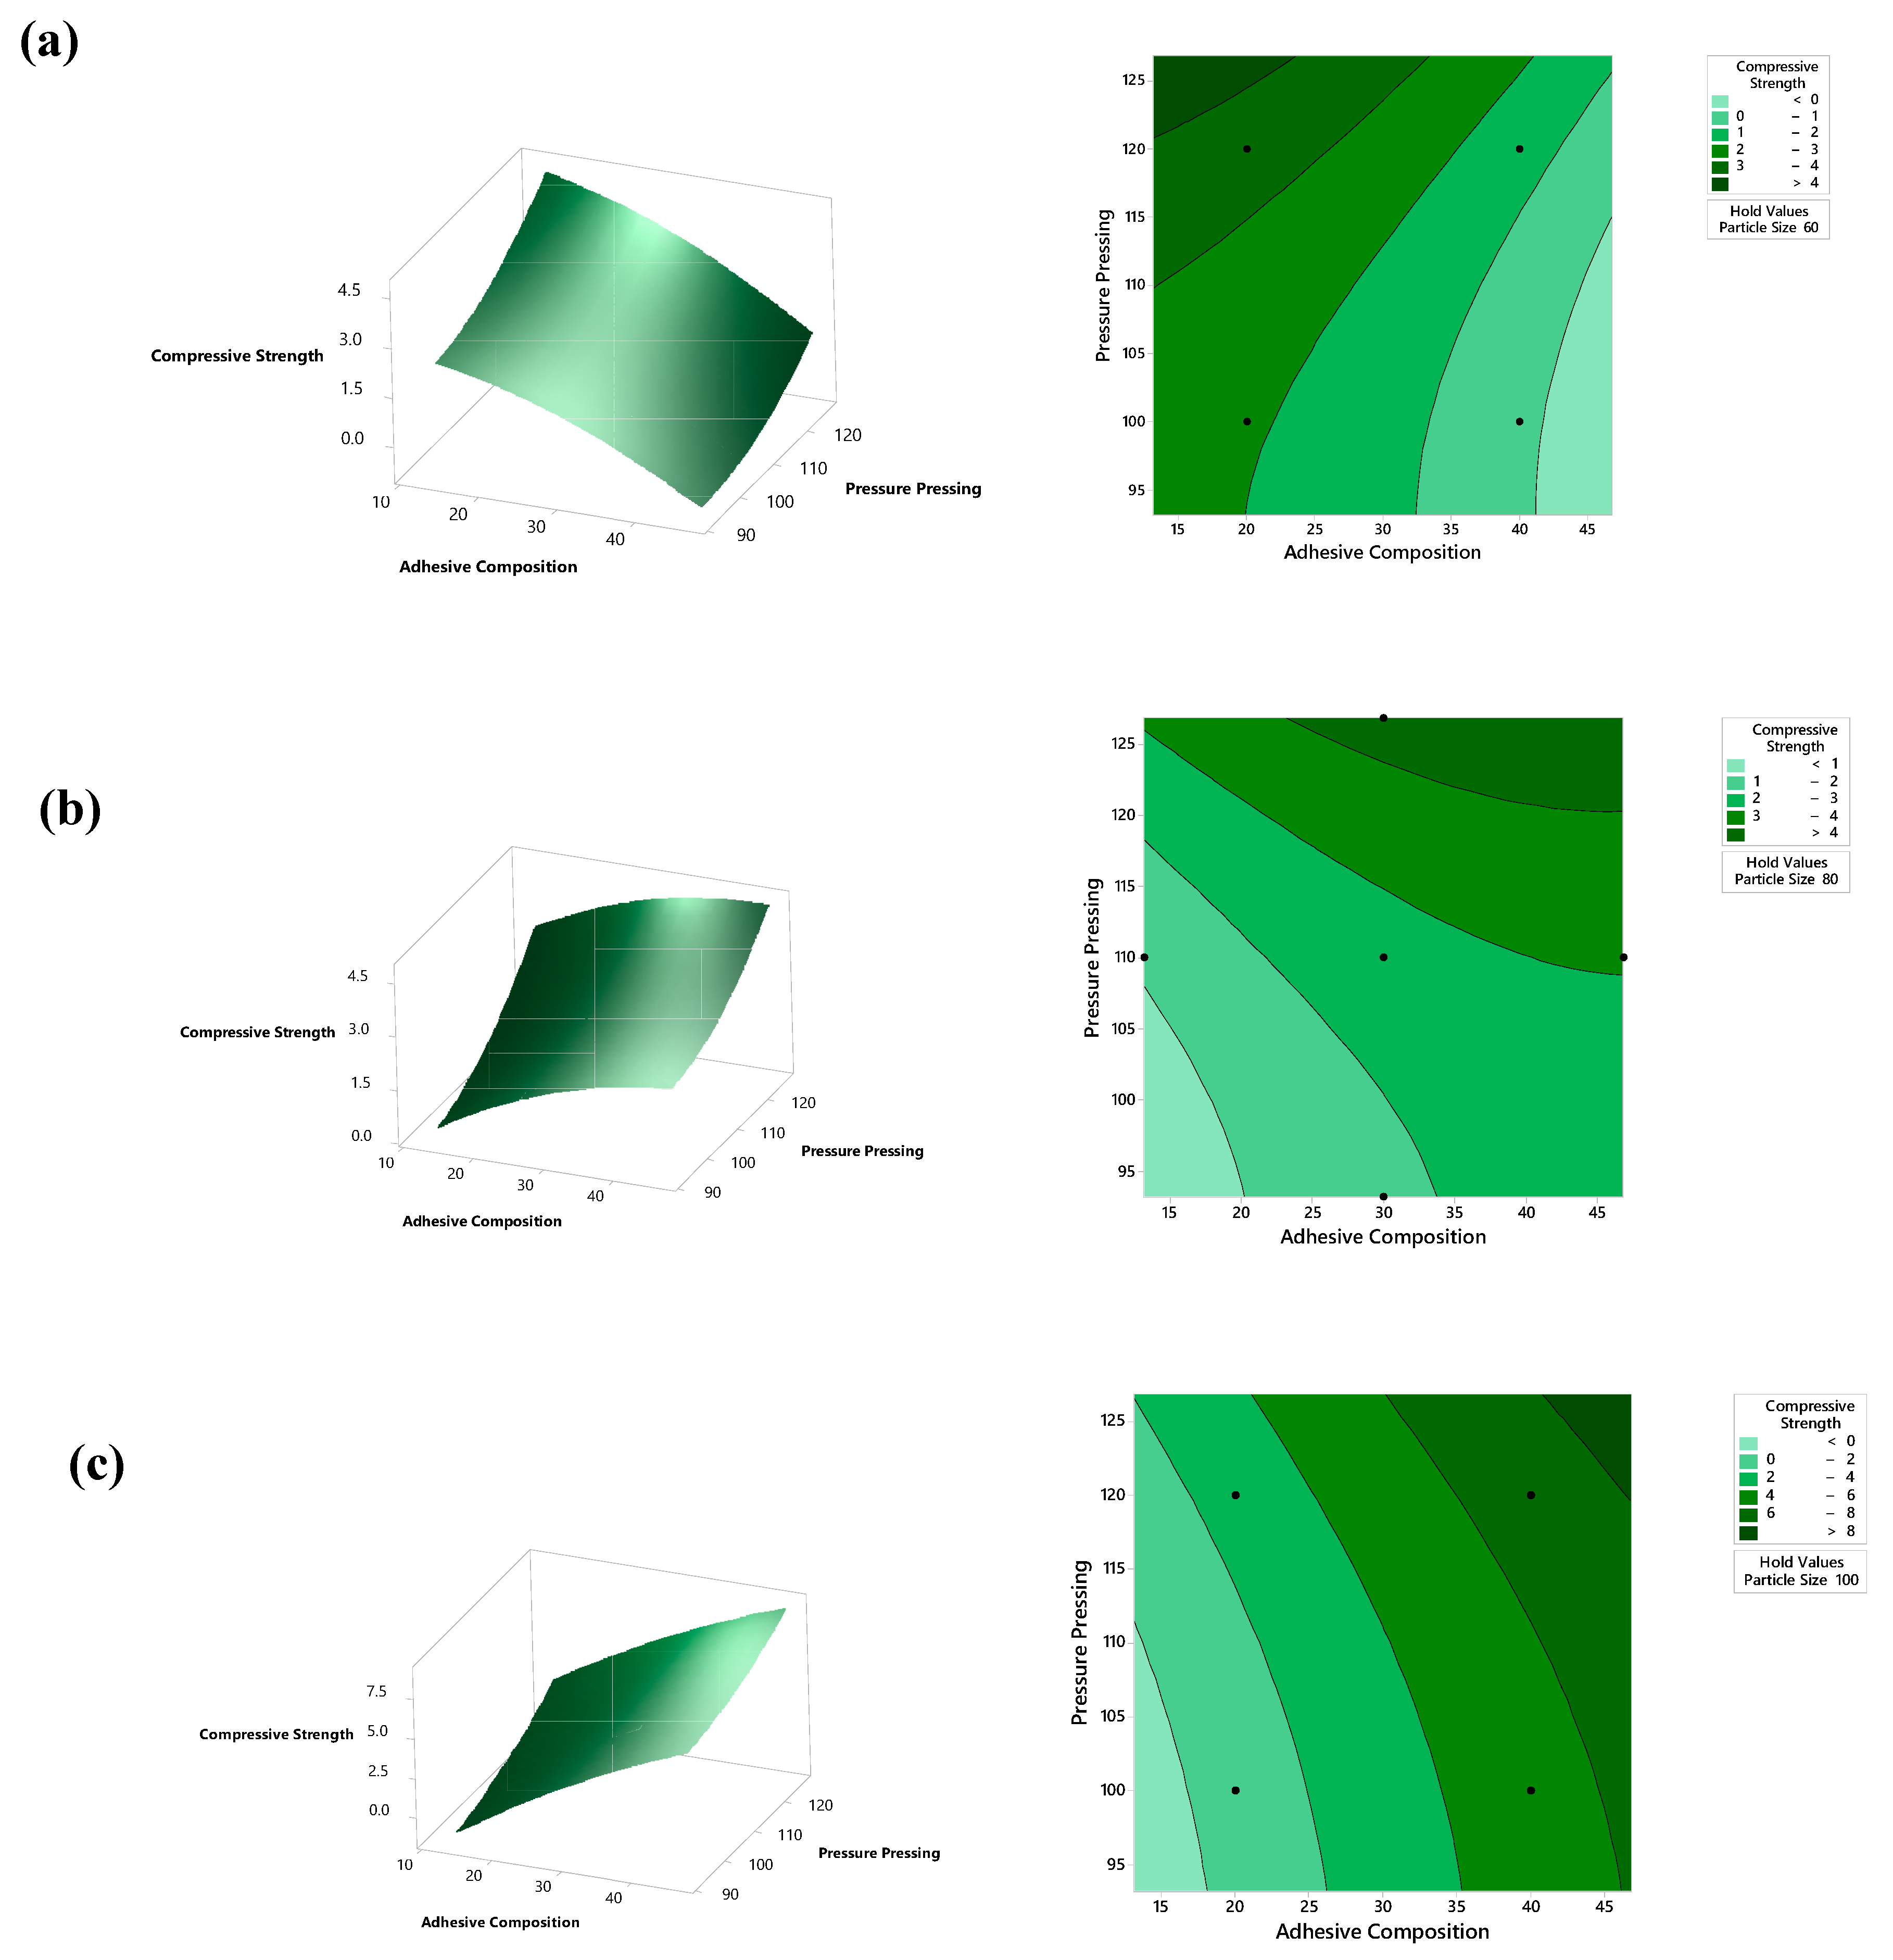
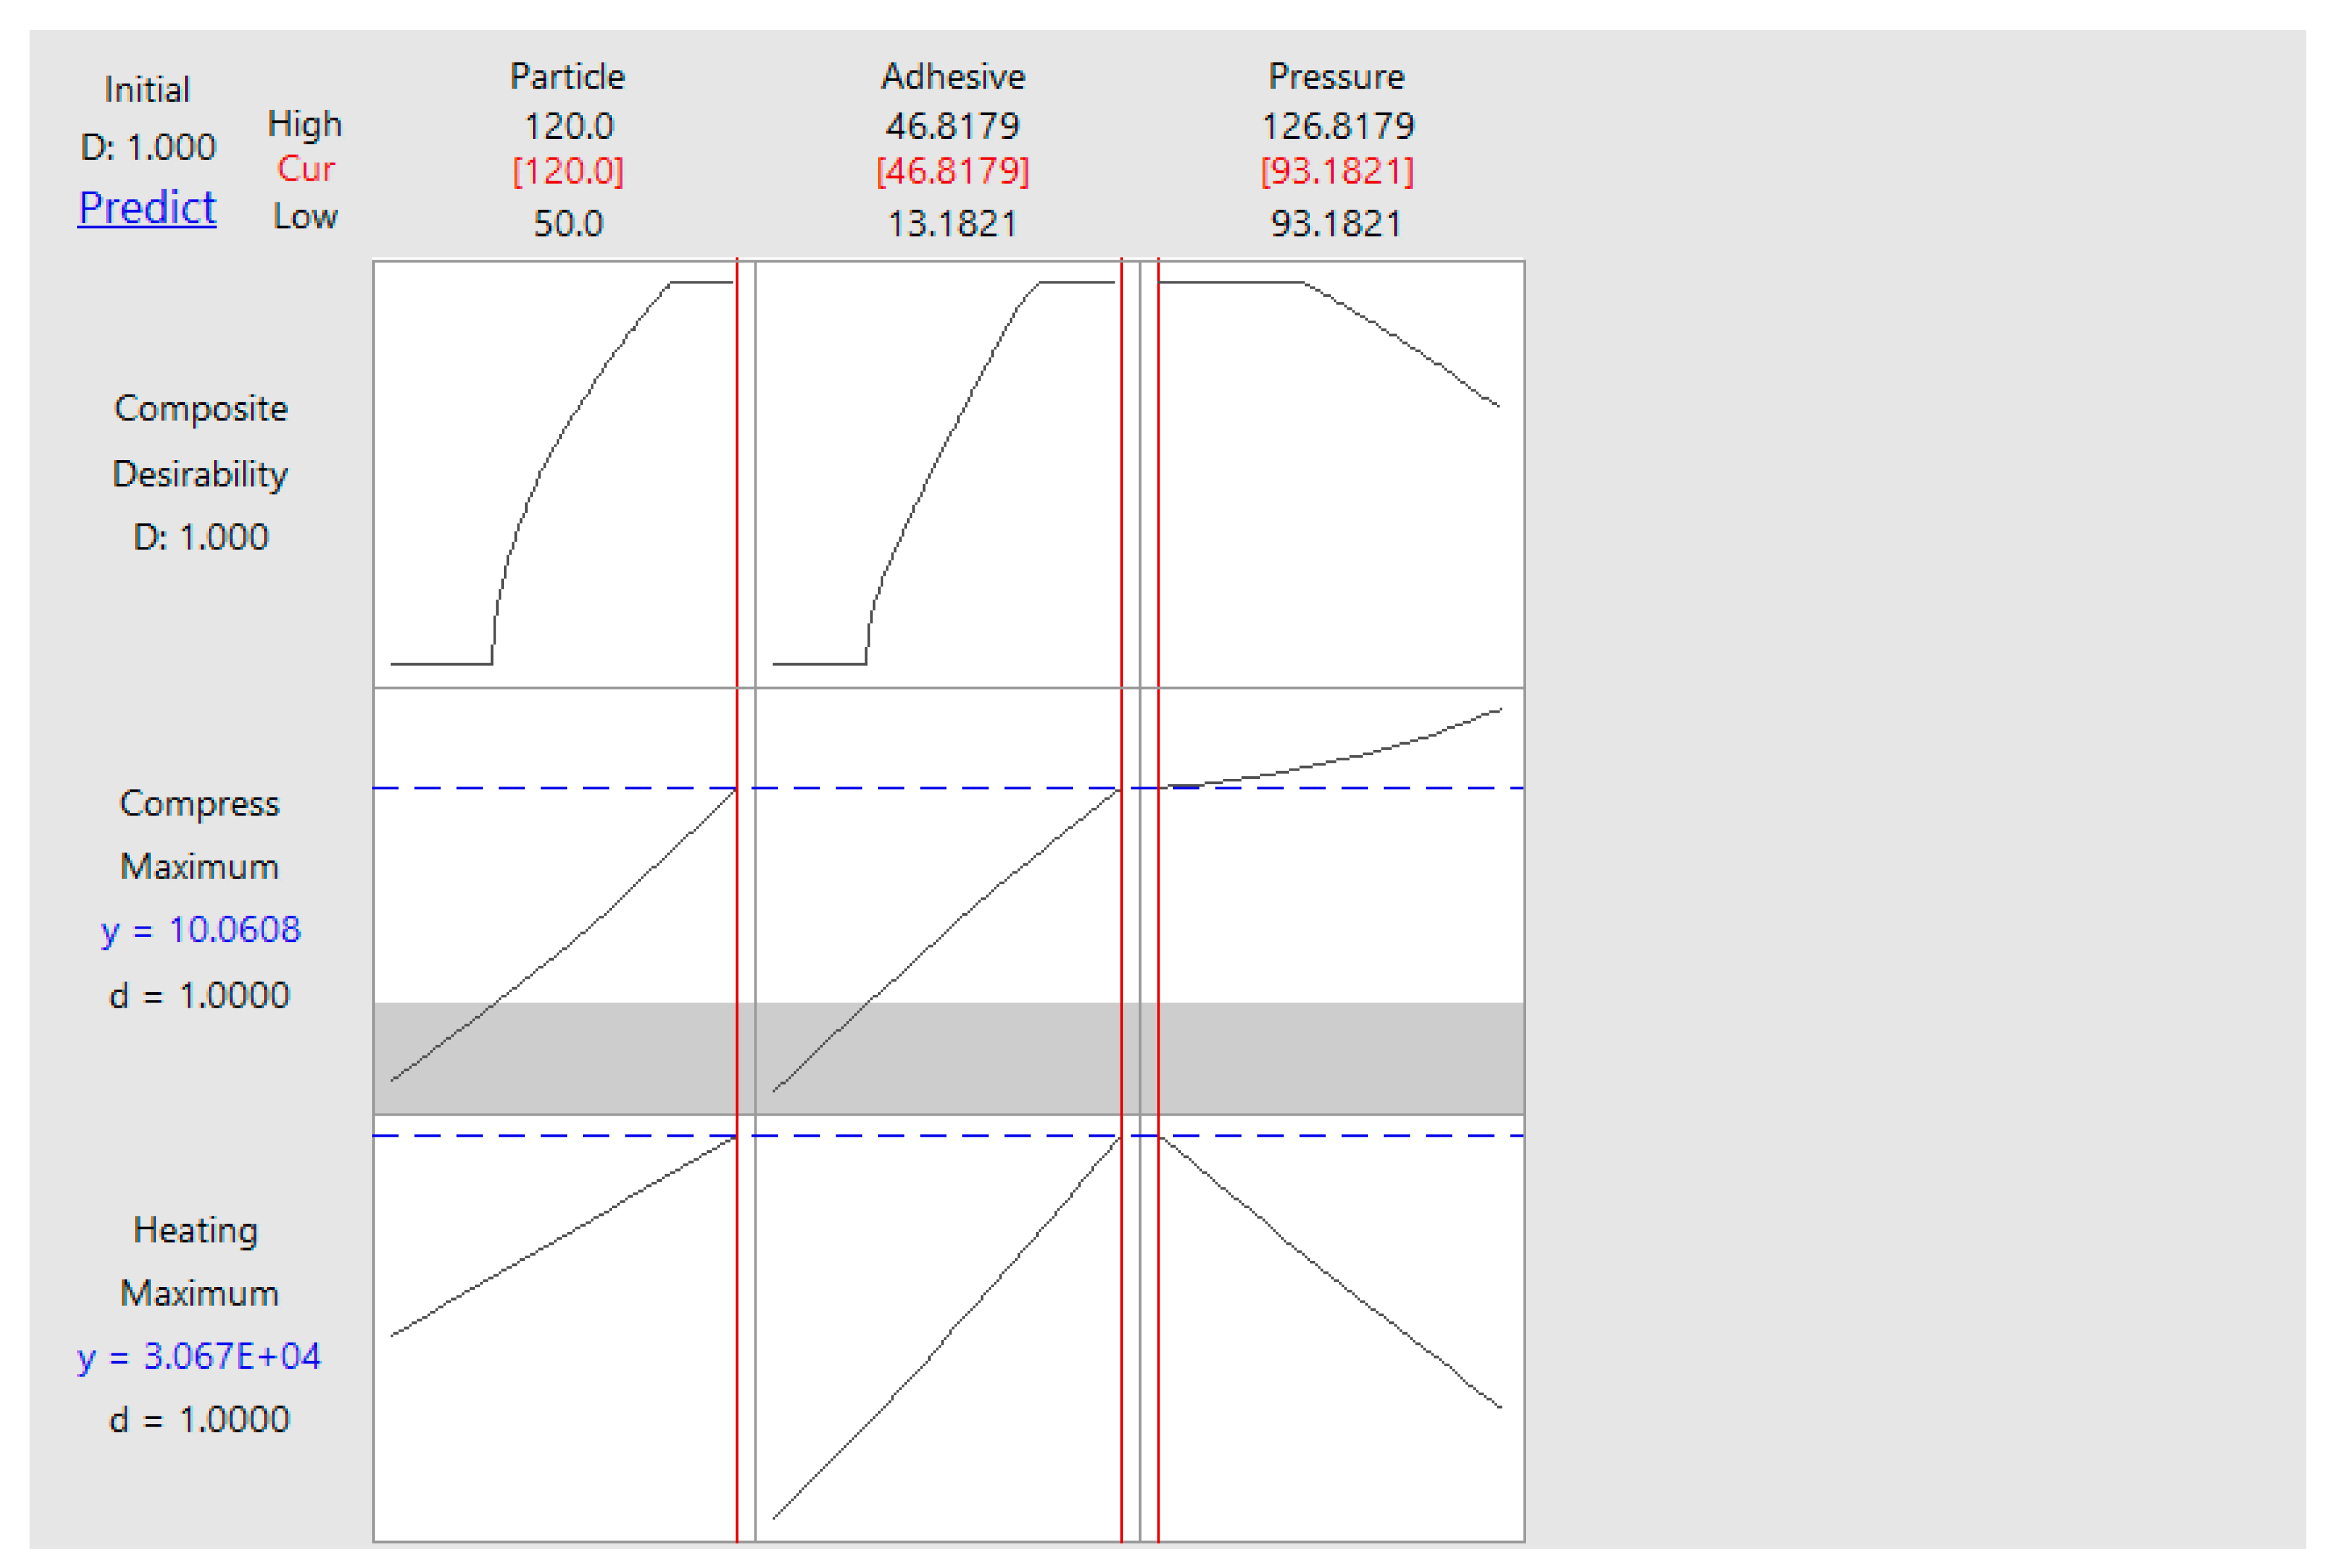
5.3. Compressive Strength Analysis

Figure 6 is a graph of the influence of variable conditions on compressive strength. In the Figure (left), (middle), and (right), it can be seen that particle size, adhesive composition, and pressing pressure had a significant effect. This can be seen as an increase in the graph. In the Figure (left), the particle size had a significant influence on the compressive strength. According to [48], the larger the mesh size, the stronger the briquettes produced. In the Figure (middle), the adhesive composition also had a significant effect in accordance with the statement of [47], which states that the addition of glycerol has a positive effect on the firmness of the briquette press. In the Figure (right), the pressing pressure also had a significant effect in accordance with the statement of [49], which states that the increase in pressing pressure increases the mechanical strength of the briquettes.
Surface response graphs that show the interactions between variable particle size (A) and adhesive composition (B) with compressive strength can be seen in Figure 7. At plot of particle size and adhesive composition, a line decreases at adhesive composition 20 %wt and the lines increases at adhesive composition 30 %wt and 40 %wt. At plot of particle size and pressure pressure, lines have the same pattern, it means that particle size and pressure pressing do not have interaction. With the same reason, adhesive composition and pressure pressing also do not have interaction.
At the pressing pressure of 100 kg/cm2, the highest compressive strength of 4.929 kg/cm2 was obtained under the conditions of the adhesive composition of 60:40 palm oil charcoal and 100 mesh particle size, while the lowest compressive strength of 0.86 kg/cm2 was obtained under the adhesive composition conditions against charcoal stem 60:40 and 60 mesh particle size (Figure 8). At the pressing pressure of 110 kg/cm2, the highest compressive strength of 5346 kg/cm2 was found in the composition of the adhesive against palm oil charcoal 70:30 and the particle size of 120 mesh, and the lowest compressive strength of 1.202 kg/cm2 was found in the composition of the adhesive against the oil palm charcoal 70:30 and 50 mesh particle size. Likewise, with the pressing pressure of 120 kg/cm2, the highest compressive strength of 7526 kg/cm2 was found in the composition of the adhesive against palm bar charcoal 60:40 and 100 mesh particle size, while the lowest compressive strength of 1010 kg/cm2 was found in the composition of the adhesive against the charcoal palm stem 60:40 and 60 mesh particle size.
In the adhesive composition of 80:20 palm oil charcoal, the highest compressive strength of 1611 kg/cm2 was obtained under 60 mesh particle size conditions and pressing pressures of 100 kg/cm2, while the lowest compressive strength of 1302 kg/cm2 was obtained under 100 mesh particle size conditions and pressing pressures of 100 kg/cm2. In the composition of the adhesive against palm oil charcoal 70:30, the highest compressive strength of 5.346 kg/cm2 was obtained under 120 mesh particle size conditions and a pressing pressure of 110 kg/cm2 and the lowest compressive strength at 1.202 kg/cm2 under 50 mesh particle size conditions and a pressure pressing of 110 kg/cm2. Likewise, for the adhesive composition of palm bar charcoal 60:40, the highest compressive strength of 7526 kg/cm2 was obtained under 100 mesh particle size conditions and a pressing pressure of 120 kg/cm2, while the lowest compressive strength of 0.86 kg/cm2 was found under 60 mesh particle size conditions and 100 kg/cm2 pressing pressure. Figure 9 shows that the composition of the changing matrix gave a different compressive strength under the same conditions of particle size and pressing pressure.
At the 60 mesh particle size, the highest compressive strength of 3.818 kg/cm2 was obtained under the conditions of the adhesive composition against palm oil charcoal 80:20 and a pressing pressure of 120 kg/cm2, while the lowest compressive strength of 0.86 kg/cm2 was obtained under the condition of the adhesive composition against oil palm charcoal 60:40 and the pressing pressure 100 kg/cm2. At 80 mesh particle size, the highest compressive strength of 4871 kg/cm2 was found in the composition of the adhesive against palm oil charcoal 70:30 and the pressing pressure of 126 kg/cm2, and the lowest compressive strength of 1205 kg/cm2 was found in the composition of the adhesive against palm oil charcoal 70:30 and the pressing pressure of 93 kg/cm2. Likewise, with the particle size of 100 mesh, the highest compressive strength of 7526 kg/cm2 was found in the composition of the adhesive against palm bar charcoal 60:40 and the pressing pressure of 120 kg/cm2, while the lowest compressive strength of 1302 kg/cm2 was found in the composition of the adhesive against charcoal palm stems 80:20 and 100 kg/cm2 pressing pressure. Figure 10 shows that the change in particle size gave a different heating value under conditions of the same pressing pressure and adhesive composition.
Optimal heating value and compressive strength were obtained through particle size and adhesive composition maximum and pressure pressing minimum. The optimal heating value was 306,704 kJ/kg (Figure 11) which was obtained by particle size 120 mesh, adhesive composition 46.8179% wt, and pressure pressing 93.1821 kg/cm2. The optimal compressive strength was 10.0608 kg/cm2 which was obtained by particle size 120 mesh, adhesive composition 46.8179% wt, and pressure pressing 93.1821 kg/cm2. Besides Figure 11, the optimal heating value can be also seen in the model of Equation (5):
30648.03 k J k g = 42209 + 421 ( 120   m e s h ) + 904 ( 46.8179 %   w t ) + 535 ( 93.1821 k g c m 2 ) + 0.037 ( 120   m e s h ) ( 120   m e s h ) + 0.76 ( 46.8179 %   w t ) ( 46.8179 %   w t ) + 0.32 ( 93.1821 k g c m 2 ) ( 93.1821 k g c m 2 ) 0.32 ( 120   m e s h ) ( 46.8179 %   w t ) 3.76 ( 120   m e s h ) ( 93.1821 k g c m 2 ) 7.10 ( 46.8179 %   w t ) ( 93.1821 k g c m 2 )
where as optimal compressive strength can be calculated by model 6:
10.07826 k g c m 2 = 38.7 0.342 ( 120   m e s h ) 0.437 ( 46.8179 %   w t ) 0.418 ( 93.1821 k g c m 2 ) + 0.000490 ( 120   m e s h ) ( 120   m e s h ) 0.00138 ( 46.8179 %   w t ) ( 46.8179 %   w t ) + 0.00206 ( 93.1821 k g c m 2 ) ( 93.1821 k g c m 2 ) + 0.00782 ( 120   m e s h ) ( 46.8179 %   w t ) + 0.00071 ( 120   m e s h ) ( 93.1821 k g c m 2 ) 0.00045 ( 46.8179 %   w t ) ( 93.1821 k g c m 2 )
The decimal value of the optimum heating value and compressive strength in Figure 11 and the model are difference because of the parameter estimator decimal values. We used optimum scores from Figure 11 in the paper because the calculating uses more decimal values.

5.4. Briquette Density

The briquette quality depended on the briquette density of the material. The density value represented the mass and volume ratio in a briquette. It is well known that the density value is strongly affected by the particle size, adhesive substance, and pressing level used in briquette construction. Considering that the briquette density described the sample homogeneity in the briquette material, it can be assumed that the smaller particle size of the charcoal coupled with increasing adhesive substances produced the briquette sample which had a greater density. This is because the dense arrangements among charcoal grains in the briquette sample were strongly bonded with each other by the adhesive substance.
Based on density testing and mass type investigation of the obtained briquette products which has been demonstrated in this experiment, it can be proved that the density of the crude glycerol charcoal briquette increased with improving the pressing pressure. This result is in accordance with previous research conducted by [50], who stated that a large stress load causes the bulk density of the briquettes to increase in size and results in stronger mechanical strength. The frequency obtained from this study ranged from 0.72 to 1.06 g/cm3.

6. Conclusions

Briquette material produced successfully from palm stems and crude glycerol, in which its standard heating value of min. 21,000 kJ/kg has met with the standard heating value, the Indonesian National Standard (SNI). The response of the briquette’s heating value is significantly influenced by the composition of the matrix and pressing pressure. The response of the compressive strength of briquettes is strongly related to particle size, matrix composition, and pressing pressure. The optimal heating value (306,704 kJ/kg) is obtained while the charcoal particle is sieved using the metal sieve of 80 mesh, the matrix composition contained palm stem charcoal of 53:47 wt, and the pressure of 93.1821 bar. However, the lowest heating value of 21,968.2 kJ/kg obtained while using charcoal particles resulted from 60 mesh, the matrix composition 80:20 wt, and a pressure of 100 bar. The optimum compressive strength of 10.0608 kg/cm2 resulted while using charcoal from the sieving process using a sieve of 100 mesh, the matrix composition 53:47 wt, and the pressure of 93.1821 bar. Whereas the lowest compressive strength of 0.86 kg/cm2 resulted from using charcoal particles produced with a metal mesh of 60, a matrix composition of 60:40 wt, and a pressure of 100 bar.

Author Contributions

Conceptualization, Z.H., M.R., M.M., T.M.I.M., and R.I.; data curation, W.F. and V.A.; formal analysis, A.R., W.F., G.M.I., V.A., and T.M.I.M.; funding acquisition, Z.H. and R.I.; investigation, W.F.; methodology, Z.H. and R.I.; software, A.R. and R.S.; supervision, T.M.I.M. and R.I.; validation, M.M., G.M.I., and T.M.I.M.; visualization, A.R. and R.S.; Writing—original draft, Z.H., W.F., V.A., T.M.I.M., and R.I.; writing—review and editing, Z.H., M.R., T.M.I.M., and R.I. All authors have read and agreed to the published version of the manuscript.

Funding

This research was funded by Universitas Riau through Hibah Guru Besar Grant with grant number: 630/UN.19.5.1.3/PP/2018 and Kementerian Pendidikan dan Kebudayaan through Penelitian Dasar scheme, grant number: 215/SP2H/LT/DPRM/2019.

Conflicts of Interest

The authors declare no conflict of interest.

References

  1. Dewan Energi Nasional. Buku Ketahanan Energi Nasional; Dewan Energi Nasional: Jakarta, Indonesia, 2014. [Google Scholar]
  2. Kurniawan, R.; Managi, S. Coal consumption, urbanization, and trade openness linkage in Indonesia. Energy Policy 2018, 121, 576–583. [Google Scholar] [CrossRef]
  3. Idroes, R.; Yusuf, M.; Alatas, M.; Subhan; Lala, A.; Saiful; Suhendra, R.; Idroes, G.M. Marwan Geochemistry of hot springs in the Ie Seu’um hydrothermal areas at Aceh Besar district, Indonesia. IOP Conf. Ser. Mater. Sci. Eng. 2018, 334, 012002. [Google Scholar] [CrossRef]
  4. Marwan; Syukri, M.; Idroes, R.; Ismail, N. Deep and Shallow Structures of Geothermal Seulawah Agam Based on Electromagnetic and Magnetic Data. Int. J. GEOMATE 2019, 16, 141–147. [Google Scholar] [CrossRef]
  5. Idroes, R.; Yusuf, M.; Alatas, M.; Subhan; Lala, A.; Muslem; Suhendra, R.; Idroes, G.M.; Suhendrayatna; Marwan; et al. Geochemistry of warm springs in the Ie Brôuk hydrothermal areas at Aceh Besar district. IOP Conf. Ser. Mater. Sci. Eng. 2019, 523, 012010. [Google Scholar] [CrossRef]
  6. Putri, D.R.; Nanda, M.; Rizal, S.; Idroes, R.; Ismail, N. Interpretation of gravity satellite data to delineate structural features connected to geothermal resources at Bur Ni Geureudong geothermal field. IOP Conf. Ser. Earth Environ. Sci. 2019, 364, 012003. [Google Scholar] [CrossRef] [Green Version]
  7. Idroes, R.; Yusuf, M.; Alatas, M.; Subhan; Lala, A.; Muhammad; Suhendra, R.; Idroes, G.M. Marwan Geochemistry of Sulphate spring in the Ie Jue geothermal areas at Aceh Besar district, Indonesia. IOP Conf. Ser. Mater. Sci. Eng. 2019, 523, 012012. [Google Scholar] [CrossRef]
  8. Marwan; Yanis, M.; Idroes, R.; Ismail, N. 2D inversion and static shift of MT and TEM data for imaging the geothermal resources of Seulawah Agam Volcano, Indonesia. Int. J. GEOMATE 2019, 17, 173–180. [Google Scholar] [CrossRef]
  9. Idroes, R.; Yusuf, M.; Saiful, S.; Alatas, M.; Subhan, S.; Lala, A.; Muslem, M.; Suhendra, R.; Idroes, G.M.; Marwan, M.; et al. Geochemistry Exploration and Geothermometry Application in the North Zone of Seulawah Agam, Aceh Besar District, Indonesia. Energies 2019, 12, 4442. [Google Scholar] [CrossRef] [Green Version]
  10. Erinofiardi; Gokhale, P.; Date, A.; Akbarzadeh, A.; Bismantolo, P.; Suryono, A.F.; Mainil, A.K.; Nuramal, A. A Review on Micro Hydropower in Indonesia. Energy Procedia 2017, 110, 316–321. [Google Scholar] [CrossRef]
  11. Biddinika, M.K.; Indrawan, B.; Yoshikawa, K.; Tokimatsu, K.; Takahashi, F. Renewable Energy on the Internet: The Readability of Indonesian Biomass Websites. Energy Procedia 2014, 61, 1376–1379. [Google Scholar] [CrossRef] [Green Version]
  12. Silitonga, A.S.; Masjuki, H.H.; Mahlia, T.M.I.; Ong, H.C.; Chong, W.T.; Boosroh, M.H. Overview properties of biodiesel diesel blends from edible and non-edible feedstock. Renew. Sustain. Energy Rev. 2013, 22, 346–360. [Google Scholar] [CrossRef]
  13. Goh, B.H.H.; Ong, H.C.; Cheah, M.Y.; Chen, W.-H.; Yu, K.L.; Mahlia, T.M.I. Sustainability of direct biodiesel synthesis from microalgae biomass: A critical review. Renew. Sustain. Energy Rev. 2019, 107, 59–74. [Google Scholar] [CrossRef]
  14. Handayani, N.A.; Ariyanti, D. Potency of Solar Energy Applications in Indonesia. Int. J. Renew. Energy Dev. 2012, 1, 33. [Google Scholar] [CrossRef] [Green Version]
  15. Ismail, M.S.; Moghavvemi, M.; Mahlia, T.M.I. Characterization of PV panel and global optimization of its model parameters using genetic algorithm. Energy Convers. Manag. 2013, 73, 10–25. [Google Scholar] [CrossRef]
  16. Ismail, M.S.; Moghavvemi, M.; Mahlia, T.M.I. Techno-economic analysis of an optimized photovoltaic and diesel generator hybrid power system for remote houses in a tropical climate. Energy Convers. Manag. 2013, 69, 163–173. [Google Scholar] [CrossRef]
  17. Mahlia, T.M.I.; Syazmi, Z.A.H.S.; Mofijur, M.; Abas, A.E.P.; Bilad, M.R.; Ong, H.C.; Silitonga, A.S. Patent landscape review on biodiesel production: Technology updates. Renew. Sustain. Energy Rev. 2020, 118, 109526. [Google Scholar] [CrossRef]
  18. Ong, H.C.; Masjuki, H.H.; Mahlia, T.M.I.; Silitonga, A.S.; Chong, W.T.; Yusaf, T. Engine performance and emissions using Jatropha curcas, Ceiba pentandra and Calophyllum inophyllum biodiesel in a CI diesel engine. Energy 2014, 69, 427–445. [Google Scholar] [CrossRef]
  19. Ong, H.C.; Milano, J.; Silitonga, A.S.; Hassan, M.H.; Shamsuddin, A.H.; Wang, C.-T.; Indra Mahlia, T.M.; Siswantoro, J.; Kusumo, F.; Sutrisno, J. Biodiesel production from Calophyllum inophyllum-Ceiba pentandra oil mixture: Optimization and characterization. J. Clean. Prod. 2019, 219, 183–198. [Google Scholar] [CrossRef]
  20. Martosaputro, S.; Murti, N. Blowing the Wind Energy in Indonesia. Energy Procedia 2014, 47, 273–282. [Google Scholar] [CrossRef] [Green Version]
  21. Dirjen Energi Baru dan Terbarukan dan Konservasi Energi Kementrian ESDM. Statistika EBTKE; EBTKE: Jakarta, Indonesia, 2015. [Google Scholar]
  22. Silitonga, A.S.; Atabani, A.E.; Mahlia, T.M.I.; Masjuki, H.H.; Badruddin, I.A.; Mekhilef, S. A review on prospect of Jatropha curcas for biodiesel in Indonesia. Renew. Sustain. Energy Rev. 2011, 15, 3733–3756. [Google Scholar] [CrossRef]
  23. Hedwig, R.; Lahna, K.; Idroes, R.; Karnadi, I.; Tanra, I.; Iqbal, J.; Kwaria, D.; Kurniawan, D.P.; Kurniawan, K.H.; Tjia, M.O.; et al. Food analysis employing high energy nanosecond laser and low pressure He ambient gas. Microchem. J. 2019, 147, 356–364. [Google Scholar] [CrossRef]
  24. Ghaffar, S.H.; Fan, M. Structural analysis for lignin characteristics in biomass straw. Biomass Bioenergy 2013, 57, 264–279. [Google Scholar] [CrossRef]
  25. Mohamad Haafiz, M.K.; Eichhorn, S.J.; Hassan, A.; Jawaid, M. Isolation and characterization of microcrystalline cellulose from oil palm biomass residue. Carbohydr. Polym. 2013, 93, 628–634. [Google Scholar] [CrossRef]
  26. Hasanah, U.; Setyowati, M.; Edwarsyah; Efendi, R.; Safitri, E.; Idroes, R.; Heng, L.Y.; Sani, N.D. Isolation of Pectin from coffee pulp Arabica Gayo for the development of matrices membrane. IOP Conf. Ser. Mater. Sci. Eng. 2019, 523, 12014. [Google Scholar] [CrossRef]
  27. Hasanah, U.; Sani, N.D.M.; Heng, L.Y.; Idroes, R.; Safitri, E. Construction of a Hydrogel Pectin-Based Triglyceride Optical Biosensor with Immobilized Lipase Enzymes. Biosensors 2019, 9, 135. [Google Scholar] [CrossRef] [Green Version]
  28. Hasanah, U.; Setyowati, M.; Efendi, R.; Muslem, M.; Md Sani, N.D.; Safitri, E.; Yook Heng, L.; Idroes, R. Preparation and Characterization of a Pectin Membrane-Based Optical pH Sensor for Fish Freshness Monitoring. Biosensors 2019, 9, 60. [Google Scholar] [CrossRef] [Green Version]
  29. Silitonga, A.S.; Shamsuddin, A.H.; Mahlia, T.M.I.; Milano, J.; Kusumo, F.; Siswantoro, J.; Dharma, S.; Sebayang, A.H.; Masjuki, H.H.; Ong, H.C. Biodiesel synthesis from Ceiba pentandra oil by microwave irradiation-assisted transesterification: ELM modeling and optimization. Renew. Energy 2020, 146, 1278–1291. [Google Scholar] [CrossRef]
  30. Silitonga, A.S.; Masjuki, H.H.; Ong, H.C.; Sebayang, A.H.; Dharma, S.; Kusumo, F.; Siswantoro, J.; Milano, J.; Daud, K.; Mahlia, T.M.I.; et al. Evaluation of the engine performance and exhaust emissions of biodiesel-bioethanol-diesel blends using kernel-based extreme learning machine. Energy 2018, 159, 1075–1087. [Google Scholar] [CrossRef]
  31. Direktorat Jenderal Perkebunan. Statistika Perkebunan Indonesia Komoditas Kelapa Sawit 2013–2015; Direktorat Jenderal Perkebunan: Jakarta, Indonesia, 2014. [Google Scholar]
  32. Wardani, L.; Massijaya, M.Y.; Machdie, M.F. Pemanfaatan Limbah Pelepah Sawit dan Plastik Daur Ulang (RPP) sebagai Papam Komposit Plastik. J. Hutan Trop. 2013, 01, 46–53. [Google Scholar]
  33. Tumuluru, J.S.; Wright, C.T.; Hess, J.R.; Kenney, K.L. A review of biomass densification systems to develop uniform feedstock commodities for bioenergy application. Biofuels Bioprod. Biorefining 2011, 5, 683–707. [Google Scholar] [CrossRef]
  34. Parthasarathy, P.; Narayanan, K.S. Hydrogen production from steam gasification of biomass: Influence of process parameters on hydrogen yield–A review. Renew. Energy 2014, 66, 570–579. [Google Scholar] [CrossRef]
  35. Muslem, M.; Kuncaka, A.; Himah, T.N.; Roto, R. Preparation of Char-Fe3O4 Composites from Polyvinyl Chloride with Hydrothermal and Hydrothermal-Pyrolysis Carbonization Methods as Co(II) Adsorbents. Indones. J. Chem. 2019, 19, 835. [Google Scholar] [CrossRef]
  36. Asavatesanupap, C.; Santikunaporn, M. A Feasibility Study on Production of Solid Fuel from Glycerol and Agricultural Wastes. Int. Trans. J. Eng. Manag. Appl. Sci. Technol. 2012, 01, 43–51. [Google Scholar]
  37. Umam, M.C. Optimasi Penambahan Limbah Gliserol Hasil Samping Transesterifikasi Minyak Jarak Pagar Dan Perekat Tapioka Pada Pembuatan Biomass Pellets Bungkil Jarak Pagar (Jatropha curcas L.); Institut Pertanian Bogor: Bogor, Indonesia, 2007. [Google Scholar]
  38. Susanty, W.; Helwani, Z. Zulfansyah Torrefaction of oil palm frond: The effect of process condition to calorific value and proximate analysis. IOP Conf. Ser. Mater. Sci. Eng. 2018, 345, 012016. [Google Scholar] [CrossRef] [Green Version]
  39. Susanty, W.; Helwani, Z.; Bahruddin, B. Optimization of the Condition of Palm Frond Torrefaction Process by Utilizing Liquid Torrefaction Product as Pre-treatment for Improve Product Quality. J. Rekayasa Kim. Lingkung. 2019, 14, 12–18. [Google Scholar] [CrossRef]
  40. Helwani, Z.; Zulfansyah; Fatra, W.; Fernando, A.Q.; Idroes, G.M.; Muslem; Idroes, R. Torrefaction of Empty Fruit Bunches: Evaluation of Fuel Characteristics Using Response Surface Methodology. IOP Conf. Ser. Mater. Sci. Eng. 2020, 845, 012019. [Google Scholar] [CrossRef]
  41. Montgomery, C.D. Design and Analysis of Experiments, 8th ed.; John Wiley & Sons, Inc.: New York, NY, USA, 2013. [Google Scholar]
  42. Helwani, Z.; Fatra, W.; Arifin, L.; Othman, M.R. Syapsan Effect of process variables on the calorific value and compressive strength of the briquettes made from high moisture Empty Fruit Bunches (EFB). IOP Conf. Ser. Mater. Sci. Eng. 2018, 345, 012020. [Google Scholar] [CrossRef] [Green Version]
  43. Sinaga, S. Identifikasi Sifat Fisis dan Kimia Briket Arang Dari Sabut Kelapa; Institut Pertanian Bogor: Bogor, Indonesia, 2008. [Google Scholar]
  44. Surono, U.B. Peningkatan Kualitas Pembakaran Biomassa Limbah Jagung sebagai Bahan Bakar Alternatif dengan Karbonisasi dan Pembriketan. J. Rekayasa Proses 2010, 4, 13–18. [Google Scholar]
  45. Ilham, M.A.; Helwani, Z.; Fatra, W. Proses Densifikasi Produk Karbonisasi Pelepah Sawit menjadi Briket Menggunakan Gliserol Produk Samping Biodiesel sebagai Filler. J. Online Mhs. Fak. Tek. Univ. Riau 2016, 3, 1–4. [Google Scholar]
  46. Thompson, J.C.; He, B.B. Characterization of Crude Glycerol from Biodiesel Production from Multiple Feedstocks. Appl. Eng. Agric. 2006, 22, 261–265. [Google Scholar] [CrossRef]
  47. Ali, A.; Fortuna, A.D.; Restuhadi, F. Kajian Pemanfaatan Biomassa Limbah Industri Minyak Picung (Pangium Edule Reinw) Untuk Biobriket Sumber Energi Alternatif Di Desa Pulau Picung. J. Sagu 2013, 11. [Google Scholar]
  48. Martynis, M.; Sundari, E.; Sari, E. Pembuatan Biobriket dari Limbah Cangkang Kakao. J. Litbang Ind. 2012, 2, 35. [Google Scholar] [CrossRef] [Green Version]
  49. Subroto, H. Sartono Pengaruh Variasi Tekanan Pengepresan Terhadap Karakteristik Mekanik dan Karakteristik Pembakaran Briket Kokas Lokal. J. Tek. Gelagar Univ. Sebel. Maret Surak. 2007, 18, 73–79. [Google Scholar]
  50. Sudiro, R.; Subroto, S. Karakteristik Briket Campuran Arang Kayu dan Jerami. J. Sainstech Politek. Indonusa Surak. 2008, 2355–5009. [Google Scholar]
Figure 1. CCD Model of Bricket Material Prepared from Palm Stem Biomass (Modified from [41]).
Processes 08 00777 g001
Figure 2. Prediction versus actual regression model (a) heating value (b) compressive strength.
Processes 08 00777 g002
Figure 3. The main effect of process conditions on the heating value.
Processes 08 00777 g003
Figure 4. Two-factor interaction effect of process conditions on the heating value.
Processes 08 00777 g004
Figure 5. Graphic and contour of surface response of the adhesive composition and pressing pressure effect on the heating value of particle size (a) 60 (b) 80, and (c) 100 mesh.
Processes 08 00777 g005
Figure 6. The main effect of process conditions on the compressive strength.
Processes 08 00777 g006
Figure 7. Two-factor interaction effect of process conditions on the compressive strength.
Processes 08 00777 g007
Figure 8. Graph and contour of surface response influences the adhesive composition and particle size to compressive strength at the pressing pressure (a) 100 (b) 110, and (c) 120 kg/cm2
Processes 08 00777 g008
Figure 9. Graph and contour of the surface response of the effect of particle size and pressing pressure on the compressive strength and the adhesive composition (a) 80:20 (b) 70:30, and (c) 60:40.
Processes 08 00777 g009
Figure 10. Graph and contour of the surface response of the effect of the adhesive composition and pressing pressure on compressive strength on particle size (a) 60 (b) 80, and (c) 100 mesh.
Processes 08 00777 g010
Figure 11. Maximum points of heating value and compressive strength with the factor levels.
Processes 08 00777 g011
Table 1. Levels of the briquetting variables studied in this experiment.
VariableCodingUnitLevels
−α−101α
Particle sizeX1mesh46.46080100113.6
Adhesive compositionX2%wt13.220304046.8
Pressure pressingX3Kg/cm293.2100110120126.8
Note: α = 1.68.
Table 2. Characteristics of Palm Stem, Palm Bar Charcoal, and Palm Stem Briquettes.
No.CharacteristicUnitPalm StemPalm Stem CharcoalPalm Stem Briquettes
1Heating ValuekJ/kg18,123.61521,699.5921,968.2–28,089.6
2Water Content%-b9.105.035.5
3Volatile Matter Content%-b76.922.1919.73
4Ash Content%-b20.740,.45
5Carbon bound Content%-b126971.4
6Compressive Strengthkg/cm2--0.86–7.526
7Densitygr/cm3--0.72–1.06
Table 3. Summary of various research responses to the heating value (Y1) and compressive strength (Y2).
StdRunNatural VariableCoded VariableResponse
ξ1ξ2ξ3X1X2X3Y1Y2
1156020100−1−1−121,968.21.611
23100201001−1−122,889.31.302
316040100−11−125,238.40.86
481004010011−127,630.74.929
546020120−1−1125,193.53.818
618100201201−1125,038.71.530
7196040120−11127,352.71.010
861004012011125,009.57.526
92046.430110−1.680025,093.51.202
109113.6301101.680025,193.55.346
11138013.21100−1.68022,445.71.756
12118046.811001.68028,089.62.377
137803093.200−1.6822,934.11.205
14178030126.8001.6827,352.74.871
1510803011000024,245.62.149
165803011000025,326.42.319
1716803011000024,834.92.916
1812803011000024,794.92.856
192803011000025,326.43.230
2014803011000025,148.72.040
Table 4. Summary of the F-Value for each response variable.
ResponseSource of VarianceDFSSMSF-Valuep-Value
Heating ValueRegression947,878,0955,319,78810.600.000 **
Error105,016,949501,695
Lack of Fit54,160,719832,1444.860.054
Pure Error5856,230171,246
Total1952,895,044
Compressive StrengthRegression949.55645.50637.870.002 **
Error106.99580.6996
Lack of Fit55.83891.16785.050.050
Pure Error51.15690.2314
Total1956.5522
Note: ** means significant at α = 0.01.
Table 5. p-value summary for the response of heating value and compressive strength.
Sourcep-Value of Heating Valuep-Value of Compressive Strength
Constant0.000 *0.000 *
A—Particle Size0.6710.002 *
B—adhesive composition0.000 *0.031 *
C—Pressure Pressing0.001 *0.006 *
A20.9320.354
B20.6930.547
C20.8680.373
AB0.8010.000 *
AC0.013 *0.641
BC0.018 *0.883
R20.9050.876
MAPE1.68127.575
RMSE708.3040.836
Note: * means significant at α = 0.05.

