Article

Microemulsion Rheological Analysis of Alkaline, Surfactant, and Polymer in Oil-Water Interface

by
Mohd Sofi Numin
1,*,
Khairulazhar Jumbri
1,*,
Anita Ramli
1 and
Noorazlenawati Borhan
2
1
Department of Fundamental and Applied Sciences, Universiti Teknologi PETRONAS, Seri Iskandar 32610, Malaysia
2
PETRONAS Research Sdn. Bhd, Lot 3288 & 3289, Off jalan Ayer Itam, Bangi 43000, Malaysia
*
Authors to whom correspondence should be addressed.
Processes 2020, 8(7), 762; https://doi.org/10.3390/pr8070762
Submission received: 10 December 2019 / Revised: 23 January 2020 / Accepted: 23 February 2020 / Published: 29 June 2020
(This article belongs to the Special Issue Heavy Oils Conversion Processes)

Abstract

:
Injection of alkaline (A), polymer (P), and surfactant (S) chemicals in enhanced oil recovery (cEOR) processes increases output by changing the properties of the injected fluid. In this work, micellar fluid interactions were studied via microemulsion rheological analysis. Crude oil and stimulated brine with ASP or SP was used for bottle testing. The results revealed that no microemulsion was produced when ASP (Alkaline, Surfactant, and Polymer) or SP (Surfactant and Polymer) was left out during the bottle testing phase. The addition of ASP and SP led to the formation of microemulsions—up to 29% for 50% water cut (WC) ASP, and 36% for 40% WC SP. This shows that the addition of ASP and SP can be applied to flooding applications. The results of the rheological analysis show that the microemulsions behaved as a shear-thinning micellar fluid by decreasing viscosity with increase in shear rate. As per the power-law equation, the ASP micellar fluid viscoelastic behavior shows better shear-thinning compared to SP, suggesting more efficiency in fluid mobility and sweep efficiency. Most of the microemulsions exhibited viscoelastic fluid behavior (G’ = G”) at angular frequency of 10 to 60 rad s−1, and stable elastic fluid behavior (G’ > G’’) below 10 rad s−1 angular frequency. The viscosity of microemulsion fluids decreases as temperature increases; this indicates that the crude oil (i.e., alkanes) was solubilized in core micelles, leading to radial growth in the cylindrical part of the wormlike micelles, and resulting in a drop in end-cap energy and micelle length. No significant difference was found in the analysis of viscoelasticity evaluation and viscosity analysis for both ASP and SP microemulsions. The microemulsion tendency test and rheology test show that the addition of ASP and SP in the oil-water interface yields excellent viscoelastic properties.

1. Introduction

Chemical EOR (cEOR) is a method to increase oil recovery by improving the properties of reservoir fluids to make them more favourable for oil extraction. The introduction of cost-effective surfactants and polymers, coupled with improved reservoir modelling, has re-invigorated the surfactant, polymer (SP) and alkaline, surfactant, polymer (ASP) flooding in current cEOR processes [1]. ASP and SP flooding is a technique based on gradual enhancement of oil recovery by decreasing the interfacial tension (IFT) value, increasing the capillary number, enhancing microscopic displacing efficiency, improving mobility ratio, and increasing macroscopic sweep efficiency [2].
The choice of apt chemicals in ASP and SP flooding plays a significant role in ensuring that the reservoir fluids are effective in oil extraction. In ASP and SP flooding, the surfactant acts as a surface acting agent to reduce the IFT value and extract oil trapped between rocks in the reservoir. This hydrophobic group of surfactants interacts with the oil and changes its properties, thus, making it easier to flow. Betaine is a surfactant usually used in EOR industries. This is due to its structural properties that contain both hydrophilic cation and hydrophilic anion groups, allowing low irritation, excellent hard water resistance, and broad applicability [3].
Alkaline is added into EOR flooding to reduce surfactant adsorption with the reservoir surface; it plays the role of ionic strength in lowering the value of IFT. Carbonate-based alkaline is commonly used in chemical EOR flooding due to its buffer capacity, which prevents a drastic change in pH from taking place [4]. Moreover, the presence of a polymer in chemical EOR flooding increases the performance of the injected fluid by increasing its viscosity and reducing effective water permeability, thus resulting in better mobility ration and sweep efficiency. The addition of a polymer also causes thickening of the injected water–flooded oil, increasing the oil recovery factor [5,6]. Thus, choosing the right chemical is vital for better performance of the injected fluid (ASP and SP) in chemical EOR flooding.
In EOR techniques, microemulsion is an efficient tool due to certain properties, which include thermodynamically stable, efficient molecular packing, low viscosity with Newtonian behaviour, and ultra-low interfacial tension to extract oil trapped in the reservoir. The physical properties of microemulsions are dependent on salinity, temperature, type and concentration chemical used in ASP, and crude oil and water composition [4]. The flow behaviour and performance of the microemulsions in EOR flooding changes with alteration in its properties. The performance of ASP and SP in flooding applications was measured by several tests, such as interfacial tension (IFT) measurement, phase behaviour test, solubility test, and measurement of recovery factor by injecting ASP and SP directly into the simulation reservoir system. However, the mechanism and interaction of the injected micellar fluid with oil in the reservoir require in-depth study using higher-resolution techniques such as rheology tests. Measuring of rheological properties is an excellent tool in describing the parameters for mobility control in chemical EOR (cEOR). It characterizes the apparent viscosity of the EOR polymers as a function of shear rate, concentration, and temperature, since viscosity is the primary concern in mobility control in EOR processes [7,8]. In 2015, the rheological properties of two polymer solutions, xantham gum and HPAM, was explained by comparing them in terms of viscosity at different salinities, concentrations, and temperatures [9]. The findings show that the injection of xantham gum is more effective in higher salinity reservoir conditions. However, one of its downfalls is that it cannot penetrate low permeability rocks [10].
In addition, the viscoelastic properties of the injected micellar fluid can be analysed with the rheology test. The ratio of the elastic modulus (G’) to the viscous modulus (G”) represents the elasticity of the micellar fluid. The presence of HPAM increases the elasticity of the displacing micellar fluid and decreases the saturation of the trapped oil, thus enhancing microscopic displacement efficiency [11]. In this study, interfacial rheology of the microemulsion was used to investigate the interfacial reaction products directly at the interfaces. ASP and SP chemicals were chosen to offer a rheology property that is favourable towards the mobility and sweep efficiency of the injected fluid in the reservoir. The rheology properties of emulsion in ASP and SP flooding, such as bulk viscosity, elasticity, and under shear rate, must be studied in future to identify the ideal chemicals for each field in the enhanced oil recovery (EOR) process.

2. Materials and Methods

2.1. Materials

The ASP and SP chemical compositions consist of sodium carbonate (Na2CO3) from R&M Chemicals, 38% Surfactant S672 [CH3-(CH2)10-CONH-(CH2)3-N+(CH3)2-C(CH#)2-COO] from Oil Chem Technologies, Inc. (Sugar Land, TX, USA), and FLOPAAM 3330/HPAM –[-CH2-CH(CONH)m-[-CH2-CH(COONa+)n-]- from SNF Holding Company (Riceboro, GA, USA) as alkaline, surfactant, and polymer, respectively. In preparation of the ASP and SP compositions, all chemicals were weighed and stirred for 2 to 4 h. The crude oil used in this experiment came from the PETRONAS Sabah field (PETRONAS, Sabah, Malaysia). Calcium chloride dihydrate, magnesium chloride hexahydrate, potassium chloride, barium chloride dihydrate, strontium chloride hexahydrate, lithium chloride, sodium carbonate anhydrate, sodium sulphate, and sodium chloride were used in the preparation of brine solution. Table 1 and Table 2 show the composition and properties of brine and crude oil, respectively.
The composition of crude oil and its properties were obtained from our previously published paper, with permission from Borhan, N.; Halim, N.H.; Ibrahim, J.M.B.M: An Investigation of Micro-Emulsion and Fine Foams Induced by EOR Application in Malaysian Fields; published by the Society of Petroleum Engineers—International Petroleum Technology Conference 2014, IPTC 2014–Innovation and Collaboration: Keys to Affordable Energy, 2014.

2.2. Emulsion Tendency Test

The emulsion tendency test was performed according to procedure given in [13]. The test was initiated to select the optimum ratio of ASP: brine that gives the highest volume of microemulsions for its respective water cut (WC). Table 3 shows the percentage of crude oil in different water cuts used in bottle testing. The crude oil was placed in a water bath at 60 °C for 5 min to stimulate its temperature with actual offshore temperature conditions. The mixtures of brine, ASP, or SP, and crude oil were filled into 25 mL test tubes at different water cuts and percentages of crude oil. The test tubes were secured using aluminium foil and shaken for 100 times manually. The amount of water and oil separated was recorded at 0, 5, 10, 15, 20, and 30 min. The separation was recorded directly from the test tube.

2.3. Emulsion Rheology Test

Rheological measurement of microemulsion is a valuable tool in understanding the behaviour of microemulsion formation during the storage and injection process [14]. The microemulsion produced during the bottle testing was analysed by using a rheometer equipped with an interfacial rheology system (IRS) to study the behaviour of microemulsion as a bulk viscosity, viscoelastic, and under shear. The IRS consists of a bicone (radius of 34.12 mm and cone angle of 5°) and a glass of cup (inner radius of 40 mm and height of 20 mm) surrounded by an insulation jacket and covered by a metallic cap. Microemulsion samples of 3 mL were used to fill the measuring cup for a test. The frequency sweep was performed from 0.00628 to 62.8 angular frequencies at 0.1 to 100% shear rate. For viscosity analysis, the samples were analysed at various temperatures from 30 to 80 °C, fixed at 60 °C, and 1 to 70 s−1 shear rates. The micellar fluid samples were analysed using an instrument of the Anton Paar model of rheometer MCR 302, equipped with Rheocompass software. The sample preparation included removing the sample from the container, shaking or stirring it, filling it into the measuring system, positioning the measuring system as well as the subsequent waiting time, or a pre-defined shear before starting the actual measurement. The time taken to stabilize the microemulsions in the instrument was 15 min. Each microemulsion formulation of 3 mL taken from 21 samples was used to fill until the level marked on the measuring cups. The sample was always poured well above the upper rim of the inner cylinder.

3. Results and Discussion

The results obtained were segmented into two parts: Bottle testing for ASP and SP at five different concentrations and rheology analysis for the emulsion phase produced from the bottle testing experiment.

3.1. Emulsion Tendency Test

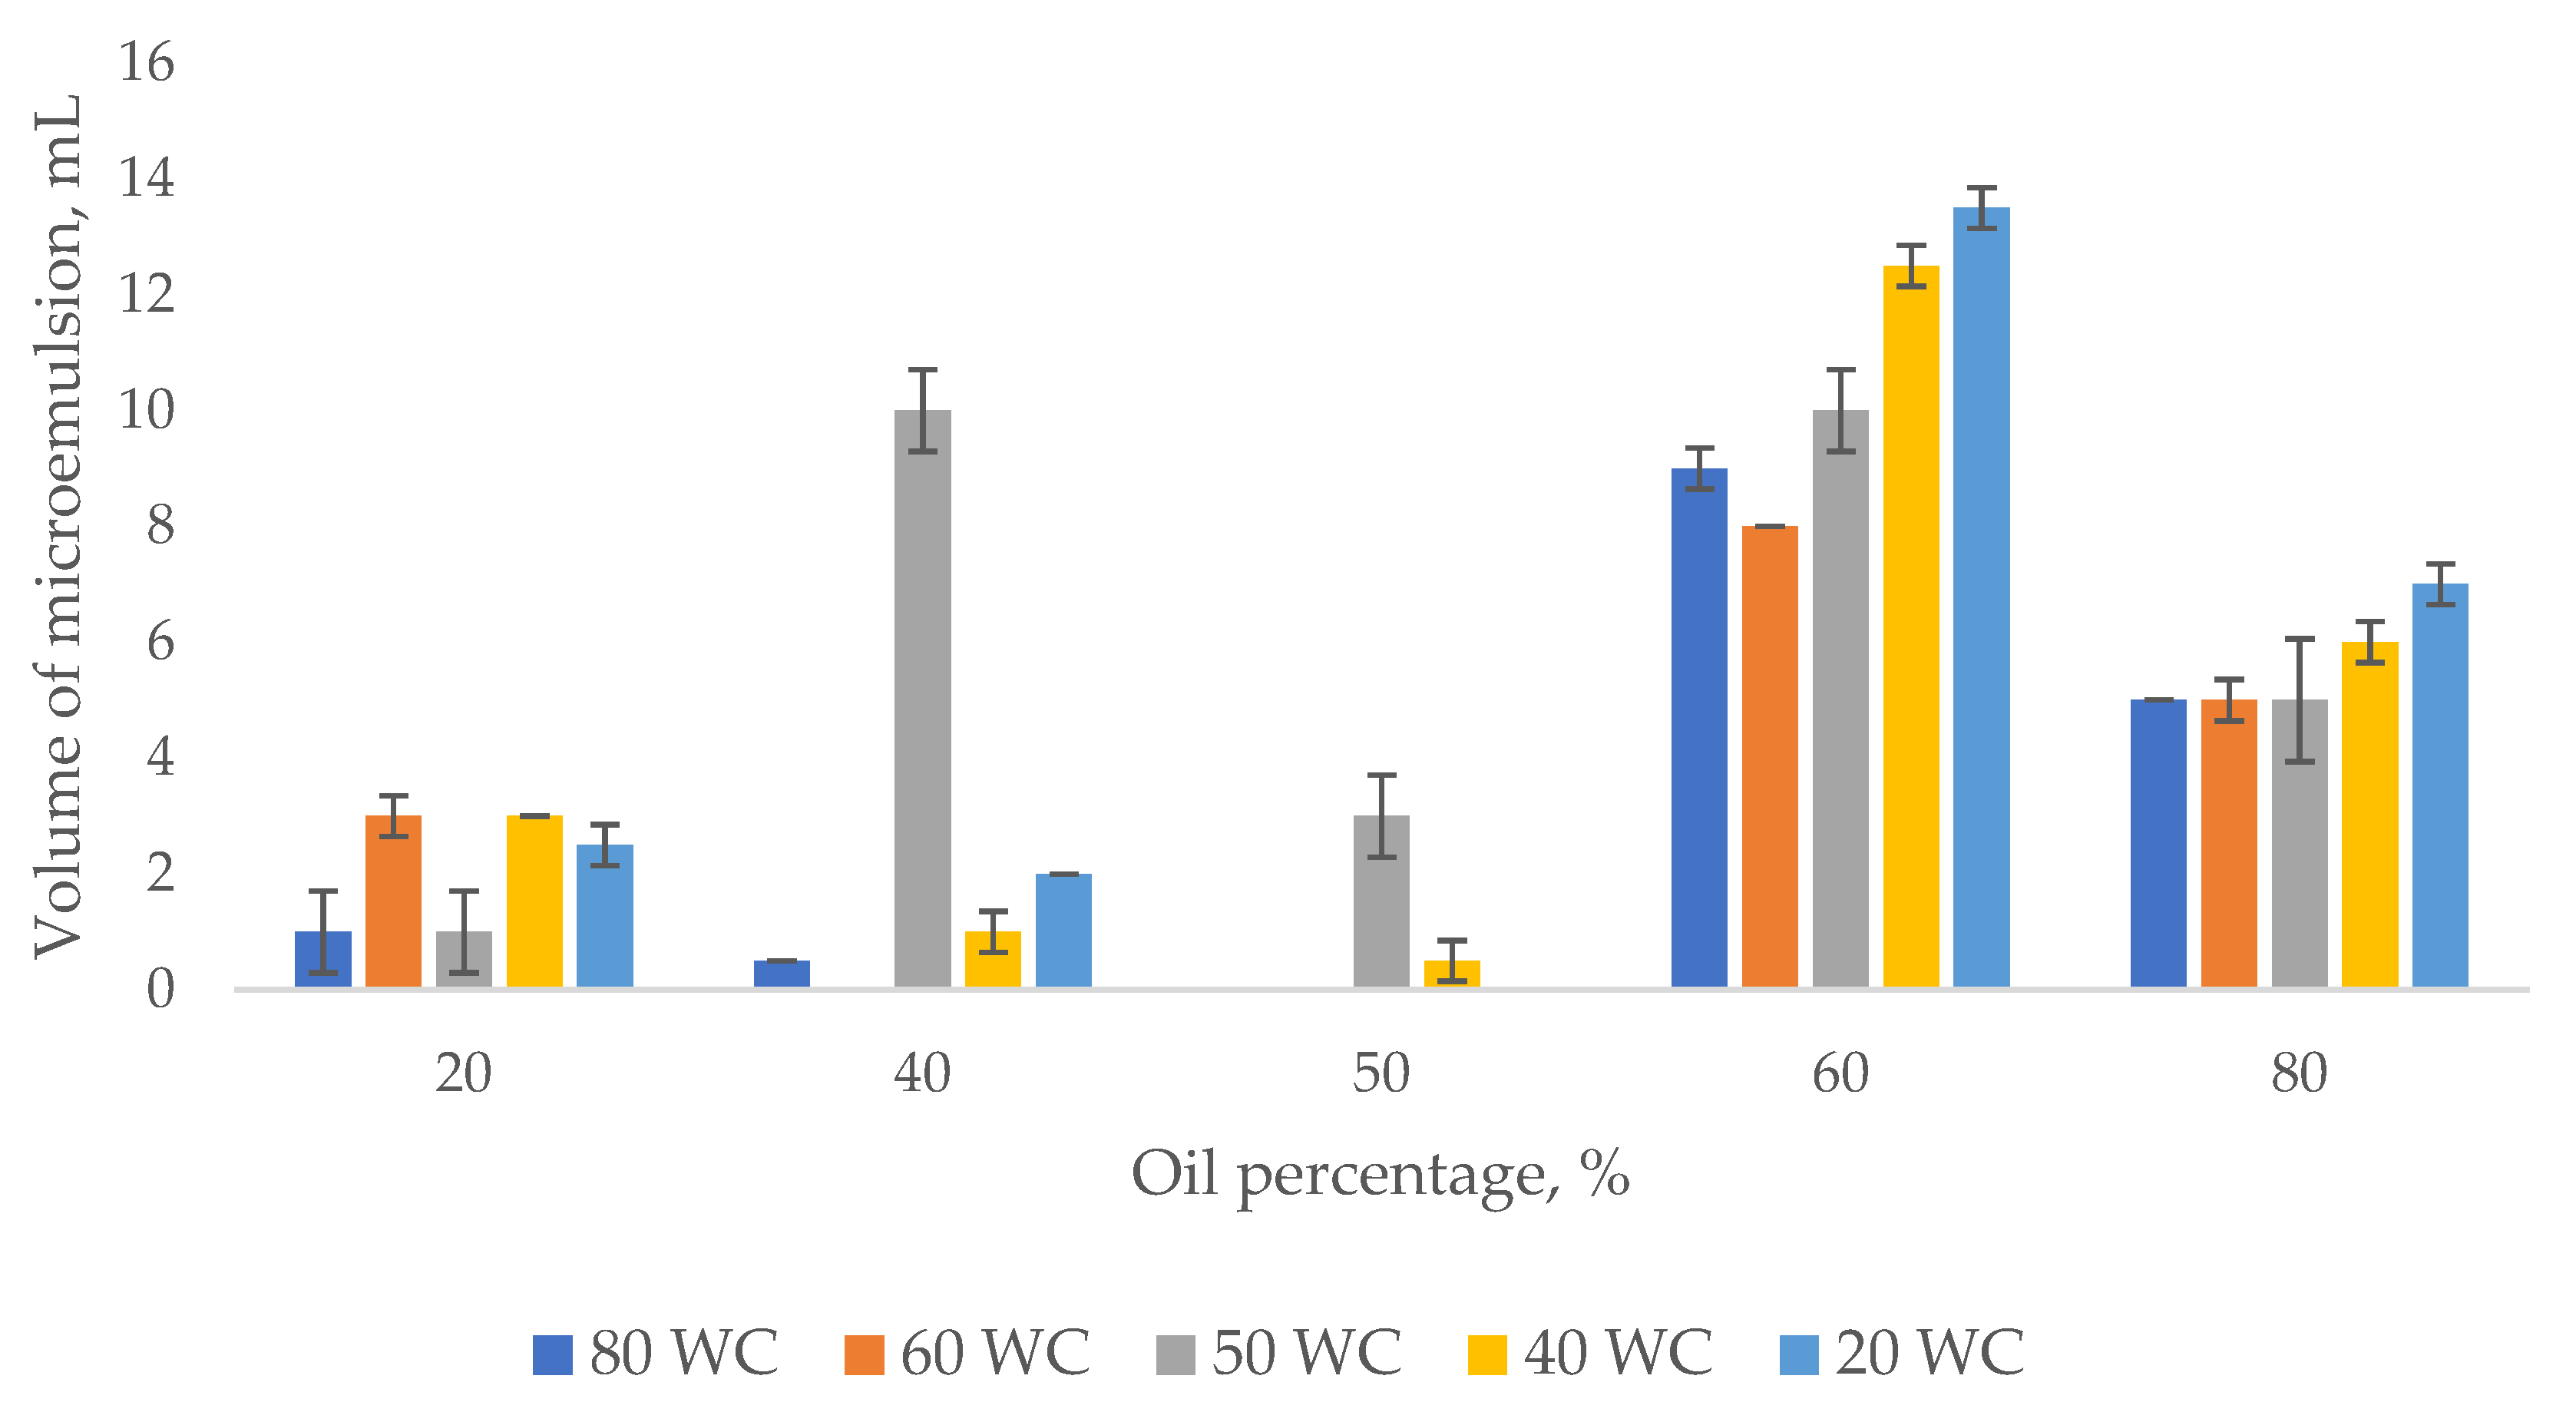
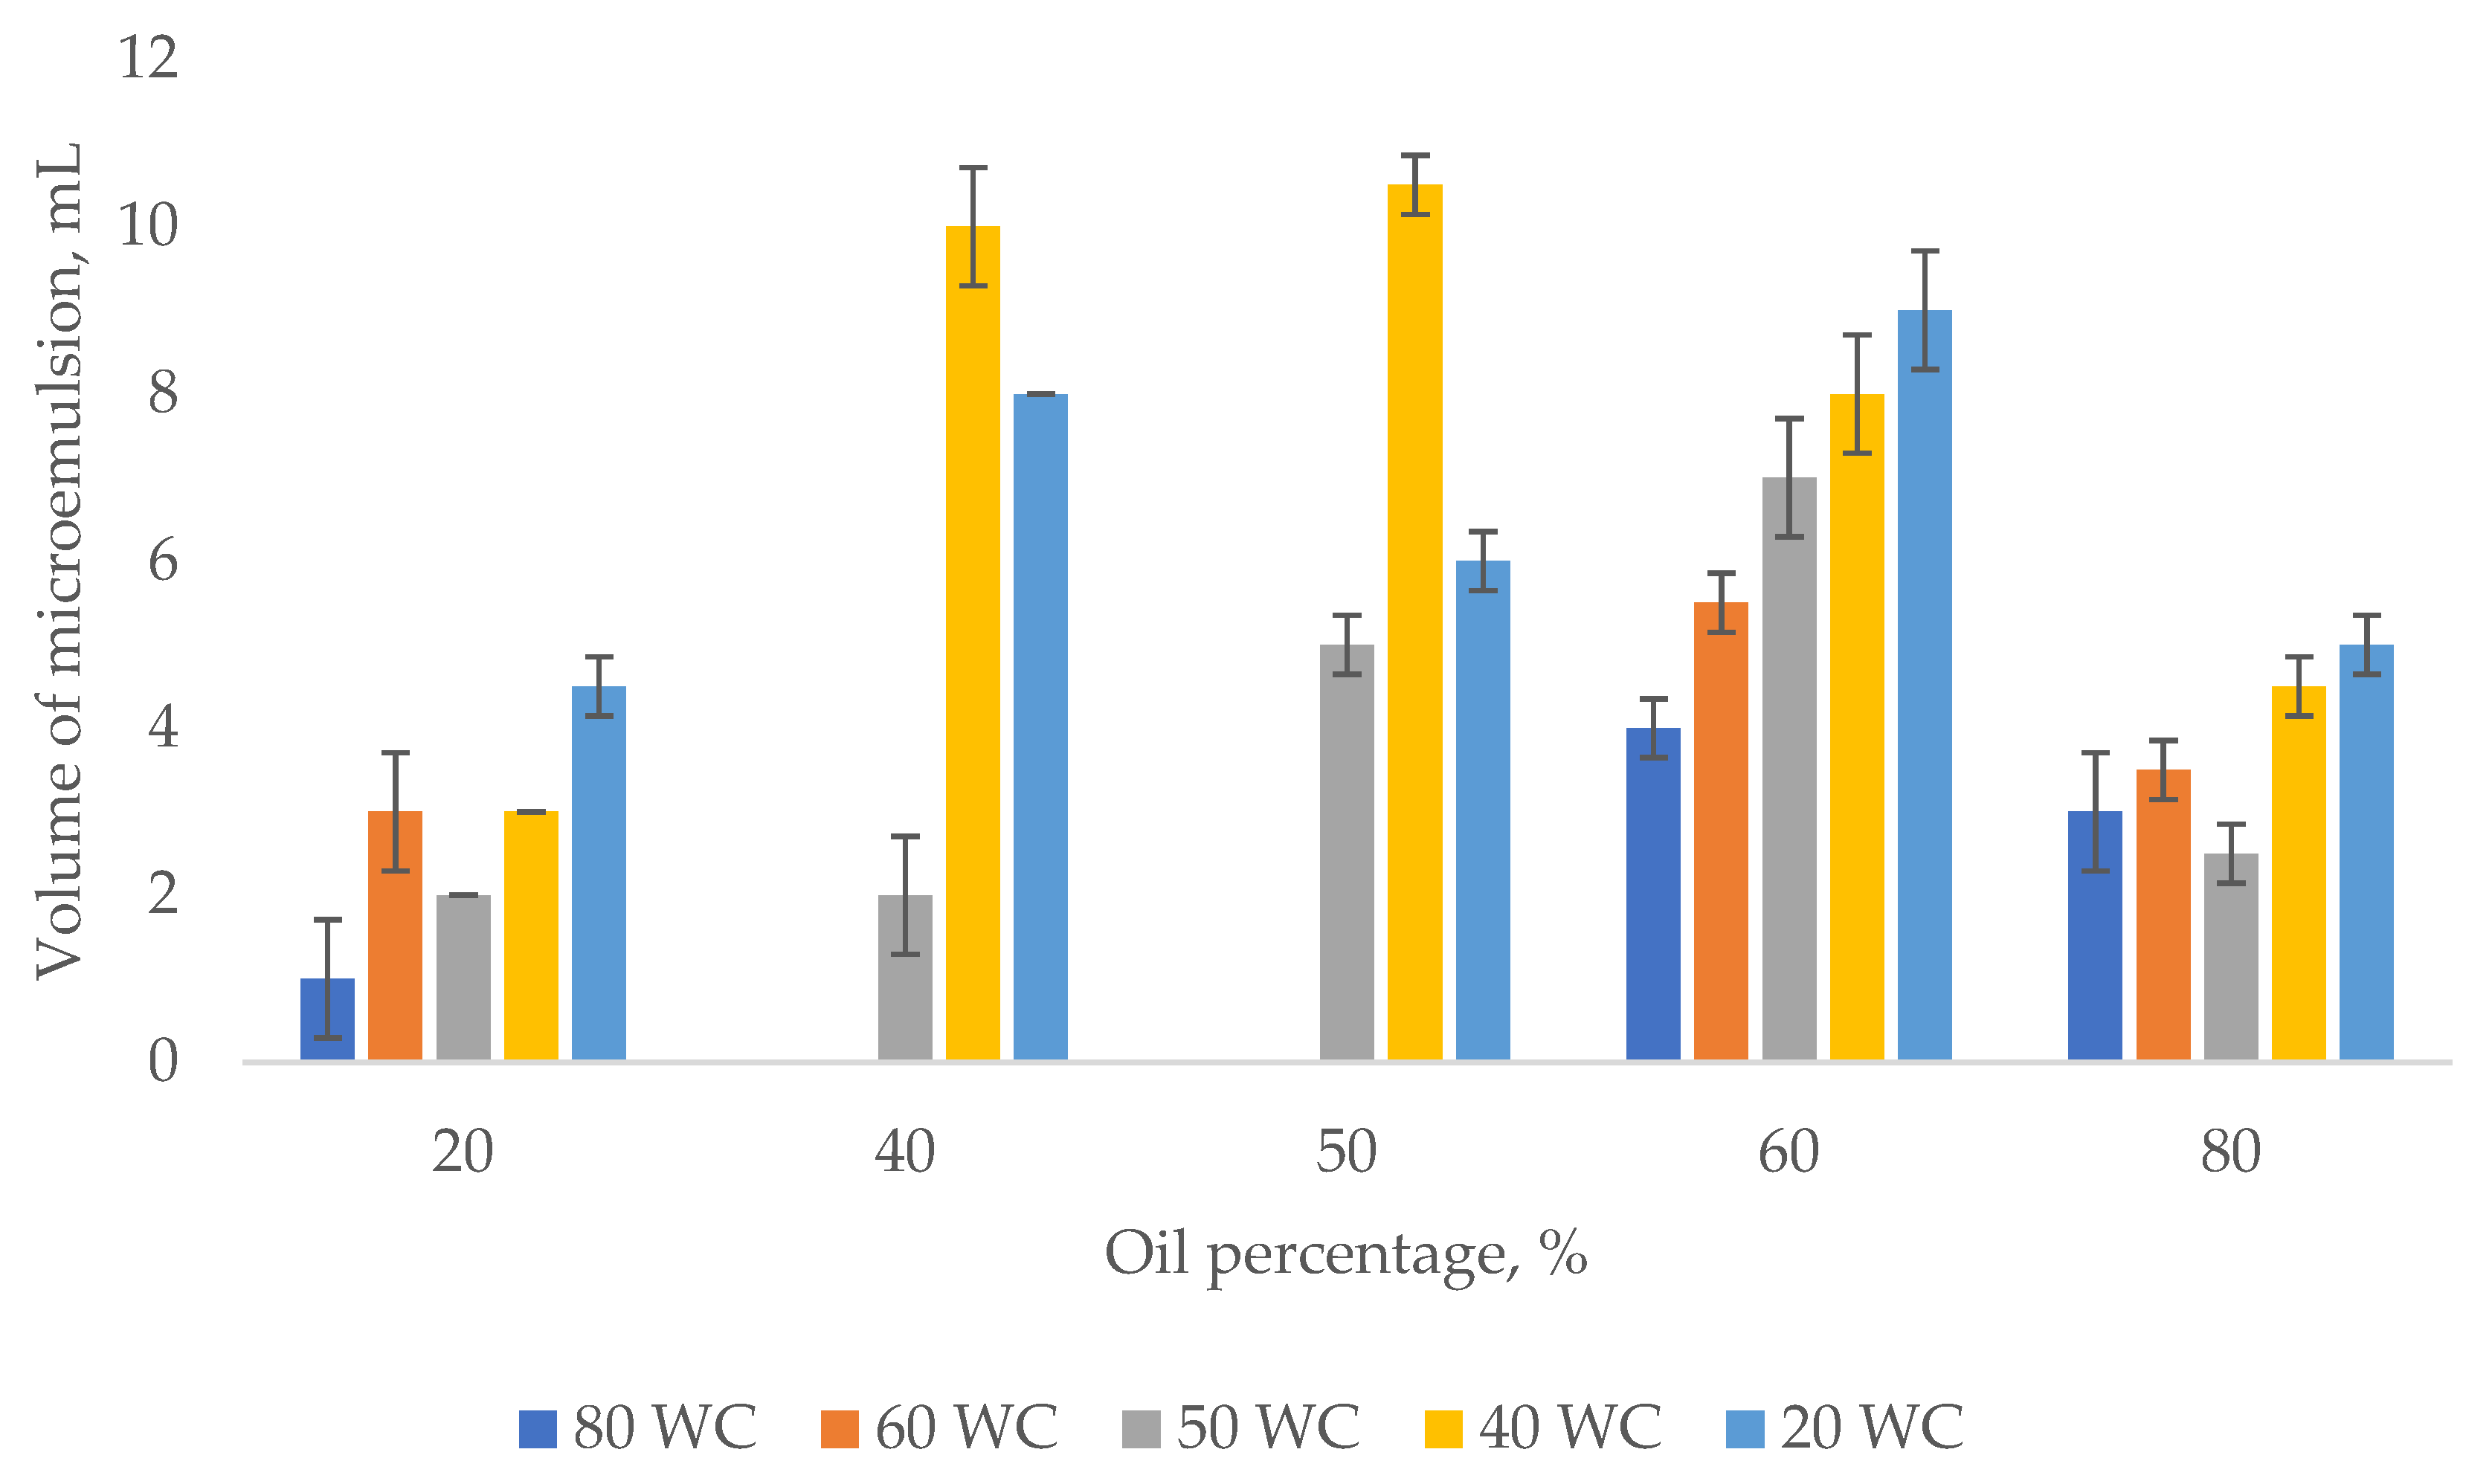
Emulsion tendency testing was performed to investigate the microemulsion tendency of ASP and SP in crude oil and to prepare the microemulsion for the rheology test. Figure 1 reveals the results of emulsion tendency bottle testing for a 100% WC solution at five different crude oil percent ratios after 30 min. All five crude oil percent ratios had no emulsion or microemulsion, and separation of oil and brine was clearly seen, indicating the lack of interaction. Figure 2 and Figure 3 show the microemulsion produced after the addition of ASP and SP in the crude oil and brine mixture. A mixture containing ASP in 50% water cut solution had the highest volume of microemulsion from 0 to 29%, respectively, while the highest volume of microemulsion for a mixture containing SP was recorded in 40% water cut solution from 0 to 36%, respectively. The results indicate that the ASP composition had a lower microemulsion volume, compared to that of the SP. The presence of ASP and SP enhanced the formation of microemulsion in the crude oil-brine mixture.

3.2. Emulsion Rheology Test

An emulsion rheology test was performed to investigate the rheology properties of microemulsion produced from the bottle testing test.

3.2.1. Shear Properties

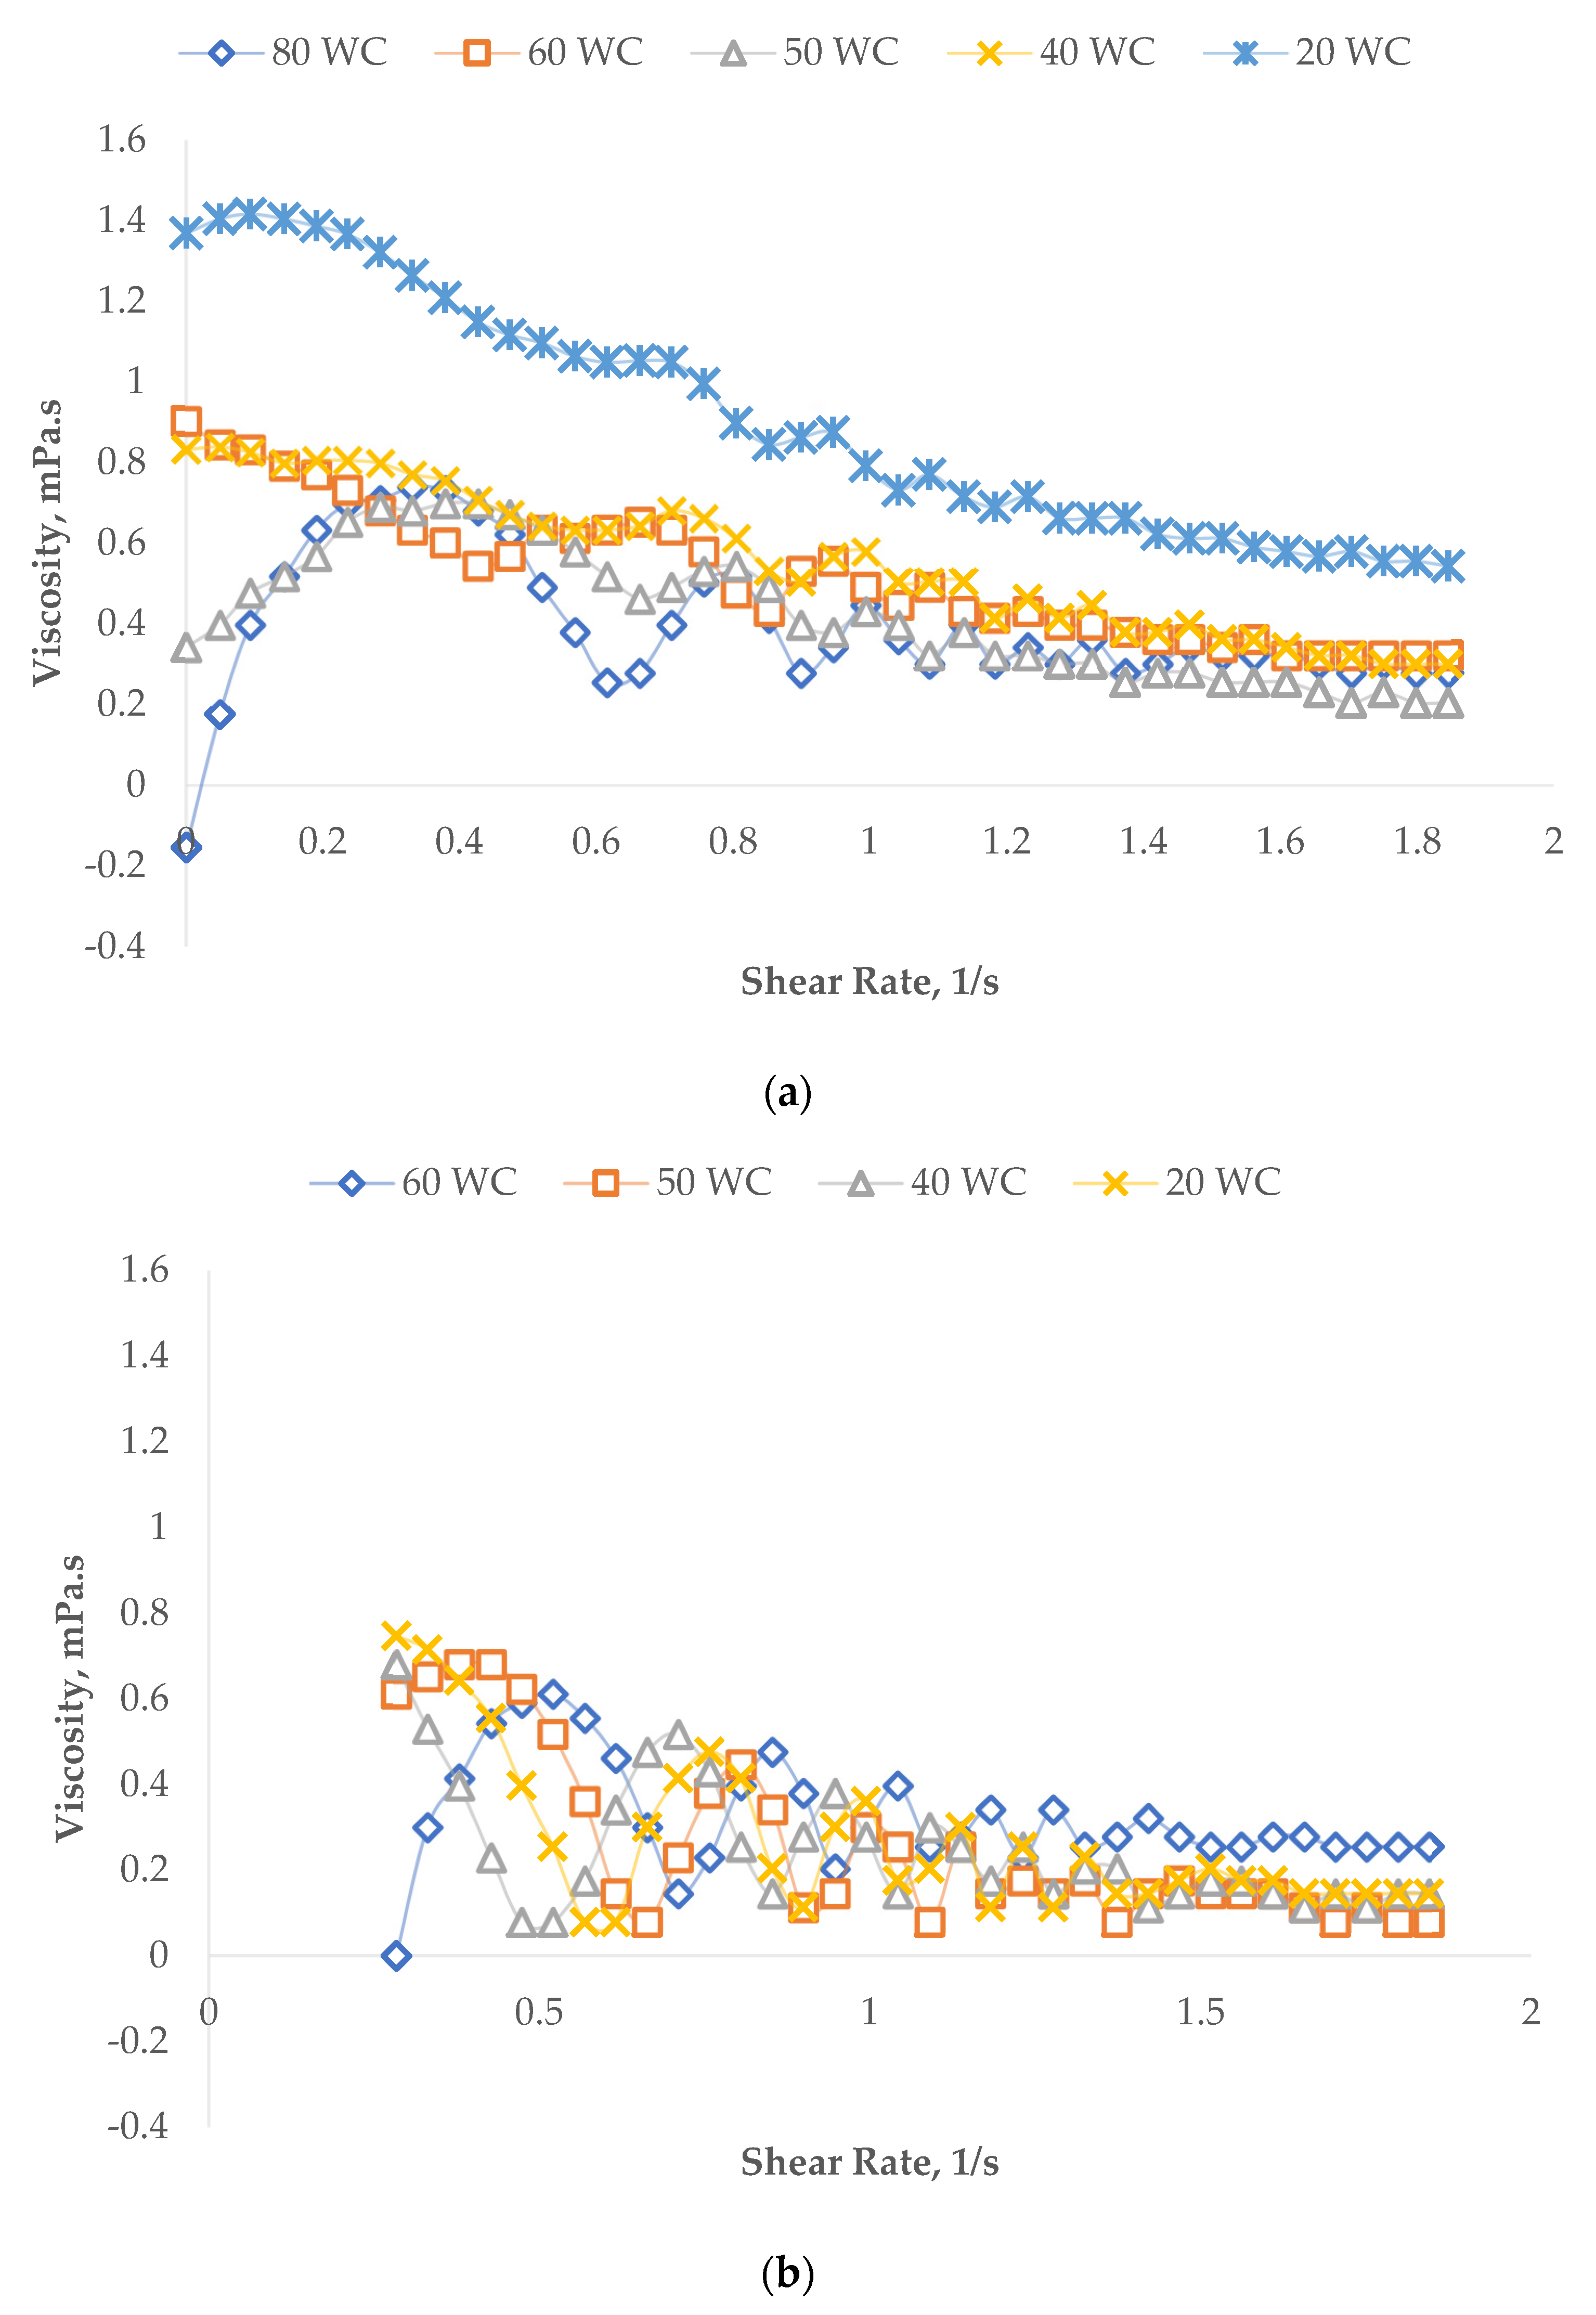
Figure 4a,b represent the changes in viscosity as a function of shear rate for ASP and SP microemulsions. The concentration of ASP varies from 20 to 80% WC, while the concentration of SP ranges from 20 to 60% WC. The temperature and shear rate were at 60 °C and 1 to 70 s−1, respectively. In Figure 4a, the log/log plot shows the effect of ASP concentrations on the functional relationship of viscosity and shear rate at 60% oil concentration. The viscosity of all microemulsions decreases as the shear rate increases, showing the typical behaviour of the pseudoplastic fluid. Increasing the ASP concentration resulted in more adsorption of the thickening agent through the oil-water interface, thus producing an apparent higher microemulsion viscosity. The marked rheology of ASP microemulsion comes from the HPAM polymer’s large macromolecular weight. The entanglement of macromolecule chains increases at a high concentration of ASP, which then causes an increase in viscosity of the microemulsion [10]. The shear-thinning behaviour phenomenon is related to the orientation of the macromolecule along the streamline of the flow [15]. At low shear rate, the entanglement of macromolecules causes the formation of aggregates, resulting in high viscosity fluid. As the shear rate was applied to the fluid, it destroyed the aggregates, and the dispersing molecules were arranged along the flow direction, declining the flow of the fluid resistance and subsequently decreasing the apparent viscosity [16].
Figure 4b indicates the viscous behaviour of SP as a function of shear rate. The viscosity of SP emulsions was in the range of 0 to 0.8 mPa.s, which is slightly lower than the viscosity of the ASP emulsion with a range of 0.2 to 1.4 mPa.s. The presence of alkaline in the system leads to an increase in the microemulsion viscosity. The high viscosity produced by the addition of alkali is due to a rise in pH value. As the pH value increases, the degree of hydrolysis increases and thrusts more negative charges on the polymer chain; thus, the polymer molecule expands and produces a higher viscosity [17]. The Power Law Equation (1) illustrates the relationship between viscosity and shear rate [18]:
η = Κ γ n 1
where, K, γ , and n are the viscosity, consistency index, shear rate, and power-law index, respectively. The power-law index provides information about the effects of shear on the system. The microemulsion shows shear-thinning behaviour when the value of n is below one, and the lower the value of n, more shear-thinning behaviour of the emulsion is produced. Table 4 indicates the rheological parameters obtained after fitting the data obtained in Figure 4a,b to the Power Law Equation (1). The plot from the figure and the data from the table indicate that consistency index K increases as the concentration of ASP and SP increases, and the values obtained for n by model fitting are less than 1, which appears on the shear-thinning system.
The shear properties of the microemulsion can also be characterized by the Herschel-Bulkeley Equation (2) [19]:
τ = τ 0 + K γ n
τ τ o = K γ n
log 10 ( τ τ o ) = log 10 K + n log 10 γ
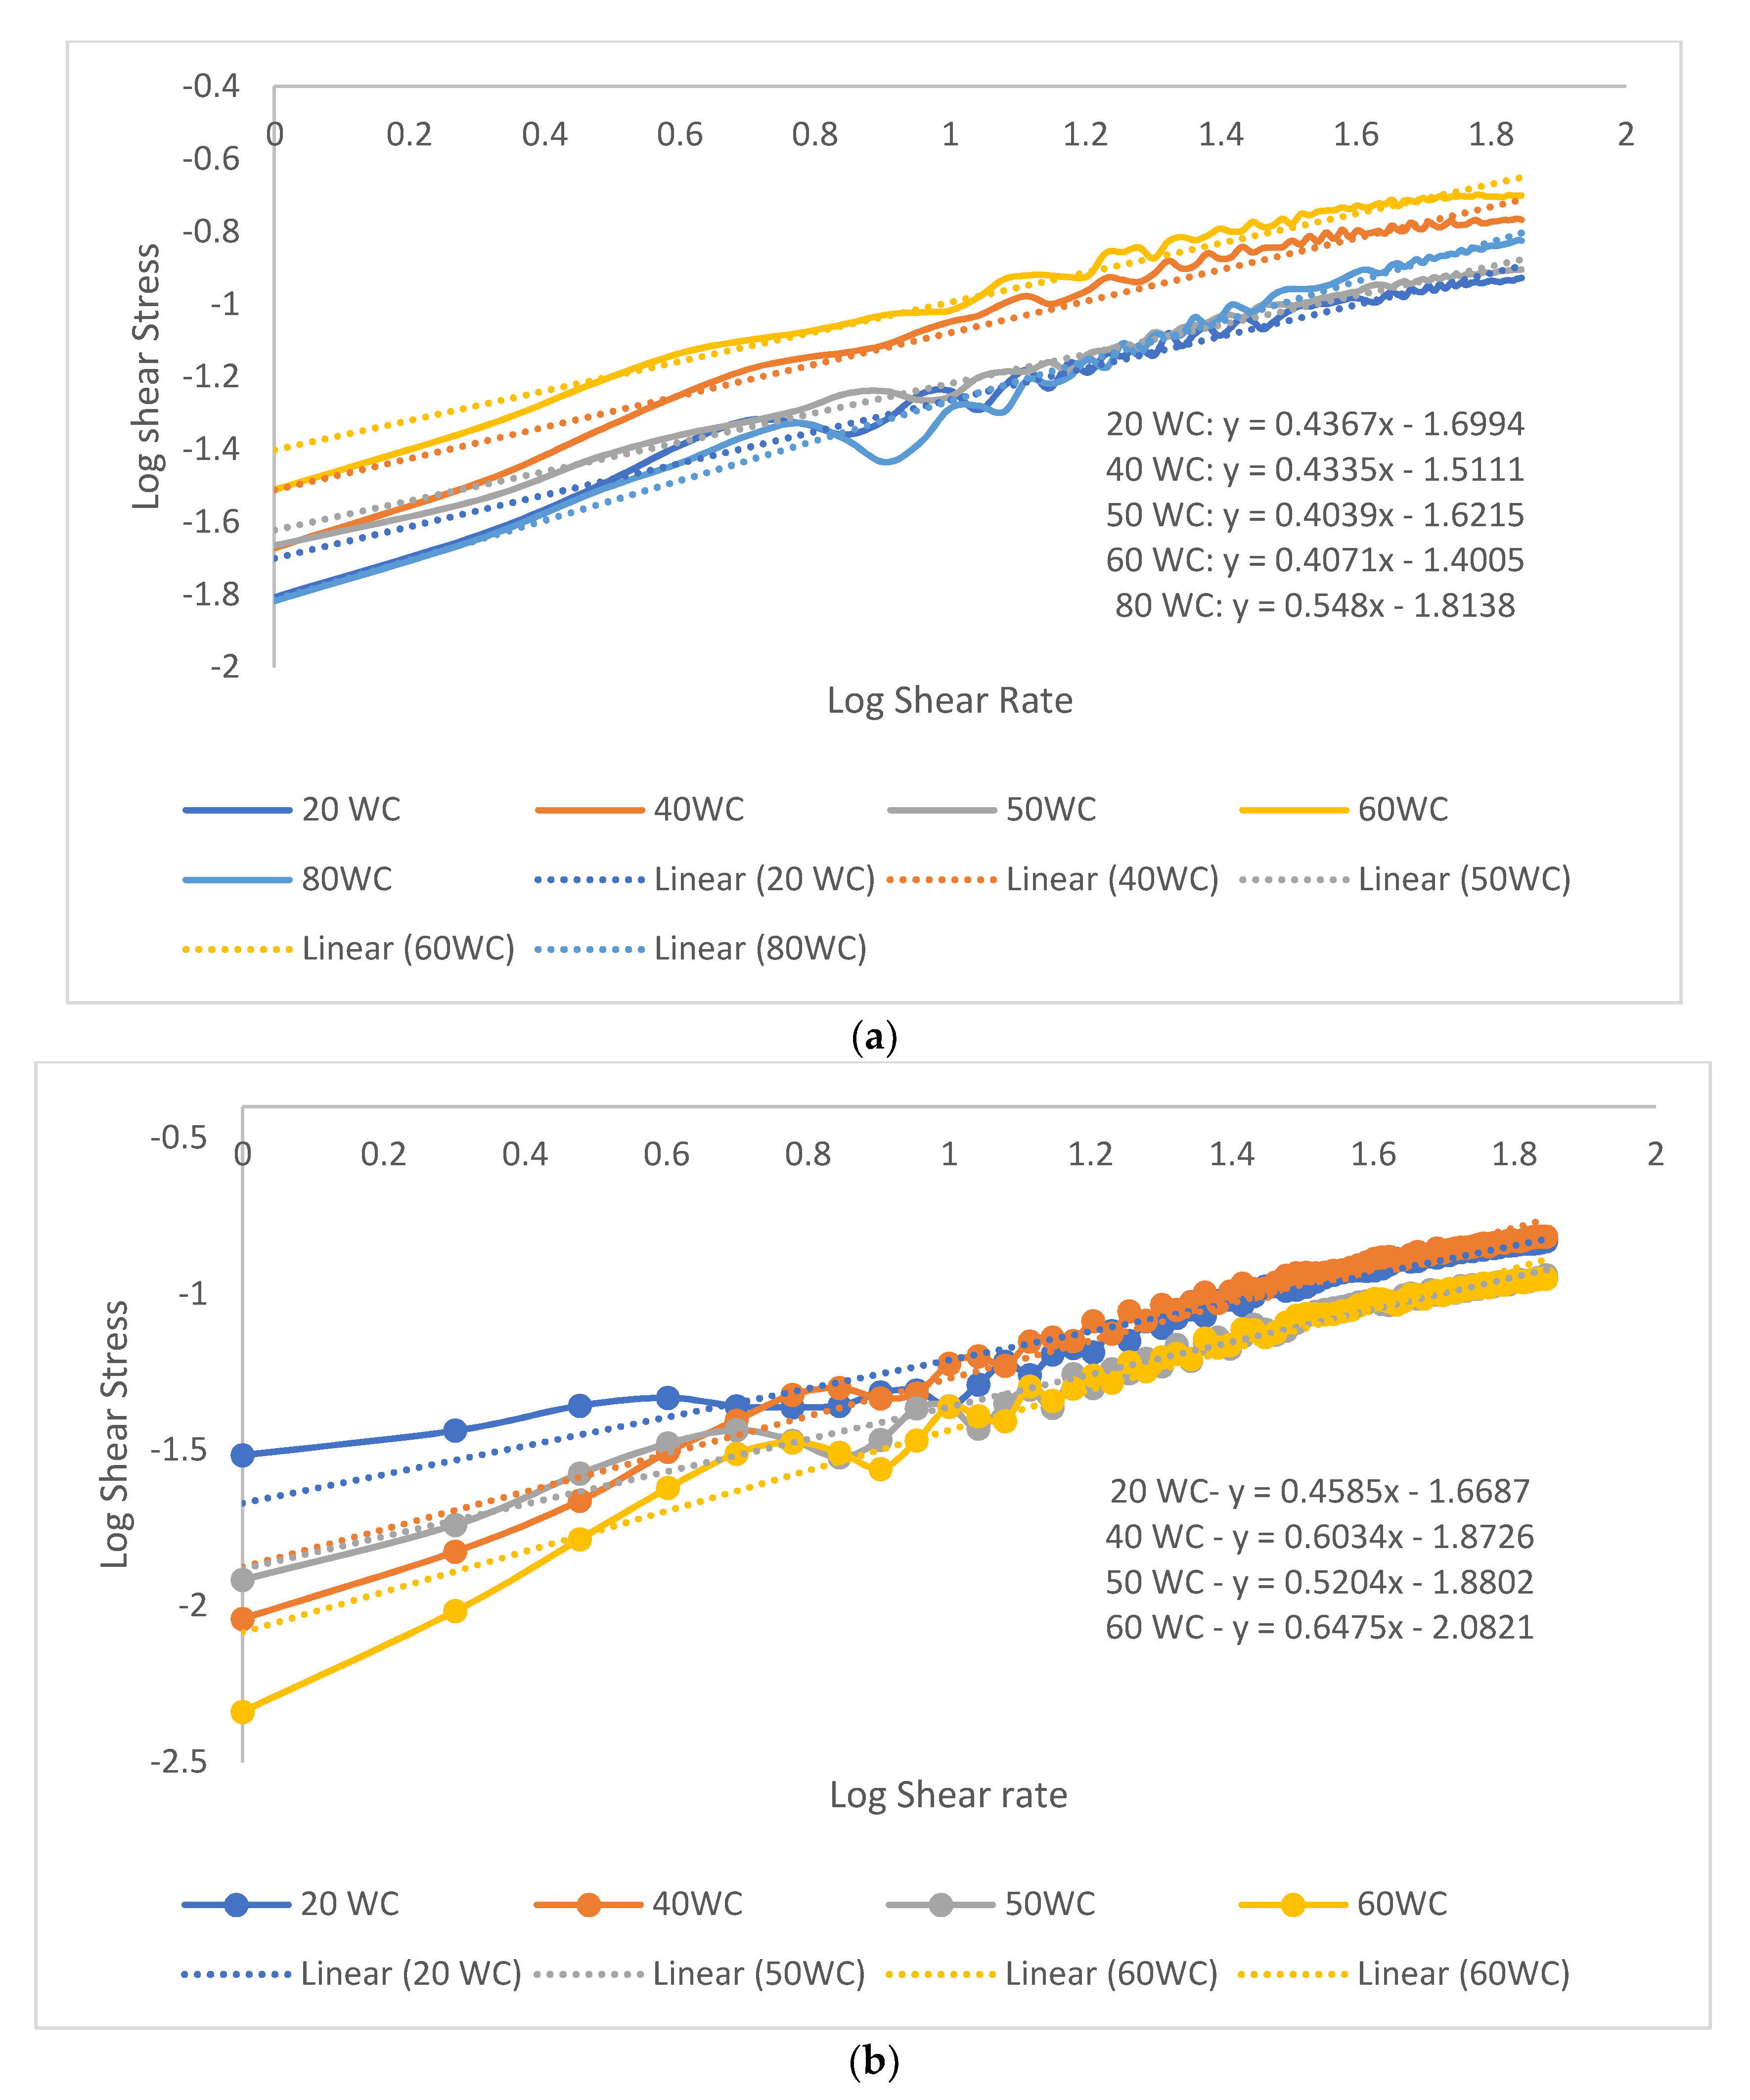
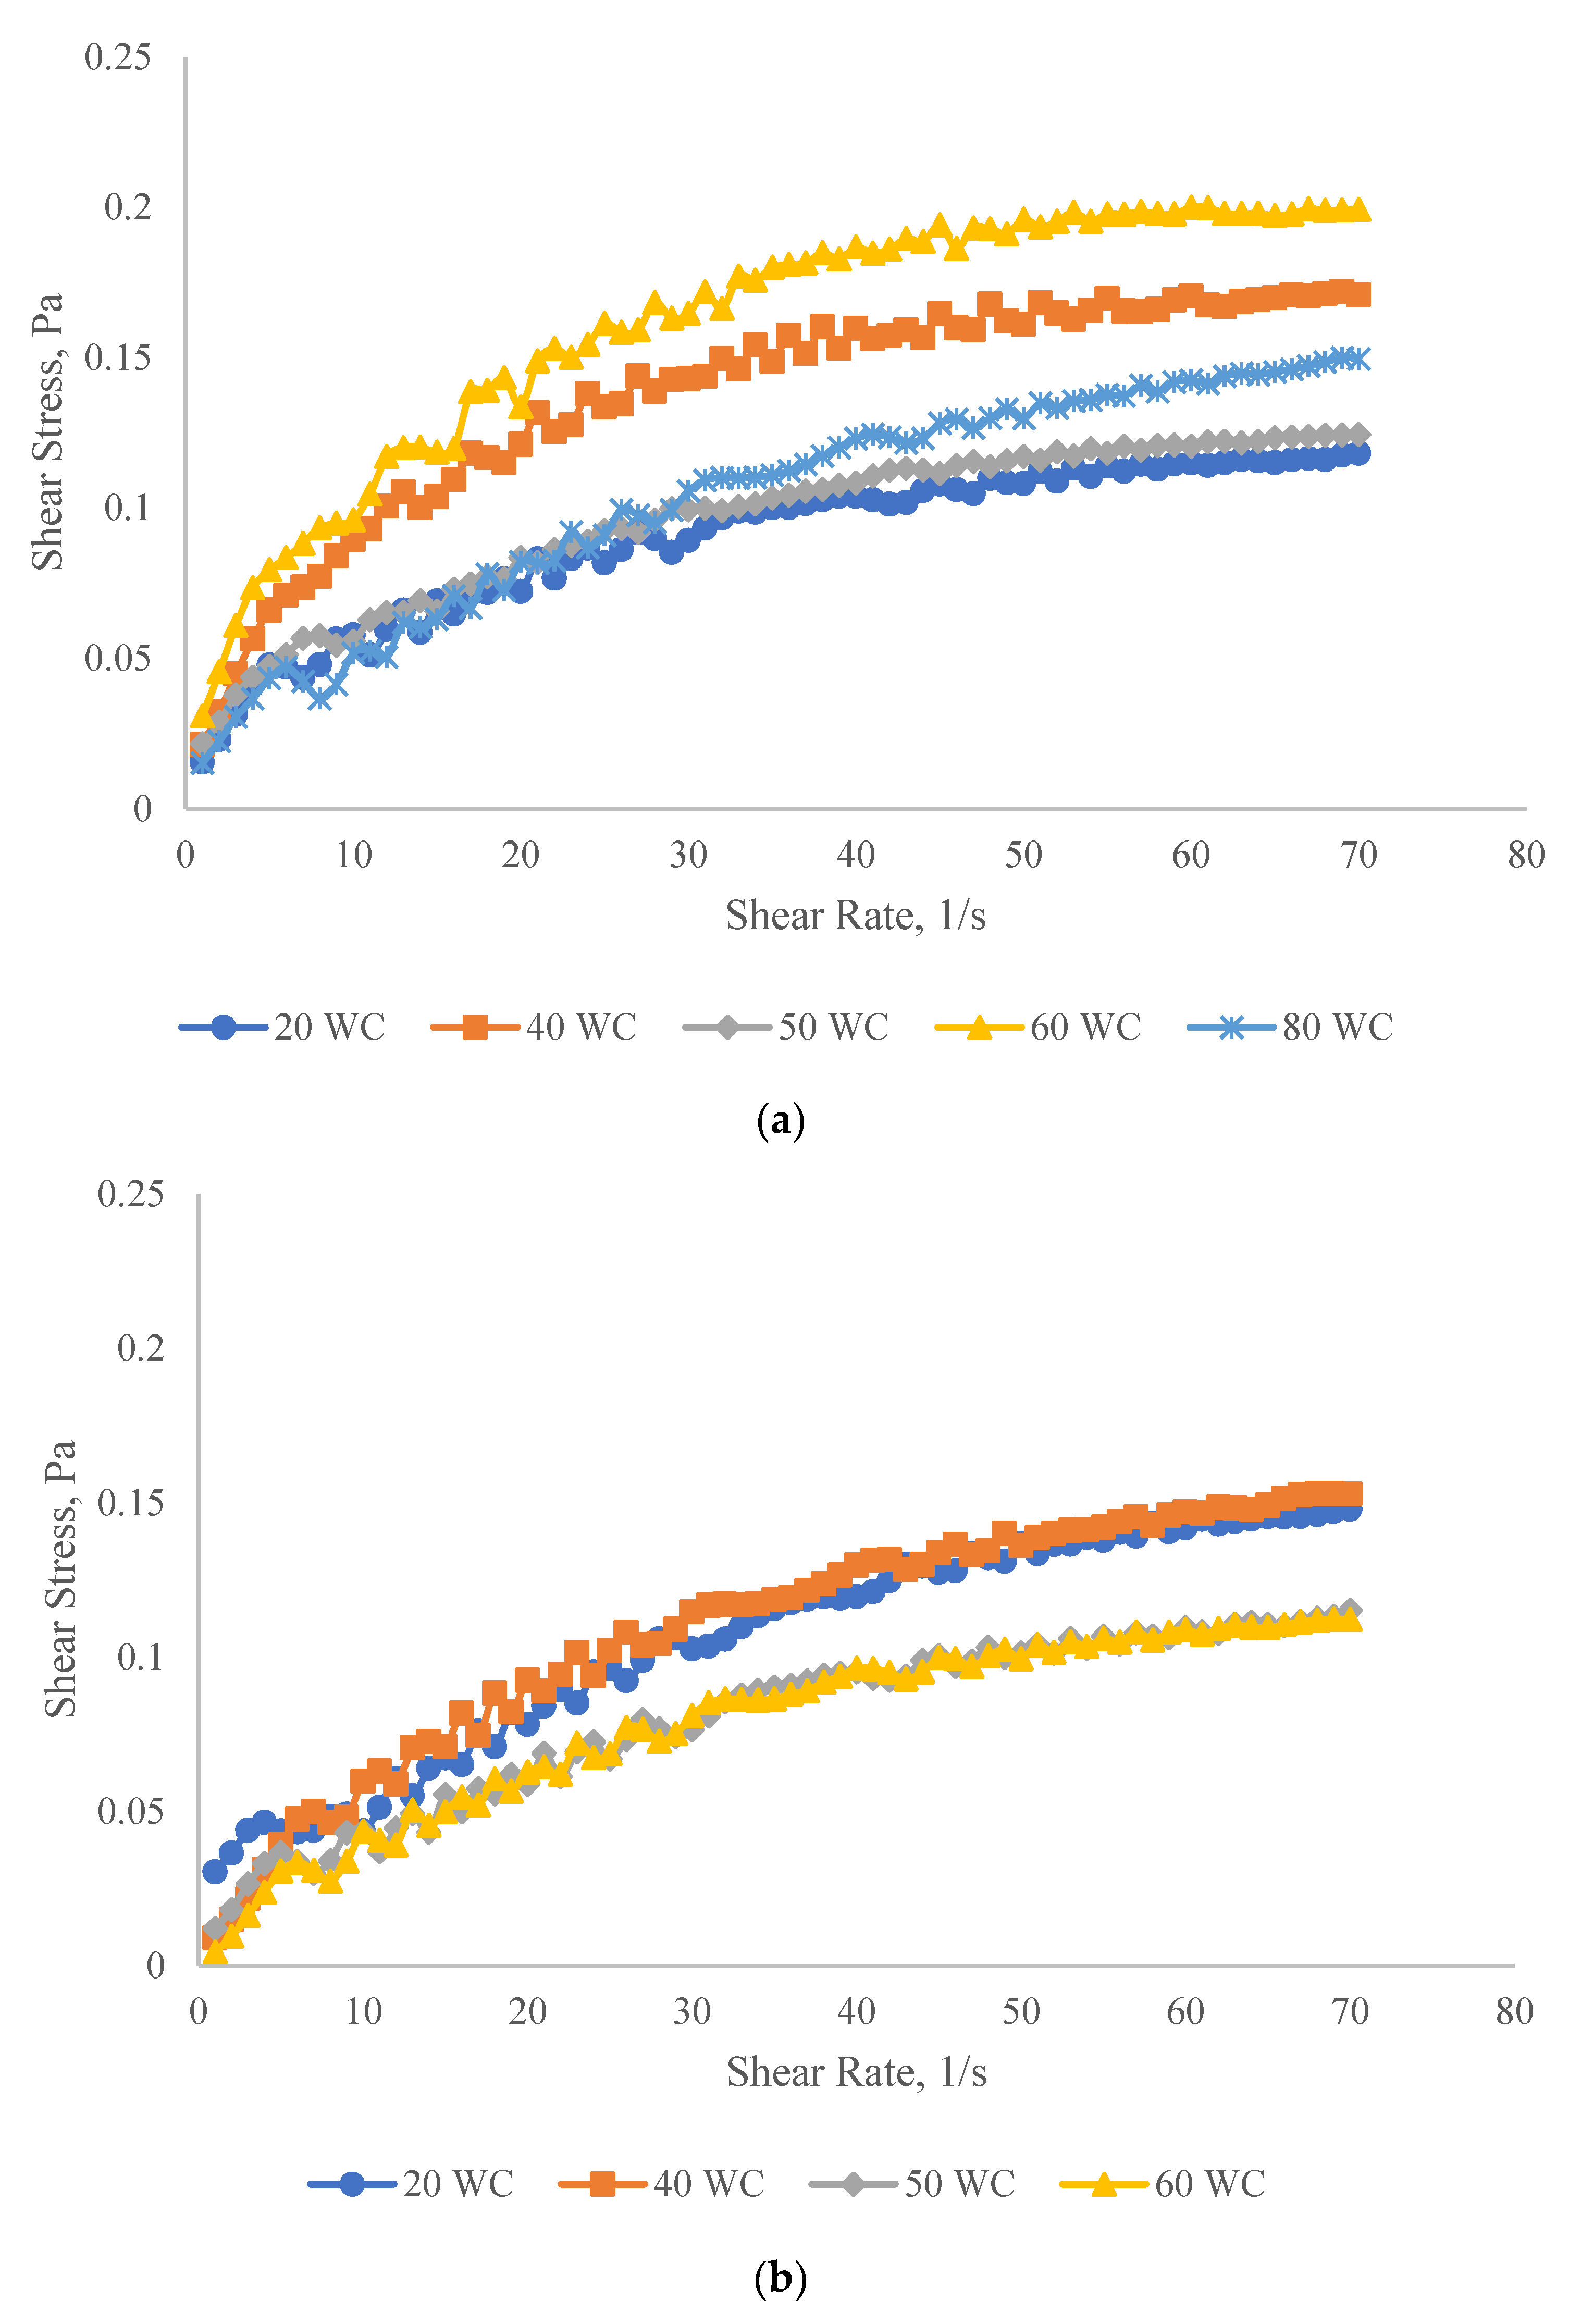
where τ is the shear stress (Pa), γ is shear rate, n is flow index, τ 0 is the yield stress, and K is the consistency index. Figure 5a,b indicate the plot of shear stress as a function of shear rate for 20, 40, 50, 60, 80% WC ASP and 20, 40, 50, 60% WC SP microemulsions, respectively. Based on Figure 6, it was observed that the microemulsions of ASP and SP in different water cuts (WC) show dual flow behaviour at different shear rates. The microemulsion demonstrated Newtonian fluid behaviour (at constant viscosity) at a low shear rate (below 5 s−1), and the transition of Newtonian to non-Newtonian fluid behaviour occurs at 5 s−1 shear rate. Beyond the 5 s−1 shear rate, the microemulsions are found to exhibit non-Newtonian behaviour (the apparent viscosity decreases as stress increases). The shear rate value for the transition from Newtonian to non-Newtonian behaviour is called critical shear rate. The non-Newtonian behaviour microemulsion can be characterized by the value of K, n, and τ 0 from the Herschel-Bulkeley Equation (2), where the microemulsion is classified as shear-thinning fluid with yield stress when τ 0 = 0, 0 < n < 1, and K > 0 [19]. Table 5 indicates the Herchel-Bulkeley parameters obtained on fitting the data shown in Figure A1a,b (Appendix A). The parameters obtained show that the microemulsions behave as a shear-thinning fluid. For ASP, 80% of WC microemulsions display the lowest yield stress value, while it is 40% WC for SP microemulsions. Yield stress is defined as the minimum shear stress required to initiate flow of the fluid [20]. The microemulsions start to behave as a non-Newtonian fluid when the applied stress is higher than the yield stress. Separation tends to occur for a meagre yield stress value [19].

Effect of Oil Concentration on the Shear Properties of Micromemulsions

Figure 6 provides a graphical illustration of how the percentage of oil affects the functional relationship between viscosity and shear rate of the 50% WC ASP. In the microemulsion tendency test, only 50% of WC ASP produced microemulsion at five different crude oil ratios, showing shear-thinning behaviour. The trends indicate that the higher the concentration of crude oil in the system, the higher the viscosity of the microemulsion produced. The shear-thinning system in microemulsions is due to the presence of weak attractive forces between the microemulsion droplets that cause the formation of a weak elastic gel-like network [19]. When shear stress is applied to the system, it causes the microemulsions droplets to move further away from each other. If the magnitude of shear stress applied is smaller compared to attractive forces, it creates an elastic physical response of microemulsions and the shear forces are stored as an extension bond between the dispersed droplets. The network that arises from these weak interaction forces hinderes the flow ability of the microemulsions. Thus, the application of shear forces overcomes the flow resistance of microemulsions.

3.2.2. Viscoelasticity Evaluation

The viscoelastic (viscous and elastic) properties of microemulsion were studied by measuring the loss modulus, G’ and storage modulus, G”, where G’ represents the elastic properties and G” represent the viscous properties. If the value of G’ is higher than that of G”, the material is regarded as elastic; if the value of G” is higher than that of G’, the material is regarded as viscous [21]. Microemulsion will be highly stable if G’ value is higher than that of G” since, in EOR, the microemulsion displays gel-like behavior [19]. However, in flooding applications, the viscoelastic injected micellar fluid solution is efficient in displacing different types of residual fluid by improving sweep efficiency.
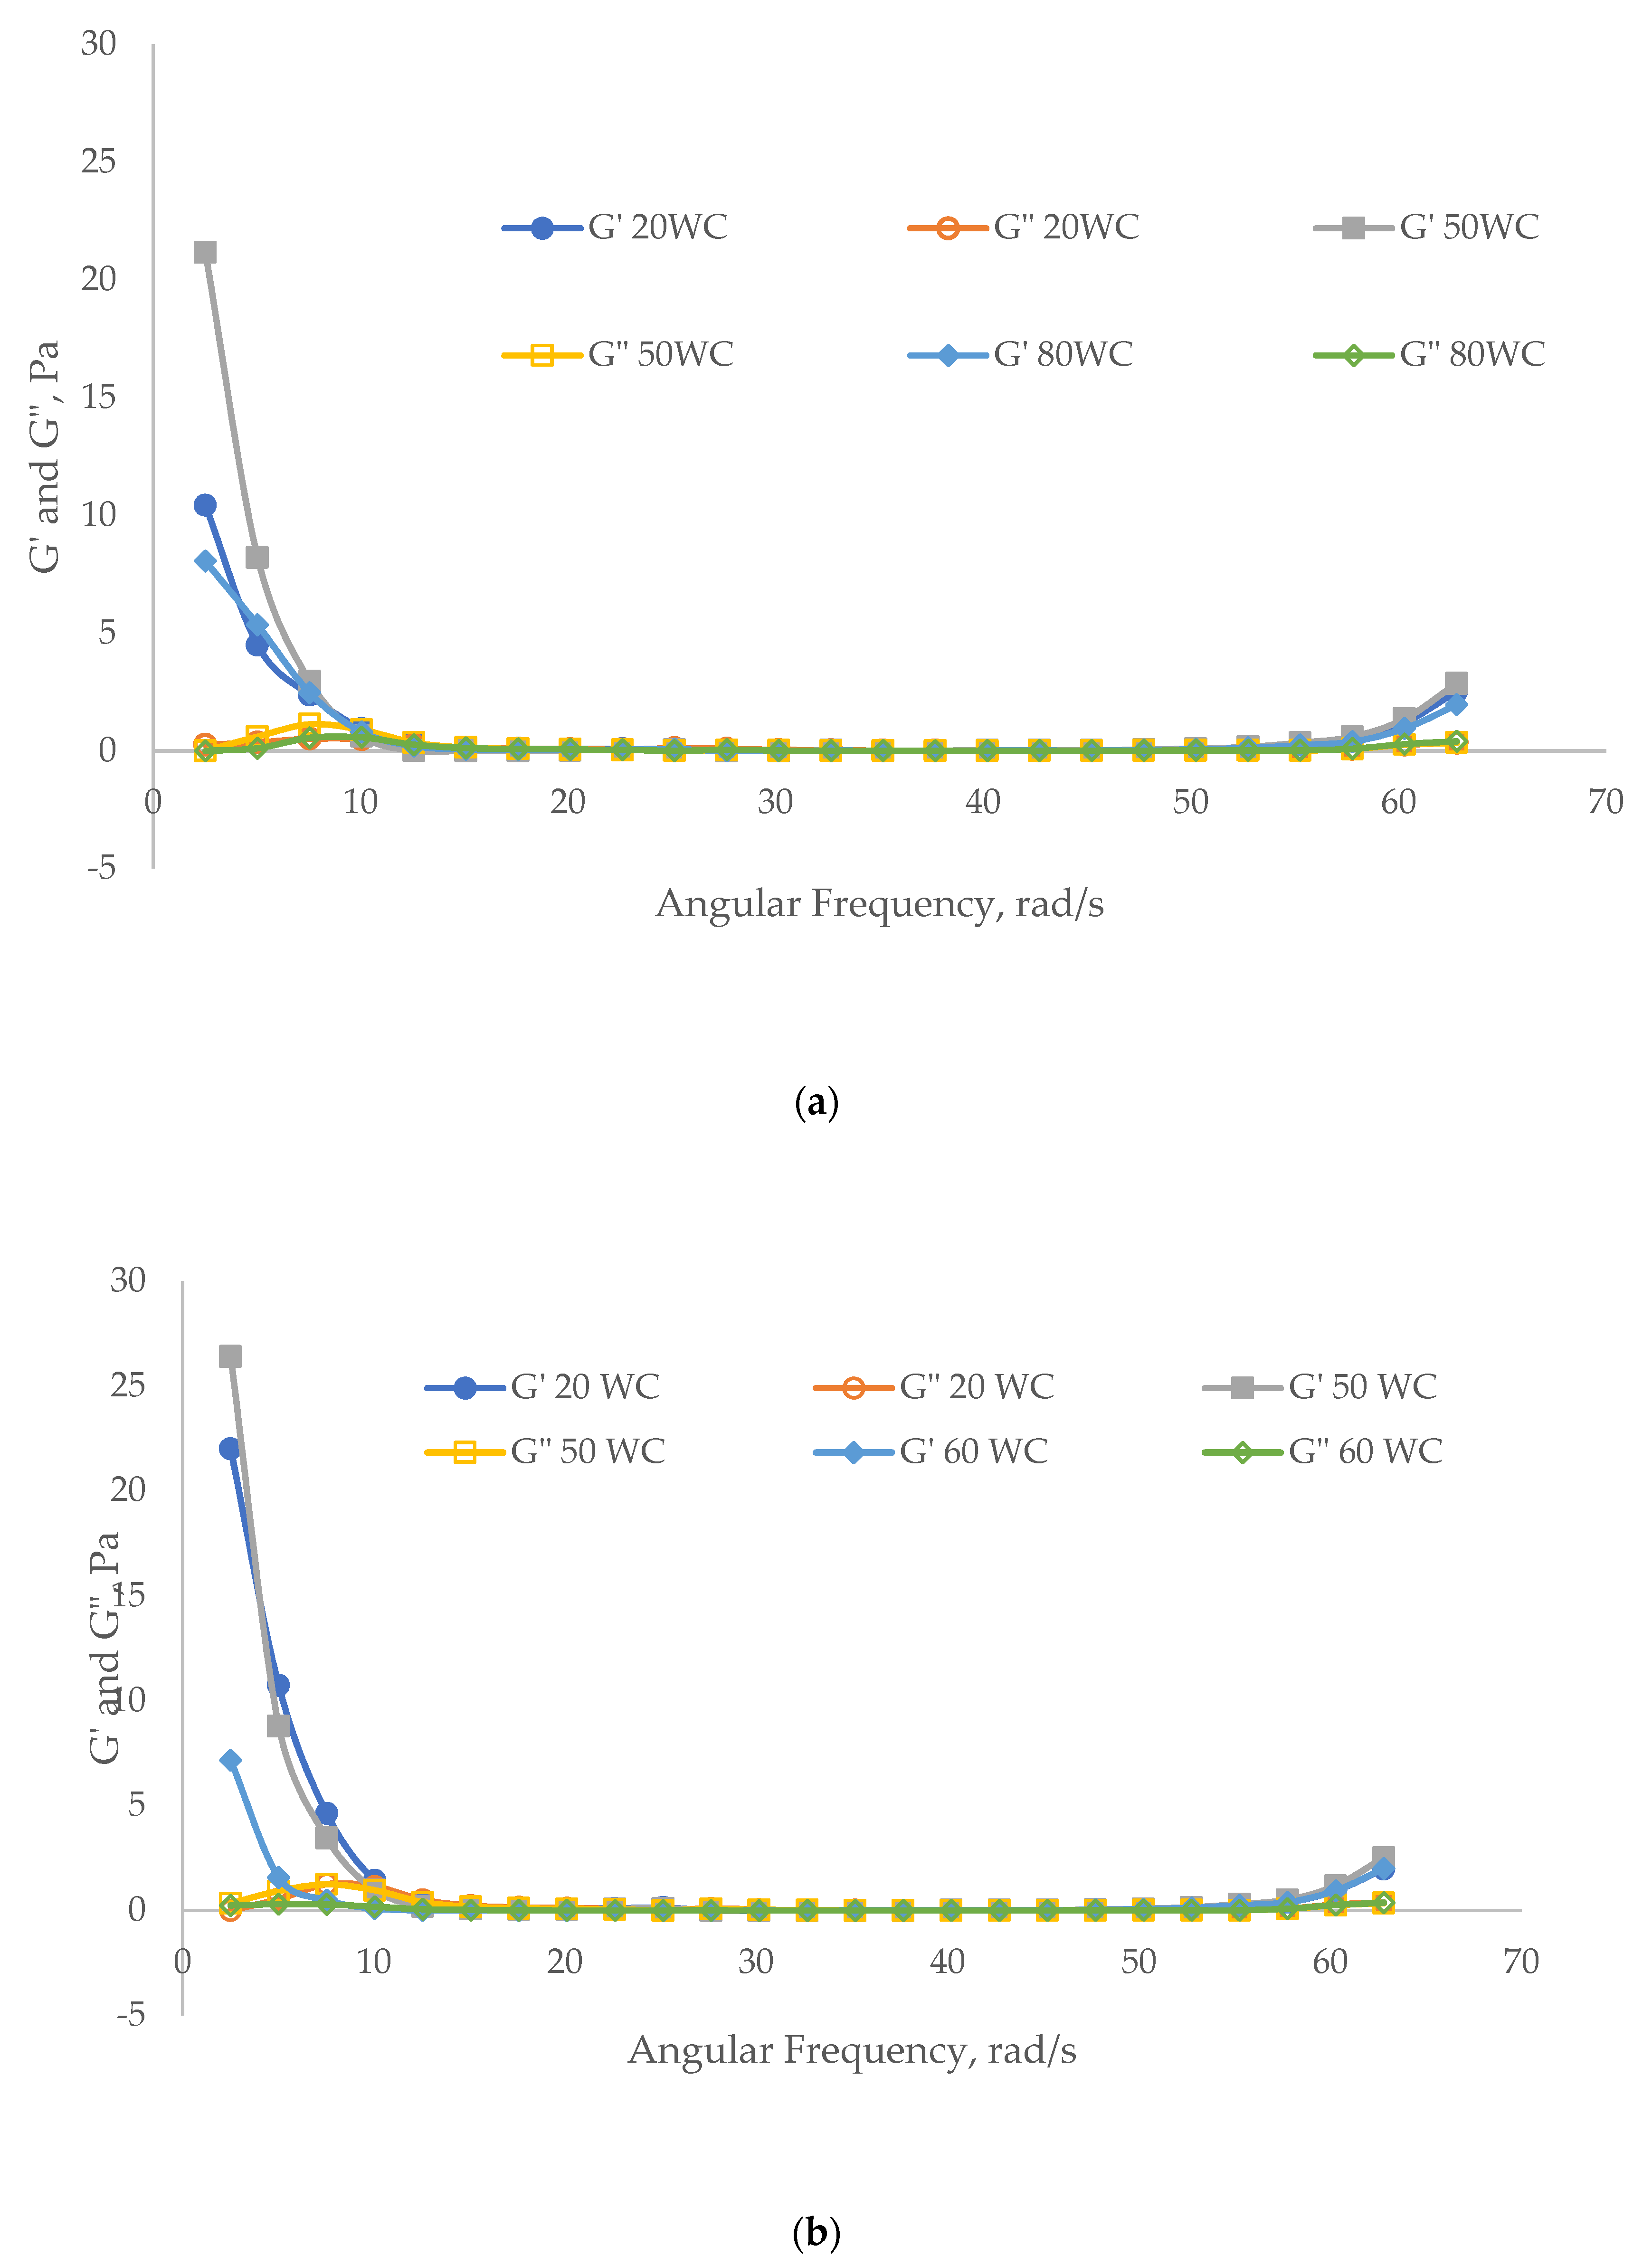
Figure 7a,b shows the storage modulus, G’, and loss modulus, G”, as a function of angular frequency for 20, 50, and 80% WC ASP and 20, 50, and 60% WC SP microemulsions at 60 °C (PETRONAS North Sabah field temperature). All of the microemulsions produced for ASP and SP show that the G’ and G” values depend on frequency. The microemulsions show elastic-like fluid behaviour at low frequency (below 10 rad s−1), where the value of G’ > G”. At the intersection point (angular frequency equal to 10 rad s−1) of G’ and G”, the elastic modulus, G’, is equal to viscous modulus G,” and it represents a relaxation frequency. Thus, the smaller the relaxation frequency, the higher the particle suspension capability. The crossing point of G’ and G” is called specified frequency (SF). At a frequency lower than SF, the elastic-like emulsions represent a stronger network of fluid samples [20]. As the angular frequency increases, the viscoelastic behaviour of all microemulsions is observed at frequencies between 10 to 60 rad s−1 due to the network created between the dispersed microemulsion droplets [19].
Table 6 shows the rheological parameters of G’ and G’/G” for ASP and SP at 20, 40, 50, 60, and 80% WC, and 20, 40, 50, and 60% WC, respectively. The ratio of G’ and G” was measured to investigate the properties of the microemulsion. A ratio value lower than 3 indicates micellar fluid properties, whereas gel-like properties are found in ratio value greater than 3 [20]. For ASP, 40 and 80% WC microemulsions show the true nature of micellar fluid with G’/G” lower than 3, while the other ASP microemulsions show gel-like fluid with a high value of G’/G”. On the other hand, the gel-like fluid showed G/G” ratio that is greater than 3, except for 60% WC microemulsions. For maximum gel strength, G’ measurement at 20% WC microemulsion showed the highest value at 29.58 Pa for ASP and 50% WC microemulsions for SP at a maximum gel strength value of 26.41 Pa. An increase in G’ value was due to the inter-particle interactions that form bonds of ASP and SP in the oil-water interface [20].

3.2.3. Effect of Temperature on Viscosity

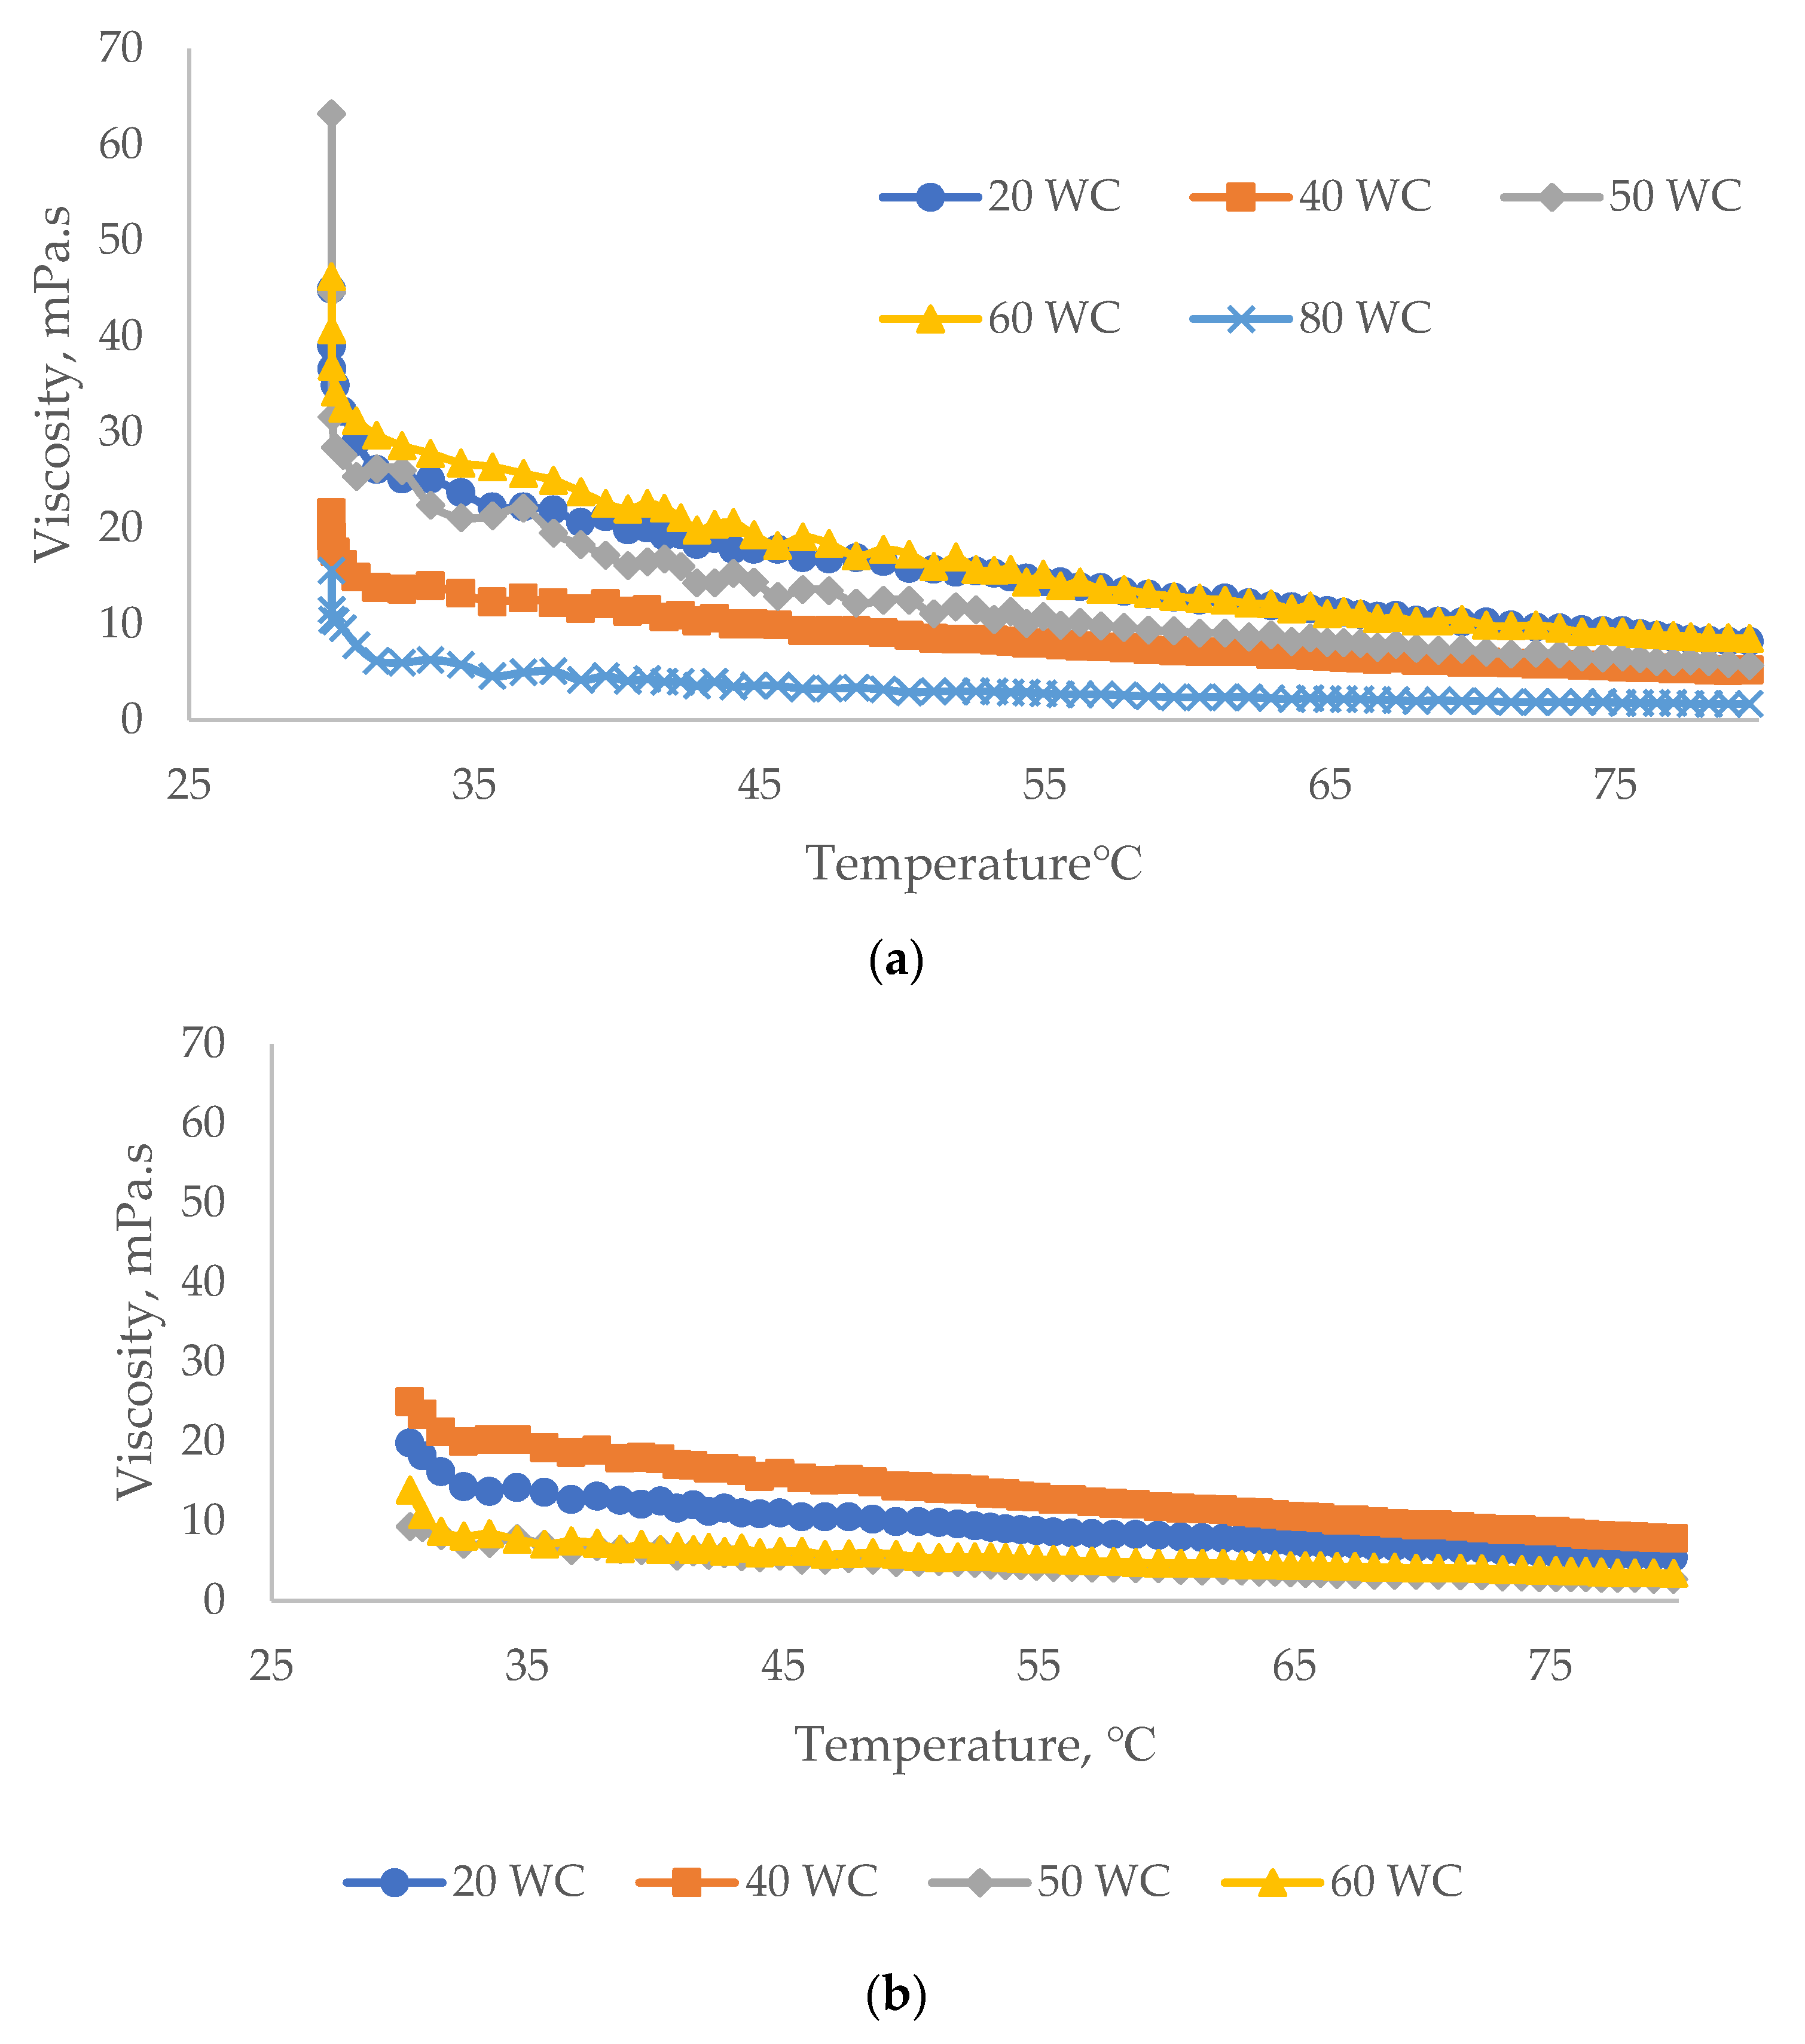
The effect of temperature on microemulsion viscosity was studied to investigate microemulsion stability at different temperatures. From Figure 8a,b, it can be observed that both ASP and SP microemulsions show temperature thinning properties, where viscosity decreases when the temperature increases. The heat applied on the microemulsion increased the Brownian motion and caused the aggregation of polymer to start moving apart, thus decreasing microemulsion viscosity [20]. The viscosity of micellar fluids decreases as the temperature increases due to the crude oil (i.e., alkanes) being solubilized in the core micelles; this leads to radial growth in the cylindrical part of the wormlike micelles, resulting in a drop of end-cap energy and micelle length [22]. Based on the variation of water cut (WC) for ASP, 20% WC ASP showed the highest viscosity at 80 °C (8.2 mPa.s); 40% WC emulsion was seen for SP (7.8 mPa.s). These microemulsions indicate the highest thermal stability. The increase in thermal stability is due to the adsorption of polymer in chains onto the oil-water interface. Meanwhile, the increase in viscosity is attributed to the formation of a three-dimensional network as a result of “pseudocrosslinking”, which hinder microemulsion mobility [19]. On the other hand, microemulsion with low thermal stability (80% WC for ASP and 50% WC for SP) is caused by the flocculation of microemulsion droplets that decrease the viscosity as the temperature increases [18].

4. Conclusions

The microemulsion tendency of five water cuts of ASP and SP in five different ratios of crude oil was successfully tested via bottle testing. The result shows that the addition of ASP and SP to the mixture of crude oil and brine solution leads to the formation of a microemulsion. For ASP, 50% WC yields the best micro emulsifier with average microemulsion from 0 to 29%, respectively, whereas, it was 40% WC for SP from 0 to 36%, respectively. In the rheology test involving fluid properties, shear, viscoelasticity, and viscosity analysis were studied to investigate the micellar fluid behaviour of microemulsions in the EOR application. All the microemulsions produced showed shear-thinning fluid behaviour, and viscosity decreased as the shear rate increased. Meanwhile, the higher the concentration of ASP and SP, the more shear thinning (effect) is exhibited in the micellar fluid; this increases the flow of the microemulsion as the shear rate rises. The viscoelasticity evaluation shows that elastic microemulsions were produced at a low shear rate. The viscoelastic properties of microemulsions are shown at frequencies between 10 to 60 rad s−1. The viscosity of the microemulsions produced also decreases when the temperature increases, as the mobility of the microemulsions increases with temperature. The formation of microemulsions via the bottle test and the results from the rheological analysis prove that the addition of alkaline, surfactant, and polymer leads to better sweep efficiency and mobility control of microemulsions in chemical EOR flooding. Thus, the rheology analysis of ASP and SP microemulsions was successfully executed and further analysis on the performance of the ASP and SP formulation will help prove the efficiency of these chemicals in flooding applications.

Author Contributions

Conceptualization, M.S.N. and N.B.; methodology, M.S.N. and N.B.; validation, K.J., A.R. and N.B.; formal analysis, M.S.N.; investigation, M.S.N. and N.B.; resources, K.J., A.R. and N.B.; writing—original draft preparation, M.S.N., K.J. and N.B.; writing—review and editing, K.J., A.R. and N.B.; visualization, M.S.N. and N.B.; supervision, K.J., A.R. and N.B.; funding acquisition, K.J. and N.B. All authors have read and agreed to the published version of the manuscript.

Funding

The GR&T UTP Collaboration (Cost-center 015MD0-027).

Acknowledgments

The authors would like to thank Universiti Teknologi PETRONAS and PETRONAS Research Sdn Bhd (PRSB).

Conflicts of Interest

The authors declare no conflict of interest.

Appendix A

Figure A1. Log/log plot of shear stress as a function of shear rate according to Equation (4) for (a) 20, 40, 50, 60, and 80% WC ASP and (b) 20, 40, 50, and 60% WC SP at 60% oil and 60 °C.
Processes 08 00762 g0a1

References

  1. Duy, N.; Nicholas, S. Stable emulsion and demulsification in chemical EOR flooding: Challenges and best practices. In Proceedings of the EOR Conference at Oil and Gas West Asia, Muscat, Oman, 16–18 April 2012. [Google Scholar]
  2. Mandal, A. Chemical flood enhanced oil recovery: A review. Int. J. Oil Gas Coal Tech. 2015, 9, 241–264. [Google Scholar] [CrossRef]
  3. Li, N.; Zhang, G.; Ge, J.; Zhang, L.; Liu, X.; Wang, J. Ultra-low interfacial tension between heavy oil and betaine-type amphoteric surfactants. J. Dispers. Sci. Tech. 2012, 33, 258–264. [Google Scholar] [CrossRef]
  4. Leitenmueller, V.; Toumi, O.; Hofstaetter, H.; Leoben, M. Microemulsion formation & its effect on rheology using carbonate-based alkalis for AP or ASP floods in the matzen field. In Proceedings of the EOR Conference at Oil and Gas West Asia, Muscat, Oman, 26–28 March 2018. [Google Scholar]
  5. Amirbayov, T. Simulation Study of the Polymer Flooding Applied to the Norne Field E-Segment. Master’s Thesis, Norwegian University of Science and Technology, Trondheim, Norway, 2014; p. 83. [Google Scholar]
  6. Chelaru, C.; Diaconu, I.; Simionescu, C.I. Polyacrylamide obtained by plasma-induced polymerization for a possible application in enhanced oil recovery. Polym. Bull. 1998, 40, 757–764. [Google Scholar] [CrossRef]
  7. Kumar, S.; Mandal, A. Rheological properties and performance evaluation of synthesized anionic polymeric surfactant for its application in enhanced oil recovery. Polymer 2017, 120, 30–42. [Google Scholar] [CrossRef]
  8. Lee, S.; Kim, D.H.; Huh, C.; Pope, G.A. Development of a comprehensive rheological property database for EOR polymers. In Proceedings of the SPE Annual Technical Conference and Exhibition, New Orleans, LA, USA, 4–7 October 2009. [Google Scholar]
  9. Jang, H.Y.; Zhang, K.; Chon, B.H.; Choi, H.J. Enhanced oil recovery performance and viscosity characteristics of polysaccharide xanthan gum solution. J. Ind. Eng. Chem. 2015, 21, 741–745. [Google Scholar] [CrossRef]
  10. Xu, L.; Xu, G.; Liu, T.; Chen, Y.; Gong, H. The comparison of rheological properties of aqueous welan gum and xanthan gum solutions. Carbohydr. Polym. 2013, 92, 516–522. [Google Scholar] [CrossRef] [PubMed]
  11. Wei, B.; Romero-Zerón, L.; Rodrigue, D. Oil displacement mechanisms of viscoelastic polymers in enhanced oil recovery (EOR): A review. Pet. Explor. Prod. Technol. 2014, 4, 113–121. [Google Scholar] [CrossRef] [Green Version]
  12. Borhan, N.; Halim, N.H.; Ibrahim, J.M.B.M. An investigation of micro-emulsion and fine foams induced by EOR application in Malaysian fields. In Proceedings of the International Petroleum Technology Conference 2014, Kuala Lumpur, Malaysia, 10–12 December 2014. [Google Scholar]
  13. Yaakob, A.B.; Sulaimon, A.A. Performance assessment of plant extracts as green demulsifiers. J. Jpn. Pet. Inst. 2017, 60, 186–189. [Google Scholar] [CrossRef] [Green Version]
  14. Qiu, F. The potential applications in heavy oil eor with the nanoparticle and surfactant stabilized solvent-based emulsion. In Proceedings of the Canadian Unconventional Resources and International Petroleum Conference, Calgary, AL, Canada, 19–21 October 2010. [Google Scholar]
  15. Chagas, B.S.; Machado, D.L.P., Jr.; Haag, R.B.; De Souza, C.R.; Lucas, E.F. Evaluation of hydrophobically associated polyacrylamide-containing aqueous fluids and their potential use in petroleum recovery. J. Appl. Polym. Sci. 2004, 91, 3686–3692. [Google Scholar] [CrossRef]
  16. Oh, M.-H.; So, J.-H.; Yang, S.-M. Rheological evidence for the silica-mediated gelation of xanthan gum. J. Colloid Interface Sci. 1999, 216, 320–328. [Google Scholar] [CrossRef] [PubMed] [Green Version]
  17. Xie, D.; Hou, J.; Doda, A.; Trivedi, J. Application of organic alkali for heavy-oil enhanced oil recovery (EOR), in comparison with inorganic alkali. Energy Fuels 2016, 30, 4583–4595. [Google Scholar] [CrossRef]
  18. Tadros, T. Application of rheology for assessment and prediction of the long-term physical stability of emulsions. Adv. Colloid Interface Sci. 2004, 108, 227–258. [Google Scholar] [CrossRef] [PubMed]
  19. Torres, L.G.; Iturbe, R.; Snowden, M.J.; Chowdhry, B.Z.; Leharne, S.A. Preparation of o/w emulsions stabilized by solid particles and their characterization by oscillatory rheology. Colloids Surfaces A Physicochem. Eng. Asp. 2007, 302, 439–448. [Google Scholar] [CrossRef]
  20. Chauhan, G.; Ojha, K. Synthesis of a bio-polymer nanocomposite fracturing fluid for HTHP application. In Proceedings of the Abu Dhabi International Petroleum Exhibition and Conference, Abu Dhabi, UAE, 7–10 November 2016. [Google Scholar]
  21. Maurya, N.K.; Mandal, A. Investigation of synergistic effect of nanoparticle and surfactant in macro emulsion based EOR application in oil reservoirs. Chem. Eng. Res. Design 2018, 132, 370–384. [Google Scholar] [CrossRef]
  22. Chen, C.; Wang, S.; Grady, B.P.; Harwell, J.H.; Shiau, B.-J. Oil-induced viscoelasticity in micellar solutions of alkoxy sulfate. Langmuir 2019, 35, 12168–12179. [Google Scholar] [CrossRef] [PubMed]
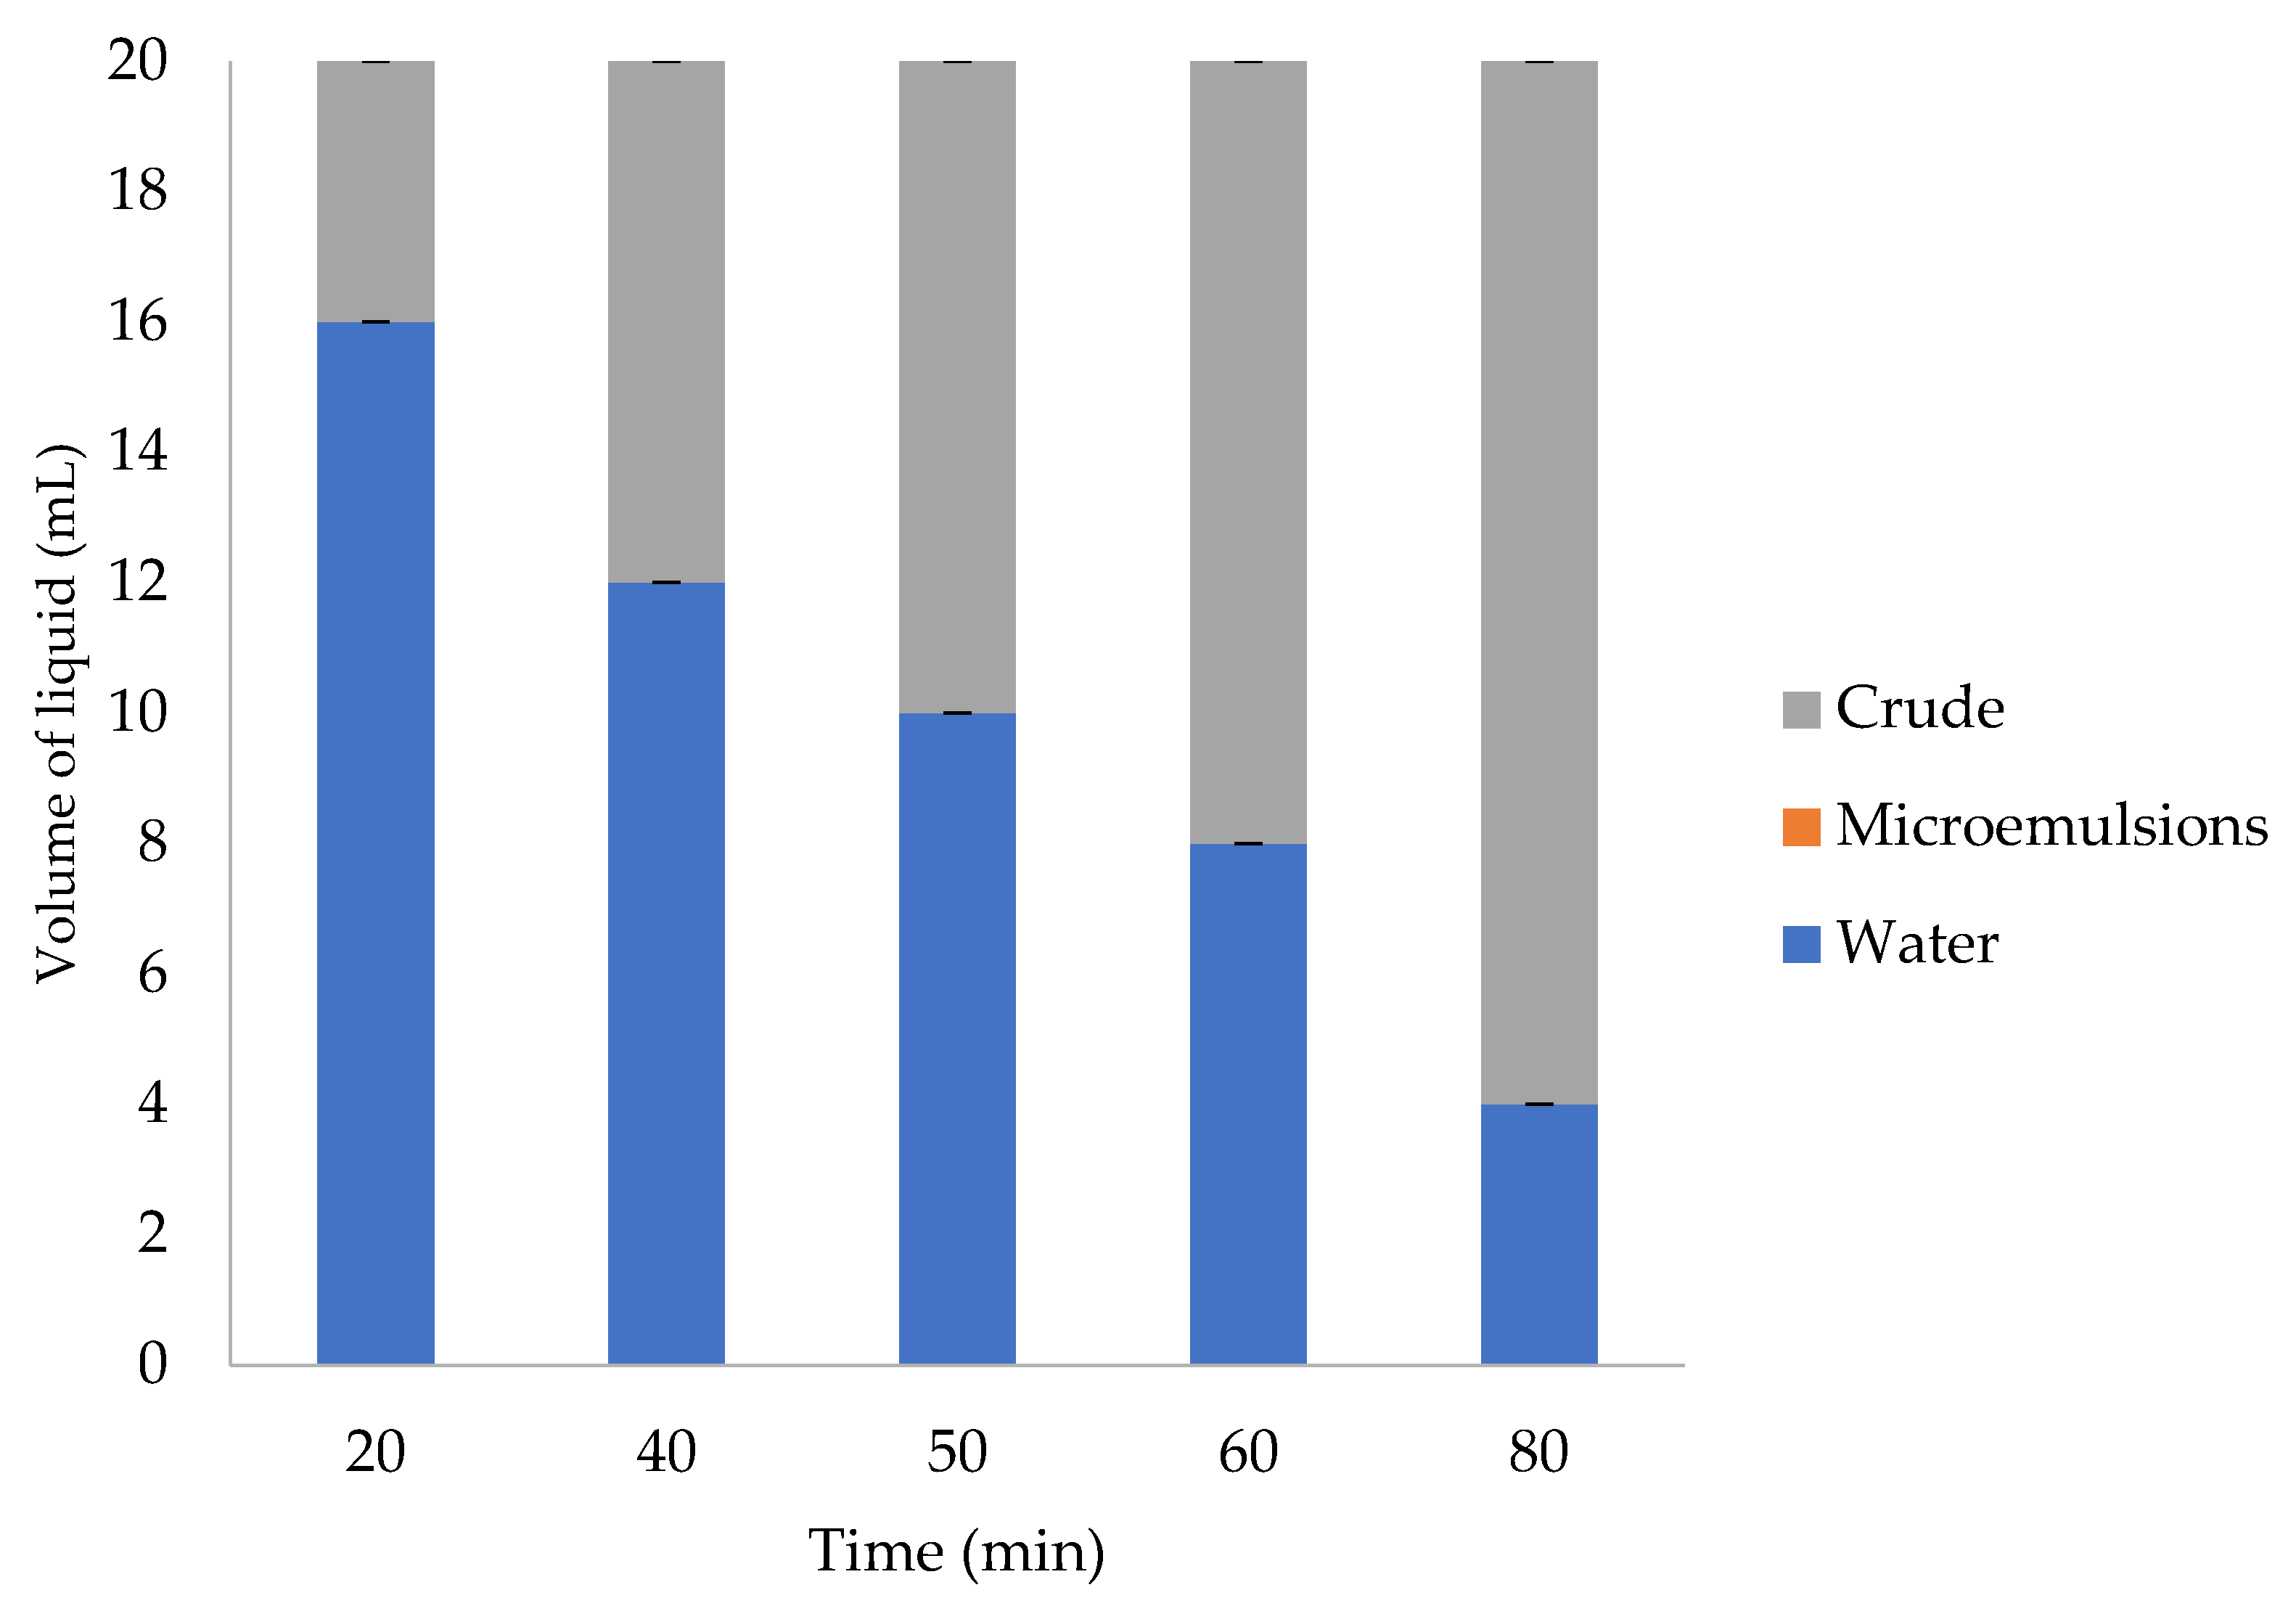
Figure 1. Emulsion tendency of 100% water cut (WC) after 30 min.
Processes 08 00762 g001
Figure 2. Microemulsion tendencies after 30 min of ASP addition in different WC percentages.
Processes 08 00762 g002
Figure 3. Microemulsion tendencies after 30 min of SP addition in different WC percentages.
Processes 08 00762 g003
Figure 4. Viscosity as a function of shear rate (a) ASP at 20, 40, 50, 60, and 80 WC; (b) SP at 20, 40, 50, and 60 WC at 60 °C and 60% oil concentration.
Processes 08 00762 g004
Figure 5. Shear Stress as a function of shear rate (a) ASP at 20, 40, 50, 60, and 80% WC; (b) SP at 20, 40, 50, and 60% WC at 60 °C and 60% oil ratio.
Processes 08 00762 g005
Figure 6. Viscosity as a function of shear rate of 50% WC ASP in 40, 50, 60, and 80% oil concentration at 60 °C temperature.
Processes 08 00762 g006
Figure 7. Storage (G’) and loss modulus (G”) as a function of angular frequency for (a) ASP at 20, 50, and 80% WC, and (b) SP at 20, 50, and 60% WC at 60 °C and 60% oil ratio.
Processes 08 00762 g007
Figure 8. Effect of temperature on the viscosity of microemulsions of (a) ASP at 20, 40, 50, 60, and 80% WC, and (b) SP at 20, 40, 50, and 60% WC at 60 °C and 60% oil ratio.
Processes 08 00762 g008
Table 1. Brine composition and properties.
Compounds (Brands)Weight, mg for One Litter Brine Solution
CaCl2.2H2O (R&M Chemicals)84.99
MgCl2.6H2O (R&M Chemicals)175.57
KCl (Merck)89.61
BaCl2.2H2O (Merck)3.20
SrCl2.6H2O (Merck)6.08
LiCl (Merck)9.77
NaHCO3 (Fischer Scientific UK) 6566.29
Na2SO4 (R&M Chemicals)7.39
NaCl (Bendosen)7488.91
Table 2. Crude oil composition and properties [12].
ParametersPropertiesUnit
API gravity (API)30.58-
Total acid number0.08mg KOH/g
Wax appearance temperature16.7°C
Saturates39.09wt%
Aromatic13.26wt%
Resins22.37wt%
Asphaltenes0.10wt%
Volatiles27.68wt%
API gravity (API)30.58
Table 3. Percentage of crude oil in different water cut ASP and SP.
Water Cut (ASP/SP: Brine)Percentage of Crude Oil (%)
Blank–100 (0:100)20, 40, 50, 60, 80
80% (20:80)20, 40, 50, 60, 80
60% (40:60)20, 40, 50, 60, 80
50% (50:50)20, 40, 50, 60, 80
40% (60:40)20, 40, 50, 60, 80
20% (80:20)20, 40, 50, 60, 80
Table 4. Power Law parameters obtained on fitting the data shown in Figure 4a,b to the Power law Equation, η = K γ n 1 (1).
KnR-squared, R2
ASP Water Cut (%)
80 WC0.500.880.96
60 WC0.790.710.97
50 WC0.640.760.67
40 WC0.850.680.90
20 WC1.400.480.14
SP Water Cut (%)
60 WC0.430.90.14
50 WC0.610.670.36
40 WC0.440.820.36
20 WC0.550.740.46
Table 5. Herchel-Bulkeley parameters obtained on fitting the data shown in Figure A1a,b (Appendix A).
KnYield Stress, PaR-squared, R2
ASP Water Cut (%)
80 WC0.020.550.040.98
60 WC0.090.410.090.97
50 WC0.020.400.050.99
40 WC0.030.430.070.95
20 WC0.020.440.050.97
SP Water Cut (%)
60 WC0.010.650.030.96
50 WC0.010.520.030.98
40 WC0.010.600.040.96
20 WC0.020.460.040.94
Table 6. Rheological parameters G’ and G’/G” for ASP and SP at 20, 40, 50, 60, and 80% WC, and 20, 40, 50, and 60% WC, respectively.
Maximum Gel Strength, G’, PaThe Ratio of G’ and G” (G’/G”) ± Standard Deviation, SD
ASP Water Cut (%)
80 WC29.5811.05 ± 42.00
60 WC2.324.91 ± 11.97
50 WC21.161.37 ± 1.55
40 WC14.616.20 ± 19.93
20 WC8.062.11 ± 3.26
SP Water Cut (%)
60 WC22.013.76 ± 9.01
50 WC16.243.77 ± 7.96
40 WC26.414.20 ± 13.35
20 WC7.171.13