Microemulsion Rheological Analysis of Alkaline, Surfactant, and Polymer in Oil-Water Interface


Abstract
1. Introduction
2. Materials and Methods
2.1. Materials
2.2. Emulsion Tendency Test
2.3. Emulsion Rheology Test
3. Results and Discussion
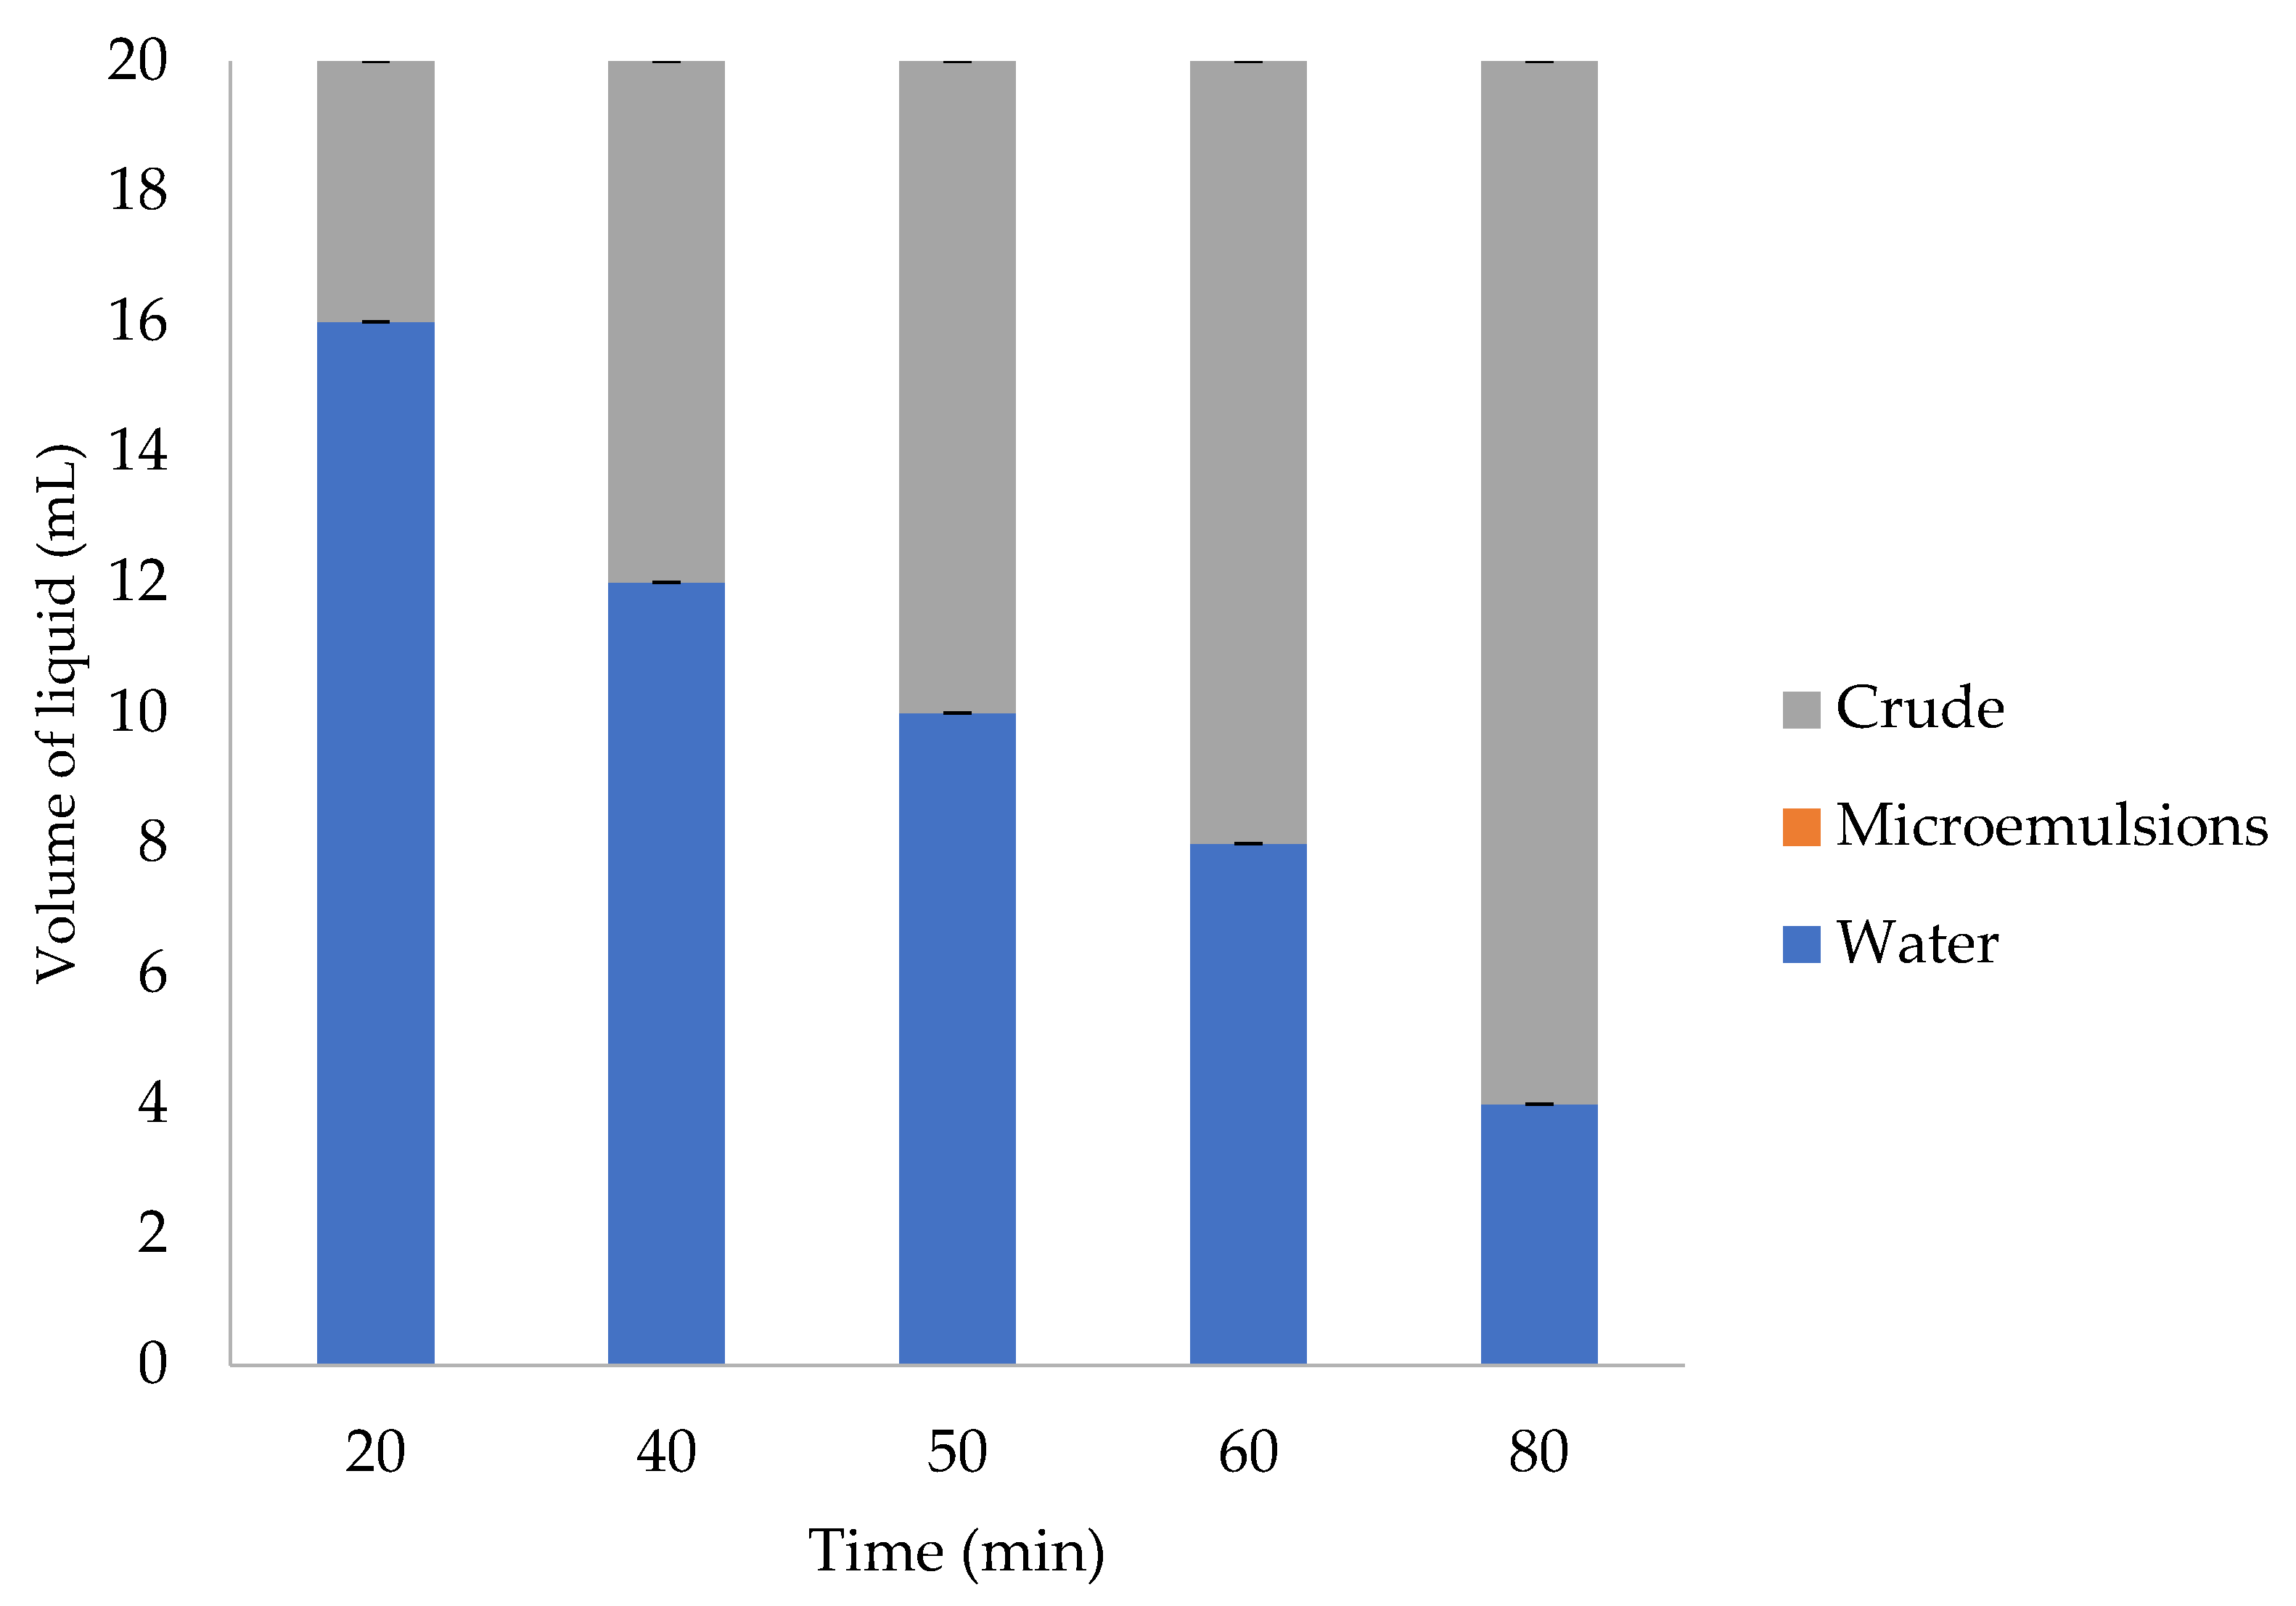
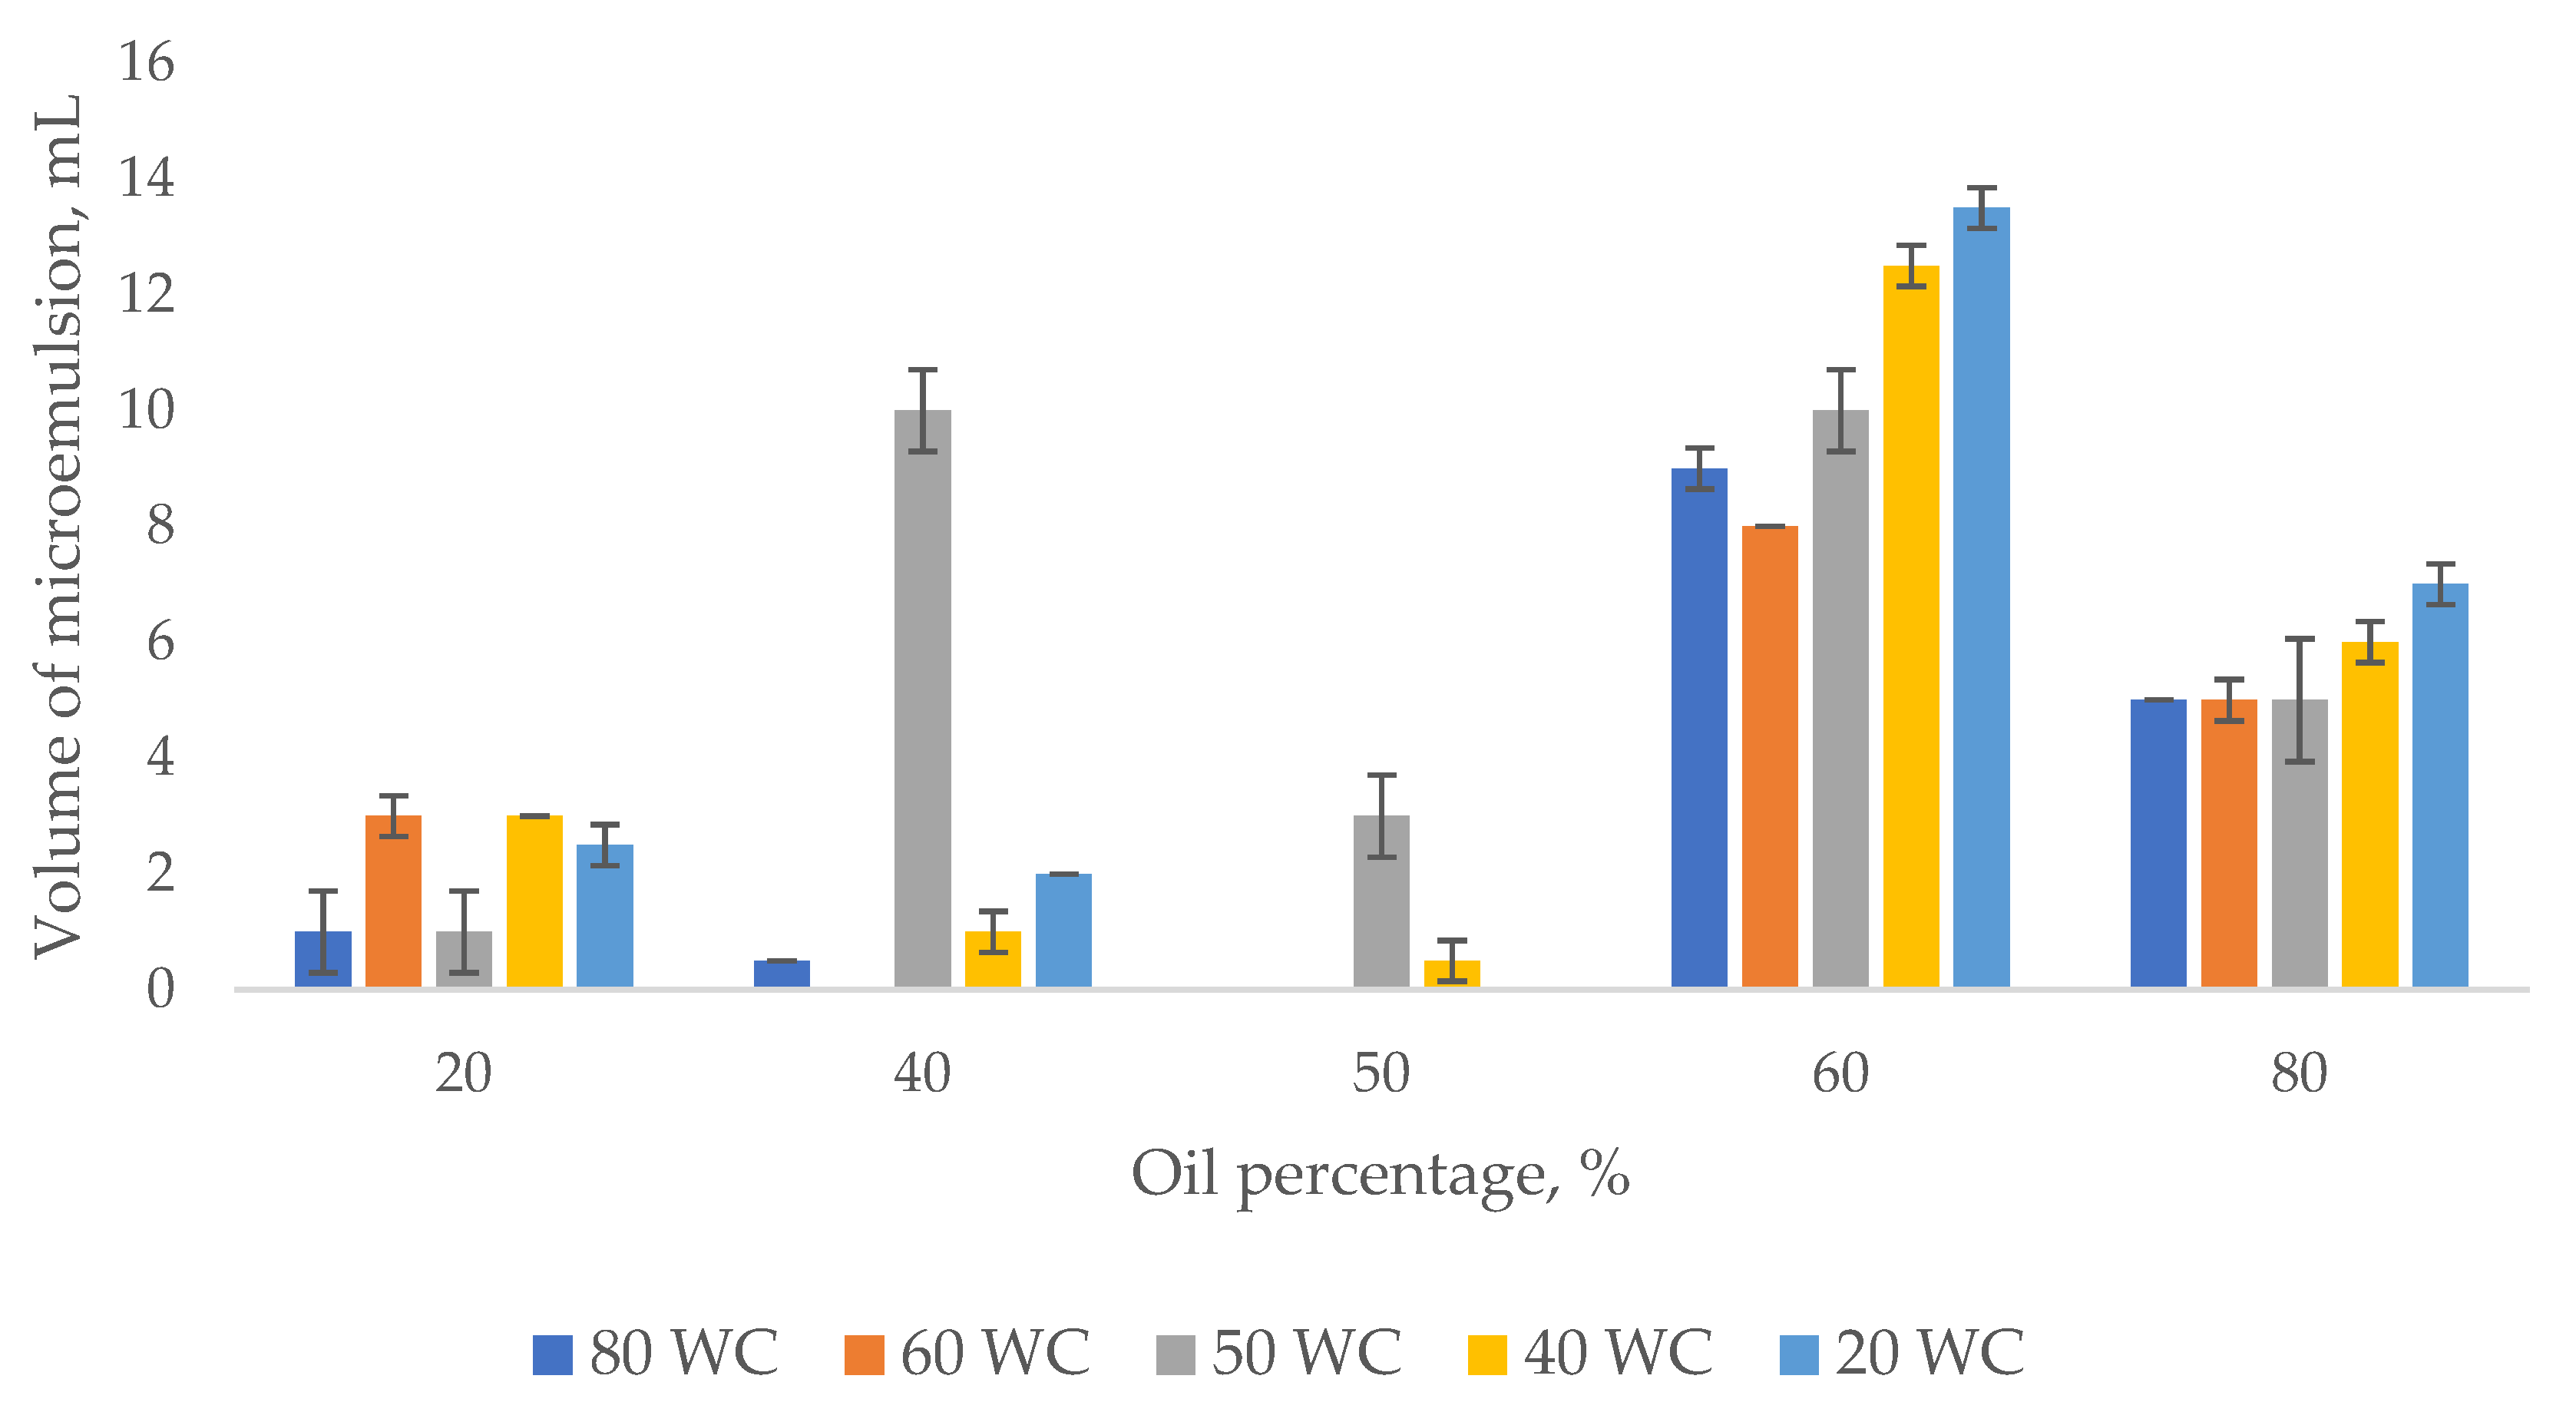
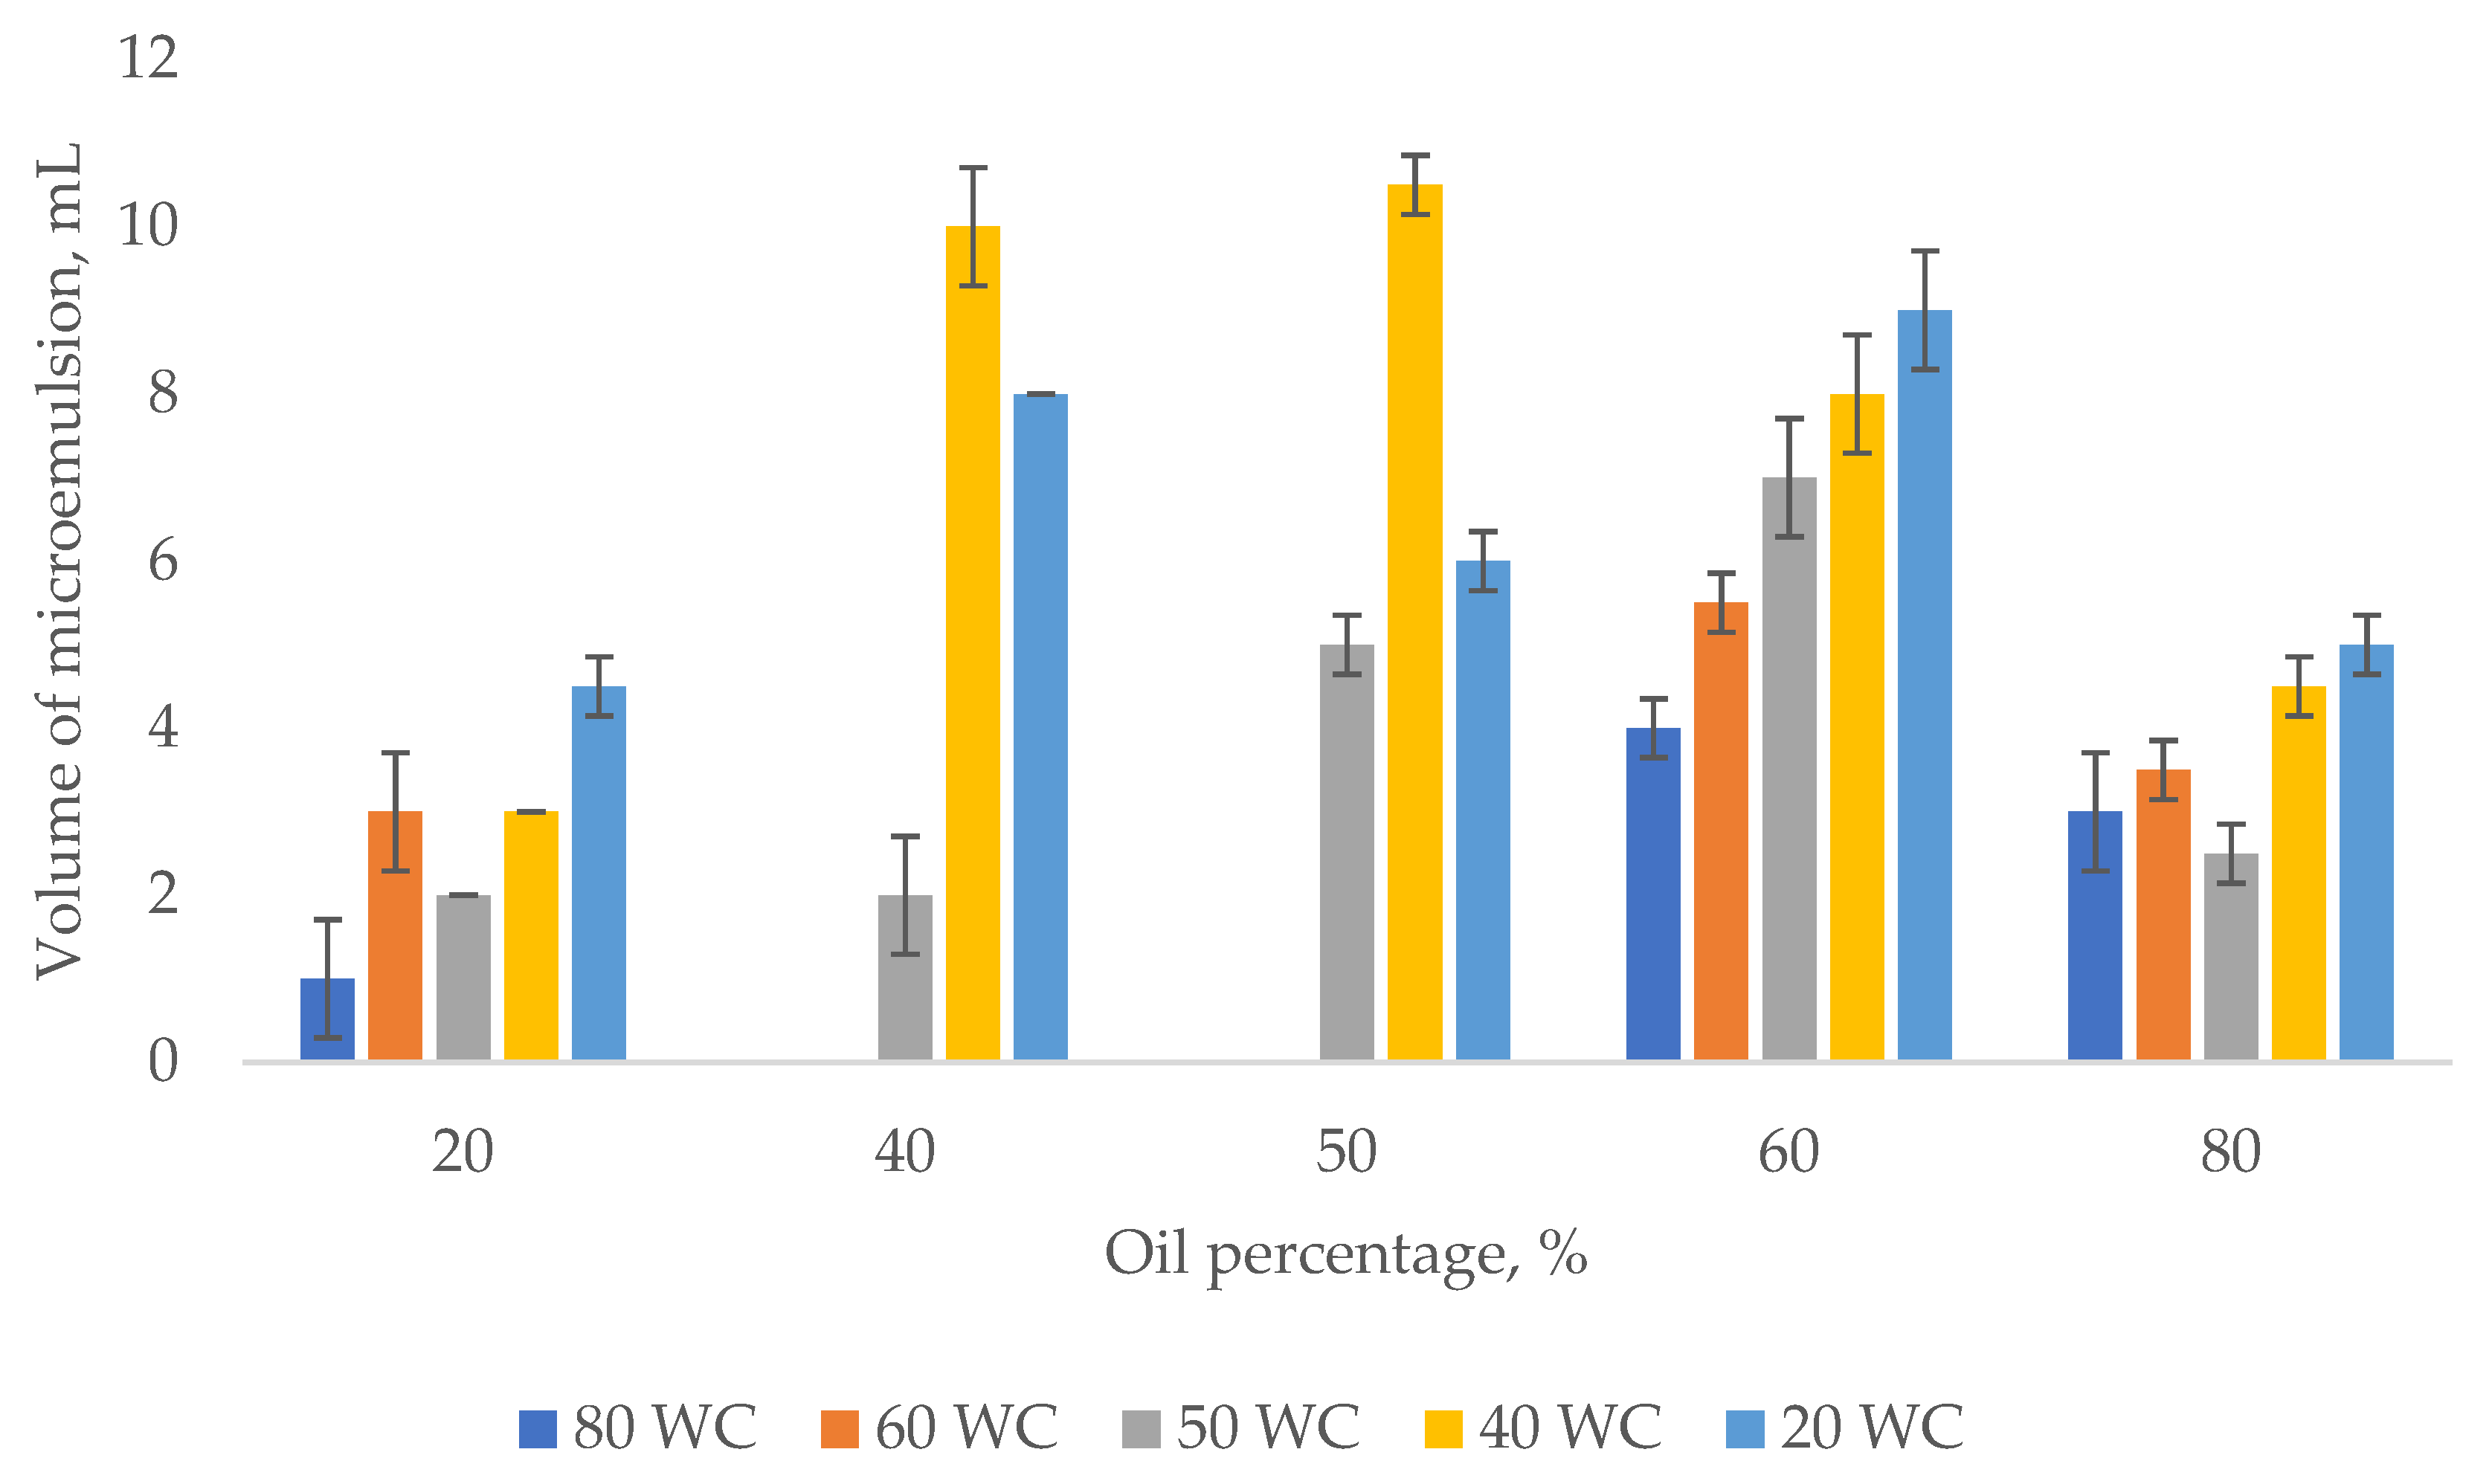
3.1. Emulsion Tendency Test
3.2. Emulsion Rheology Test
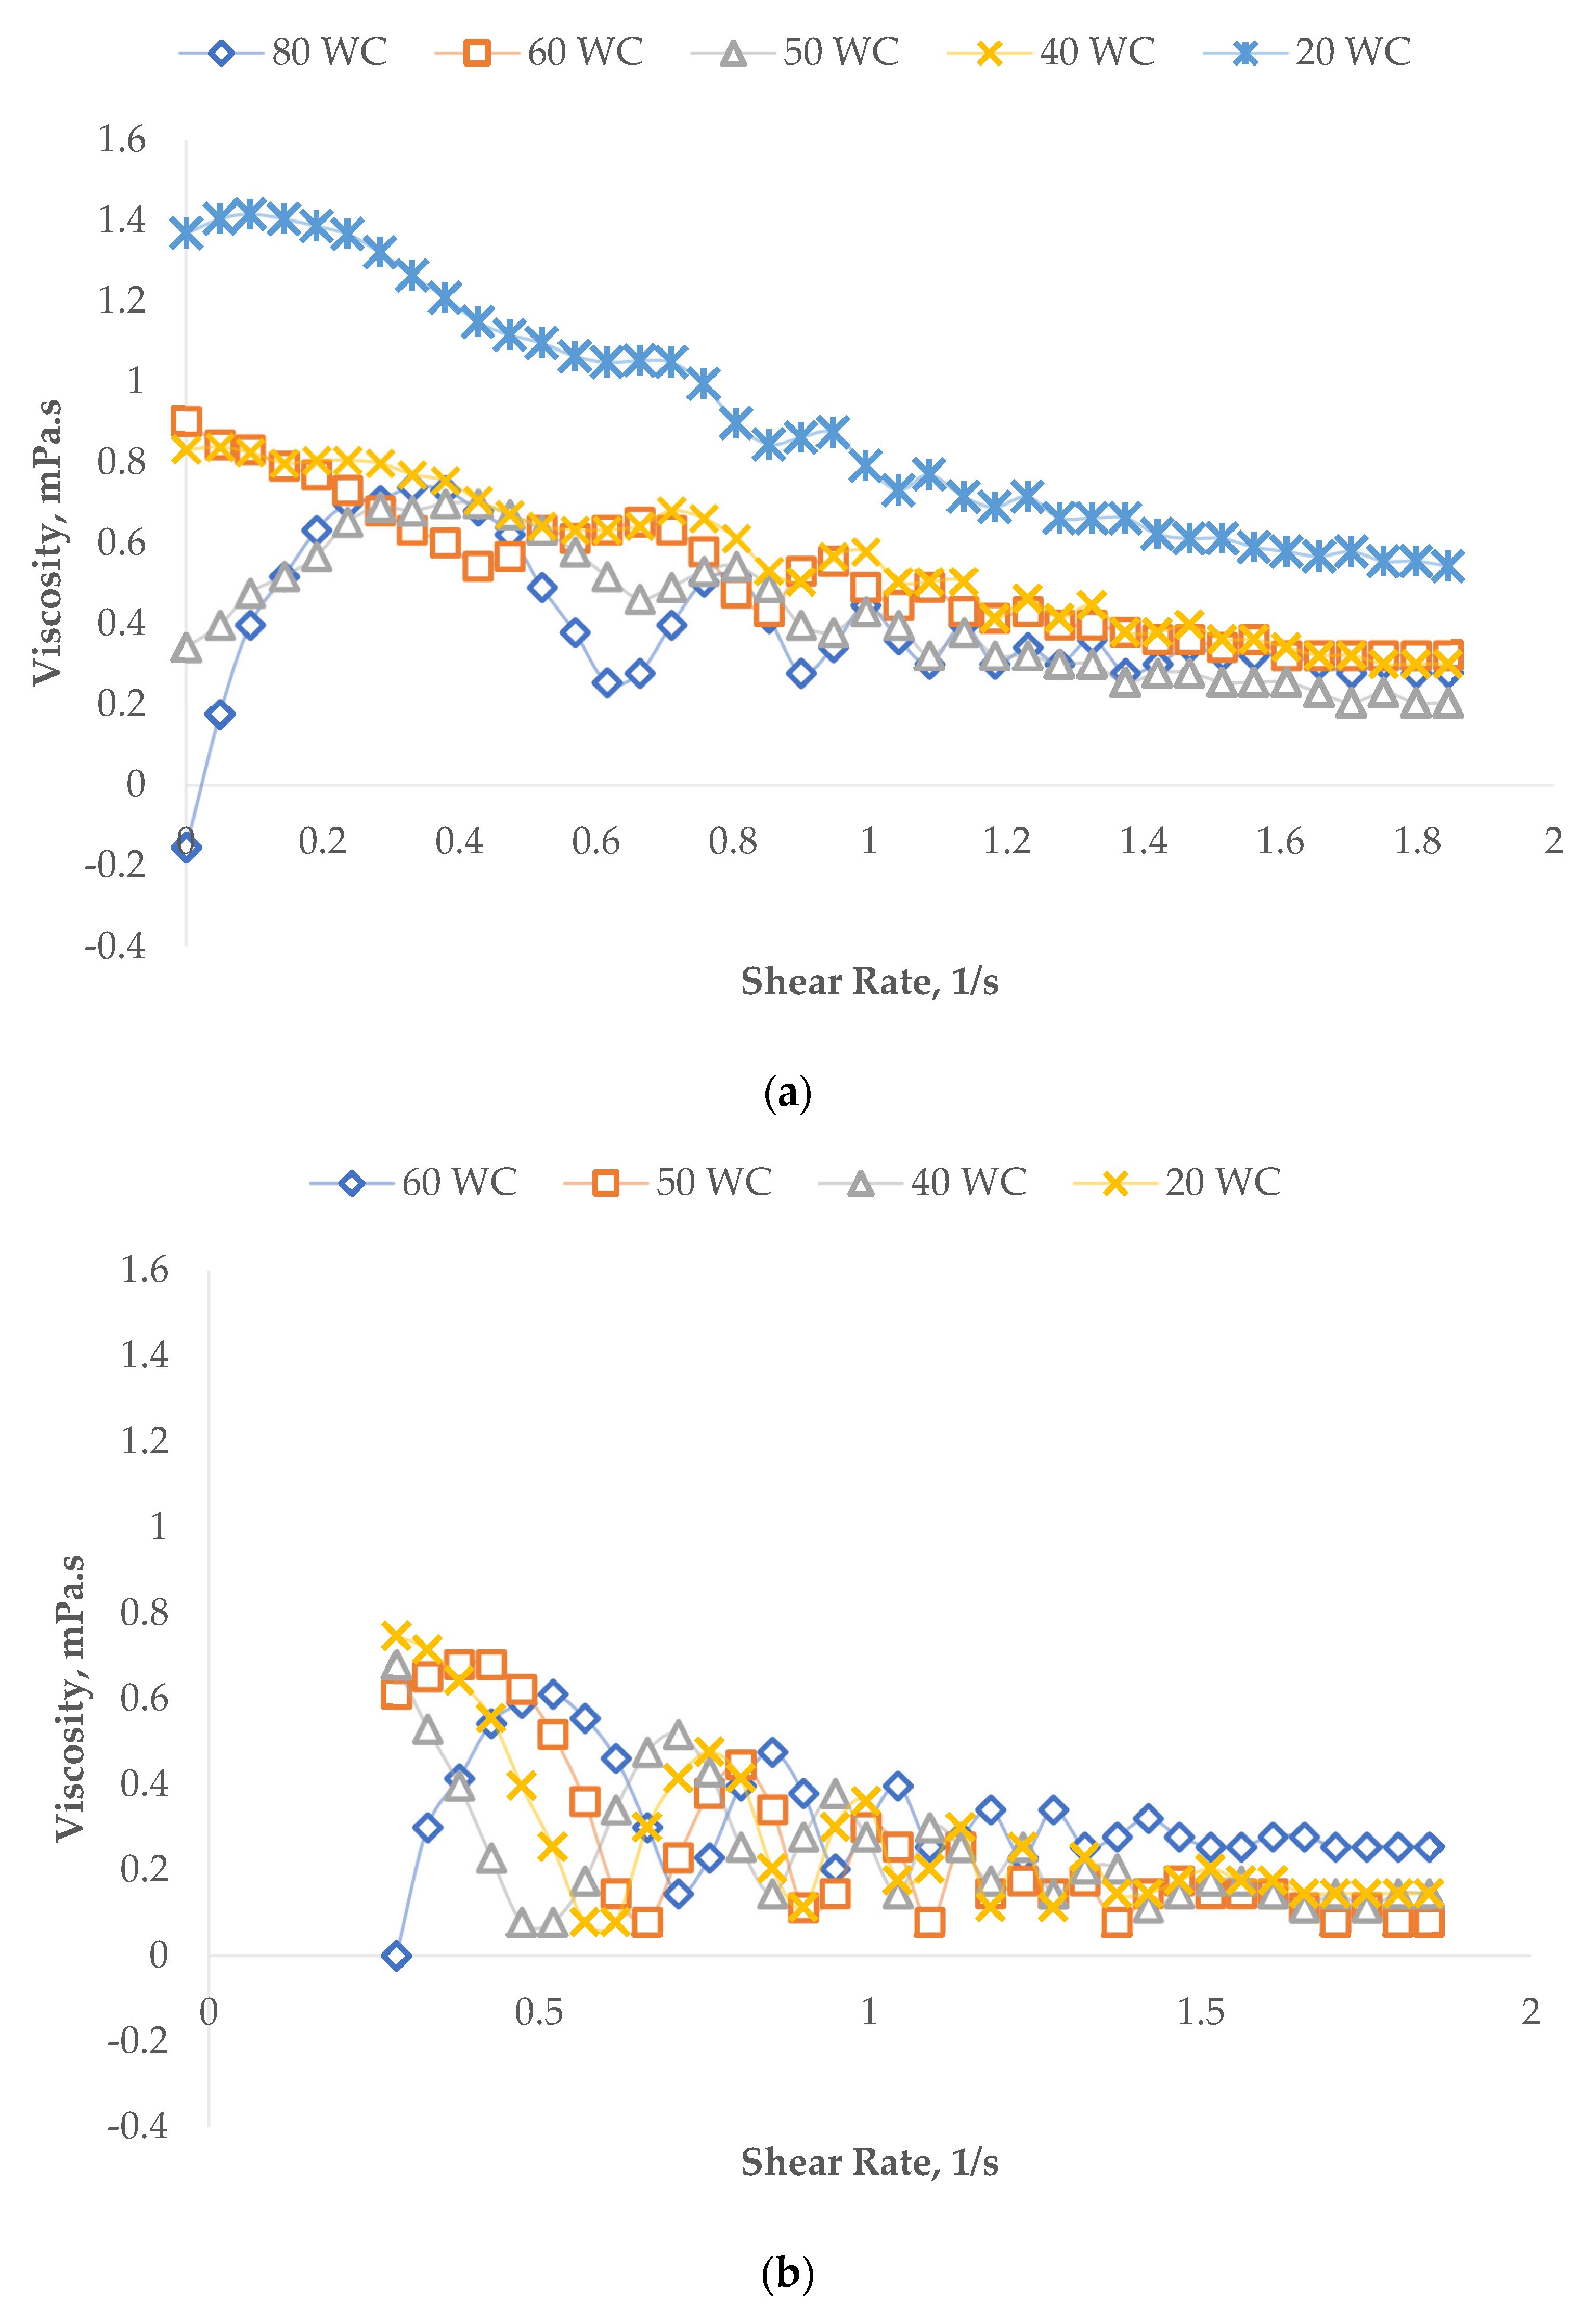
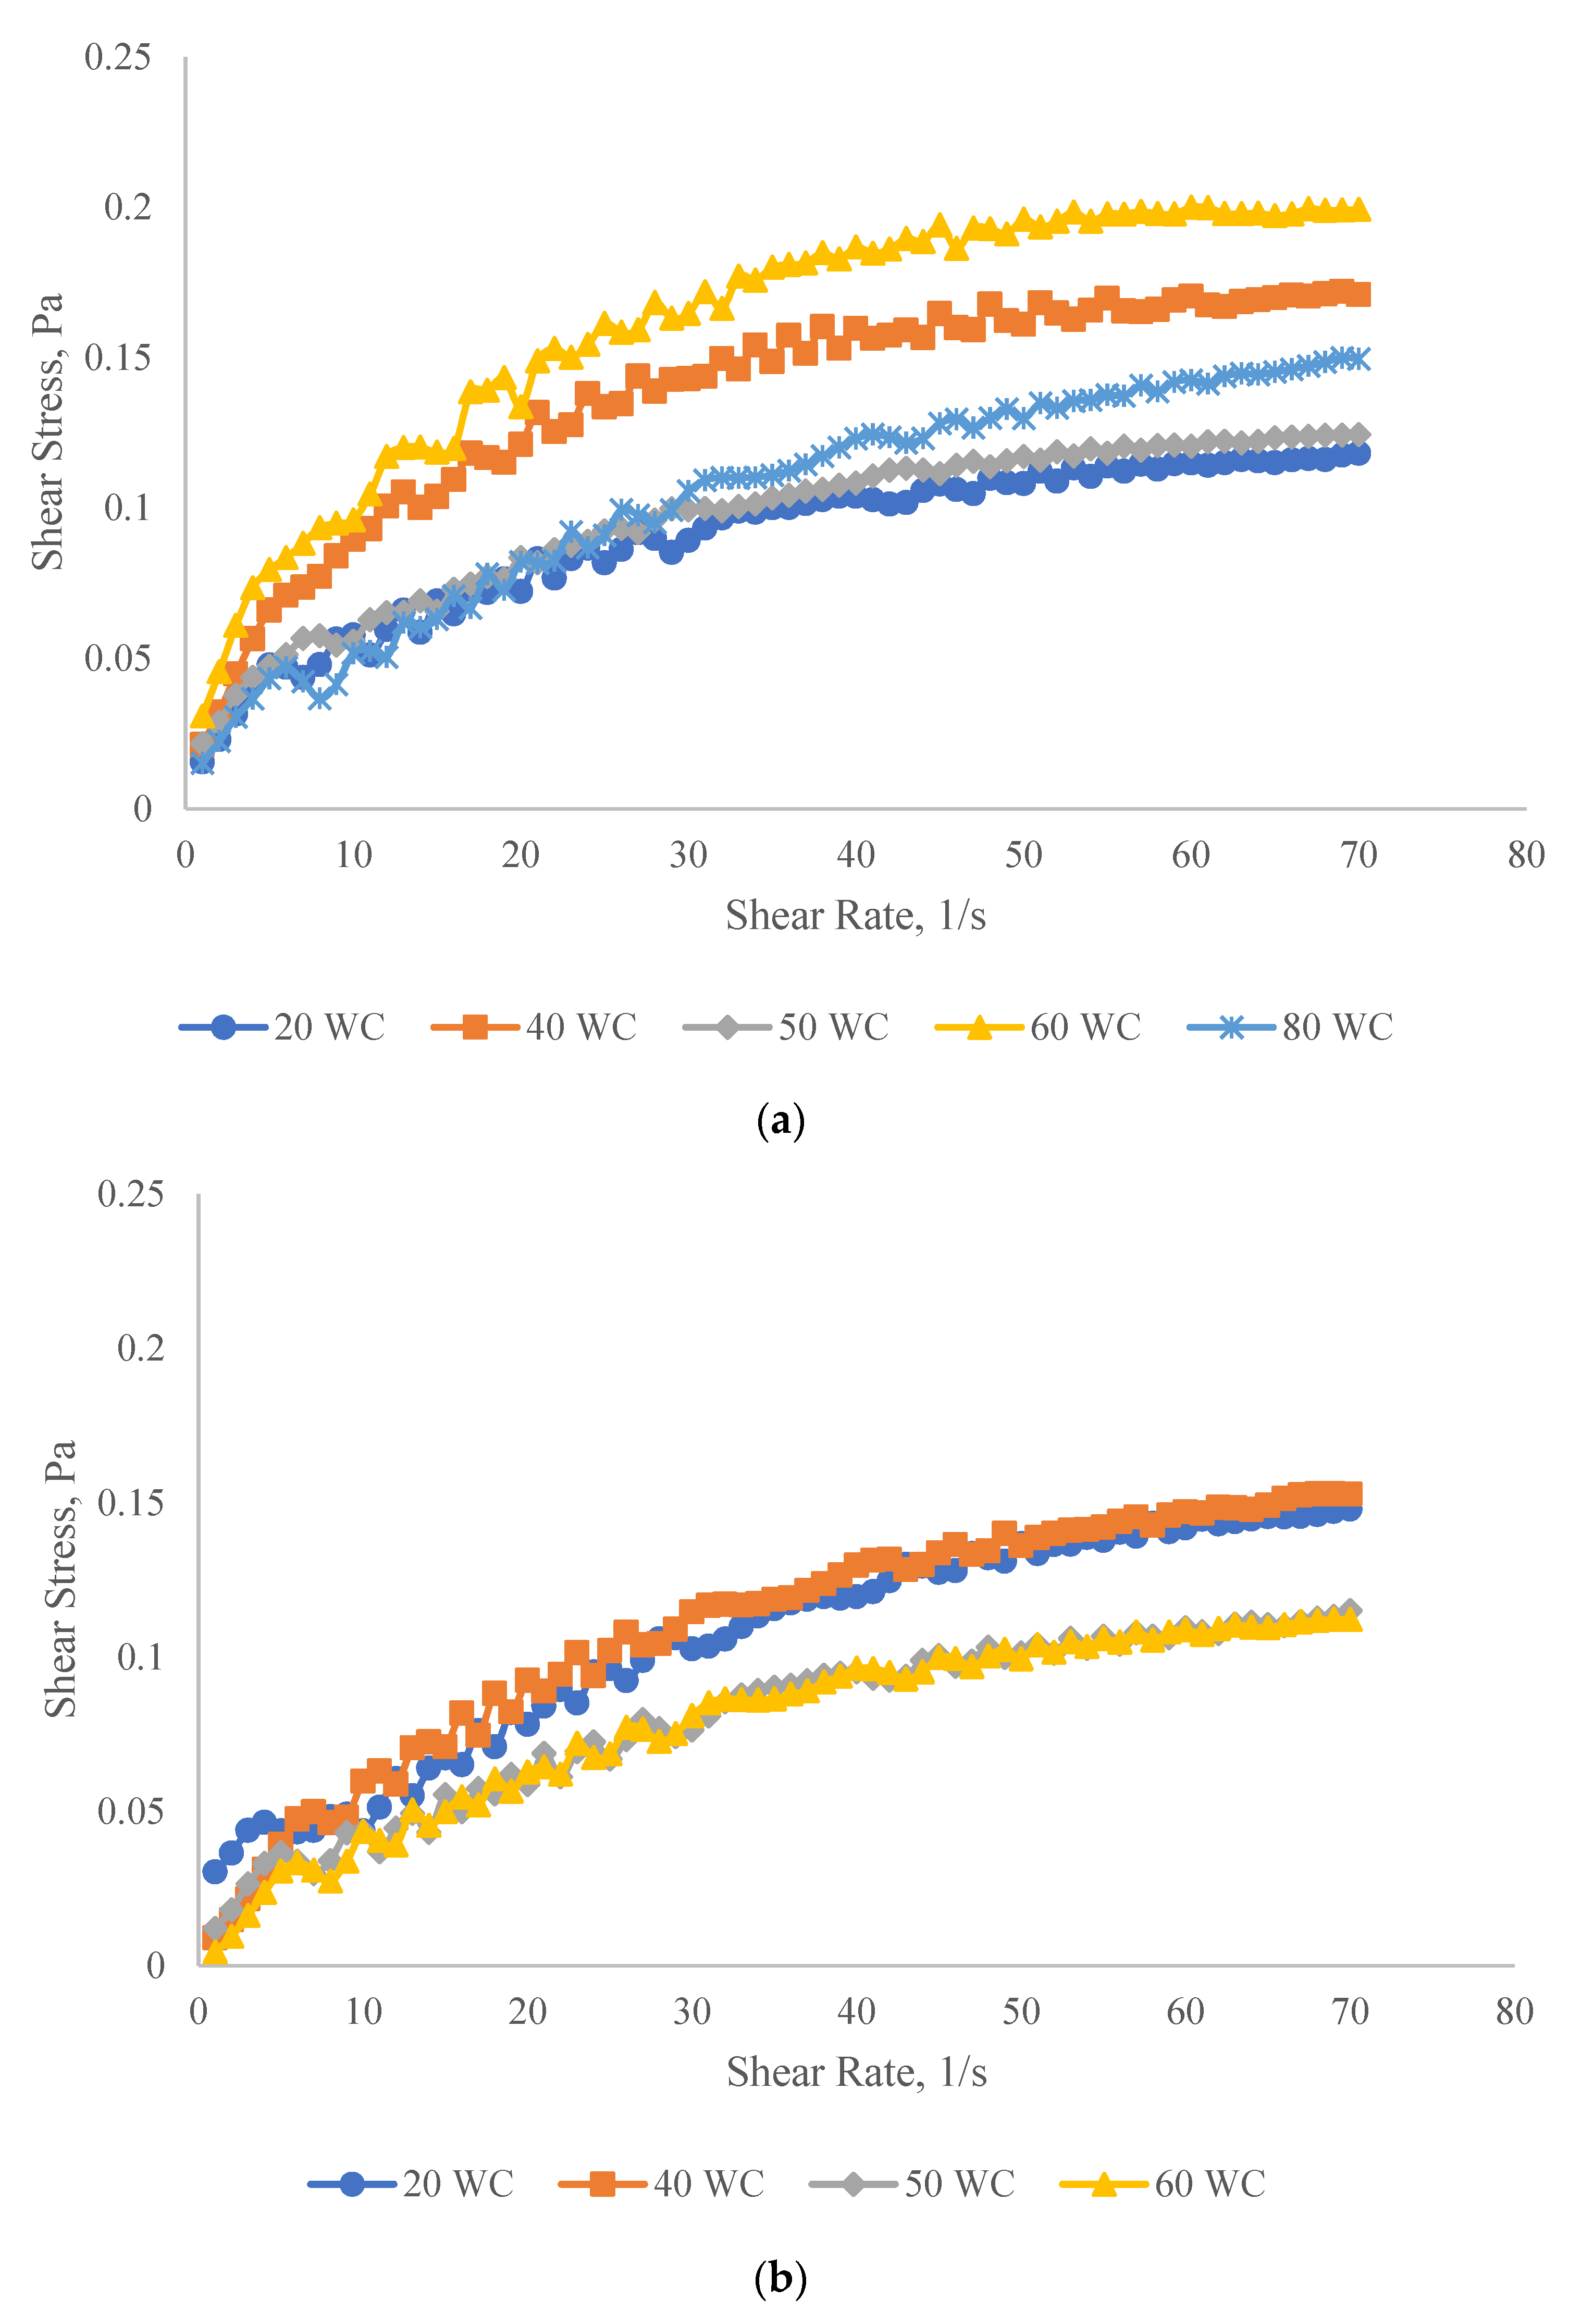
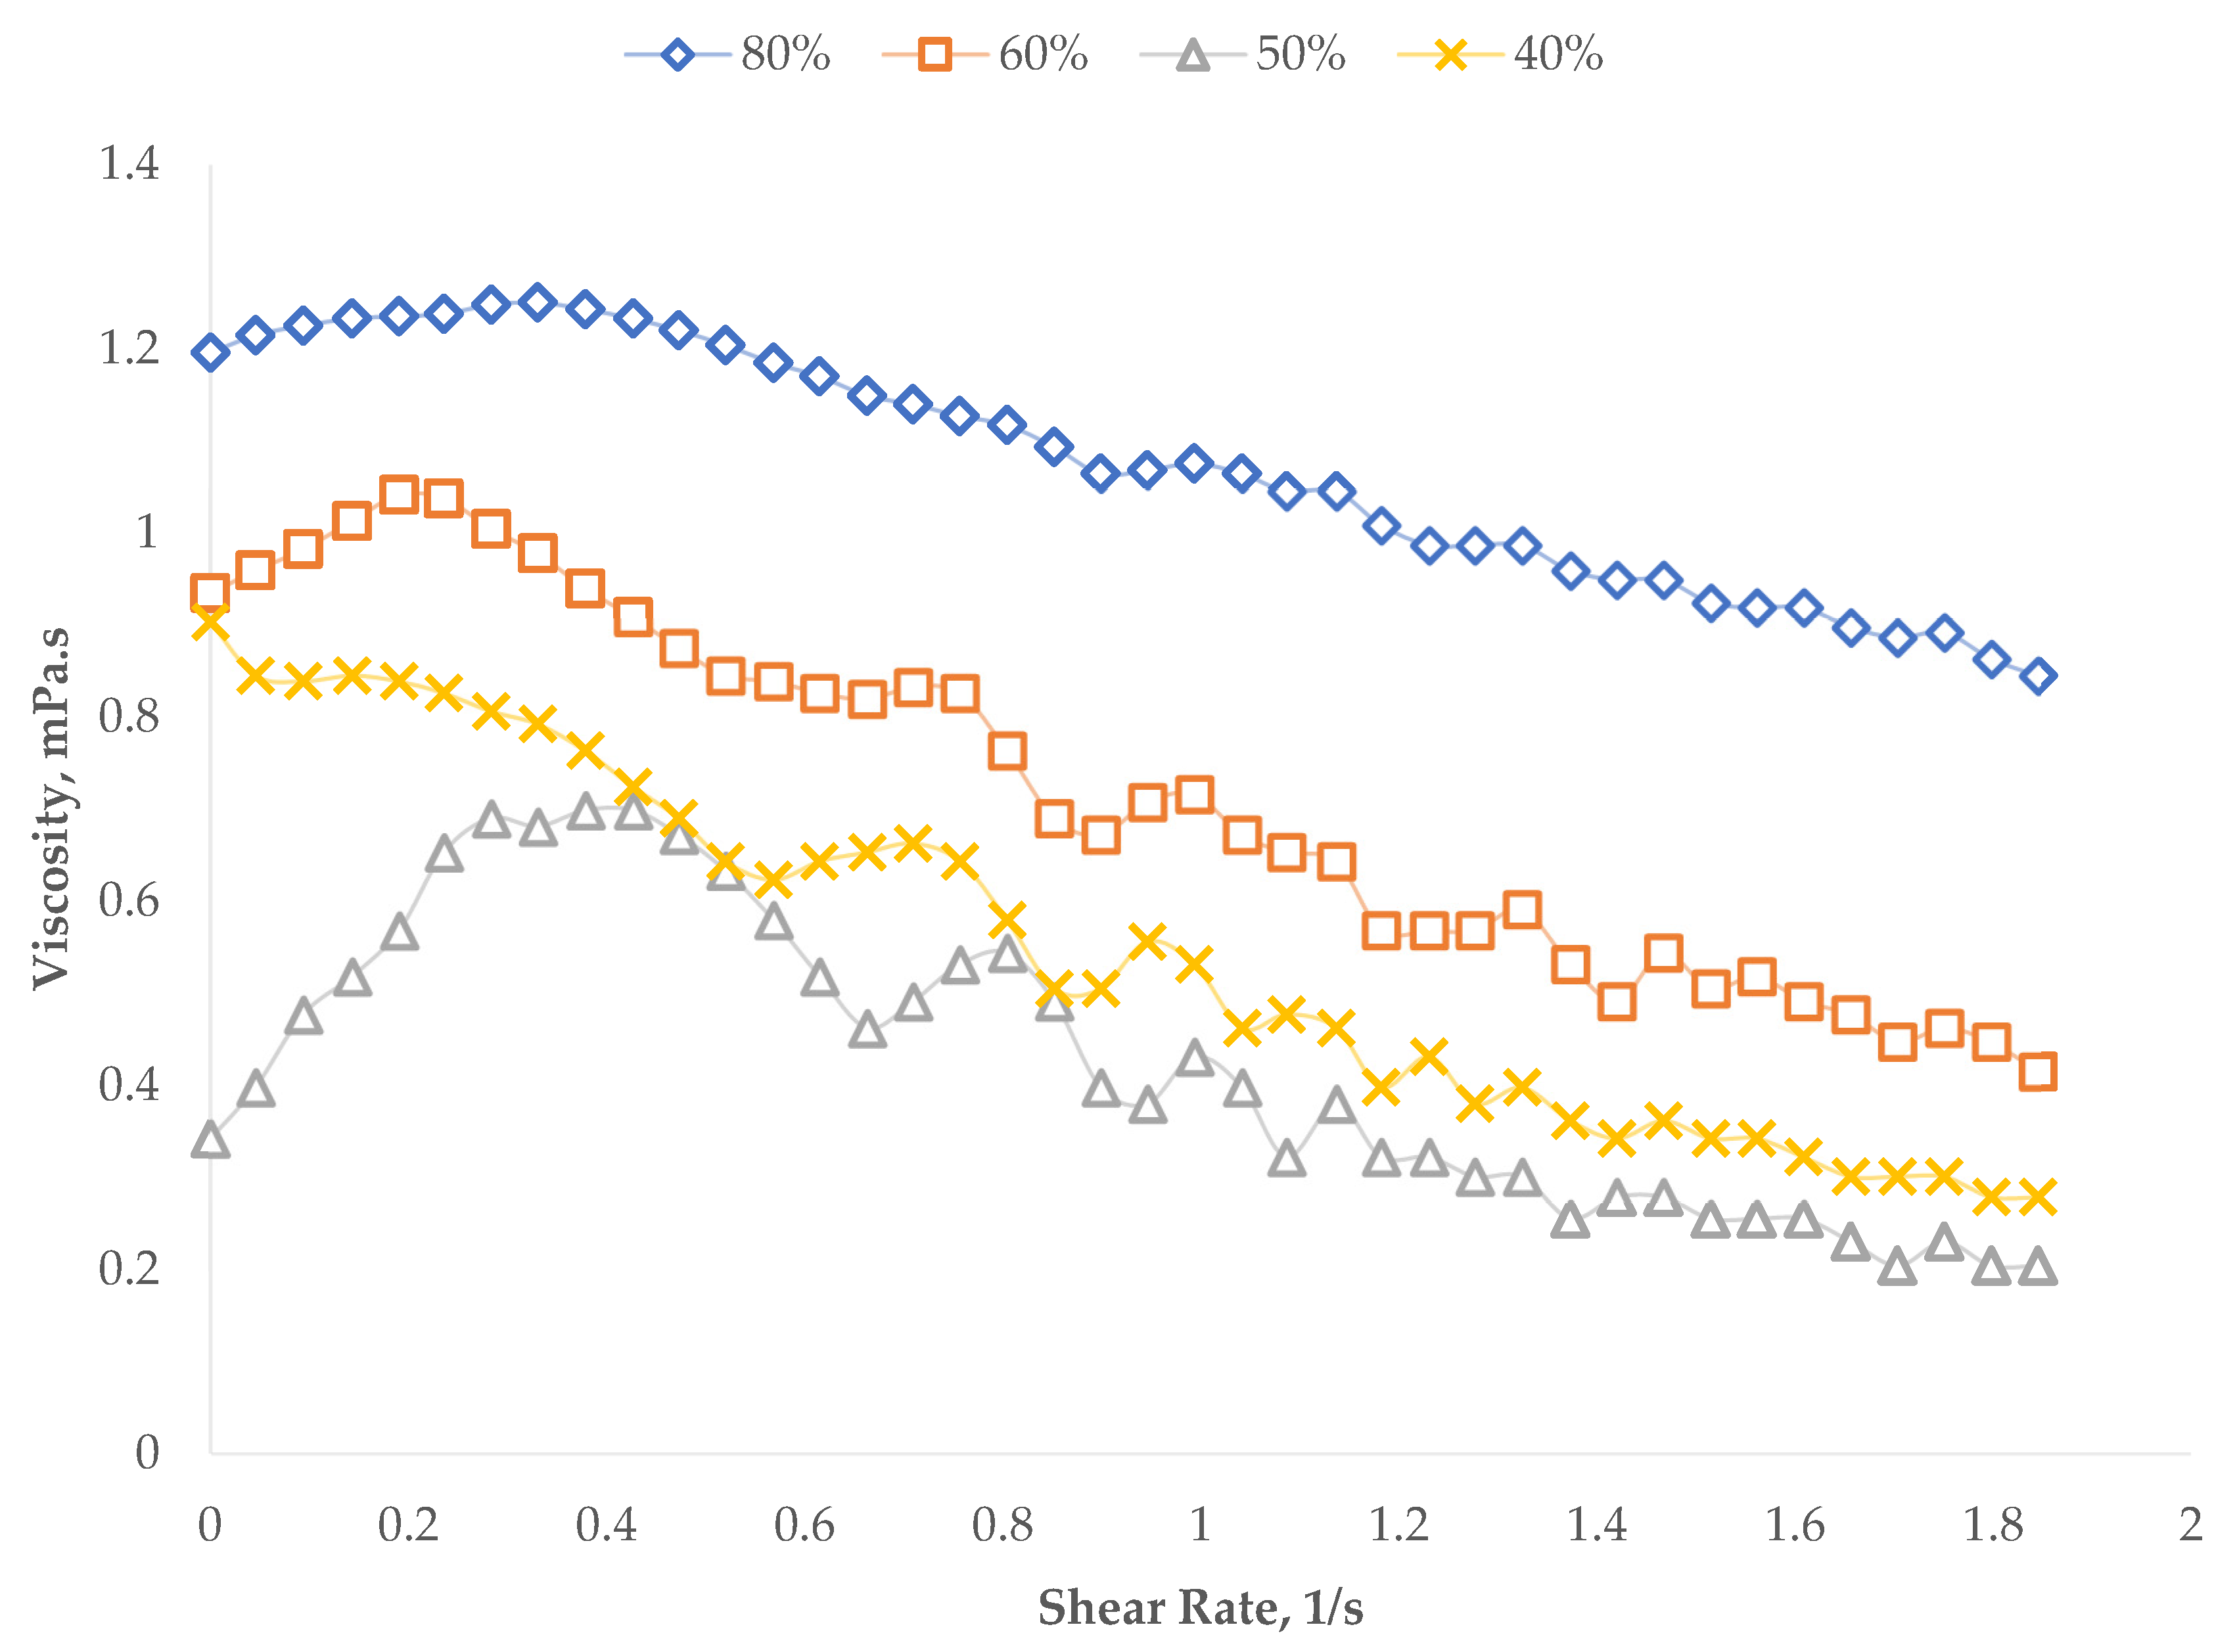
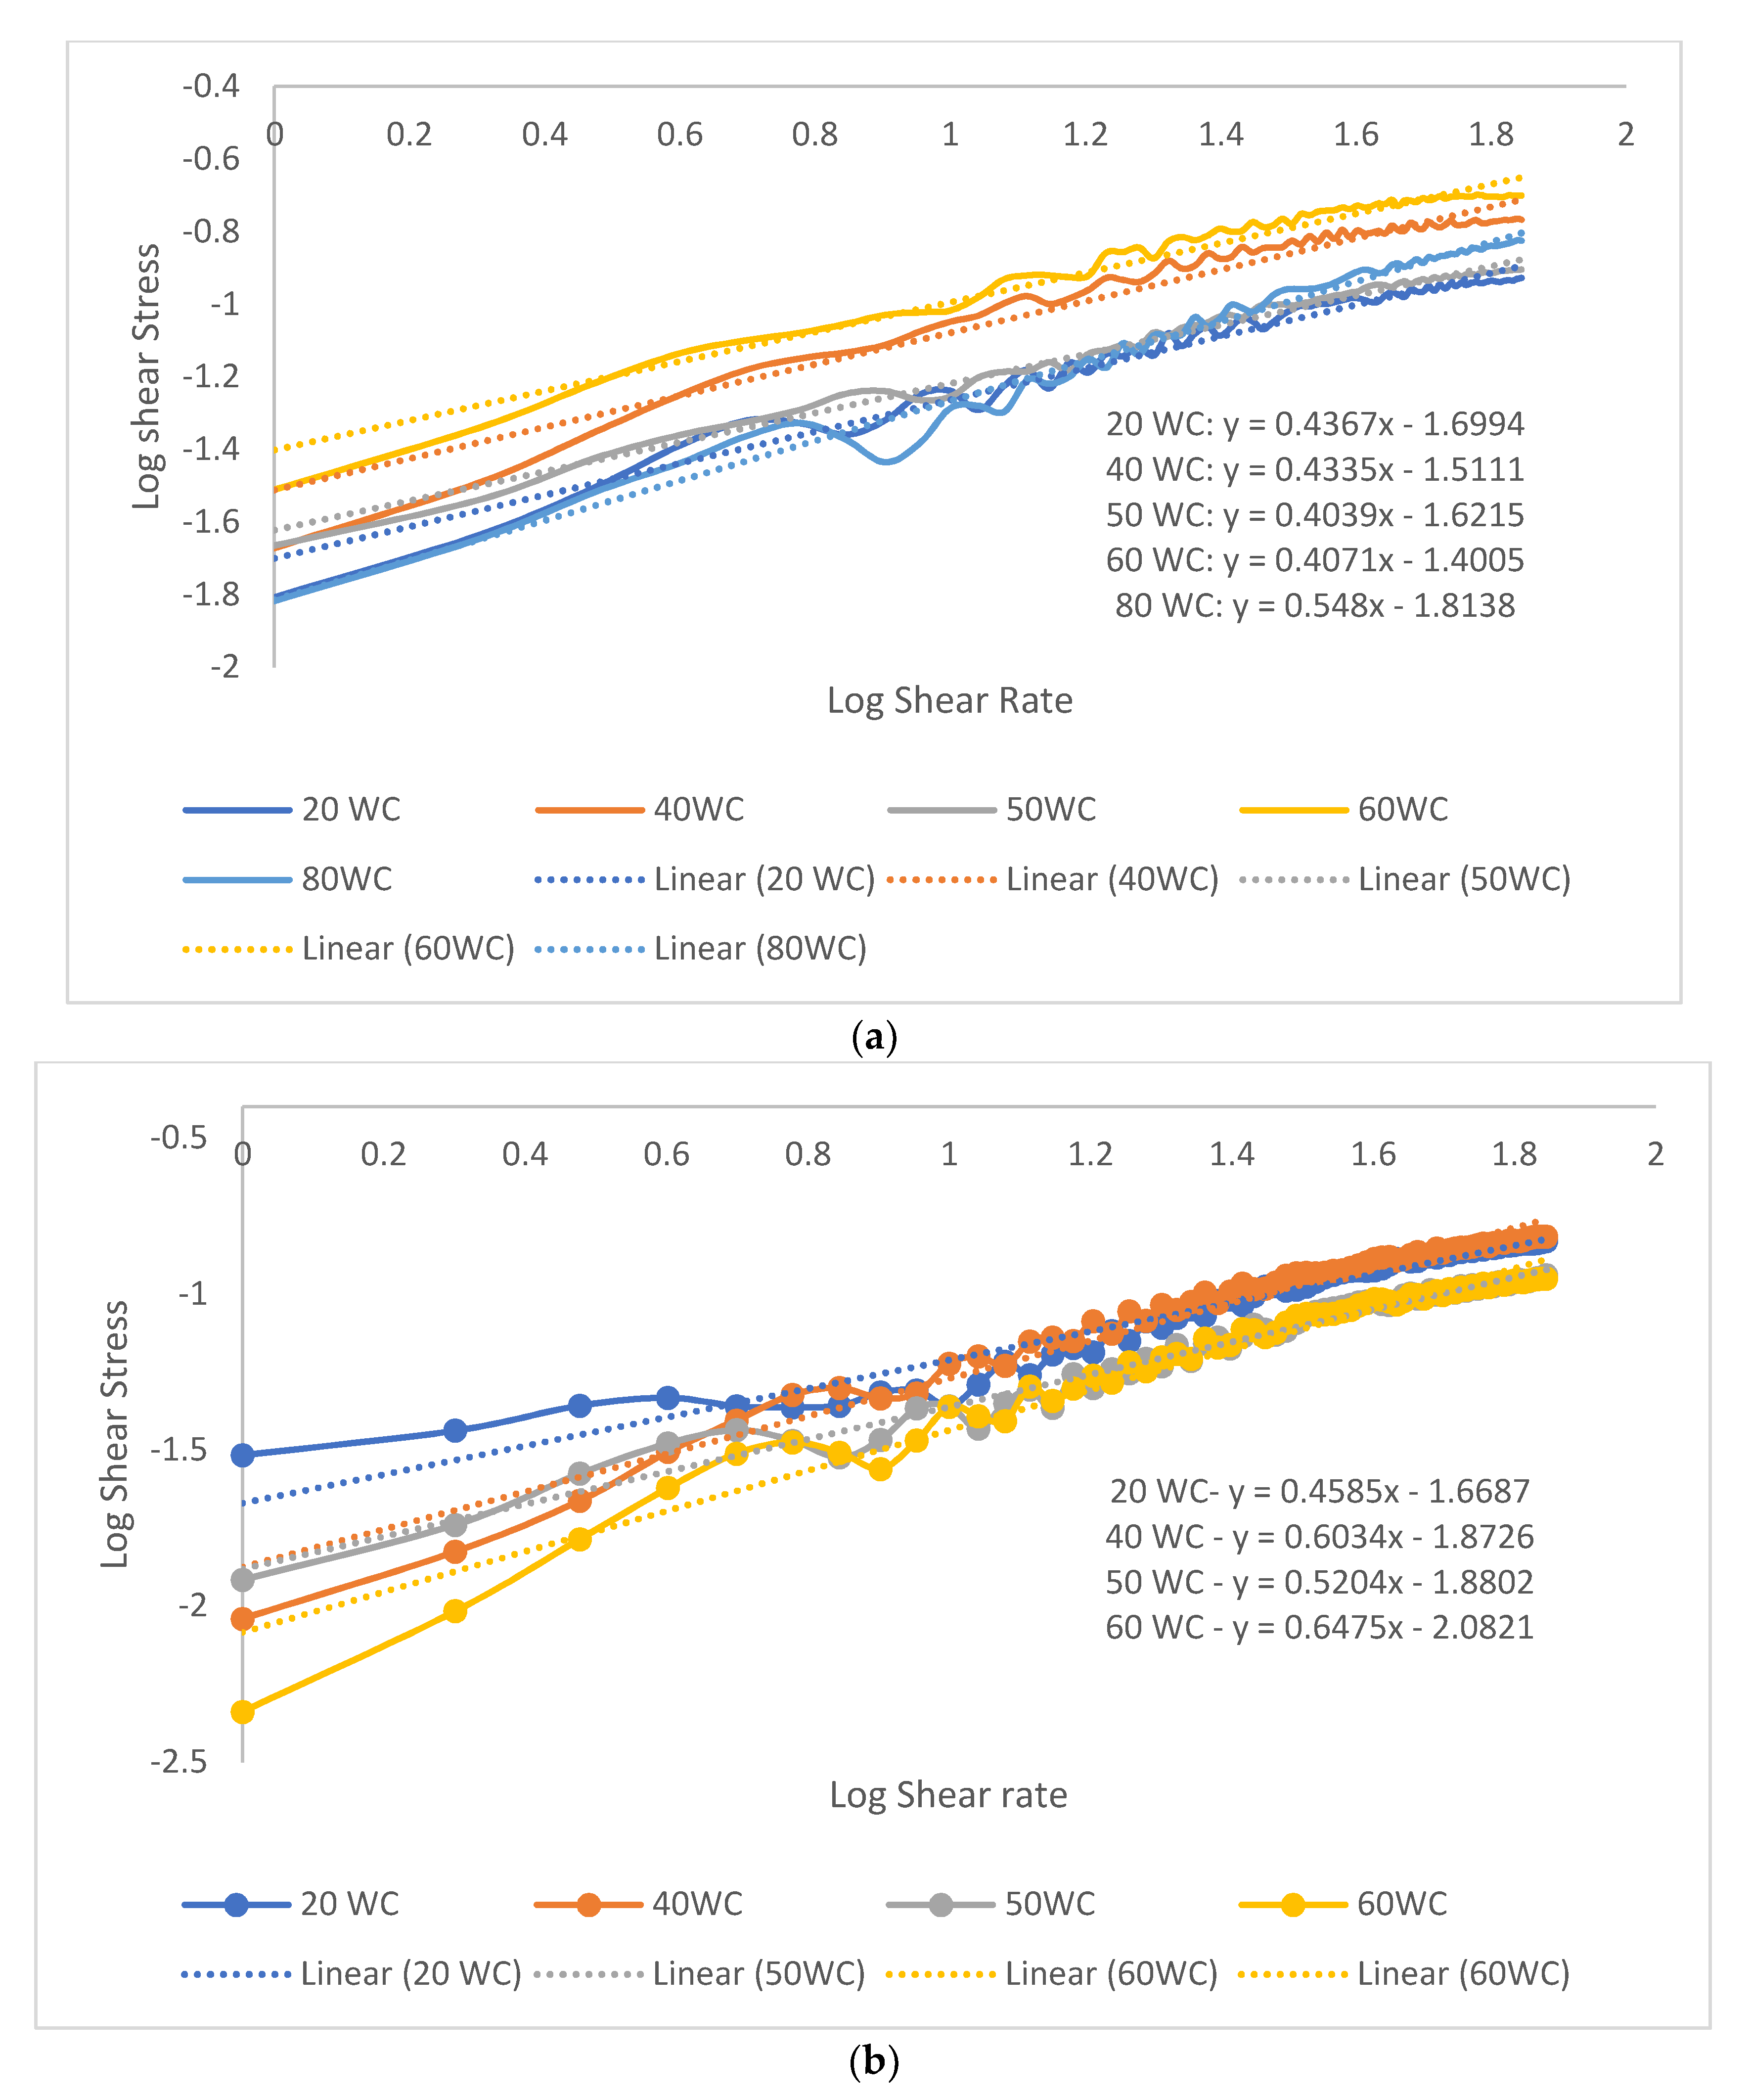
3.2.1. Shear Properties
Effect of Oil Concentration on the Shear Properties of Micromemulsions
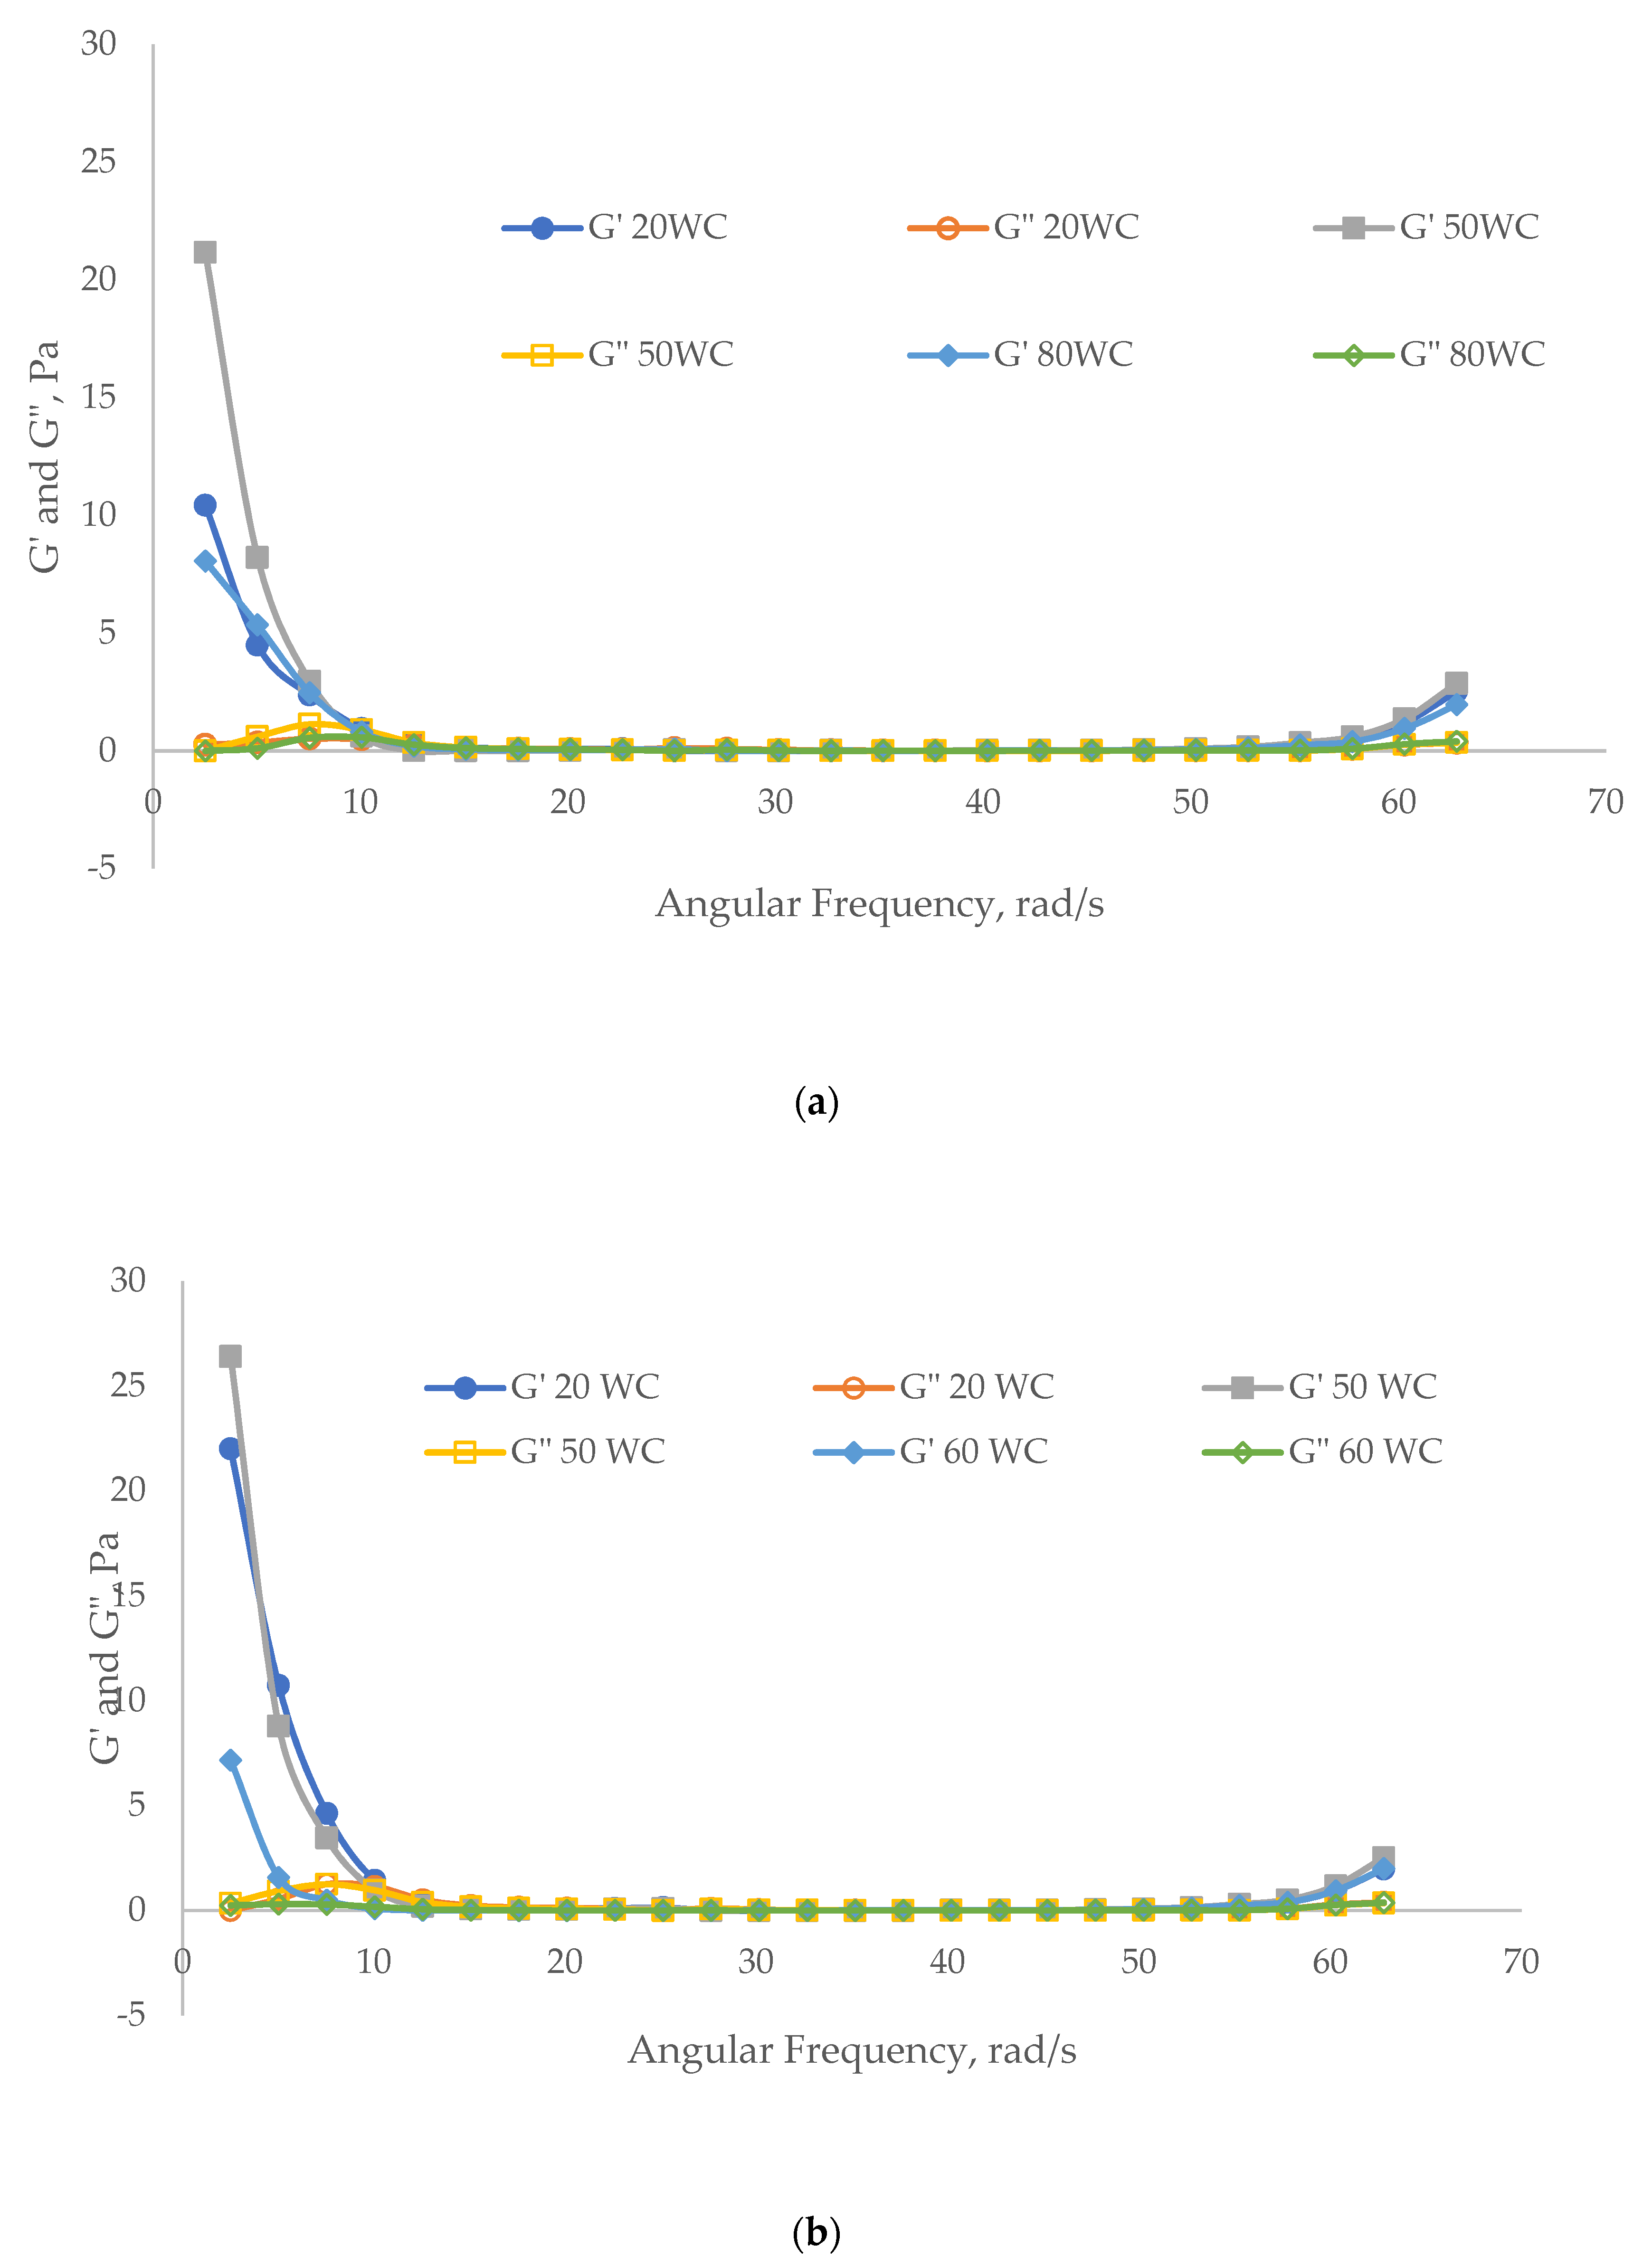
3.2.2. Viscoelasticity Evaluation
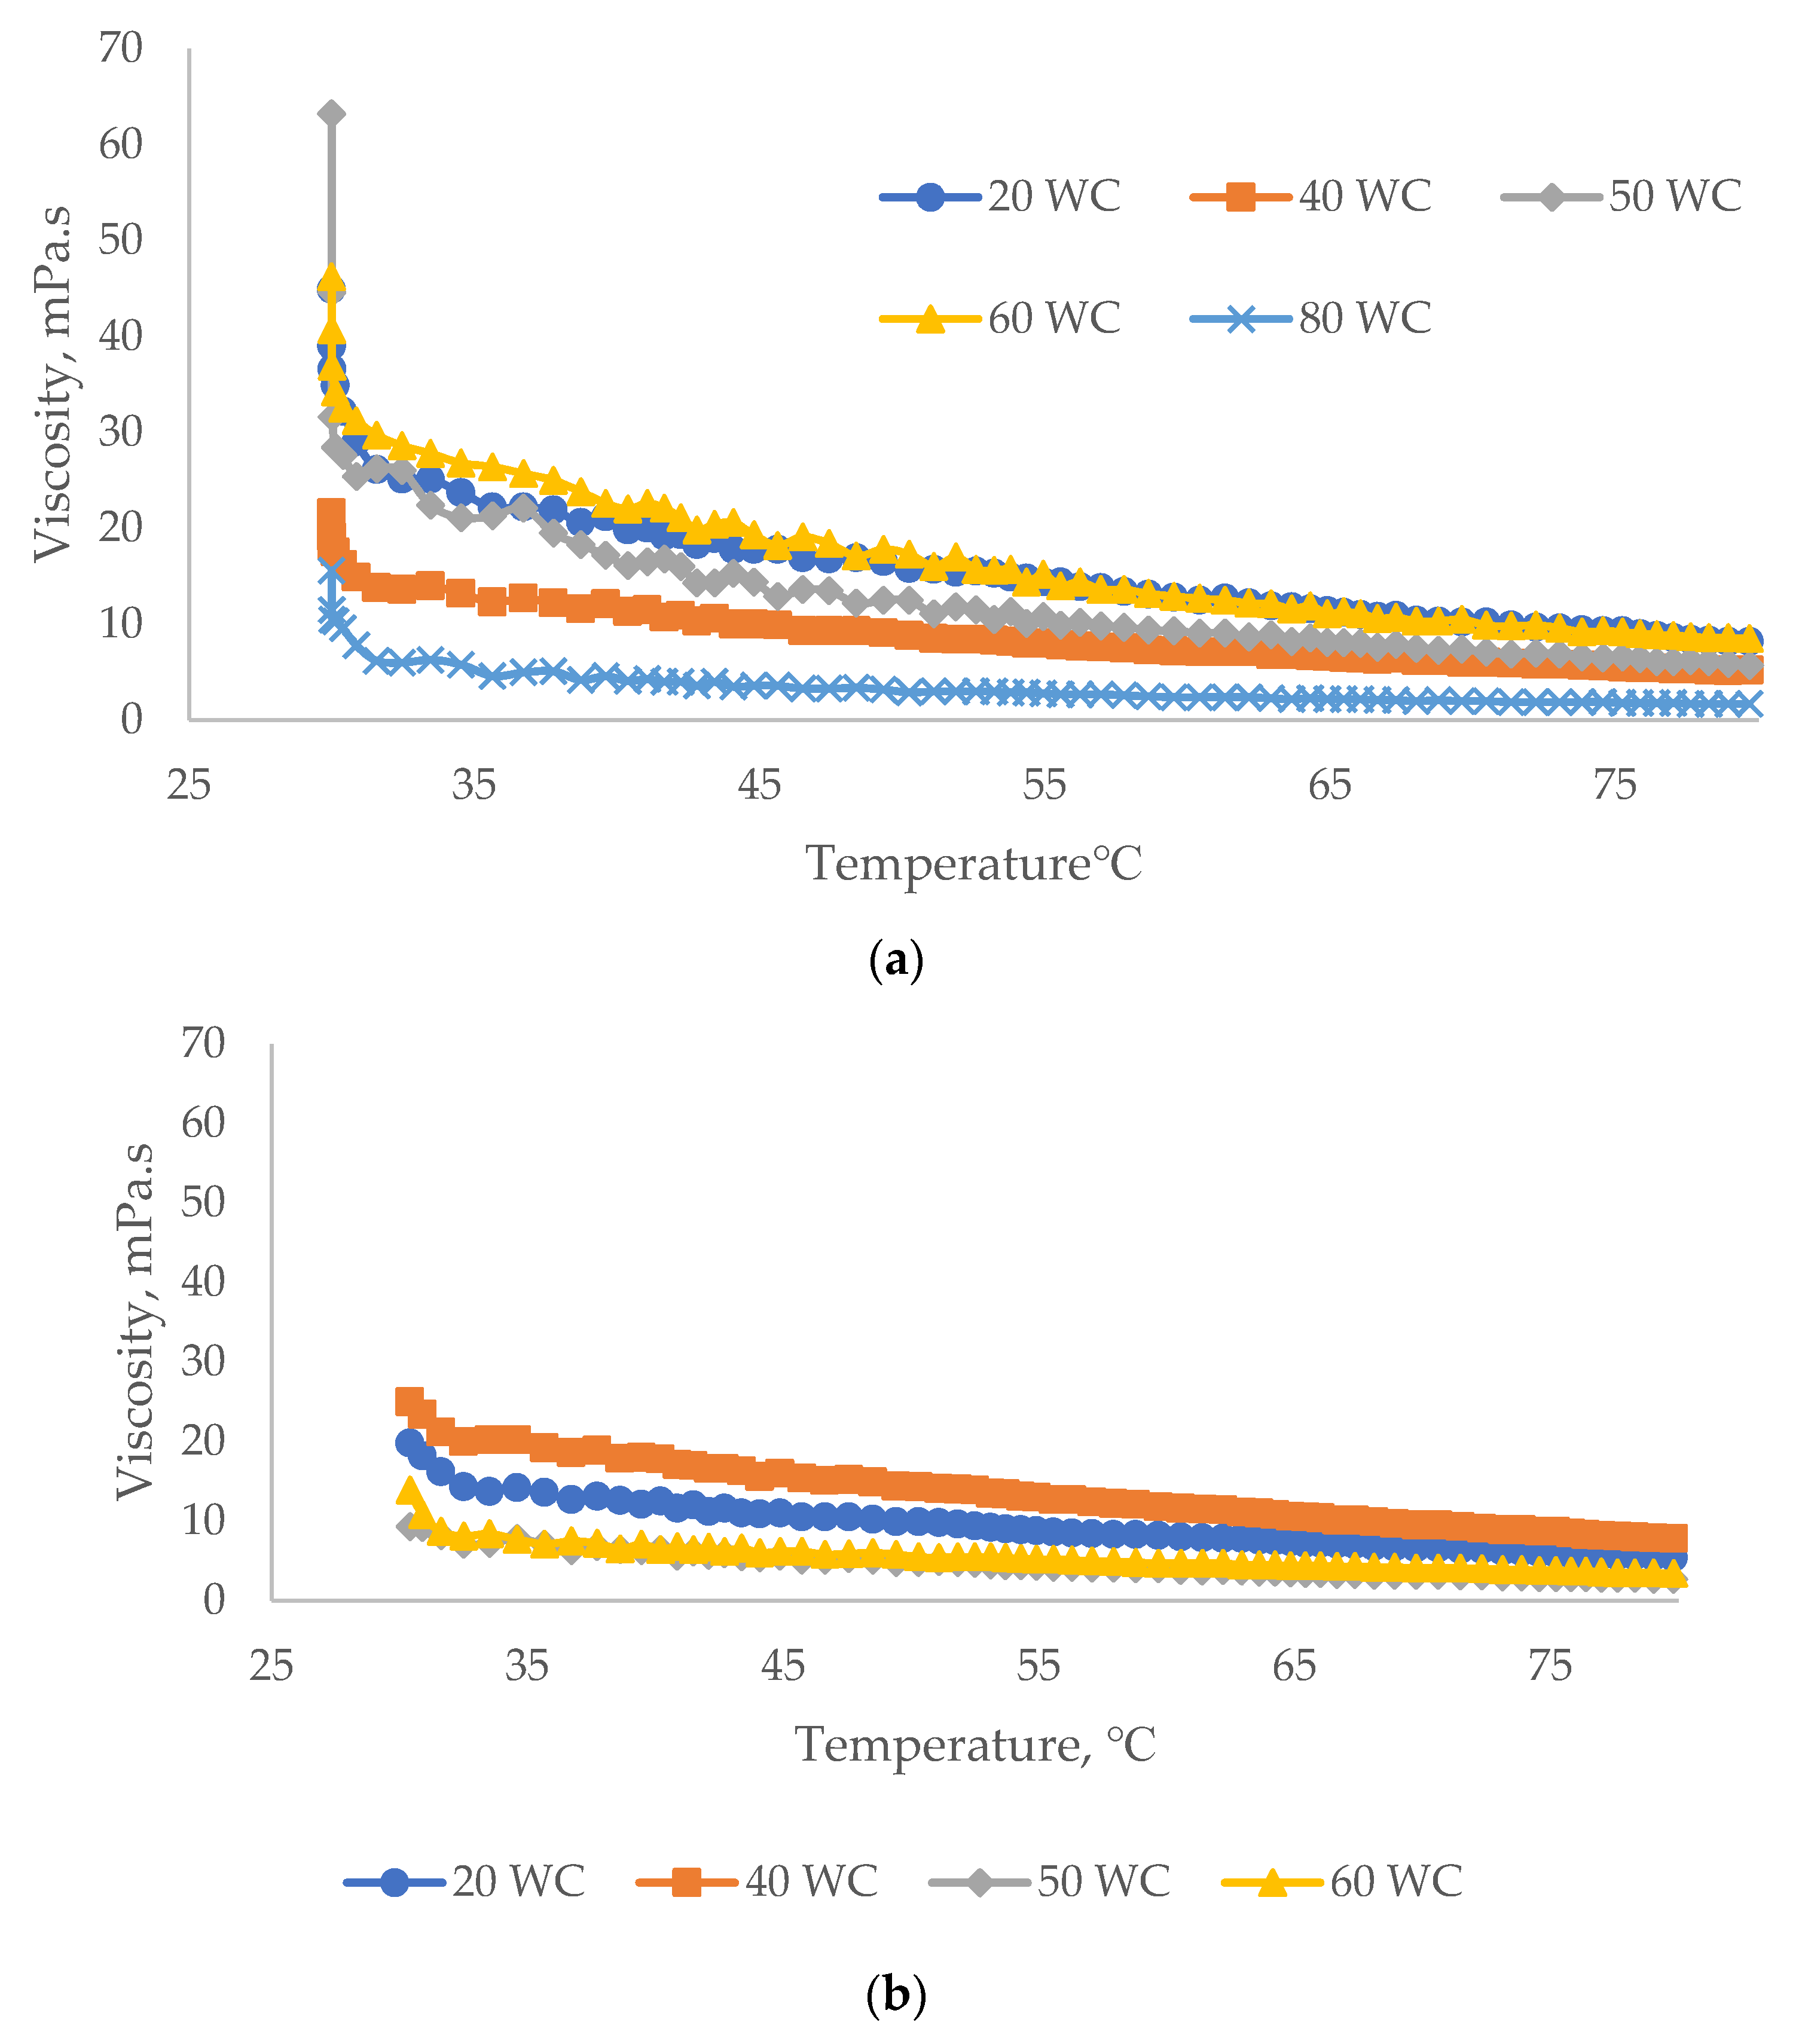
3.2.3. Effect of Temperature on Viscosity
4. Conclusions
Author Contributions
Funding
Acknowledgments
Conflicts of Interest
Appendix A

References
- Duy, N.; Nicholas, S. Stable emulsion and demulsification in chemical EOR flooding: Challenges and best practices. In Proceedings of the EOR Conference at Oil and Gas West Asia, Muscat, Oman, 16–18 April 2012. [Google Scholar]
- Mandal, A. Chemical flood enhanced oil recovery: A review. Int. J. Oil Gas Coal Tech. 2015, 9, 241–264. [Google Scholar] [CrossRef]
- Li, N.; Zhang, G.; Ge, J.; Zhang, L.; Liu, X.; Wang, J. Ultra-low interfacial tension between heavy oil and betaine-type amphoteric surfactants. J. Dispers. Sci. Tech. 2012, 33, 258–264. [Google Scholar] [CrossRef]
- Leitenmueller, V.; Toumi, O.; Hofstaetter, H.; Leoben, M. Microemulsion formation & its effect on rheology using carbonate-based alkalis for AP or ASP floods in the matzen field. In Proceedings of the EOR Conference at Oil and Gas West Asia, Muscat, Oman, 26–28 March 2018. [Google Scholar]
- Amirbayov, T. Simulation Study of the Polymer Flooding Applied to the Norne Field E-Segment. Master’s Thesis, Norwegian University of Science and Technology, Trondheim, Norway, 2014; p. 83. [Google Scholar]
- Chelaru, C.; Diaconu, I.; Simionescu, C.I. Polyacrylamide obtained by plasma-induced polymerization for a possible application in enhanced oil recovery. Polym. Bull. 1998, 40, 757–764. [Google Scholar] [CrossRef]
- Kumar, S.; Mandal, A. Rheological properties and performance evaluation of synthesized anionic polymeric surfactant for its application in enhanced oil recovery. Polymer 2017, 120, 30–42. [Google Scholar] [CrossRef]
- Lee, S.; Kim, D.H.; Huh, C.; Pope, G.A. Development of a comprehensive rheological property database for EOR polymers. In Proceedings of the SPE Annual Technical Conference and Exhibition, New Orleans, LA, USA, 4–7 October 2009. [Google Scholar]
- Jang, H.Y.; Zhang, K.; Chon, B.H.; Choi, H.J. Enhanced oil recovery performance and viscosity characteristics of polysaccharide xanthan gum solution. J. Ind. Eng. Chem. 2015, 21, 741–745. [Google Scholar] [CrossRef]
- Xu, L.; Xu, G.; Liu, T.; Chen, Y.; Gong, H. The comparison of rheological properties of aqueous welan gum and xanthan gum solutions. Carbohydr. Polym. 2013, 92, 516–522. [Google Scholar] [CrossRef] [PubMed]
- Wei, B.; Romero-Zerón, L.; Rodrigue, D. Oil displacement mechanisms of viscoelastic polymers in enhanced oil recovery (EOR): A review. Pet. Explor. Prod. Technol. 2014, 4, 113–121. [Google Scholar] [CrossRef]
- Borhan, N.; Halim, N.H.; Ibrahim, J.M.B.M. An investigation of micro-emulsion and fine foams induced by EOR application in Malaysian fields. In Proceedings of the International Petroleum Technology Conference 2014, Kuala Lumpur, Malaysia, 10–12 December 2014. [Google Scholar]
- Yaakob, A.B.; Sulaimon, A.A. Performance assessment of plant extracts as green demulsifiers. J. Jpn. Pet. Inst. 2017, 60, 186–189. [Google Scholar] [CrossRef]
- Qiu, F. The potential applications in heavy oil eor with the nanoparticle and surfactant stabilized solvent-based emulsion. In Proceedings of the Canadian Unconventional Resources and International Petroleum Conference, Calgary, AL, Canada, 19–21 October 2010. [Google Scholar]
- Chagas, B.S.; Machado, D.L.P., Jr.; Haag, R.B.; De Souza, C.R.; Lucas, E.F. Evaluation of hydrophobically associated polyacrylamide-containing aqueous fluids and their potential use in petroleum recovery. J. Appl. Polym. Sci. 2004, 91, 3686–3692. [Google Scholar] [CrossRef]
- Oh, M.-H.; So, J.-H.; Yang, S.-M. Rheological evidence for the silica-mediated gelation of xanthan gum. J. Colloid Interface Sci. 1999, 216, 320–328. [Google Scholar] [CrossRef] [PubMed]
- Xie, D.; Hou, J.; Doda, A.; Trivedi, J. Application of organic alkali for heavy-oil enhanced oil recovery (EOR), in comparison with inorganic alkali. Energy Fuels 2016, 30, 4583–4595. [Google Scholar] [CrossRef]
- Tadros, T. Application of rheology for assessment and prediction of the long-term physical stability of emulsions. Adv. Colloid Interface Sci. 2004, 108, 227–258. [Google Scholar] [CrossRef] [PubMed]
- Torres, L.G.; Iturbe, R.; Snowden, M.J.; Chowdhry, B.Z.; Leharne, S.A. Preparation of o/w emulsions stabilized by solid particles and their characterization by oscillatory rheology. Colloids Surfaces A Physicochem. Eng. Asp. 2007, 302, 439–448. [Google Scholar] [CrossRef]
- Chauhan, G.; Ojha, K. Synthesis of a bio-polymer nanocomposite fracturing fluid for HTHP application. In Proceedings of the Abu Dhabi International Petroleum Exhibition and Conference, Abu Dhabi, UAE, 7–10 November 2016. [Google Scholar]
- Maurya, N.K.; Mandal, A. Investigation of synergistic effect of nanoparticle and surfactant in macro emulsion based EOR application in oil reservoirs. Chem. Eng. Res. Design 2018, 132, 370–384. [Google Scholar] [CrossRef]
- Chen, C.; Wang, S.; Grady, B.P.; Harwell, J.H.; Shiau, B.-J. Oil-induced viscoelasticity in micellar solutions of alkoxy sulfate. Langmuir 2019, 35, 12168–12179. [Google Scholar] [CrossRef] [PubMed]


| Compounds (Brands) | Weight, mg for One Litter Brine Solution |
|---|---|
| CaCl2.2H2O (R&M Chemicals) | 84.99 |
| MgCl2.6H2O (R&M Chemicals) | 175.57 |
| KCl (Merck) | 89.61 |
| BaCl2.2H2O (Merck) | 3.20 |
| SrCl2.6H2O (Merck) | 6.08 |
| LiCl (Merck) | 9.77 |
| NaHCO3 (Fischer Scientific UK) | 6566.29 |
| Na2SO4 (R&M Chemicals) | 7.39 |
| NaCl (Bendosen) | 7488.91 |
| Parameters | Properties | Unit |
|---|---|---|
| API gravity (API) | 30.58 | - |
| Total acid number | 0.08 | mg KOH/g |
| Wax appearance temperature | 16.7 | °C |
| Saturates | 39.09 | wt% |
| Aromatic | 13.26 | wt% |
| Resins | 22.37 | wt% |
| Asphaltenes | 0.10 | wt% |
| Volatiles | 27.68 | wt% |
| API gravity (API) | 30.58 |
| Water Cut (ASP/SP: Brine) | Percentage of Crude Oil (%) |
|---|---|
| Blank–100 (0:100) | 20, 40, 50, 60, 80 |
| 80% (20:80) | 20, 40, 50, 60, 80 |
| 60% (40:60) | 20, 40, 50, 60, 80 |
| 50% (50:50) | 20, 40, 50, 60, 80 |
| 40% (60:40) | 20, 40, 50, 60, 80 |
| 20% (80:20) | 20, 40, 50, 60, 80 |
| K | n | R-squared, R2 | |
|---|---|---|---|
| ASP Water Cut (%) | |||
| 80 WC | 0.50 | 0.88 | 0.96 |
| 60 WC | 0.79 | 0.71 | 0.97 |
| 50 WC | 0.64 | 0.76 | 0.67 |
| 40 WC | 0.85 | 0.68 | 0.90 |
| 20 WC | 1.40 | 0.48 | 0.14 |
| SP Water Cut (%) | |||
| 60 WC | 0.43 | 0.9 | 0.14 |
| 50 WC | 0.61 | 0.67 | 0.36 |
| 40 WC | 0.44 | 0.82 | 0.36 |
| 20 WC | 0.55 | 0.74 | 0.46 |
| K | n | Yield Stress, Pa | R-squared, R2 | |
|---|---|---|---|---|
| ASP Water Cut (%) | ||||
| 80 WC | 0.02 | 0.55 | 0.04 | 0.98 |
| 60 WC | 0.09 | 0.41 | 0.09 | 0.97 |
| 50 WC | 0.02 | 0.40 | 0.05 | 0.99 |
| 40 WC | 0.03 | 0.43 | 0.07 | 0.95 |
| 20 WC | 0.02 | 0.44 | 0.05 | 0.97 |
| SP Water Cut (%) | ||||
| 60 WC | 0.01 | 0.65 | 0.03 | 0.96 |
| 50 WC | 0.01 | 0.52 | 0.03 | 0.98 |
| 40 WC | 0.01 | 0.60 | 0.04 | 0.96 |
| 20 WC | 0.02 | 0.46 | 0.04 | 0.94 |
| Maximum Gel Strength, G’, Pa | The Ratio of G’ and G” (G’/G”) ± Standard Deviation, SD | |
|---|---|---|
| ASP Water Cut (%) | ||
| 80 WC | 29.58 | 11.05 ± 42.00 |
| 60 WC | 2.32 | 4.91 ± 11.97 |
| 50 WC | 21.16 | 1.37 ± 1.55 |
| 40 WC | 14.61 | 6.20 ± 19.93 |
| 20 WC | 8.06 | 2.11 ± 3.26 |
| SP Water Cut (%) | ||
| 60 WC | 22.01 | 3.76 ± 9.01 |
| 50 WC | 16.24 | 3.77 ± 7.96 |
| 40 WC | 26.41 | 4.20 ± 13.35 |
| 20 WC | 7.17 | 1.13 |
© 2020 by the authors. Licensee MDPI, Basel, Switzerland. This article is an open access article distributed under the terms and conditions of the Creative Commons Attribution (CC BY) license (http://creativecommons.org/licenses/by/4.0/).
Share and Cite
Numin, M.S.; Jumbri, K.; Ramli, A.; Borhan, N. Microemulsion Rheological Analysis of Alkaline, Surfactant, and Polymer in Oil-Water Interface. Processes 2020, 8, 762. https://doi.org/10.3390/pr8070762
Numin MS, Jumbri K, Ramli A, Borhan N. Microemulsion Rheological Analysis of Alkaline, Surfactant, and Polymer in Oil-Water Interface. Processes. 2020; 8(7):762. https://doi.org/10.3390/pr8070762
Chicago/Turabian StyleNumin, Mohd Sofi, Khairulazhar Jumbri, Anita Ramli, and Noorazlenawati Borhan. 2020. "Microemulsion Rheological Analysis of Alkaline, Surfactant, and Polymer in Oil-Water Interface" Processes 8, no. 7: 762. https://doi.org/10.3390/pr8070762
APA StyleNumin, M. S., Jumbri, K., Ramli, A., & Borhan, N. (2020). Microemulsion Rheological Analysis of Alkaline, Surfactant, and Polymer in Oil-Water Interface. Processes, 8(7), 762. https://doi.org/10.3390/pr8070762