Abstract
Experimental data of thermal conductivity, thermal stability, specific heat capacity, viscosity, UV–vis (light transmittance) and FTIR (light absorption) of Multiwalled Carbon Nanotubes (MWCNTs) dispersed in glycols, alcohols and water with the addition of sodium dodecylbenzene sulfonate (SDBS) surfactant for 0.5 wt % concentration along a temperature range of 25 °C to 200 °C were verified using Artificial Neural Networks (ANNs). In this research, an ANN approach was proposed using experimental datasets to predict the relative thermophysical properties of the tested nanofluids in the available literature. Throughout the designed network, 65% and 25% of data points were comprehended in the training and testing set while the other 10% was utilized as a validation set. The parameters such as temperature, concentration, size and time were considered as inputs while the thermophysical properties were considered as outputs to develop ANN models of further predictions with unseen datasets. The results found to be satisfactory as the (coefficient of determination) R2 values are close to 1.0. The predicted results of the nanofluids’ thermophysical properties were then validated with experimental dataset values. The validation plots of all individual samples for all properties were graphically generated. A comparison study was conducted for the robustness of the proposed approach. This work may help to reduce the experimental time and cost in the future.
1. Introduction
In many industrial heating and cooling applications, convective heat transfer is very important. By changing the boundary conditions, flow geometry or fluids’ thermophysical properties can enhance the convective heat transfer rate of a thermal system. The addition of nanoparticles to the base fluids is one of the promising ways of improving the thermophysical properties of fluids. Such kinds of suspensions are named as nanofluids. Nanofluids have attracted several researchers from all over the world because they have the ability to improve the heat transfer rate for different applications including electrical and electronics. Since nanofluids are considered to be the next generation coolants, researchers are focused on developing nanofluids with ultrahigh cooling performance, thus representing a significant cooling technology for cross-cutting applications. The main aim of nanofluid is to achieve the best thermal properties in the lowest concentrations with uniform dispersion and stable suspension of nanoparticles in base fluids. Numerous experimental [1,2,3,4,5] and theoretical analyses [6,7,8,9,10] of nanofluids’ thermophysical properties were conducted by many scientists. In general, the temperature and volume fraction were considered as important factors for developing the classical models of thermophysical properties especially thermal conductivity and viscosity [11,12,13,14]. Other than temperature and volume fraction, parameters such as particle shape, particle type and mixing ratio also influence the thermophysical properties of nanofluids. Accurate thermophysical properties of nanofluids under various parameters cannot be predicted easily. Furthermore, in terms of the conventional particle–liquid suspensions models, the heat transport mechanism for nanofluid is hard to understand. Currently, most of the available models are applicable for nanofluids with a lower concentration of nanoparticles (0.01 to 0.5 vol %) and uniform dispersion. Nevertheless, these models do not represent the correlation between thermophysical properties and shape; temperature and the high cost is the obstacle for practical applications. The measurement of thermophysical properties of nanofluids for a specific temperature, concentration, size and shape requires a lot of time, huge data and money. In order to overcome these issues, many scholars have suggested computational frameworks or empirical models for the prediction of nanofluid properties. The easiest way to determine the thermophysical properties of various nanofluids is by utilizing soft computational approaches such as Artificial Neural Networks (ANNs) and Genetic Algorithms (GA) which require a massive quantity of data for analysis.
Computational networks that involve the simulation of nerve cells or neurons of the network that mimic the central biological nervous system are known as Artificial Neural Networks. These are incredibly easy in computation and algorithmic types and have a self-organizing function that helps them to solve several problems. One of the important roles of ANNs is that they enable high-level programming in their gross imitation of a biological network to facilitate the solution of complex issues especially nonanalytical, nonlinear and nonstationary in a self-organizing way that can be implied to resolve a large number of problems. Ma et al. [15] developed ANN models of viscosity and thermal conductivity based on the distribution of nanoparticles in nanofluids that can also be termed as Uniformity Coefficient of Nanoparticles Distribution (UCND). Authors found that the results projected by the ANN models are compatible with the experimental values with R2 values of more than 0.97 for viscosity and thermal conductivity. Toghraie et al. [16] predicted the viscosity of silver/EG nanofluids using the ANN technique that comprised data points of 42 samples at various temperatures (25–55 °C) and volume fractions (0.25–2%) and validated with the correlation method where they obtained a maximum deviation of 0.0858. A dissimilar ANN was proposed by Akhgar et al. [17] to determine the thermal conductivity of hybrid nanofluids (MWCNT-TiO2/Water-EG) through sensitivity analysis which proved that the empirical results obtained by the ANN technique were better than the correlation-based results. Sadeghi et al. [18] utilized the ANN technique to verify the experimental results of thermal characteristics (energy and exergy) of Copper oxide/Water nanofluid in an evacuated tube solar collector via multilayer perceptron (MLP) and radial basis function (RBF). Authors observed that the MLP models’ maximum error rate was smaller than the RBF model. A multiobjective optimization model comprising an ANN and GA was developed by Bagherzadeh et al. [19] to predict the thermophysical properties and heat transfer coefficient (HTC) of CuO/Paraffin nanofluid with a view on increasing the HTC and decreasing the pressure drop ratio. Finally, they concluded that the multiobjective optimization test results from the genetic algorithm revealed the optimal front of Pareto was responsible for enhancing the heat transfer coefficient. The effects of temperature and volume fraction on the thermal conductivity of MWCNT-CuO/Water nanofluid were considered for the development of an ANN and SVR (Support Vector Regression) to compare the persistence of accuracy, precision and generalization. They clearly demonstrated that the generalization of SVR is more useful than the ANN because it requires only fewer parameters with better endurance to overfitting. Naphon et al. [20] investigated the heat transfer and flow characteristics of titanium/deionized water nanofluids numerically (Eulerian two-phase approach), experimentally and with ANN (Levenberg–Marquardt back-propagation training algorithm). In all the cases, the average variance between the calculated and forecasted data was 1.25%.
As discussed above, several researchers have investigated the thermophysical properties of nanofluids in different systems. In addition, many researchers focused on the application of ANNs to nanofluid-based thermal systems due to their complex problem-solving capacity with less cost and time. In the present work, experimental data are obtained from the available literature [21] where the thermophysical properties of six different nanofluids containing Multiwalled Carbon Nanotubes (MWCNT) nanoparticles dispersed in propylene glycol, ethanol, ethylene, polyethylene glycol, methanol and water with SDBS surfactant at 0.5 wt % nanoparticle concentration was studied. No general model is currently available to reliably estimate a broad variety of effective parameters for MWCNT nanofluids. While various researches were performed to predict the thermophysical properties of nanofluid using ANN, those were only for thermal conductivity and viscosity. Along with thermal conductivity and stability, properties such as specific heat capacity, thermal stability, light absorption and transmission were also investigated using ANN in this research. The purpose of this study is to evaluate the thermophysical properties of MWCNT nanofluids with ANN. The results acquired from the experimental data are verified with ANN and compared with regression analysis.
2. Methodology
2.1. Experimental Process
MWCNT nanoparticles with 10 nm diameter and 98% purity were used in this study. Six types of nanofluids were prepared by combining 0.5 wt % MWCNT nanoparticles with six different kinds of solvents namely propylene glycol, ethanol, ethylene glycol, polyethylene glycol, methanol and water in the presence of SDBS surfactant. The proportion of nanoparticles and surfactants was in the ratio of 10:1. In order to obtain a stable nanofluid, surfactant was added to the studied samples and it was subjected to a magnetic stirring of 15 min. Each mixture was ultrasonicated for about 150 min with 60% amplitude. Figure 1 depicts the process of synthesizing MWCNT nanofluids via a two-step method where S1 (Sample 1), S2 (Sample 2), S3 (Sample 3), S4 (Sample 4), S5 (Sample 5) and S6 (Sample 6) represent MWCNT/PG, MWCNT/Ethanol, MWCNT/Ethylene glycol, MWCNT/Polyethylene glycol, MWCNT/Methanol and MWCNT/Water nanofluids, respectively.
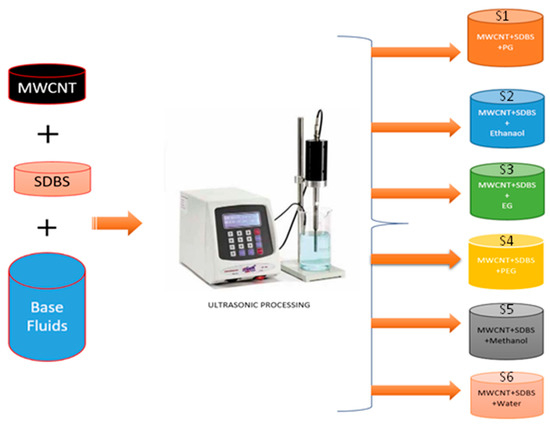
Figure 1.
Preparation process of Multiwalled Carbon Nanotubes (MWCNTs) nanofluids.
To measure the thermal conductivity of the samples as a function of temperature, a KD2 pro thermal conductivity meter was utilized. A constant temperature water bath was used to control the temperature of the samples. Differential scanning calorimeter, Thermogravimetric analyzer, viscometer, FTIR (Fourier Transform Infrared Spectroscopy) and UV–vis spectrophotometer were used to characterize the required properties of the formulated samples. All the equipment was calibrated with distilled water to ensure the accuracy of the results. The data obtained from these experiments were taken as datasets to develop the proposed ANN model.
2.2. ANN Model Development
ANNs are artificial biological brain network-based machine systems inspired by animal brain networks. These programs learn to do tasks by taking examples into account, typically without complex programming. ANN also has self-learning capabilities that enable it to produce better results as more data becomes available.
The methodology of the present work started with the data collected from the experimental results conducted in the previous study [21]. The collected data were analyzed; the inputs and outputs were selected accordingly. The parameters such as temperature, concentration, size, and time were selected as inputs whereas the thermophysical properties such as thermal conductivity, thermal stability, specific heat capacity, viscosity, light absorption and transmission were considered as outputs for the neural network development. The overall experimental data were divided for training, testing and validation purposes with percentages of 65% training dataset, 25% testing dataset and 10% validation datasets, respectively. The proposed ANN models were trained based on the Levenberg–Marquardt (LM) algorithm using the divided training datasets. Later the models were tested and validated with divided testing and validation datasets. The proposed neural network (NN) results were then compared with other statistical regression techniques for the performance evaluation of the current study. The complete method of the present study is presented in Figure 2.
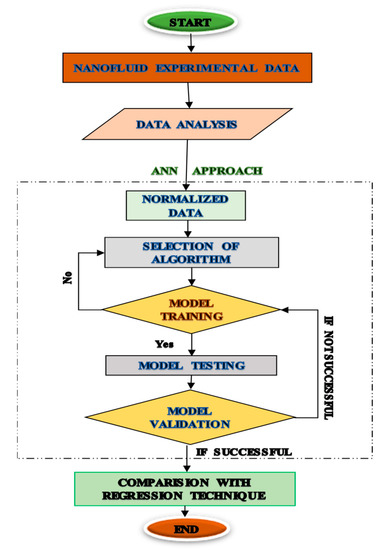
Figure 2.
Methodology of the proposed Artificial Neural Network (ANN).
During the development of the NN model, the parameters such as diameter, material type (MWCNT), concentration, temperature and time were given as inputs whereas the properties of nanofluid were taken as outputs. The typical ANN architecture is represented in Figure 3. The first layer consists of input parameters considered for the study, the hidden layer consists of hidden neurons and the output layers consist of the properties of tested nanofluids.
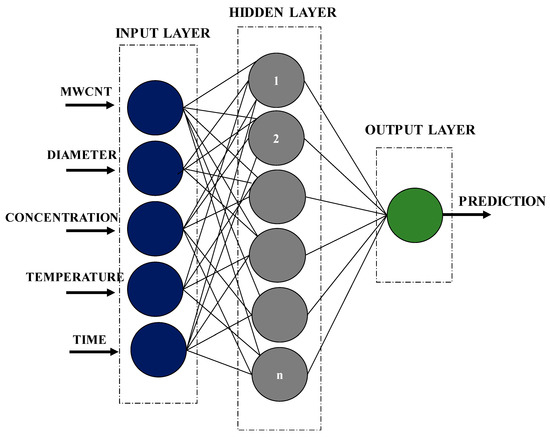
Figure 3.
Proposed ANN architecture.
In the present work, MATLAB R2019a software was used for model development. The algorithms such as Levenberg–Marquardt (LM) and Bayesian Regularization (BR) were selected in order to obtain the maximum coefficient of determination (R2) value. The proposed models were trained with the selected algorithms for the least possible error [22,23,24,25]. The LM algorithm resulted in better accuracy and is described as an iterative process that locates the smallest of a multivariate function that is stated as the sum of squares of nonlinear real-valued functions. The LM algorithm is suitable for nonlinear problems and applicable to various disciplines. Here, the weights of the neurons play a major role to get the desired output with the least possible error. The weight values were multiplied with input values and added with bias as given in Equation (1) [26]. Upon the completion of the training, the testing and validation of the model using the divided training, testing and validation datasets were utilized to predict the properties; and the results were compared with other regression techniques. Finally, the comparative analysis was carried out with better performing regression techniques such as linear regression, regression tree, support vector regression and Gaussian process regression. The better regression technique based on the results provided, the selected regression technique, was considered in comparison with the proposed ANN approach.
where Xnew is new value of a variable, w is the weight value, x is initial value and b is bias.
3. Results and Discussion
An artificial network was developed based on the experimental data of the available literature. These experimental data were divided into three groups as discussed earlier. For training, 65% was taken, 25% was used for testing and 10% was utilized for validation. The trial and error method was carried out to select the best values for the numbers of neurons and hidden layers. Various numbers of layers and neurons were checked, and their statistical metrics were determined. It was found that the network with 10 hidden neurons gave the best-desired outputs. The Mean Square Error (MSE) and coefficient of determination (R2) values were calculated using Equations (2) and (3) [27] and the results are presented in Table 1.
where n is number of sample values, yip is predicted value, yia is actual value and yavg is average of actual values.

Table 1.
MSE and R2 values of the studied samples.
The performance of ANN models during the training process for all thermophysical properties can be seen in Figure 4. It was observed that the best performance during the training of proposed models for all properties has varied. The best performance for properties such as thermal conductivity, thermal stability, specific heat capacity, viscosity, transmittance and absorption was observed at 9, 168, 975, 11, 53 and 131 epochs, respectively. It was also recorded the best performance with MSE values of 0.00075529, 0.00000056813, 0.000015205, 0.0000000019822, 0.82242 and 12.8467 for the properties of thermal conductivity, thermal stability, specific heat capacity, viscosity, transmittance and absorption, respectively.
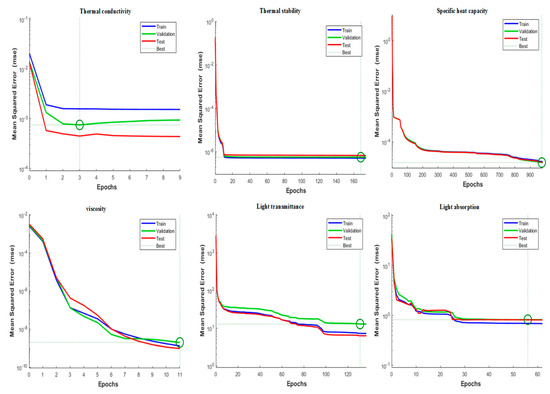
Figure 4.
Performance summary plot.
3.1. Thermal Conductivity
The significance of thermal conductivity in nanofluids has increased in recent years due to the need for an appreciable level of thermal conductance in circuit boards, heat exchangers and machinery. Due to these needs, theoretical developments were revisited and new data generated to eliminate some of the questions raised regarding the accuracy of measured data using ANN. The data used for the present study were tested with different regression techniques that are available in the MATLAB 2019a software. The results obtained with the values of RMSE (Root Mean Square Error), R2 (coefficient of determination), MSE (Mean Square Error), MAE (Mean Absolute Error) for thermal conductivity using different techniques are summarized in Table 2. It was found that the regression techniques resulted in weird results when compared to the proposed ANN approach in terms of thermal conductivity prediction.
Table 2.
Comparison of thermal conductivity validation results with other techniques.
The tested NN model is given a random data number of values to predict the behavior of individual sample properties. The experimental input values were given to a model that are unknown to a model for estimating the thermal conductivity property. The plots were generated for each sample to identify the variations in thermal conductivity. A summary of all validation plots for six samples is presented in Figure 5. The black line represents the experimental dataset of values and the red dotted line represents the predicted values. It can be seen from the plots that the error is smaller between the actual and predicted values as shown in Figure 5. Among all the samples, the major error is observed in Sample 4 (MWCNT/PEG), as the variations between the actual and predicted values are slightly higher when compared with other samples. From the results, it was clear that the obtained ANN outputs were in good agreement with the experimental data which illustrated the accurate prediction of thermal conductivity for the studied MWCNT nanofluids.
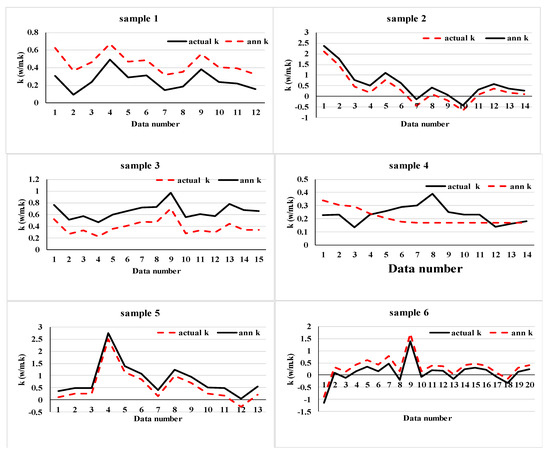
Figure 5.
Thermal conductivity validation plots of ANN end experimental data.
3.2. Thermal Stability
Under high-temperature ranges, the nanoparticle core undergoes irreversible changes that result in the transition of structural, electrical and phase properties. Thermogravimetric analysis was performed to evaluate the loss of mass as a function of temperature where thousands of data were generated. With different techniques, the thermal stability data were verified and its results are summarized in Table 3. It was observed that the regression techniques provided acceptable results when compared to the proposed ANN approach in predicting the thermal stability of all the six samples.
Table 3.
Comparison of thermal stability validation results with other techniques.
In order to optimize it, the proposed NN model was given a set of data numbers to predict the behavior of thermal stability. More than 50 sets of values are introduced to the model to predict the output. It is found that the model predicted the actual values most accurately with minor errors in all samples. However, there is a slight variation in Sample 6 (MWCNT/Water) case as the error is slightly more when compared to other samples. The red dotted line represents the predicted behavior while the black line represents the actual behavior of thermal stability. A summary of all validation plots for thermal stability is shown in Figure 6.
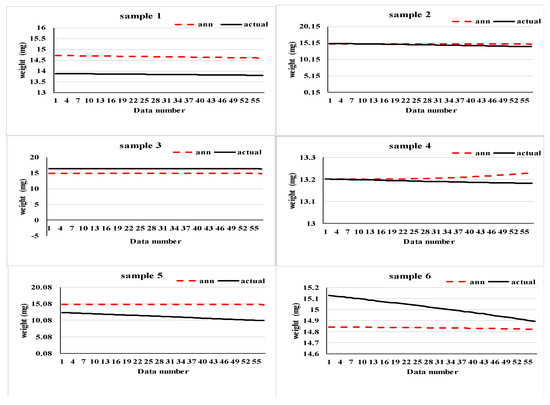
Figure 6.
Thermal stability validation of experimental and ANN values.
3.3. Specific Heat Capacity
The quantity of heat required to raise the temperature of a substance is known as heat capacity and it acts as a relation for the input of heat and increase in temperature. At present, no empirical relationships were successful in providing reliable estimates of heat capacities for nanofluids. In order to verify the measured specific heat capacity data, many techniques were followed, and its results are presented in Table 4. From the results obtained using different regression techniques, the results are found to be consistent in terms of specific heat capacity prediction.
Table 4.
Comparison of specific heat capacity validation results with other techniques.
Accurate experimental data for the heat capacities of nanofluids are therefore essential. The ANN model is allowed to predict a set of values for a given experimental set of values. A summary of all validation plots of specific heat capacity for all the samples is represented in Figure 7. From the figure, it can be observed that the error deviation between the actual and ANN value of Sample 2 (MWCNT/Ethanol) was higher than the other samples.
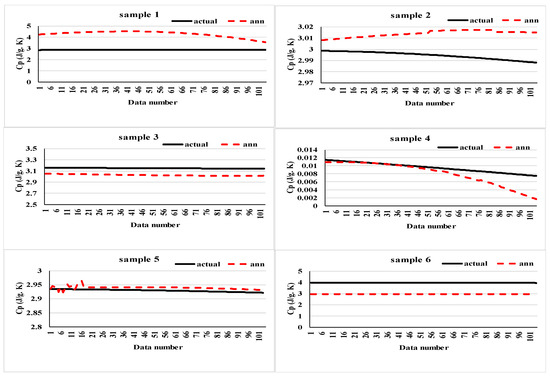
Figure 7.
Specific heat capacity validation with the ANN and measured values.
3.4. Viscosity
When the temperature gradient is present in a substance, it is well understood that a transportation process takes place with this material. This transport mechanism is a permanent mechanism in which the property will change over time where structural differences occur within the material. Viscosity is the well-known transportation process of momentum, mass and energy that should be given significant importance. The deviation of results with other techniques for viscosity is depicted in Table 5. It can be clearly seen that the regression techniques provided acceptable results for the viscosity prediction.
Table 5.
Comparison of viscosity validation results with other techniques.
This section explains the accuracy of the experimental data resulting from the momentum transport process that occurred in nanofluids when inflicted on certain shear stress via the ANN technique. The proposed ANN model performed well in predicting the new values for a given set of samples. A summary of all the validation plots is shown in Figure 8. Meanwhile, Sample 4 (MWCNT/PEG) and Sample 6 (MWCNT/Water) showed a slight variation between the experimentally measured actual value and the predicted ANN value while other samples have not revealed any appreciable changes.
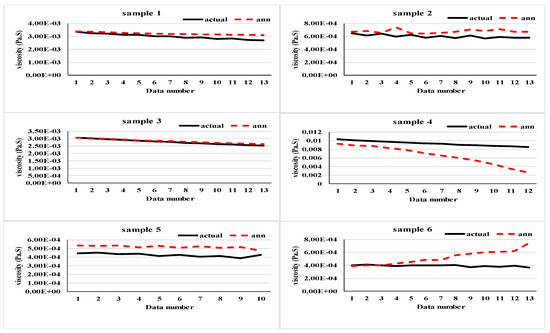
Figure 8.
Viscosity validation of ANN and experimental data.
3.5. UV–Vis Spectroscopy
One of the most popular methods for analyzing the type of molecule or elements present in a sample is UV–vis spectroscopy; here, light is passed through a sample and the absorbed light is measured. At different wavelengths, the sample exhibits a different absorbance spectrum illustrating the structure of a molecule. Furthermore, light absorbance can be used to detect the functional groups and different components of a sample. The data obtained from UV–vis were analyzed with different techniques and their results are portrayed in Table 6.
Table 6.
Comparison of UV–vis validation results with other techniques.
The predictions by ANN for all samples are represented graphically as shown in Figure 9. The variations can be observed from sample to sample. However, the proposed ANN model predicted the new values accurately for a given experimental dataset. Fluctuations are observed in the experimental (actual) value of all the samples which may be due to the high concentration of nanoparticles that does not allow light to pass through the samples effectively.
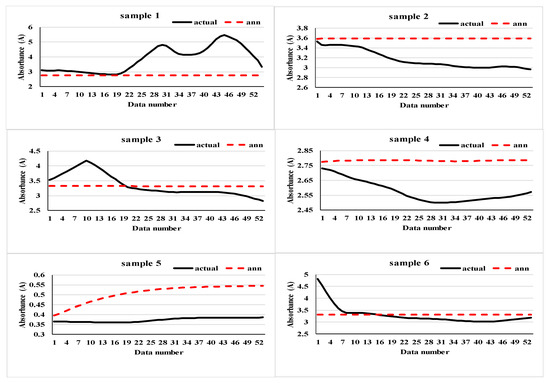
Figure 9.
Validation of experimental UV–vis data with ANN.
3.6. Fourier Transform Infrared Spectroscopy
The molecules of materials undergo vibration when they are irradiated with infrared radiation at different wavelengths that can be analyzed by Fourier Transform Infrared Spectroscopy (FTIR). Here, the intensity of reflected or transmitted light can be measured precisely to identify the molecular structure of samples. The energy difference between the constant and excited vibrational states of molecules results in the transmittance of light. The resulting FTIR values were predicted with other techniques to ensure their accuracy, as shown in Table 7.
Table 7.
Comparison of FTIR validation results with other techniques.
For the given experimental values, the proposed ANN model is able to predict the new values accurately. A summary of all the predicted vs. actual values plots for all samples is shown in Figure 10. Significant changes are observed in Sample 1 (MWCNT/PG) while other the samples’ actual values are inconsistent with the ANN values.
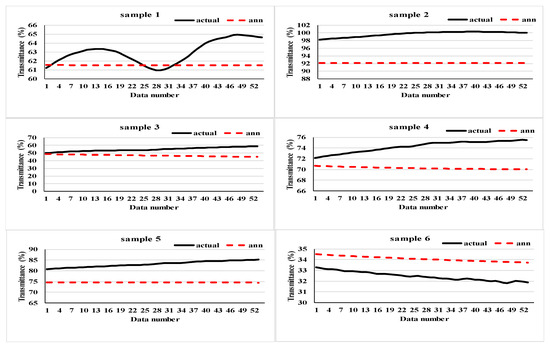
Figure 10.
FTIR spectra experimental results compared with ANN result.
3.7. Comparison with Gaussian Process Regression Analysis
It is important to check the performance and robustness of a proposed model. From the comparison results of Table 2 and Table 7, it was found that Gaussian Process Regression (GPR) performed better than the other techniques in predicting the target values. Hence, a comparison analysis is performed to identify the behavior change of all the individual properties. Some random data numbers are picked from the experimental values and given to a proposed model to predict the new values. The same values are given to a GPR regression model to predict the new values because of the reason that GPR performed better among the other techniques in comparison to a given training data. The comparison test is conducted for all thermophysical properties taking random values from all the six samples. It is identified that ANN predicted better than the GPR technique as the errors between the actual and predicted values are less when compared. It is also important to mention that GPR consumed more time for training and validation when compared with ANN. Therefore, ANN is found to be more appropriate and suitable for the present study. The red line represents the ANN predicted values, the navy blue line represents the experimental set of values and the sky-blue line represents the GPR predicted values as shown in Figure 11.
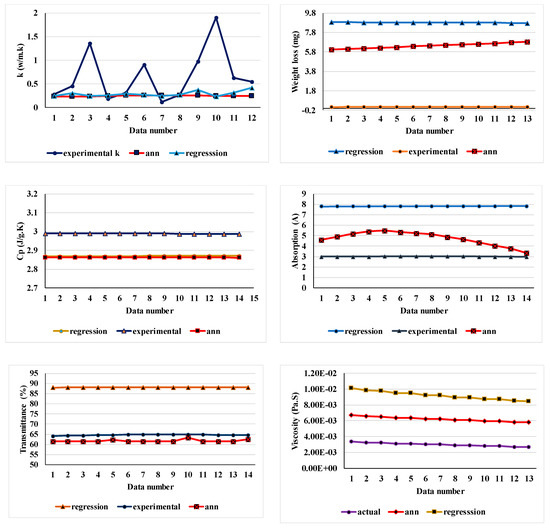
Figure 11.
Thermo physical properties comparison plot of ANN vs. Regression vs. experimental.
4. Conclusions
The major conclusions of this research are summarized as follows:
- The properties of MWCNT nanofluids are predicted using ANN that resulted in an average accuracy of 97.03%. Furthermore, viscosity obtained a maximum prediction accuracy of 99% while specific heat capacity resulted in a minimum accuracy of 93.7%. Moreover, the other properties such as thermal stability, FTIR, thermal conductivity, UV–vis showed an accuracy of 98.1%, 97.3%, 97.7% and 96.4%, respectively.
- The abnormal variation of the thermophysical properties of MWCNT nanofluids with different artificial techniques in the temperature ranged from 25 to 200 °C with 0.5 wt % was evaluated.
- Through the experimental results of six different nanofluids, an LM-based ANN model was made.
- With the inputs of temperature, concentration, nanomaterial type and size, the proposed ANN model illustrated a good consistency with the measured experimental data (R2 was almost close to one).
- The proposed ANN approach was compared with the different regression techniques to evaluate the performance of the model.
- This study allows researchers to analyze their models for predicting the thermophysical properties of MWCNT nanofluids.
- This research helps in minimizing the experimental time and cost for future work.
Author Contributions
Conceptualization, N.B.S. and B.B.; methodology, N.B.S.; software, N.B.S.; validation, N.B.S.; formal analysis, B.B. and P.B.H; investigation, P.B.H.; resources, P.B.H.; data curation, B.B.; writing—original draft preparation, B.B. and N.B.S.; writing—review and editing, B.B. and N.B.S.; visualization, B.B. and N.B.S.; supervision, P.B.H. All authors have read and agreed to the published version of the manuscript.
Funding
The Article Processing Charge (APC) was funded by FRGS, grant number 015MAO-076.
Acknowledgments
The authors are grateful to Universiti Teknologi PETRONAS, Malaysia, for providing the facilities to perform this research work successfully.
Conflicts of Interest
The authors declare no conflicts of interest.
Nomenclature
| ANN | Artificial Neural Networks |
| BR | Bayesian Regularization |
| EG | Ethylene Glycol |
| MWCNT | Multiwalled Carbon Nanotubes |
| MLP | Multilayer Perceptron |
| SDBS | Sodium Dodecyl Benzene Sulfonate |
| GA | Genetic Algorithms |
| RBF | Radial Basis Function |
| HTC | Heat Transfer Coefficient |
| SVR | Support Vector Regression |
| FTIR | Fourier Transform Infrared Spectroscopy |
| UV–vis | Ultraviolet Visual |
| GPR | Gaussian Process Regression |
| LM | Levenberg–Marquardt |
| NN | Neural Network |
| RMSE | Root Mean Square Error |
| MSE | Mean Square Error |
| MAE | Mean Absolute Error |
| UCND | Uniformity Coefficient of Nanoparticles Distribution |
References
- AL Muallim, B.; Wahid, M.A.; Mohammed, H.A.; Kamil, M.; Habibi, D. Thermal—Hydraulic Performance in a Microchannel Heat Sink Equipped with Longitudinal Vortex Generators (LVGs) and Nanofluid. Processes 2020, 8, 231. [Google Scholar] [CrossRef]
- Kimpton, H.; Cristaldi, D.A.; Stulz, E.; Zhang, X. Thermal performance and physicochemical stability of silver nanoprism-based nanofluids for direct solar absorption. Sol. Energy 2020, 199, 366–376. [Google Scholar] [CrossRef]
- Soylu, S.K.; Atmaca, İ.; Asiltürk, M.; Doğan, A. Improving heat transfer performance of an automobile radiator using Cu and Ag doped TiO2 based nanofluids. Appl. Therm. Eng. 2019, 157, 113743. [Google Scholar] [CrossRef]
- Li, X.; Zeng, G.; Lei, X. The stability, optical properties and solar-thermal conversion performance of SiC-MWCNTs hybrid nanofluids for the direct absorption solar collector (DASC) application. Sol. Energy Mater. Sol. Cells 2020, 206, 110323. [Google Scholar] [CrossRef]
- Selvaraj, V.; Krishnan, H. Synthesis of graphene encased alumina and its application as nanofluid for cooling of heat-generating electronic devices. Powder Technol. 2020, 363, 665–675. [Google Scholar] [CrossRef]
- Sint, N.K.C.; Choudhury, I.A.; Masjuki, H.H.; Aoyama, H. Theoretical analysis to determine the efficiency of a CuO-water nanofluid based-flat plate solar collector for domestic solar water heating system in Myanmar. Sol. Energy 2017, 155, 608–619. [Google Scholar] [CrossRef]
- Ham, J.; Kim, J.; Cho, H. Theoretical analysis of thermal performance in a plate type liquid heat exchanger using various nanofluids based on LiBr solution. Appl. Therm. Eng. 2016, 108, 1020–1032. [Google Scholar] [CrossRef]
- Jia, Y.; Ran, F.; Zhu, C.; Fang, G. Numerical analysis of photovoltaic-thermal collector using nanofluid as a coolant. Sol. Energy 2020, 196, 625–636. [Google Scholar] [CrossRef]
- Saba, F.; Noor, S.; Ahmed, N.; Khan, U.; Mohyud-Din, S.T.; Bano, Z.M.; Sherif, E.-S.; Khan, I. Heat Transfer Enhancement by Coupling of Carbon Nanotubes and SiO2 Nanofluids: A Numerical Approach. Processes 2019, 7, 937. [Google Scholar] [CrossRef]
- Ahmed, Z.; Al-Qahtani, A.; Nadeem, S.; Saleem, S. Computational Study of MHD Nanofluid Flow Possessing Micro-Rotational Inertia over a Curved Surface with Variable Thermophysical Properties. Processes 2019, 7, 387. [Google Scholar] [CrossRef]
- Li, M.-J.; Li, M.-J.; He, Y.-L.; Tao, W.-Q. A novel semi-empirical model on predicting the thermal conductivity of diathermic oil-based nanofluid for solar thermal application. Int. J. Heat Mass Transf. 2019, 138, 1002–1013. [Google Scholar] [CrossRef]
- Sedaghat, F.; Yousefi, F. Synthesizes, characterization, measurements and modeling thermal conductivity and viscosity of graphene quantum dots nanofluids. J. Mol. Liq. 2019, 278, 299–308. [Google Scholar] [CrossRef]
- Charab, A.A.; Movahedirad, S.; Norouzbeigi, R. Thermal conductivity of Al2O3+TiO2/water nanofluid: Model development and experimental validation. Appl. Therm. Eng. 2017, 119, 42–51. [Google Scholar] [CrossRef]
- Bardool, R.; Bakhtyari, A.; Esmaeilzadeh, F.; Wang, X. Nanofluid viscosity modeling based on the friction theory. J. Mol. Liq. 2019, 286, 110923. [Google Scholar] [CrossRef]
- Ma, M.; Zhai, Y.; Wang, J.; Yao, P.; Wang, H. Statistical image analysis of uniformity of hybrid nanofluids and prediction models of thermophysical parameters based on artificial neural network (ANN). Powder Technol. 2020, 362, 257–266. [Google Scholar] [CrossRef]
- Toghraie, D.; Sina, N.; Jolfaei, N.A.; Hajian, M.; Afrand, M. Designing an Artificial Neural Network (ANN) to predict the viscosity of Silver/Ethylene glycol nanofluid at different temperatures and volume fraction of nanoparticles. Phys. A Stat. Mech. Appl. 2019, 534, 122142. [Google Scholar] [CrossRef]
- Akhgar, A.; Toghraie, D.; Sina, N.; Afrand, M. Developing dissimilar artificial neural networks (ANNs) to prediction the thermal conductivity of MWCNT-TiO2/Water-ethylene glycol hybrid nanofluid. Powder Technol. 2019, 355, 602–610. [Google Scholar] [CrossRef]
- Sadeghi, G.; Nazari, S.; Ameri, M.; Shama, F. Energy and exergy evaluation of the evacuated tube solar collector using Cu2O/water nanofluid utilizing ANN methods. Sustain. Energy Technol. Assessm. 2020, 37, 100578. [Google Scholar] [CrossRef]
- Bagherzadeh, S.A.; Sulgani, M.T.; Nikkhah, V.; Bahrami, M.; Karimipour, A.; Jiang, Y. Minimize pressure drop and maximize heat transfer coefficient by the new proposed multi-objective optimization/statistical model composed of “ANN + Genetic Algorithm” based on empirical data of CuO/paraffin nanofluid in a pipe. Phys. A Stat. Mech. Its Appl. 2019, 527, 121056. [Google Scholar] [CrossRef]
- Naphon, P.; Wiriyasart, S.; Arisariyawong, T.; Nakharintr, L. ANN, numerical and experimental analysis on the jet impingement nanofluids flow and heat transfer characteristics in the micro-channel heat sink. Int. J. Heat Mass Transf. 2019, 131, 329–340. [Google Scholar] [CrossRef]
- Bakthavatchalam, B.; Habib, K.; Saidur, R.; Shahabuddin, S.; Saha, B.B. Influence of solvents on the enhancement of thermophysical properties and stability of MWCNT nanofluid. Nanotechnology 2020, 31, 235402. [Google Scholar] [CrossRef] [PubMed]
- Vakili, M.; Karami, M.; Delfani, S.; Khosrojerdi, S. Experimental investigation and modeling of thermal radiative properties of f-CNTs nanofluid by artificial neural network with Levenberg–Marquardt algorithm. Int. Commun. Heat Mass Transf. 2016, 78, 224–230. [Google Scholar] [CrossRef]
- Wang, D.; Wang, Z.; Zhu, J.; Ciampa, F. Enhanced pre-processing of thermal data in long pulse thermography using the Levenberg-Marquardt algorithm. Infrared Phys. Technol. 2019, 99, 158–166. [Google Scholar] [CrossRef]
- Aucejo, M.; Smet, O. De An optimal Bayesian regularization for force reconstruction problems. Mech. Syst. Signal. Process. 2019, 126, 98–115. [Google Scholar] [CrossRef]
- Sun, Z.; Chen, Y.; Li, X.; Qin, X.; Wang, H. A Bayesian regularized artificial neural network for adaptive optics forecasting. Opt. Commun. 2017, 382, 519–527. [Google Scholar] [CrossRef]
- Basha, S.N.; Rao, P.S. A Simulated Model for Assesing the Line Condition of Onshore Pipelines. MATEC Web Conf. 2018, 225, 6003. [Google Scholar] [CrossRef][Green Version]
- Shaik, N.B.; Pedapati, S.R.; Taqvi, S.A.A.; Othman, A.; Dzubir, F.A.A. A Feed-Forward Back Propagation Neural Network Approach to Predict the Life Condition of Crude Oil Pipeline. Processes 2020, 8, 661. [Google Scholar] [CrossRef]


© 2020 by the authors. Licensee MDPI, Basel, Switzerland. This article is an open access article distributed under the terms and conditions of the Creative Commons Attribution (CC BY) license (http://creativecommons.org/licenses/by/4.0/).