Characterization of the Bulk Flow Properties of Industrial Powders from Shear Tests

 ,
, 
 ,
,
Abstract
:1. Introduction
2. Methodology
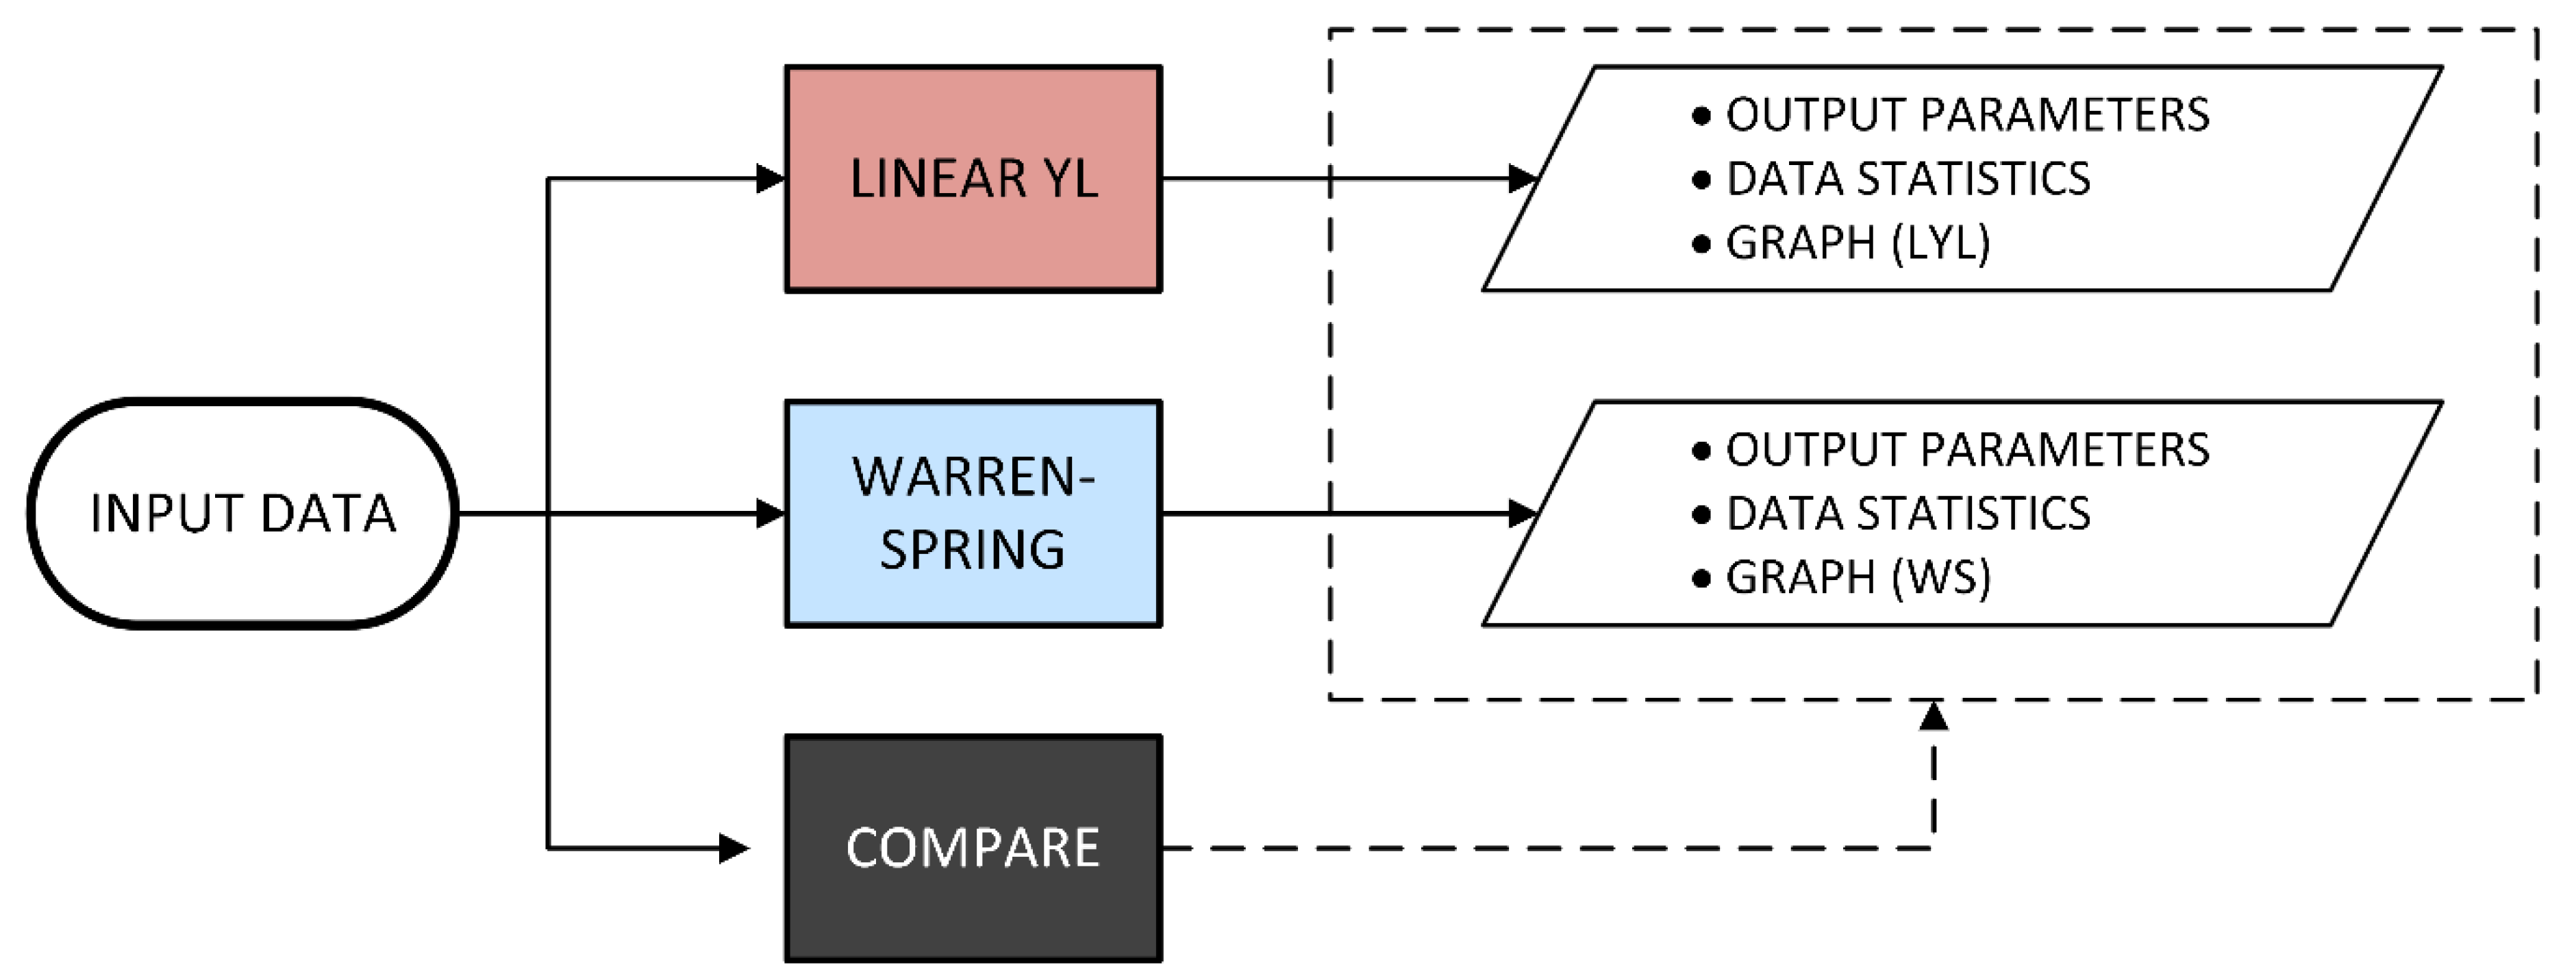
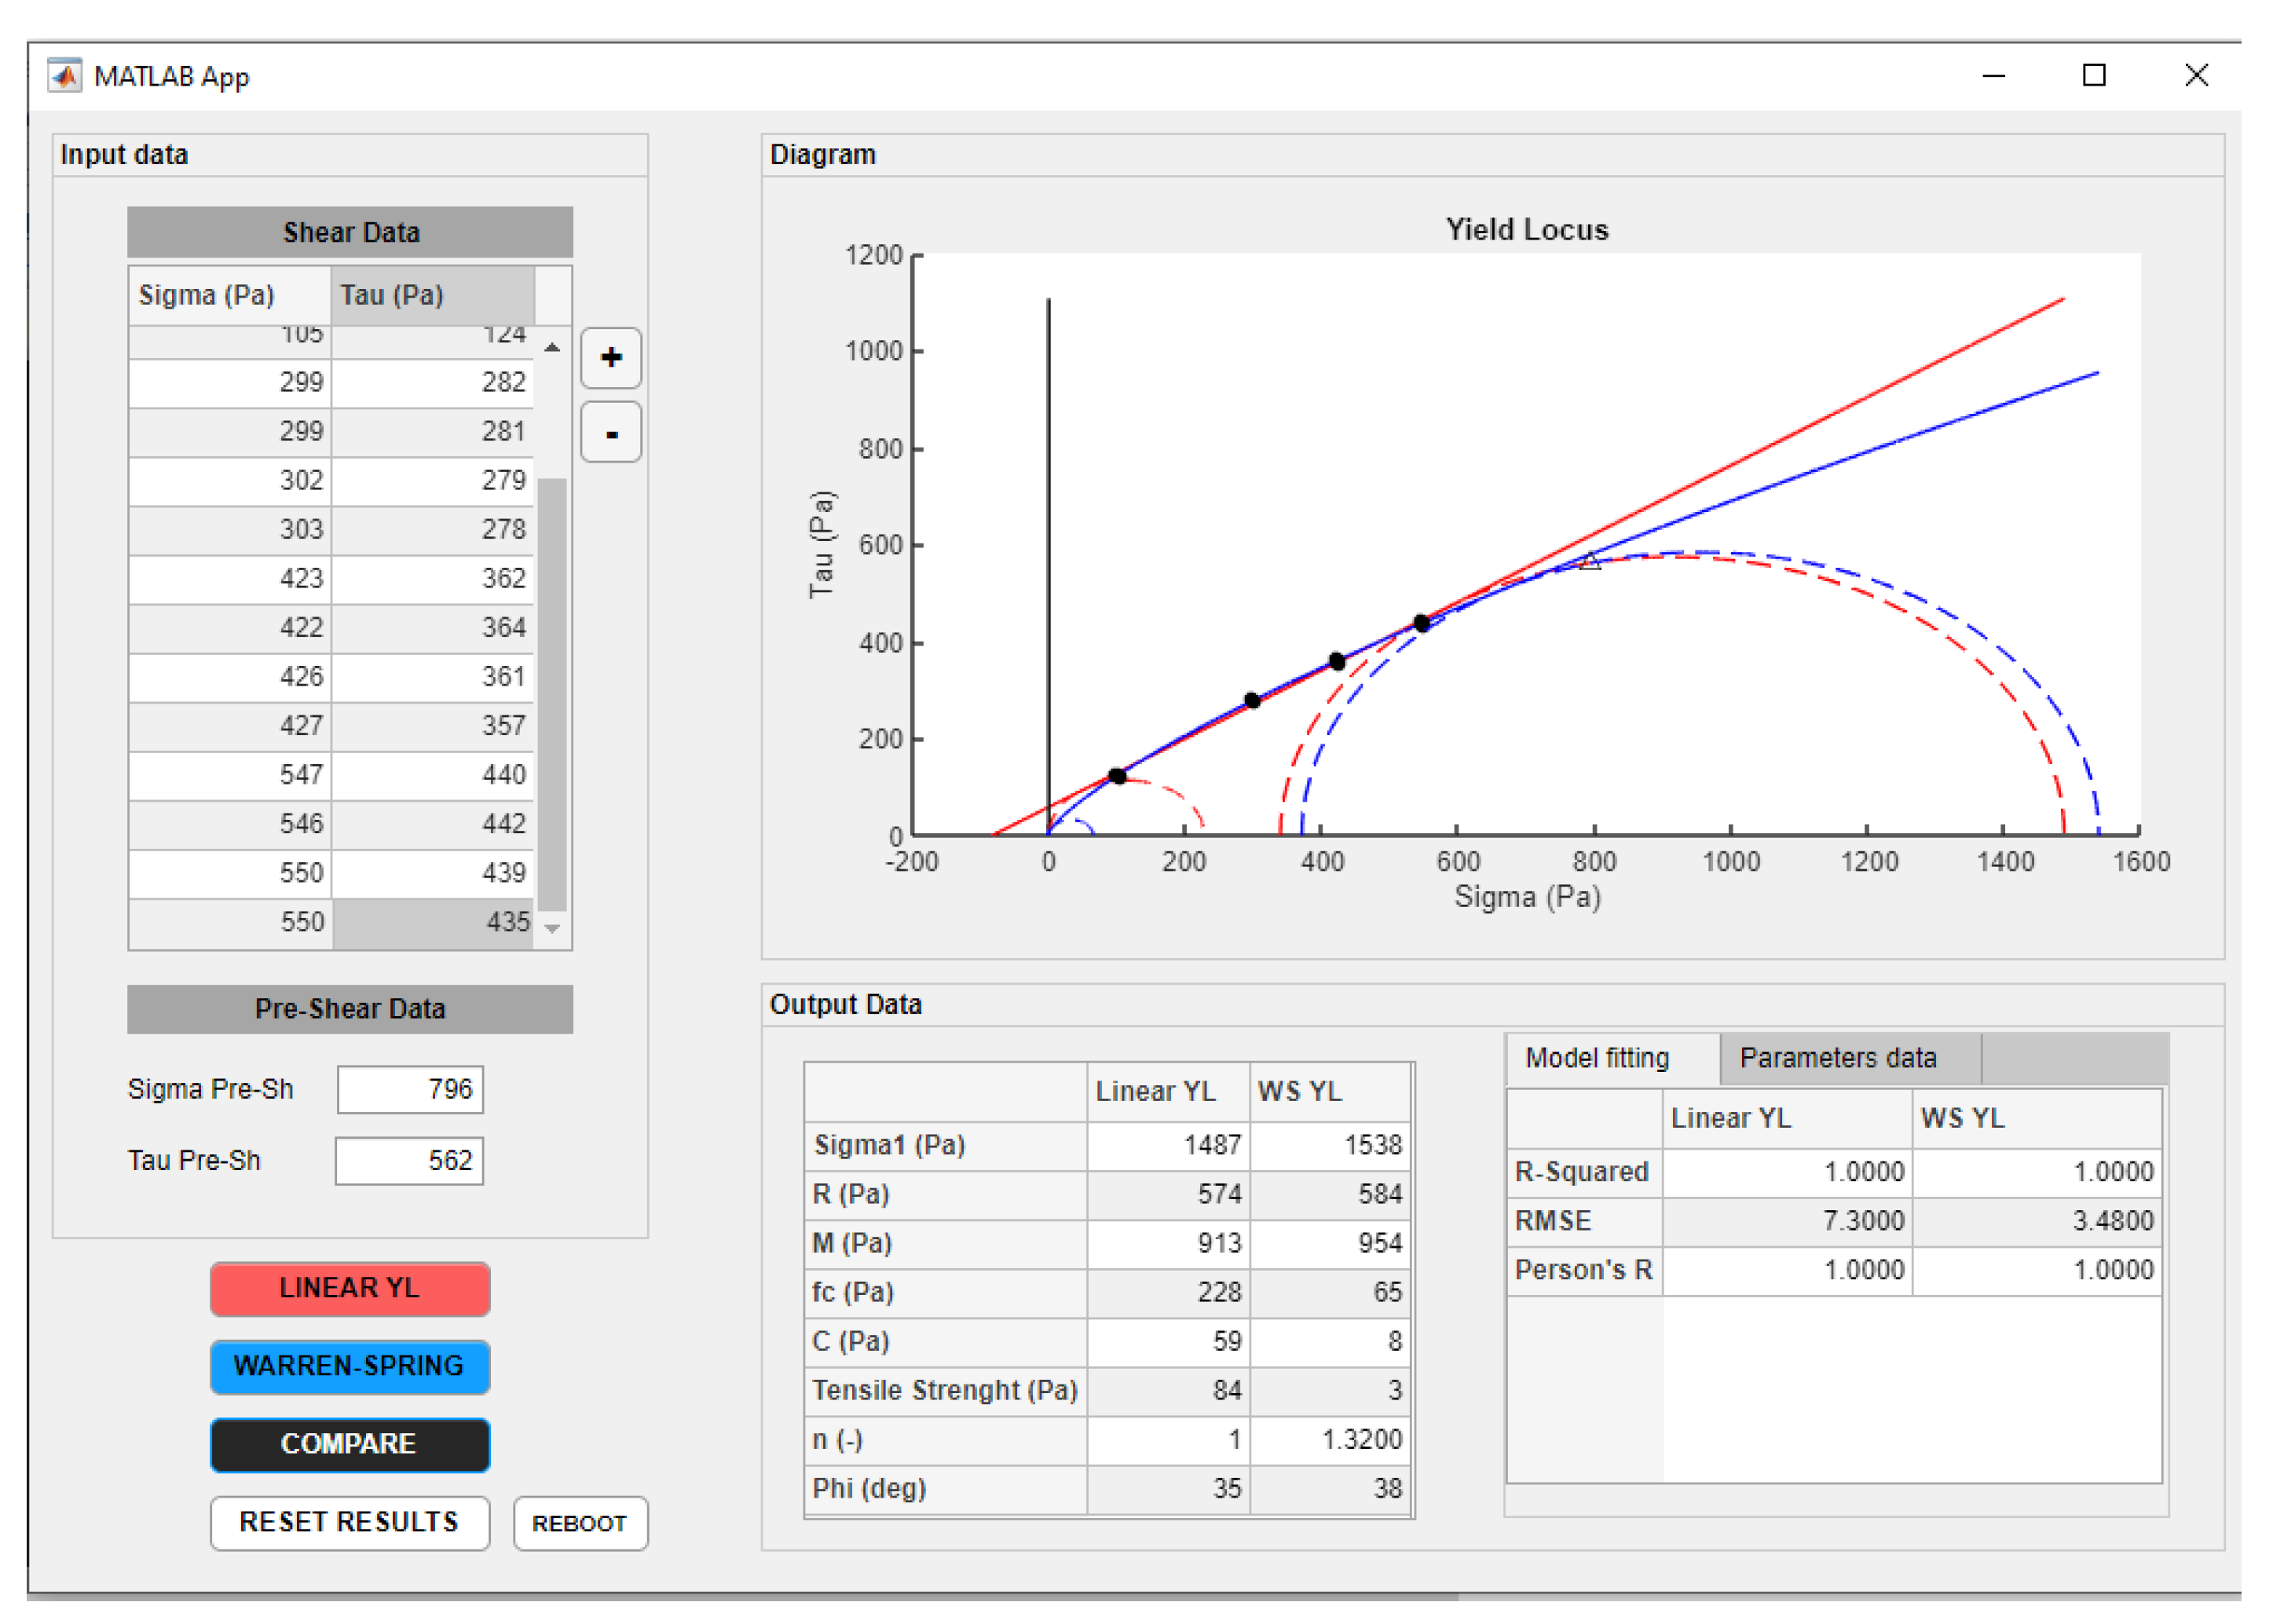
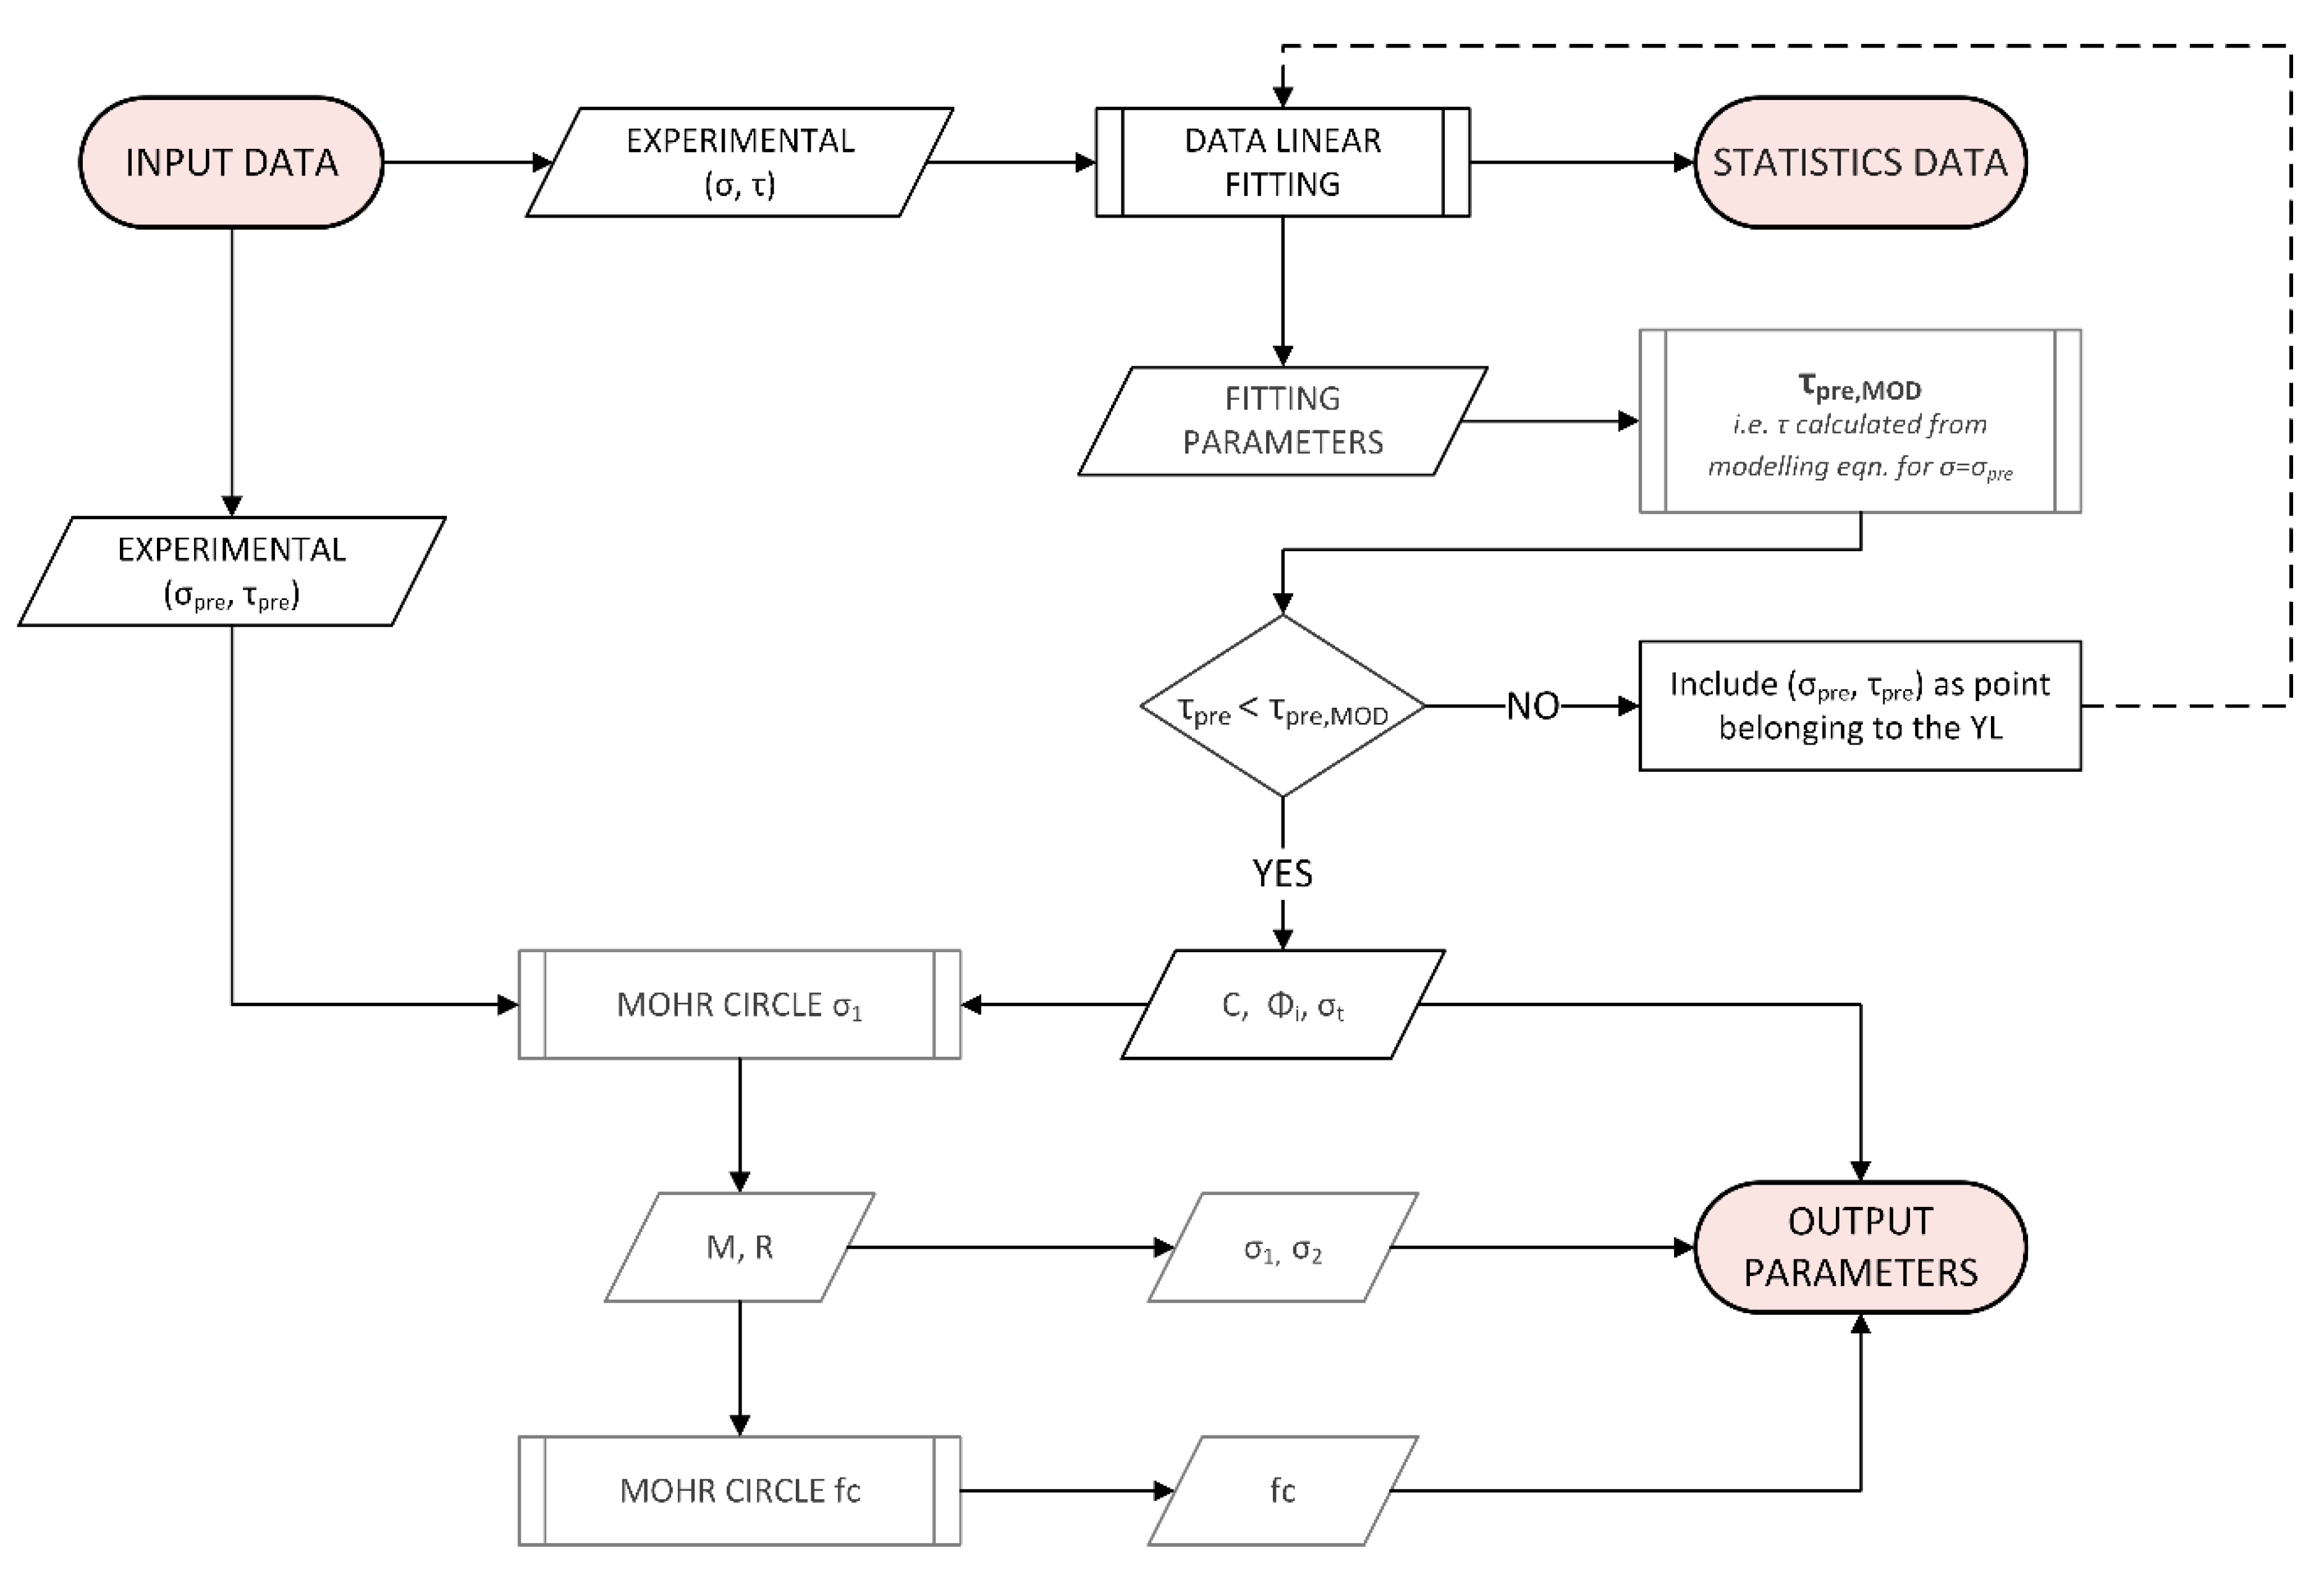
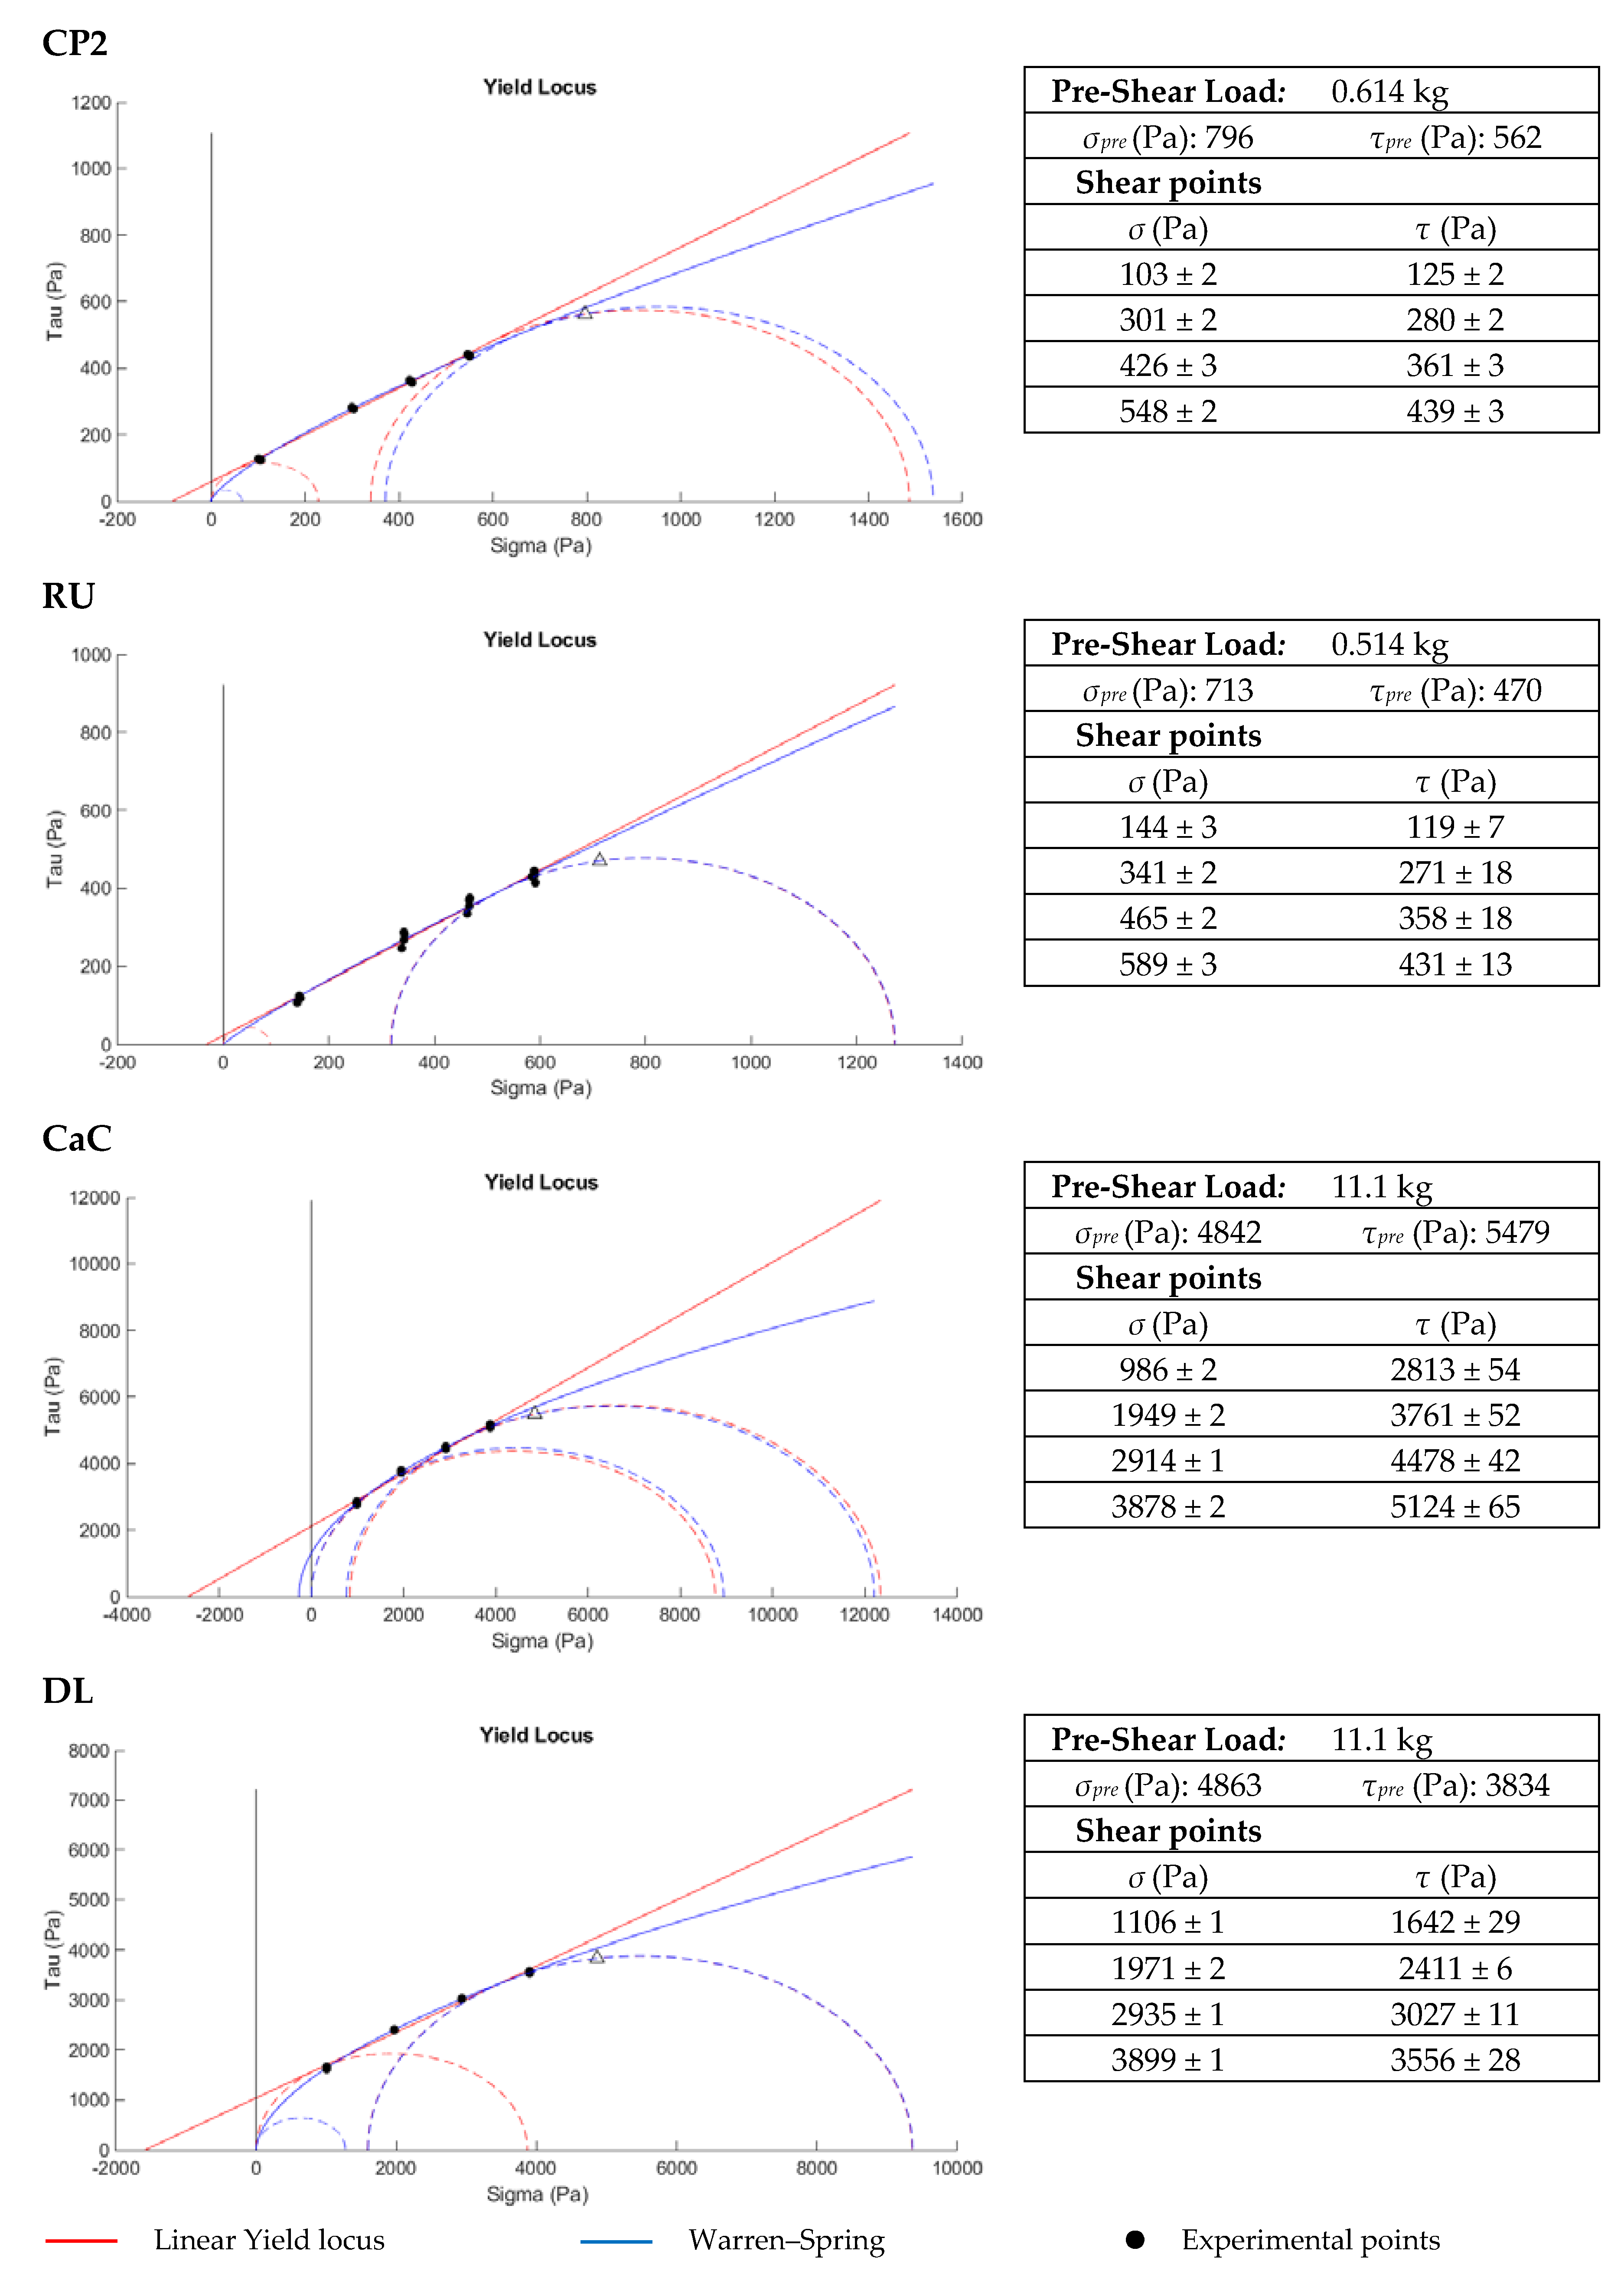
- Linear YL, which allows for the generation of a linear yield locus, the related consolidation Mohr circle and the related unconfined yield Mohr circle, starting from experimental data;
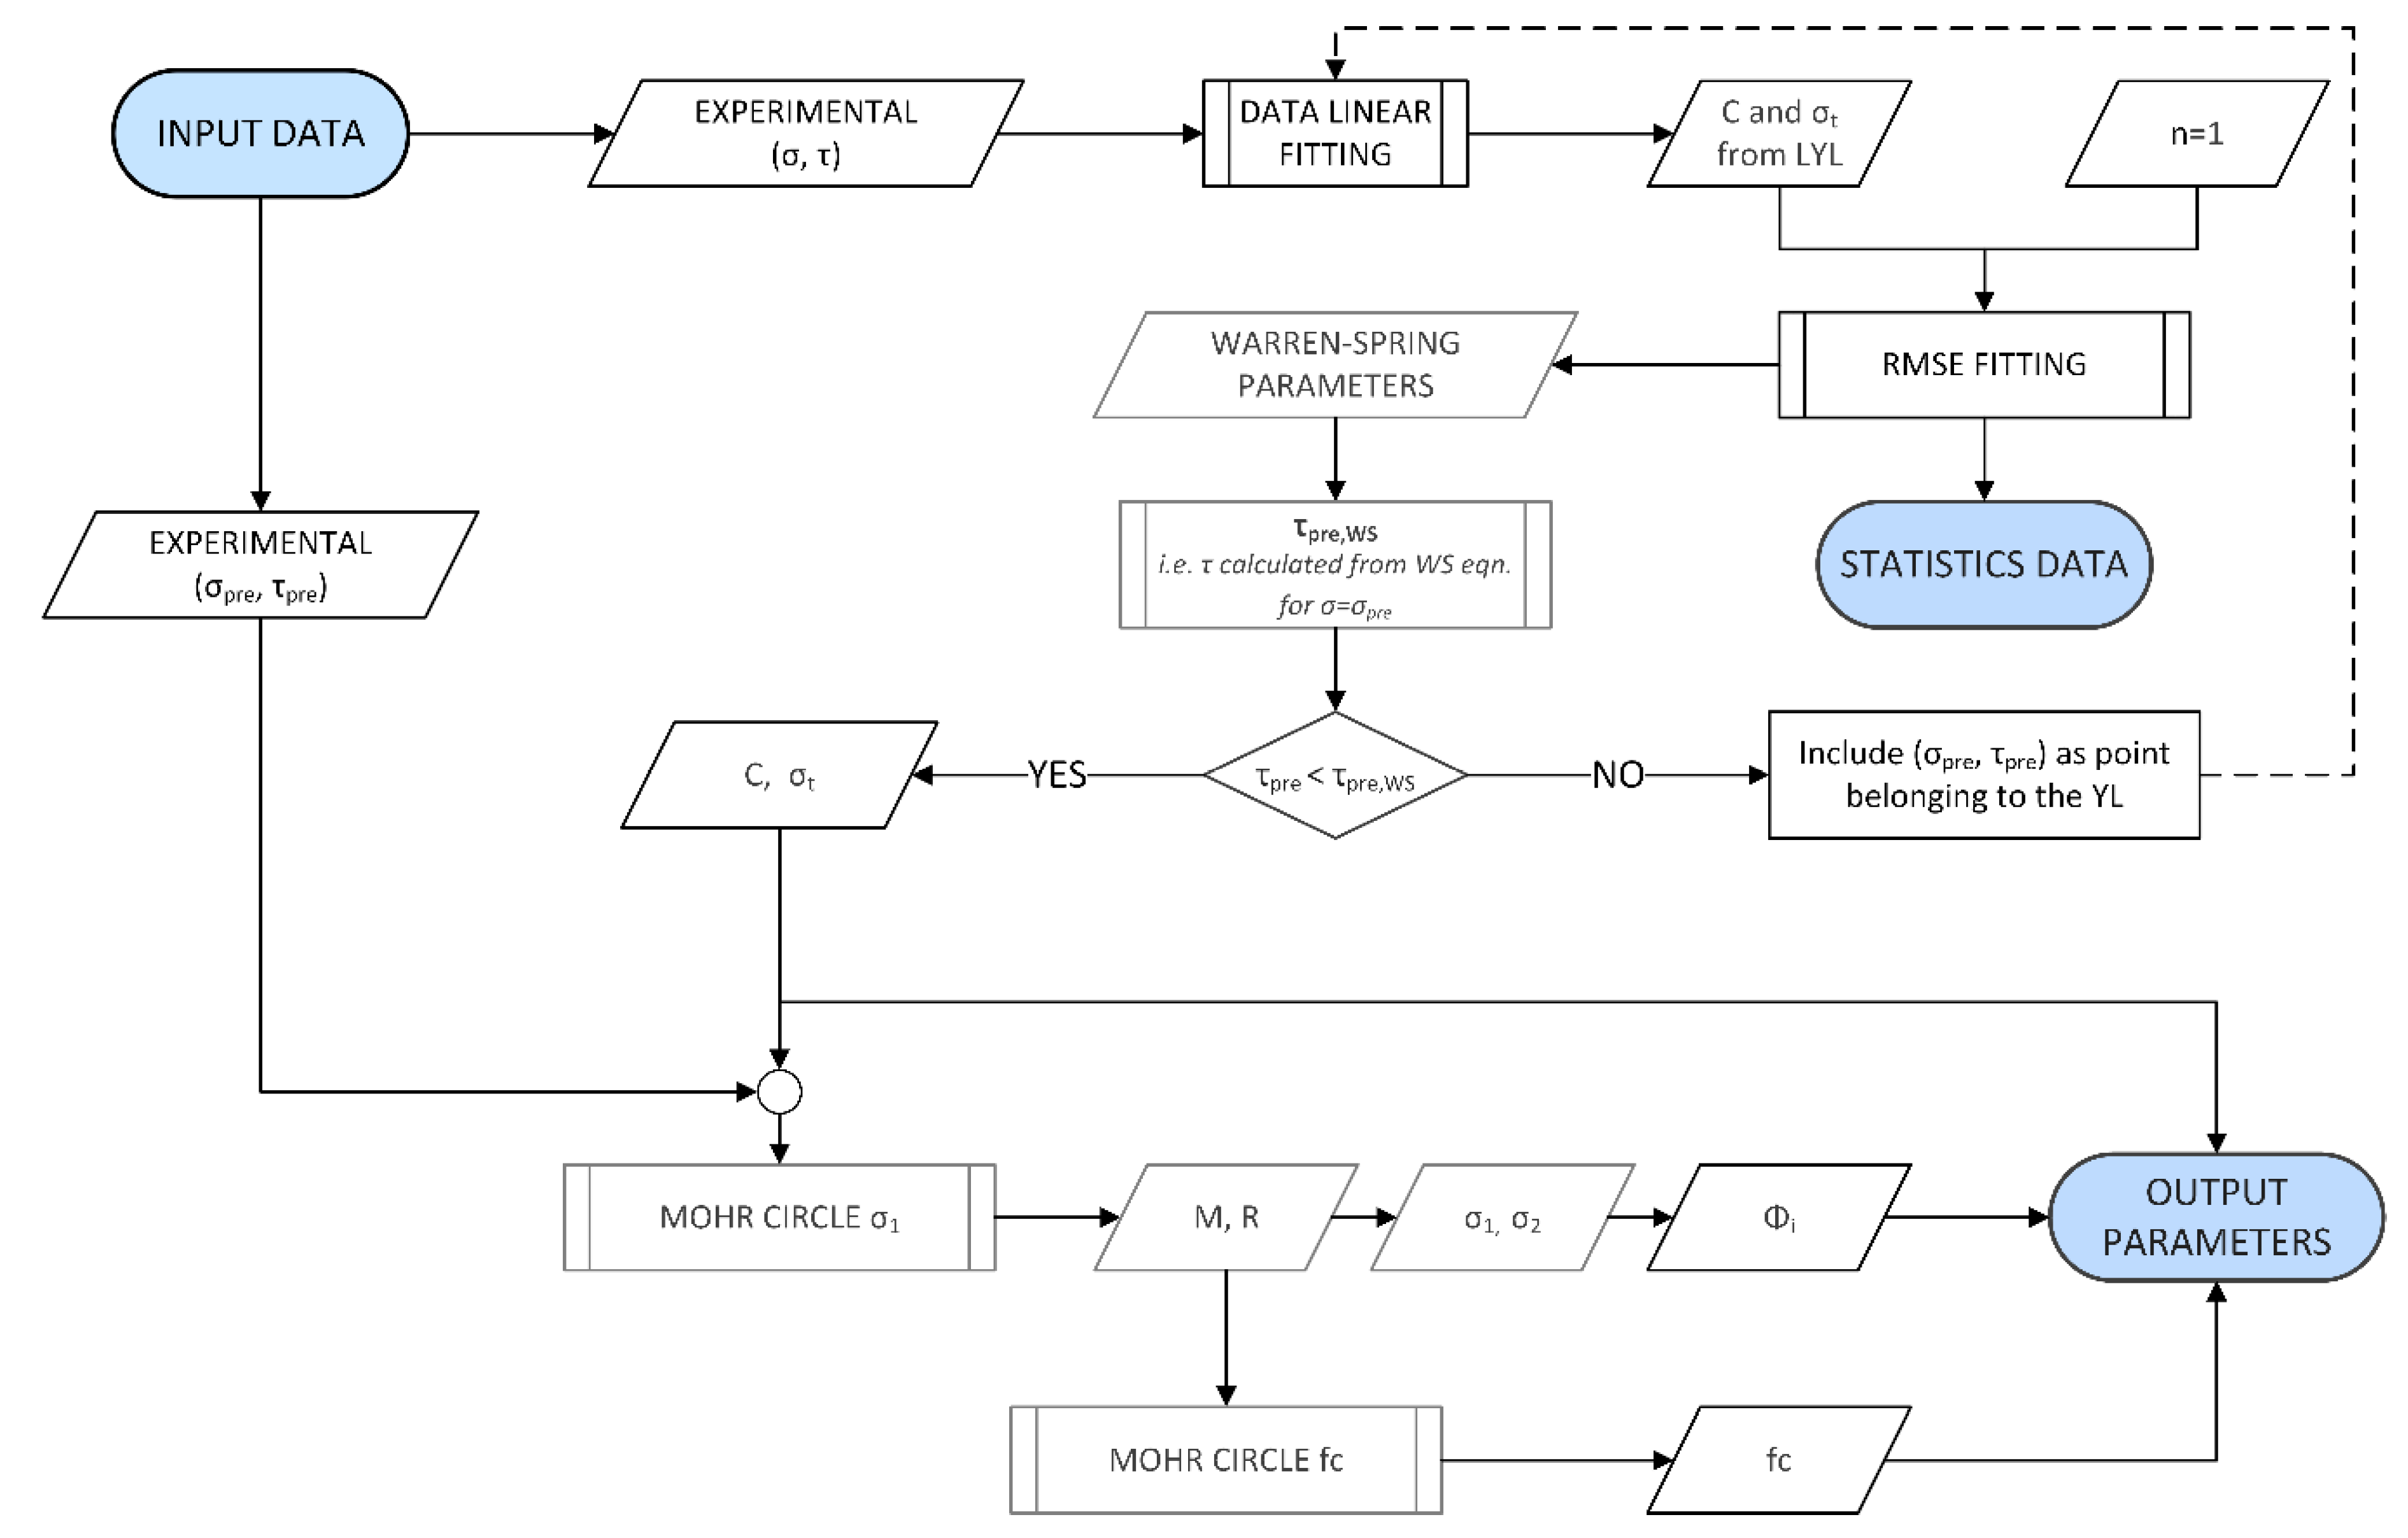
- Warren–Spring, which allows for the generation of the curved yield locus, the related consolidation Mohr circle and the related unconfined yield Mohr circle, starting from experimental data;
- Compare, which allows for the comparing of the results obtained by the two previous approaches.
3. Data Analysis Using cYield
4. Conclusions
Author Contributions
Funding
Conflicts of Interest
References
- Schulze, D. Powders and Bulk Solids: Behavior, Characterization, Storage and Flow; Springer Science & Business Media: Berlin, Gemany, 2007. [Google Scholar]
- Janssen, H.A. Versuche uber Getreidedruck in Silozellen. Z. des Ver. Dtsch. Ing. 1895, 39, 1045–1049. [Google Scholar]
- Carr, R.L. Evaluating flow properties of solids. Chem. Eng 1965, 72, 163–168. [Google Scholar]
- Molerus, O. Theory of yield of cohesive powders. Powder Technol. 1975, 12, 259–275. [Google Scholar] [CrossRef]
- Nedderman, R.M. Statics and Kinematics of Granular Materials; Cambridge University Press: Cambridge, UK, 1992; ISBN 9780511600043. [Google Scholar]
- Tomas, J. Assessment of Mechanical Properties of Cohesive Particulate Solids. Part 2: Powder Flow Criteria. Part. Sci. Technol. 2001, 19, 111–129. [Google Scholar] [CrossRef]
- Fitzpatrick, J.J.; Barringer, S.A.; Iqbal, T. Flow property measurement of food powders and sensitivity of Jenike’s hopper design methodology to the measured values. J. Food Eng. 2004, 61, 399–405. [Google Scholar] [CrossRef]
- Schwedes, J. Review on testers for measuring flow properties of bulk solids. Granul. Matter 2003, 5, 1–43. [Google Scholar] [CrossRef]
- Schmitt, R. Powders and Bulk Solids; Springer: Berlin, Germany, 2010; Volume 82, ISBN 9783540737674. [Google Scholar]
- García-Triñanes, P.; Luding, S.; Shi, H. Tensile strength of cohesive powders. Adv. Powder Technol. 2019, 30, 2868–2880. [Google Scholar] [CrossRef]
- Kono, H.; Aksoy, E.; Itani, Y. Measurement and application of the rheological parameters of aerated fine powders—A novel characterization approach to powder flow properties. Powder Technol. 1994, 81, 177–187. [Google Scholar] [CrossRef]
- Bruni, G.; Lettieri, P.; Newton, D.; Barletta, D. An investigation of the effect of the interparticle forces on the fluidization behaviour of fine powders linked with rheological studies. Chem. Eng. Sci. 2007, 62, 387–396. [Google Scholar] [CrossRef]
- Bruni, G.; Tomasetta, I.; Barletta, D. Sensitivity analysis on a rheological model for the flowability of aerated fine powders. Chem. Eng. Trans. 2009, 17, 735–740. [Google Scholar]
- Tomasetta, I.; Barletta, D.; Poletto, M. The High Temperature Annular Shear Cell: A modified ring shear tester to measure the flow properties of powders at high temperature. Adv. Powder Technol. 2013, 24, 609–617. [Google Scholar] [CrossRef]
- Macrì, D.; Poletto, M.; Barletta, D.; Sutcliffe, S.; Lettieri, P. Analysis of industrial reactive powders flow properties at high temperature. Powder Technol. 2017, 316, 131–138. [Google Scholar] [CrossRef]
- Valverde, J.M.; Castellanos, A.; Mills, P.; Quintanilla, M.A.S. Effect of particle size and interparticle force on the fluidization behavior of gas-fluidized beds. Phys. Rev. E Stat. Nonlin. Soft Matter Phys. 2003, 67, 051305. [Google Scholar] [CrossRef] [PubMed]
- Walters, J.K. A theoretical analysis of stresses in axially-symmetric hoppers and bunkers. Chem. Eng. Sci. 1973, 28, 779–789. [Google Scholar] [CrossRef]
- Ashton, M.D.; Cheng, D.C.H.; Farley, R.; Valentin, F.H.H. Some investigations into the strength and flow properties of powders. Rheol. Acta 1965, 4, 206–218. [Google Scholar] [CrossRef]
- Schulze, D. Development and application of a novel ring shear tester—Entwicklung und Anwendung eines neuartigen Ringschergerätes. Aufbereit. Tech. 1994, 35, 524–535. [Google Scholar]
- Schulze, D. A new ring shear tester for flowability and time consolidation measurements. In Proceedings of the 1st International Particle Technology Forum, Denver, CO, USA, 17–19 August 1994. [Google Scholar]
- Fu, X.; Huck, D.; Makein, L.; Armstrong, B.; Willen, U.; Freeman, T. Effect of particle shape and size on flow properties of lactose powders. Particuology 2012, 10, 203–208. [Google Scholar] [CrossRef]
- Tomasetta, I.; Barletta, D.; Poletto, M. The Effect of Temperature on Flow Properties of Fine Powders. Chem. Eng. Trans. 2011, 24, 655–660. [Google Scholar]
- Tomasetta, I.; Barletta, D.; Poletto, M. Correlation of powder flow properties to interparticle interactions at ambient and high temperatures. Particuology 2014, 12, 90–99. [Google Scholar] [CrossRef]
- Chirone, R.; Barletta, D.; Lettieri, P.; Poletto, M. Bulk flow properties of sieved samples of a ceramic powder at ambient and high temperature. Powder Technol. 2016, 288, 379–387. [Google Scholar] [CrossRef]
- ASTM International. D6773-02: Standard Test Method for Bulk Solids Using Schulze Ring Shear Tester 1. Annu. B ASTM Stand. 2010, 1–26. [Google Scholar] [CrossRef]
- Macri, D. cYield, MATLAB Central File Exchange. 2020. Available online: https://www.mathworks.com/matlabcentral/fileexchange/60998-cyield (accessed on 15 April 2020).
- Peleg, M.; Normand, M.D.; Corradini, M.G. Interactive software for calculating the principal stresses of compacted cohesive powders with the Warren-Spring equation. Powder Technol. 2010, 197, 268–273. [Google Scholar] [CrossRef]
- Salehi, H.; Barletta, D.; Poletto, M. A comparison between powder flow property testers. Particuology 2017, 32, 10–20. [Google Scholar] [CrossRef]


| Sample | ρb (kg/m3) | d10 (μm) | d50 (μm) | d90 (μm) | dsv (μm) |
|---|---|---|---|---|---|
| Ceramic Powder (CP1) | 700 | 3 | 12 | 28 | 7 |
| Ceramic Powder (CP2) | 1000 | 18 | 35 | 61 | 22 |
| Ceramic Powder (CP3) | 1200 | 38 | 61 | 95 | 41 |
| Ceramic Powder (CP4) | 1350 | 55 | 87 | 130 | 51 |
| Ceramic Powder (CP5) | 1400 | 90 | 184 | 423 | 104 |
| Rutile (RU) | 2300 | 91 | 205 | 444 | 146 |
| Calcium Carbonate (CaC) | 500 | 2 | 7 | 40 | 4 |
| Dolomitic Lime (DL) | 1000 | 2 | 23 | 257 | 6 |
| Sample | Pre-Shear Load (kg) | Number of Repetitions Per Point | Linear Yield Locus | Warren–Spring | |||||||
|---|---|---|---|---|---|---|---|---|---|---|---|
| C (Pa) | fc (Pa) | σ1 (Pa) | σt (Pa) | C (Pa) | fc (Pa) | σ1 (Pa) | σt (Pa) | n (-) | |||
| CP1 | 0.414 | 4 | 191 | 719 | 1132 | 283 | 122 | 731 | 1126 | 31 | 2.00 |
| 0.514 | 4 | 230 | 857 | 1397 | 346 | 161 | 891 | 1392 | 45 | 2.00 | |
| 0.614 | 4 | 250 | 963 | 1619 | 355 | 181 | 1006 | 1646 | 52 | 1.98 | |
| 0.714 | 4 | 284 | 1075 | 1866 | 415 | 180 | 1081 | 1877 | 49 | 1.92 | |
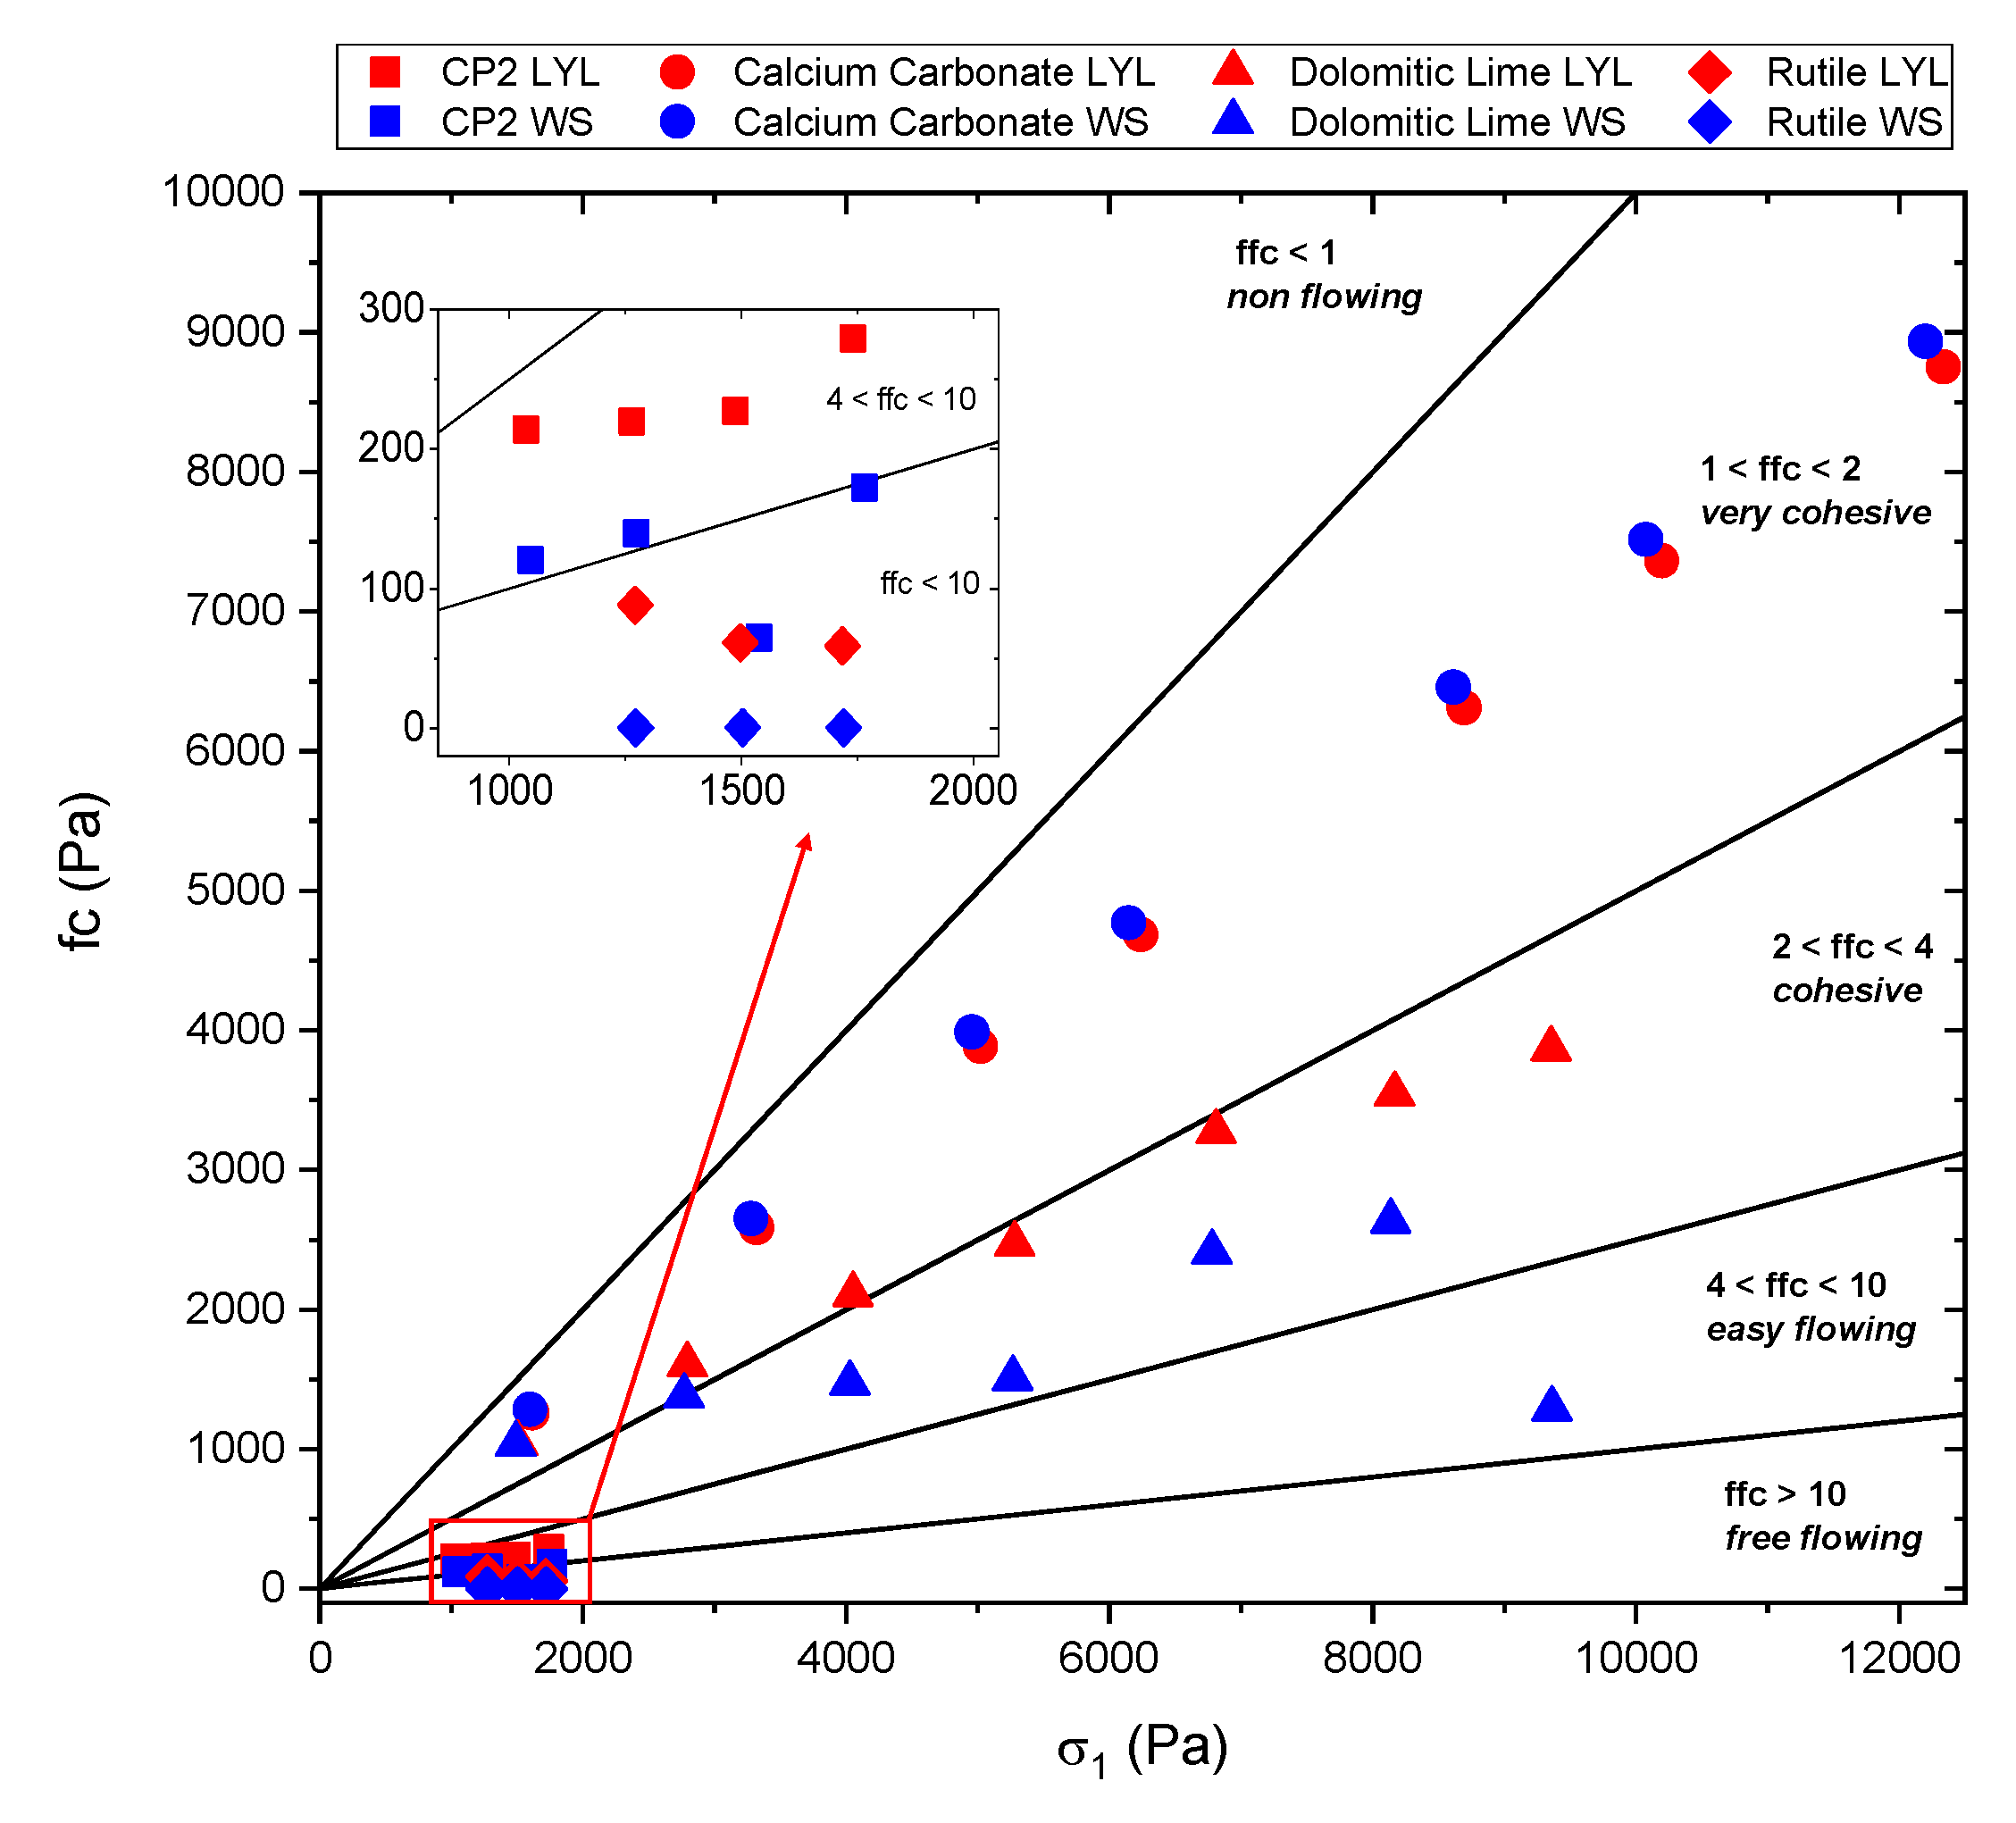
| CP2 | 0.414 | 4 | 57 | 214 | 1036 | 84 | 21 | 121 | 1046 | 11 | 1.31 |
| 0.514 | 4 | 58 | 220 | 1265 | 86 | 27 | 140 | 1274 | 18 | 1.25 | |
| 0.614 | 4 | 59 | 228 | 1487 | 84 | 8 | 65 | 1538 | 3 | 1.32 | |
| 0.714 | 4 | 73 | 280 | 1741 | 106 | 34 | 173 | 1765 | 24 | 1.22 | |
| CP3 | 0.414 | 4 | 31 | 116 | 1031 | 47 | 15 | 69 | 1038 | 15 | 1.13 |
| 0.514 | 4 | 38 | 145 | 1289 | 57 | 25 | 106 | 1298 | 25 | 1.11 | |
| 0.614 | 4 | 41 | 157 | 1498 | 60 | 25 | 112 | 1521 | 24 | 1.13 | |
| 0.714 | 4 | 53 | 203 | 1756 | 78 | 34 | 146 | 1772 | 34 | 1.12 | |
| CP4 | 0.414 | 4 | 16 | 60 | 1006 | 23 | >1 | <1 | 1010 | >1 | 1.10 |
| 0.514 | 4 | 38 | 143 | 1279 | 56 | 38 | 143 | 1279 | 56 | 1.00 | |
| 0.614 | 4 | 31 | 120 | 1462 | 45 | 23 | 96 | 1470 | 27 | 1.06 | |
| 0.714 | 4 | 31 | 116 | 1670 | 45 | 15 | 65 | 1679 | 16 | 1.08 | |
| CP5 | 0.414 | 4 | 17 | 67 | 1007 | 24 | <1 | 1 | 1008 | <1 | 1.10 |
| 0.514 | 4 | 18 | 71 | 1241 | 26 | 7 | 33 | 1242 | 8 | 1.07 | |
| 0.614 | 4 | 20 | 77 | 1461 | 27 | 9 | 38 | 1467 | 9 | 1.07 | |
| 0.714 | 4 | 25 | 96 | 1689 | 36 | <1 | <1 | 1701 | <1 | 1.11 | |
| RU | 0.514 | 4 | 23 | 88 | 1271 | 32 | 0.03 | <1 | 1273 | <1 | 1.12 |
| 0.614 | 4 | 15 | 61 | 1498 | 20 | 0.07 | <1 | 1503 | <1 | 1.08 | |
| 0.714 | 4 | 15 | 59 | 1718 | 20 | 0.05 | <1 | 1720 | <1 | 1.05 | |
| CaC | 1.6 | 2 | 330 | 1259 | 1614 | 477 | 260 | 1285 | 1597 | 96 | 1.90 |
| 3.2 | 2 | 654 | 2588 | 3321 | 889 | 470 | 2653 | 3277 | 129 | 2.00 | |
| 4.8 | 2 | 976 | 3887 | 5021 | 1310 | 698 | 3989 | 4955 | 188 | 2.00 | |
| 6.4 | 2 | 1178 | 4686 | 6237 | 1586 | 758 | 4772 | 6146 | 177 | 2.00 | |
| 7.9 | 2 | 1558 | 6314 | 8694 | 2032 | 1122 | 6460 | 8611 | 323 | 1.92 | |
| 9.5 | 2 | 1807 | 7364 | 10196 | 2335 | 1232 | 7517 | 10075 | 321 | 1.94 | |
| 11.1 | 2 | 2114 | 8753 | 12335 | 2664 | 1303 | 8936 | 12200 | 268 | 2.00 | |
| DL | 1.6 | 2 | 283 | 1043 | 1503 | 437 | 177 | 1036 | 1488 | 46 | 2.00 |
| 3.2 | 2 | 432 | 1606 | 2794 | 652 | 95 | 1381 | 2768 | 8 | 2.00 | |
| 4.8 | 2 | 575 | 2109 | 4051 | 894 | 15 | 1473 | 4030 | <1 | 1.96 | |
| 6.4 | 2 | 675 | 2472 | 5281 | 1051 | 46 | 1508 | 5264 | 2 | 1.86 | |
| 7.9 | 2 | 872 | 3275 | 6809 | 1295 | 175 | 2412 | 6778 | 19 | 1.83 | |
| 9.5 | 2 | 932 | 3544 | 8167 | 1354 | 297 | 2635 | 8138 | 62 | 1.69 | |
| 11.1 | 2 | 1042 | 3869 | 9355 | 1580 | 15 | 1290 | 9362 | <1 | 1.75 | |
© 2020 by the authors. Licensee MDPI, Basel, Switzerland. This article is an open access article distributed under the terms and conditions of the Creative Commons Attribution (CC BY) license (http://creativecommons.org/licenses/by/4.0/).
Share and Cite
Macri, D.; Chirone, R.; Salehi, H.; Sofia, D.; Materazzi, M.; Barletta, D.; Lettieri, P.; Poletto, M. Characterization of the Bulk Flow Properties of Industrial Powders from Shear Tests. Processes 2020, 8, 540. https://doi.org/10.3390/pr8050540
Macri D, Chirone R, Salehi H, Sofia D, Materazzi M, Barletta D, Lettieri P, Poletto M. Characterization of the Bulk Flow Properties of Industrial Powders from Shear Tests. Processes. 2020; 8(5):540. https://doi.org/10.3390/pr8050540
Chicago/Turabian StyleMacri, Domenico, Roberto Chirone, Hamid Salehi, Daniele Sofia, Massimiliano Materazzi, Diego Barletta, Paola Lettieri, and Massimo Poletto. 2020. "Characterization of the Bulk Flow Properties of Industrial Powders from Shear Tests" Processes 8, no. 5: 540. https://doi.org/10.3390/pr8050540
APA StyleMacri, D., Chirone, R., Salehi, H., Sofia, D., Materazzi, M., Barletta, D., Lettieri, P., & Poletto, M. (2020). Characterization of the Bulk Flow Properties of Industrial Powders from Shear Tests. Processes, 8(5), 540. https://doi.org/10.3390/pr8050540