1. Introduction
As human living standards continue to rise, yogurt is getting popular among people from all walks of life. Taking the Chinese market as an example, market research by the National Bureau of Statistics of China [
1] showed that the yogurt sales of China were increased from 33 billion yuan in 2010 to 101 billion yuan in 2016, while milk sales were increased from 67 billion yuan to 110 billion yuan over the same period. Further, yogurt sales reached 122 billion yuan in 2017, surpassing pure milk sales for the first time. It is estimated that by 2020, yogurt sales in China will reach 190 billion yuan [
2].
For consumers of dairy products, the smooth texture and refreshing taste of yogurt are appealing, and the probiotics in yogurt, which may have positive effects on immune, cardiovascular, and metabolic health, can also enhance consumers’ partiality [
3]. The rapidly expanding yogurt market has delivered huge profits to yogurt producers, and catering to consumers’ tastes is one of the most important factors for yogurt producers to enlarge their market shares [
4]. Thus, the accurate prediction of consumer preferences is crucial for yogurt producers aiming to attract new consumers as well as to maintain their brand loyalty [
5].
Knowledge about consumers’ preference for yogurt sensory qualities can help producers’ processing. However, it is not economic to undertake large-scale sensory evaluations and market surveys [
6]. Thus, market demand is usually estimated via consumer preference predictions using sensory attributes as an input. Some previous studies have focused on exploring the correlation between sensory attributes and consumer preferences for dairy products. Ares et al. [
7] compared different preference mapping techniques and recommended that the external preference mapping used by the dairy industry to modify the texture of dulce de leche is a method better meeting consumer requirement. Zhi et al. [
8] established a relationship between product characteristics and overall preferences using partial least squares regression (PLSR) to identify the preferences of consumers from different regions in relation to flavored milk. Castada et al. [
9] used the principal component analysis (PCA) method and found a positive correlation between five sensory attributes and consumer preferences in relation to Swiss cheese.
These studies applied a range of conventional statistical correlation methods in an attempt to predict consumer preferences based on sensory attributes. However, when applied to large volumes of high-dimensional data, these conventional methods may not provide enough accuracy, extendibility, and generalization [
10]. In addition, errors of the prediction results may be incurred by potential issues, such as the individual difference of evaluators or bad data quality in sensory experiments [
11]. To overcome these deficiencies, we propose a high-performance computer-aided model for more efficient algorithms of regression. The core aim of this model is to extract the unique features that reflect the intrinsic characteristics of a yogurt product from sensory evaluation data using a deep learning method. These features can not only be used to regress consumer preferences, but they can also help yogurt producers for product classification, design, processing, and the adjustment of storage conditions.
Deep learning algorithms are used for dimensionality reduction and feature extraction [
12]. The autoencoder (AE) approach is proved to be accurate and efficient in feature extraction and noise decreasing of original data [
13]. Among these autoencoders, a general autoencoder framework using fully connected layers (FCAE) is the most widely used [
14]. With the development of machine learning technology, another deep convolutional autoencoder (DCAE) proposed by Cheng et al. [
15] is becoming highly recognized and increasingly prevalent. The structure of DCAE combines a convolutional neural network (CNN) [
16] with a simple autoencoder. The convolution and pooling operations in the structure of the DCAE enable the model to comprehensively consider the latent features of all the evaluators’ scoring habits and reveal the relationships among the coupled sensory attributes elements during preference regression [
17].
After identifying the key features, a support vector machine (SVM) algorithm [
18] can be applied to predict preferences [
10]. A previous study [
19] showed that SVM was the most practical method in relation to high-dimensional regression problems with small sample sizes. The complete set of SVM regression models has been packaged as an Industrial Internet plug-in. Using this plug-in, the hedonic contour mapping [
20,
21] of key sensory properties is feasible. Similar to external preference mapping [
7], hedonic contour mapping, which is generated by orthogonal experiments [
22] implemented by computer programs, can determine an area composed of consumers’ favorable sensory attributes. In addition, it has been reported that the sensory qualities of yogurt are closely associated with storage duration and temperature [
23]. Therefore, hierarchical clustering [
24] of the extracted features is applied to classify consumers’ preference levels for the yogurts of different brands stored under various conditions, and thus the optimal storage conditions could be identified.
In this study, the overall process of consumer preference prediction based on sensory evaluation data is introduced, including sensory and consumer analysis, feature extraction by deep learning, and overall preference regression using SVM, hedonic contour mapping, and hierarchical clustering based on sensory features. Yogurt samples are used to provide the dataset for the model and test the feasibility of the overall process.
2. Materials and Methods
2.1. Sample Preparation
Three newly developed yogurt products of different brands were provided by the yogurt producers in China. Every product was stored at 12 kinds of conditions composed of various storage periods and storage temperatures: 2L, 3L, 4L, 5L, 1R, 2R, 3R, 4R, 5R, 2H, 3H, and 4H, in which Arabic numerals denote the storage weeks, while L, R, and H express low temperature (4 °C), room temperature (25 °C), and high temperature (38 °C), respectively.
2.2. Panelists
Ten expert panelists and 100 consumer respondents were recruited for the sensory study and hedonic test, respectively. The expert panelists, including 5 males and 5 females aging from 22 to 46, were enrolled externally and constantly trained by COFCO Nutrition Health Research Institute (NHRI), the research and development (R&D) center of China National Cereals, Oils and Foodstuffs Corporation (COFCO) in Beijing. The volunteer employees from the non-R&D and non-marketing departments of COFCO were adopted as the consumer respondents for the hedonic test. These volunteers, aging from 22 to 46 with a male to female ratio of 2.125:1, generally have the habit of purchasing yogurt products. In advance, all participants assured of no allergy or resistance to dairy products.
The selection and training of sensory experts were processed according to ISO 8586:2012 [
25]. The people who had no less than 4 years of experiences in sensory evaluation were considered, and the ones who could restate the sample attributes and whose assessment intensities could be calibrated into similar scales were invited for the sensory descriptive analysis of yogurts. Before the formal test, they were requested to join a training program consisting of 1–2 sessions per week over a four-week period. The training was performed mainly with triangle, ranking, and matching tests to ensure panelists’ abilities of descriptive vocabulary, matching, and discrimination. During the training, panelists’ performance levels were also monitored with three identical yogurt samples marked by different three-digital numbers.
2.3. Implement of Evaluations
2.3.1. Sensory Descriptive Test
The 36 yogurt samples were randomly divided into 3 groups, each of which contained 12 samples. In each sensory evaluation, which was conducted once a day, the expert panelists were asked to evaluate one group of samples based on 22 preselected descriptive attributes. The assessment of all samples was completed within 3 connective working days. The sensory descriptors were predetermined by panel leaders, and the intensity of each attribute was scored on a line scale of 10 cm anchored by verbal endpoints at both ends [
26]. All the yogurt samples were kept overnight in a refrigerator set at 4 ± 2 °C and incubated for 20 min at 26 ± 2 °C before serving. In the environment of 26 ± 2 °C, approximate 30 mL of yogurt samples in 60 mL plastic cups were marked by 3 digital numbers and presented to the panelists in stochastic orders. Between the samples, a 3-minute break was taken, and mineral water and unsalted steamed buns were served to clean assessor’ palates. Samples S1, S2, and S3, stirred yogurt respectively stored at room temperature, 4 °C, and 38 °C for 2 weeks were applied as blind reference samples in the evaluation procedure. Sense Whisper (
test.sensewhisper.com) and PanelCheck (programing by Oliver Tomic and Henning Risvik) were used to collect and calculate the evaluation data [
27]. More information related to the 22 yogurt sensory attributes and the experts’ performance is appended to the
supplementary file, in Figures S1–S5.
2.3.2. Hedonic test
The 36 yogurt samples were sent to the 100 consumer respondents in various offices of COFCO. After tasting each sample, the respondents were asked to provide a rating on a 9-point hedonic scale in which scores 1 and 9 are explained as extremely unpleasant and extremely pleasant, respectively [
26].
The high degree of randomicity and human error in the consumer ratings make it infeasible to precisely predict the entire distribution of consumer preferences. Thus, the scores were divided into three categories for the further analysis: preferred (scores between 7 and 9), neutral (scores between 4 and 6), and disliked (scores between 1 and 3). The percentages of consumers’ preferences for the 36 samples are shown in
Table 1.
2.4. Feature Extraction Based on Deep Learning
For each yogurt sample, 22 attributes were assessed by 10 experts, generating a two-dimensional matrix with a size of 10 × 22. As the matrix elements, the attribute values of 36 samples were collected from line scales of 10 cm and linear normalized to the range of 0 to 1. Through Python 3.6, the normalized data corresponding to various experts could be expressed by heatmaps [
28]. The detailed dataset can be found in
Figures S1–S5 of the supplement file.
For comprehensive evaluation of the experts’ sensory scores, the conventional statistical correlation methods may not completely satisfy the regression due to the large dimension. The usage of conventional methods, such as PCA or PLSR, could also result in the loss of key sensory information during dimensionality reduction and feature extraction [
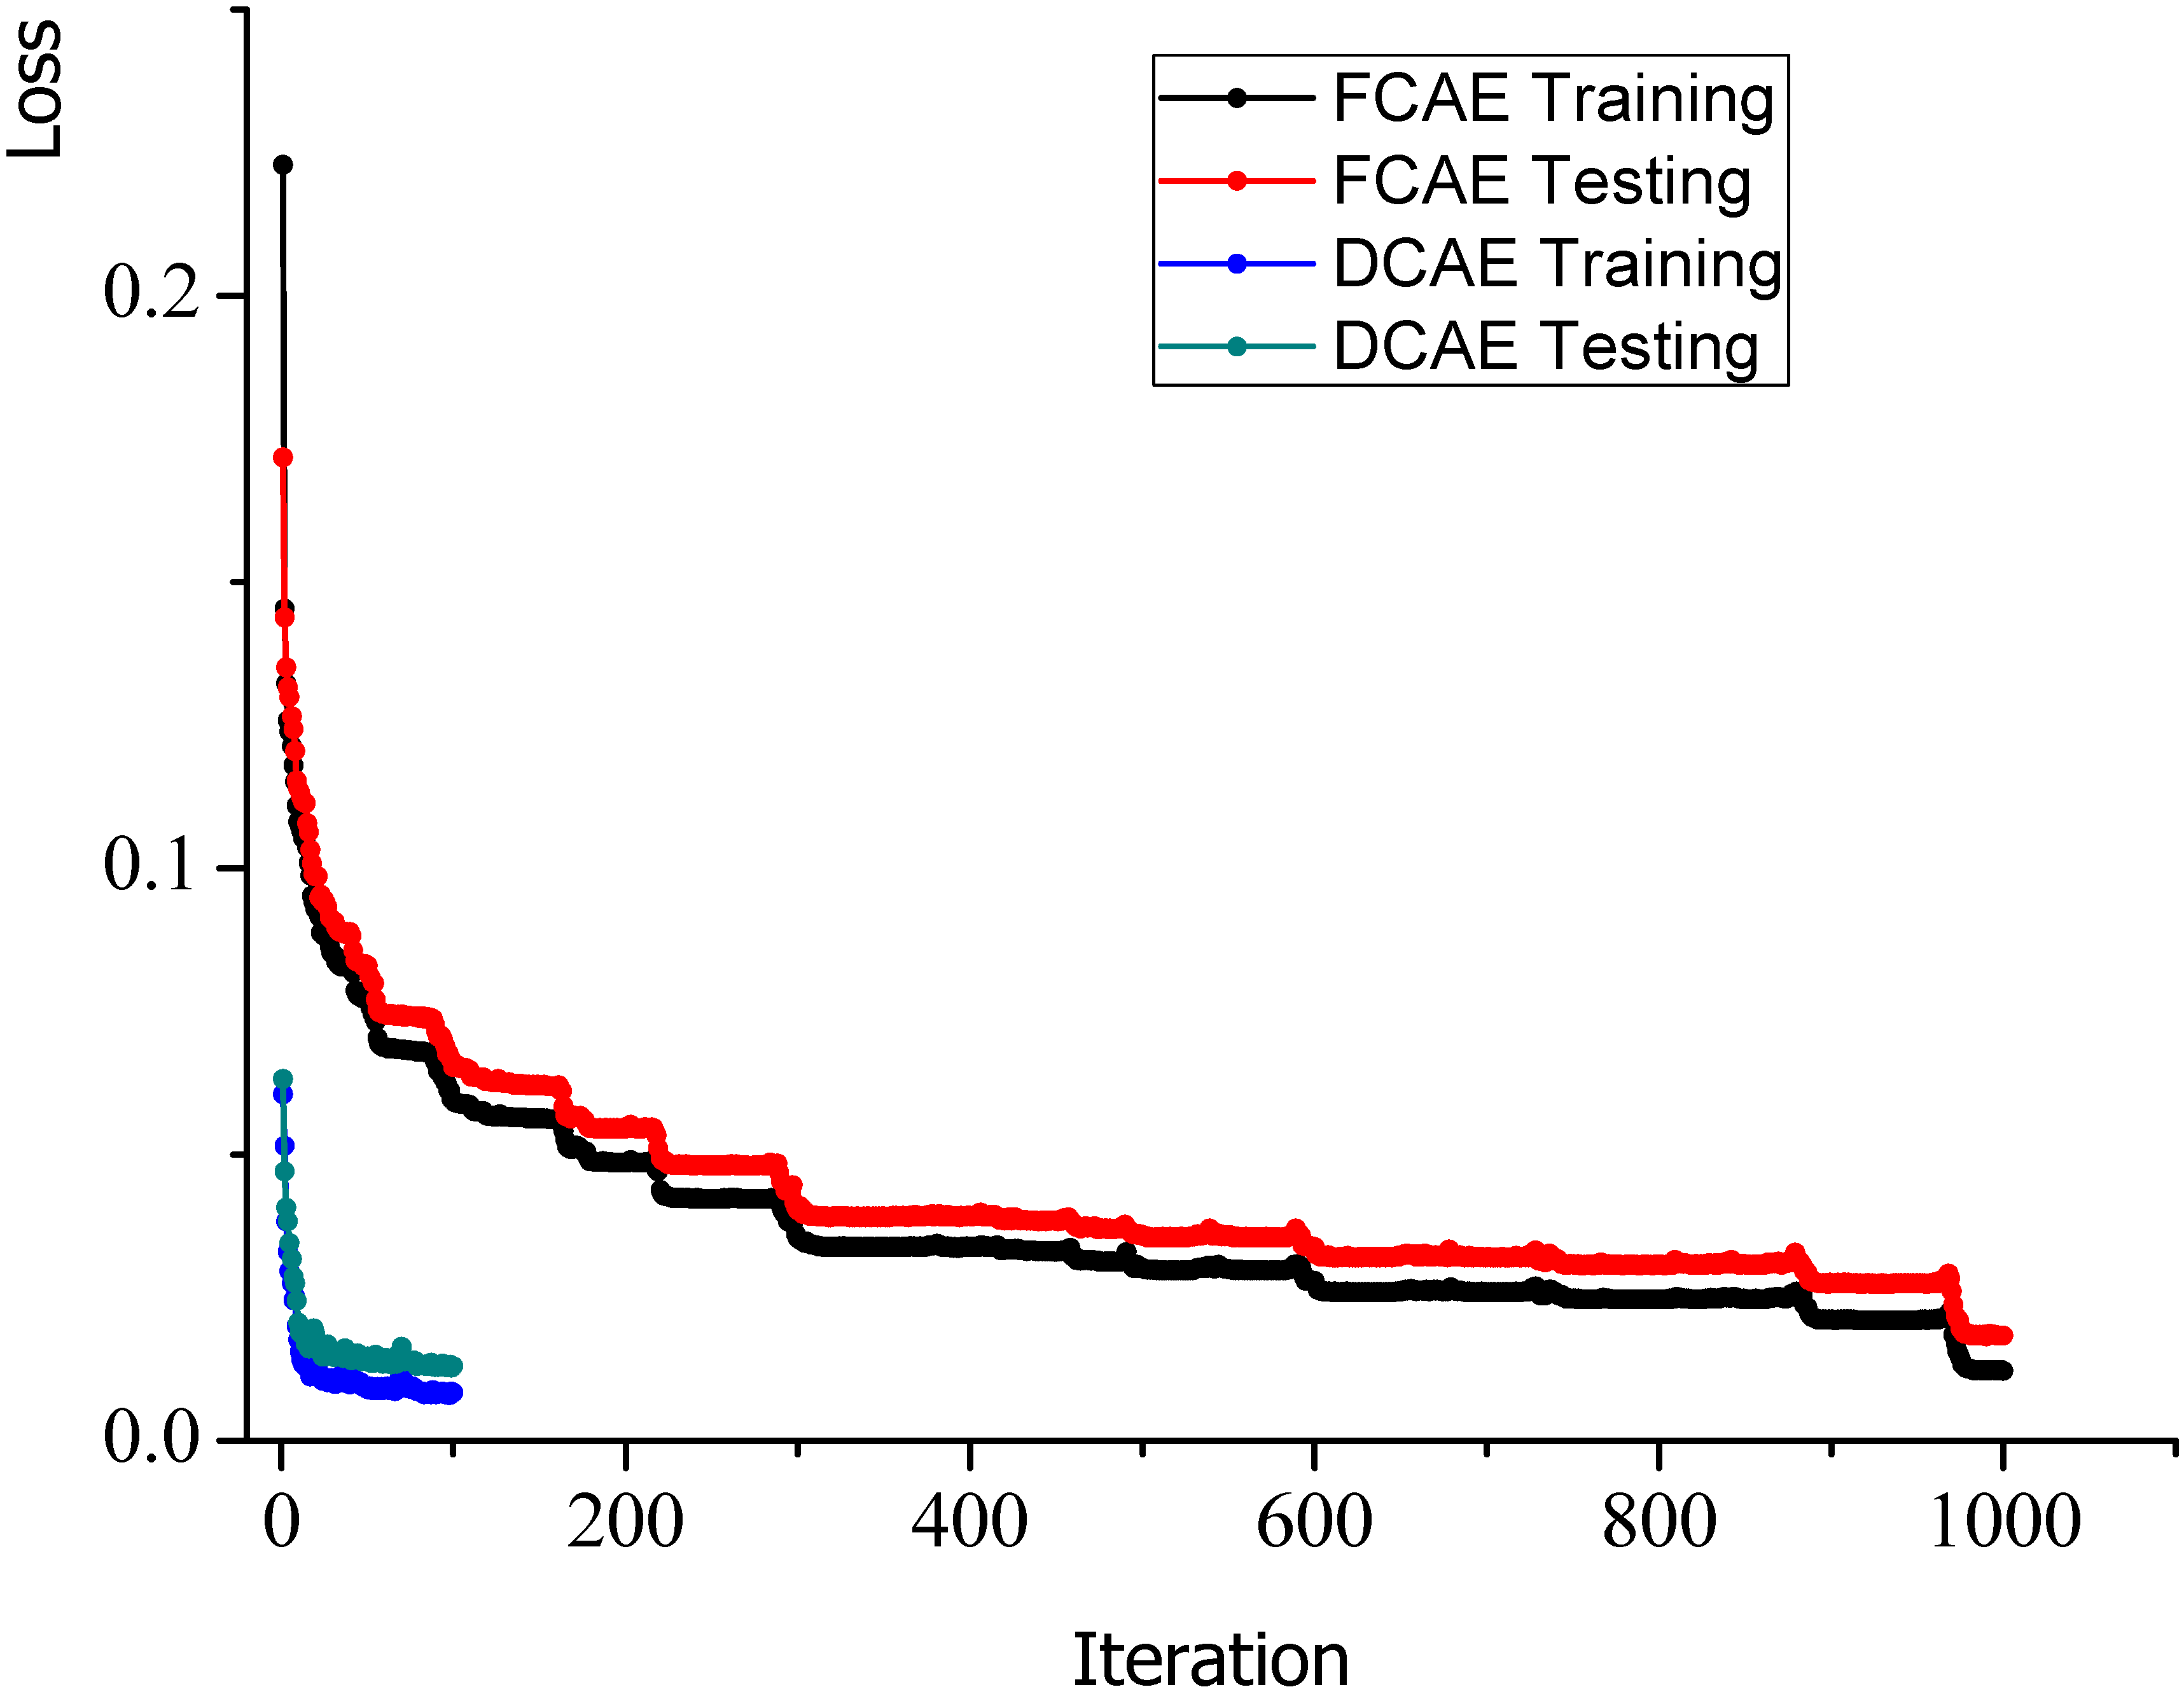
29]. Thus, we tried to apply deep learning methods to extract the product features from their sensory attribute scores. Among the various deep learning methods, autoencoder (AE) may be an efficient algorithm for dimensionality reduction and ignoring noises. AE firstly learned a representation for a set of data by dimensionality reduction, which was the encoding operation, and then created the closest possible reconstruction of the original data from the extracted representation, which was the decoding operation. The representation was of the features extracted from the original data by converting the 10 experts’ attribute scores with the low-dimension vector. To better extract the features, both FCAE and DCAE methods were simultaneously attempted for the same dataset, and their graphical structures are shown in
Figure 1. The operations in
Figure 1 were executed with eight Intel core i7-7700HQ CPUs @3.8GHz and one GTX Force 1050Ti GPU @CUDA 9.0, running Python 3.6 using a Keras frame on a TensorFlow back end [
30].
As shown in
Figure 1a, the structure of FCAE is composed of original data (220 nodes), hidden layer (24 nodes), and reverted data (220 nodes). The normalized original data is obtained by a heatmap flattened into one dimension. All the layers are fully connected, and then FCAE is trained to minimize the deviation between input data and output data. The hidden layer, which can be reverted to a similar vector as the input, is considered as the features of sensory attributes in a specific yogurt sample.
As shown in
Figure 1b, the encoding operations, including convolutions and poolings, were used to extract features from the original data for further regression. The subsequent deconvolution network reverted the features into the original heatmap through a decoding operation (upsampling and deconvolution) for network parameter optimization and feature correctness verification. Four original heatmaps were randomly selected from the testing sets, and a comparison between the original heatmaps and their reverted heatmaps is shown in
Figure 2. In the original heatmaps, the
x-axis represents 22 various sensory attributes, while the
y-axis represents 10 different experts.
Compared to conventional PCA and PLSR methods, the deep learning treatment of original sensory evaluation data gave a comprehensive consideration of all evaluators’ scoring habits and the mutual couplings among sensory attributes. In FCAE, the features could be easily extracted and explicit significances could be expressed, which were stored in the hidden layer for further uses. In DCAE, the reverted heatmaps were reconstructed by extracting features from the distribution information of the sensory attribute dimension in each column and reducing the distribution fluctuation among sensory evaluators in each row, which effectively helps data denoising and feature robustness.
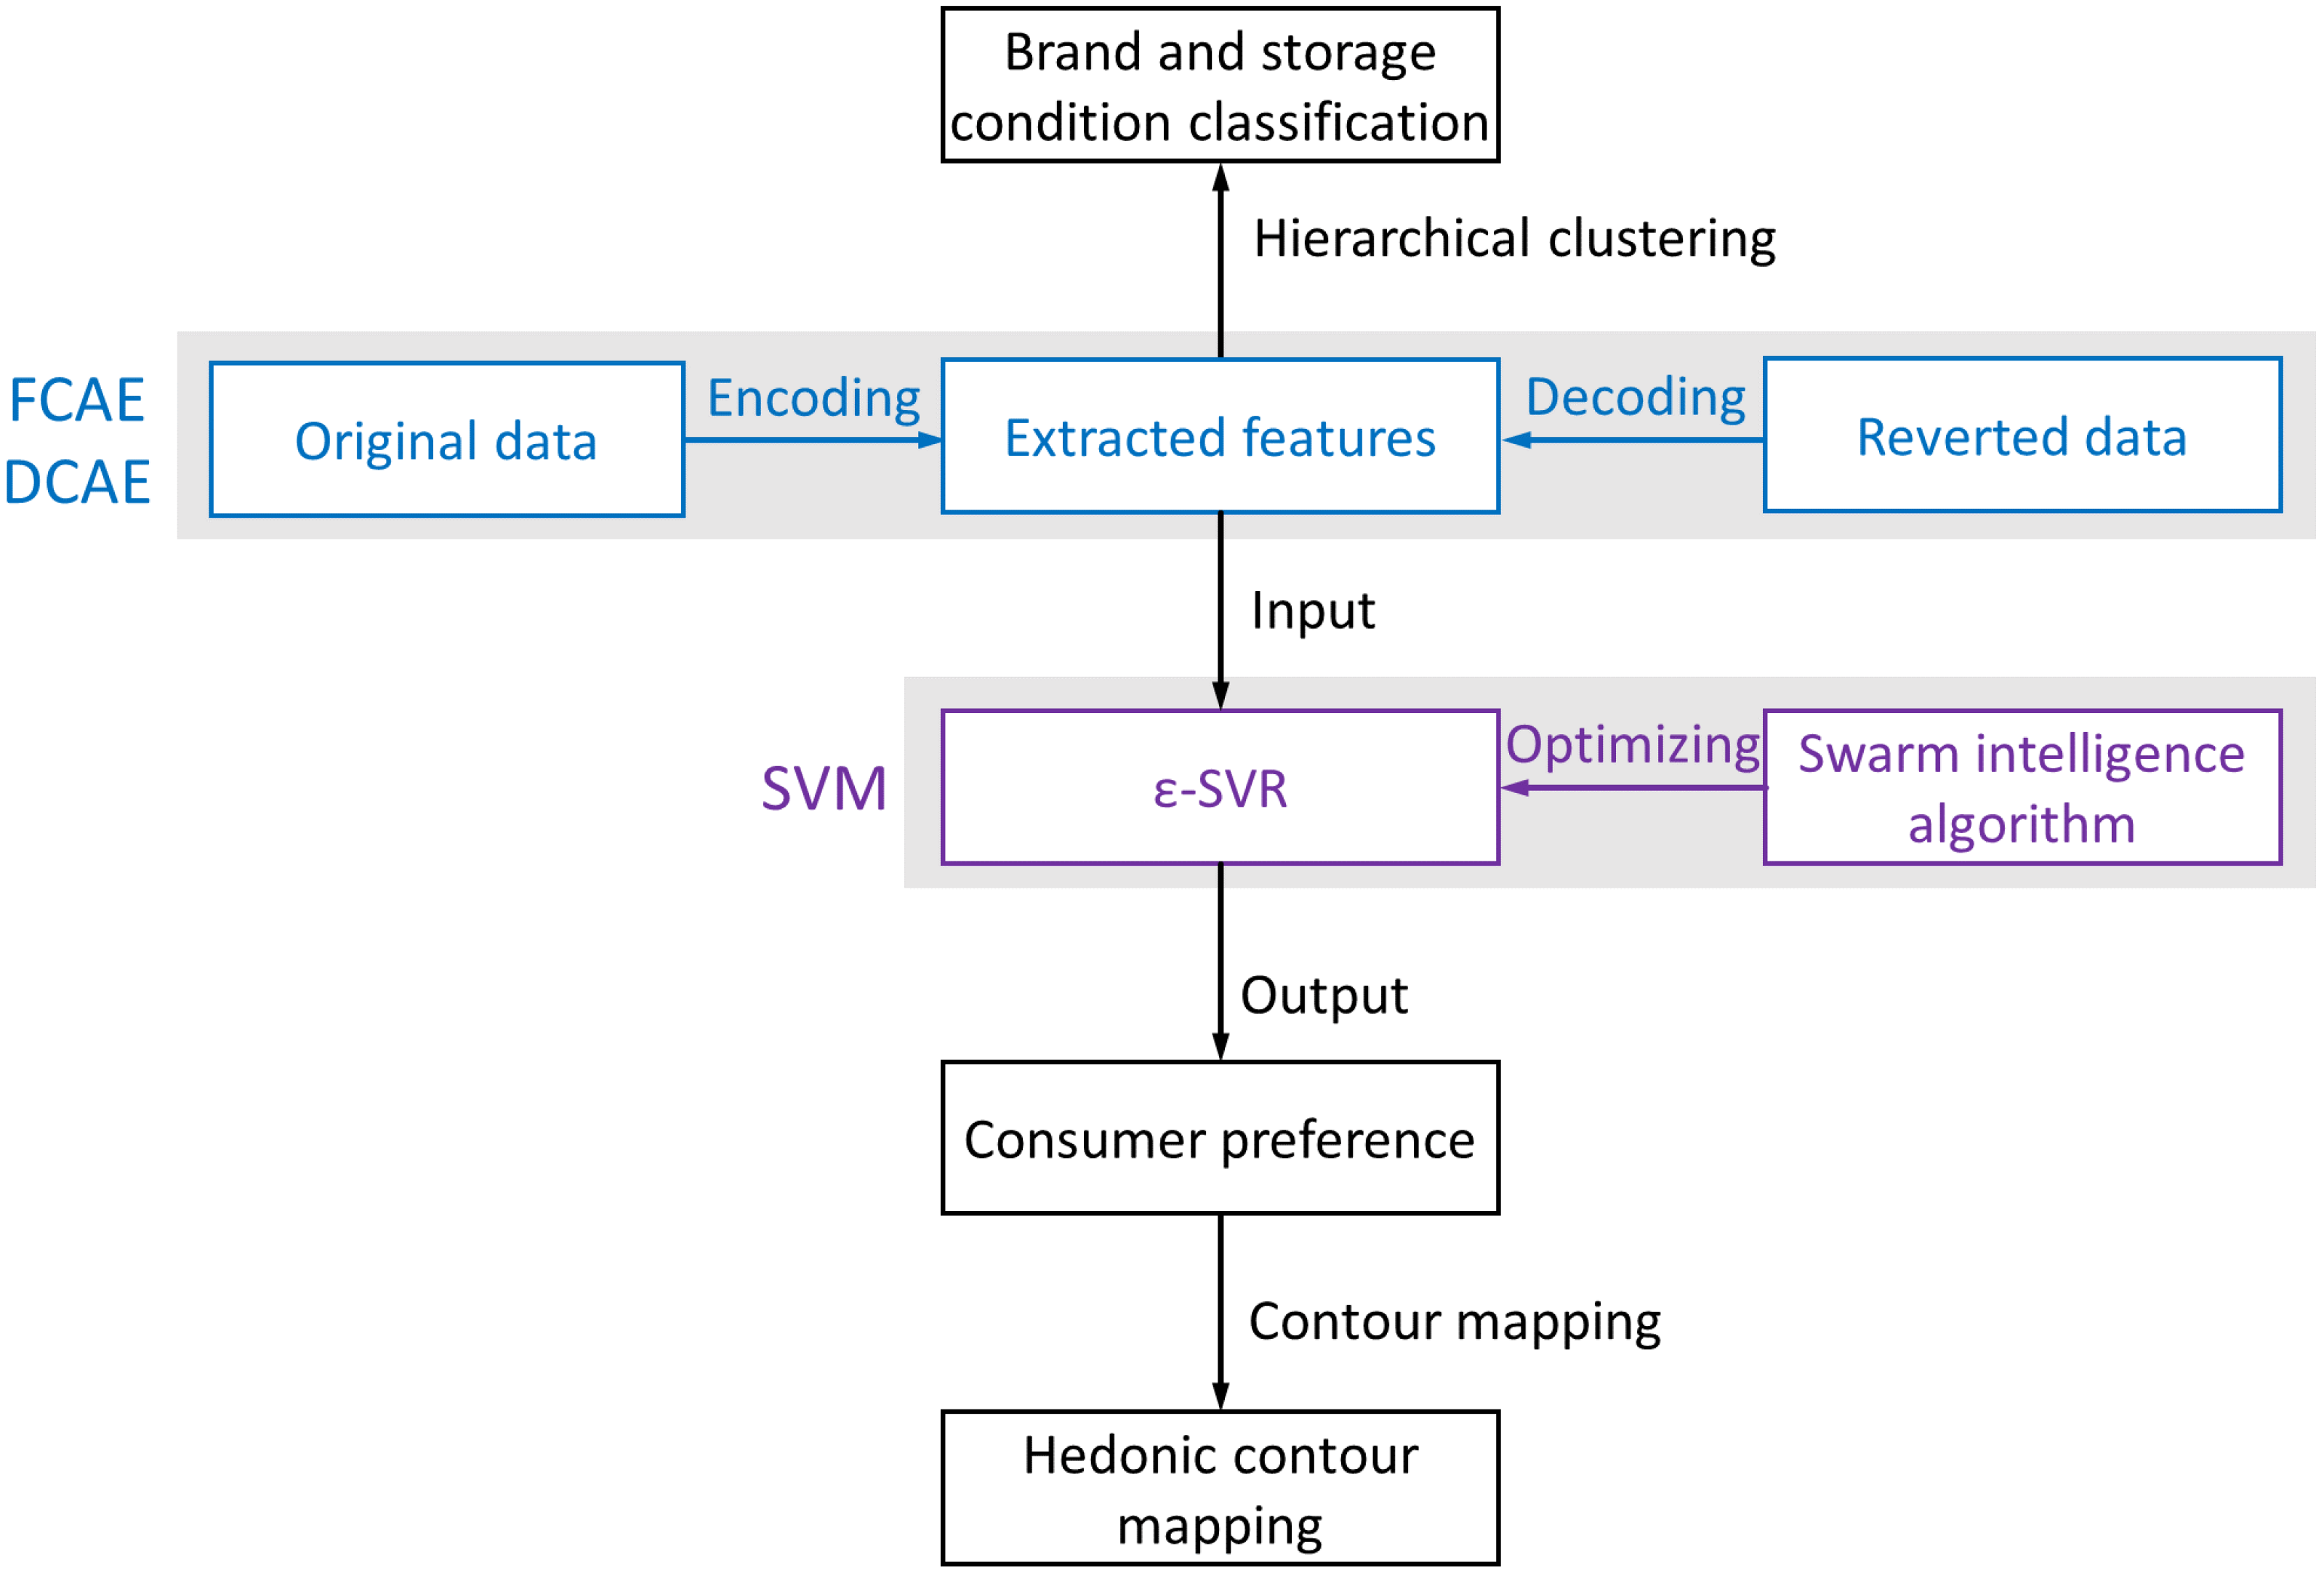
After determination of the FCAE and DCAE structures and parameters, all features (with 24 dimensions) were input for further analyses using AE and SVM as the main algorithms. The entire deep learning process in relation to consumer preference prediction, hedonic contour mapping, and classification of brand/storage conditions was performed, as shown in
Figure 3. To explore the effectiveness and robustness of feature extraction, the averages of sensory attributes are also used as a type of extracted features for comparison.
2.5. Intelligent SVM Regression for Preference Prediction
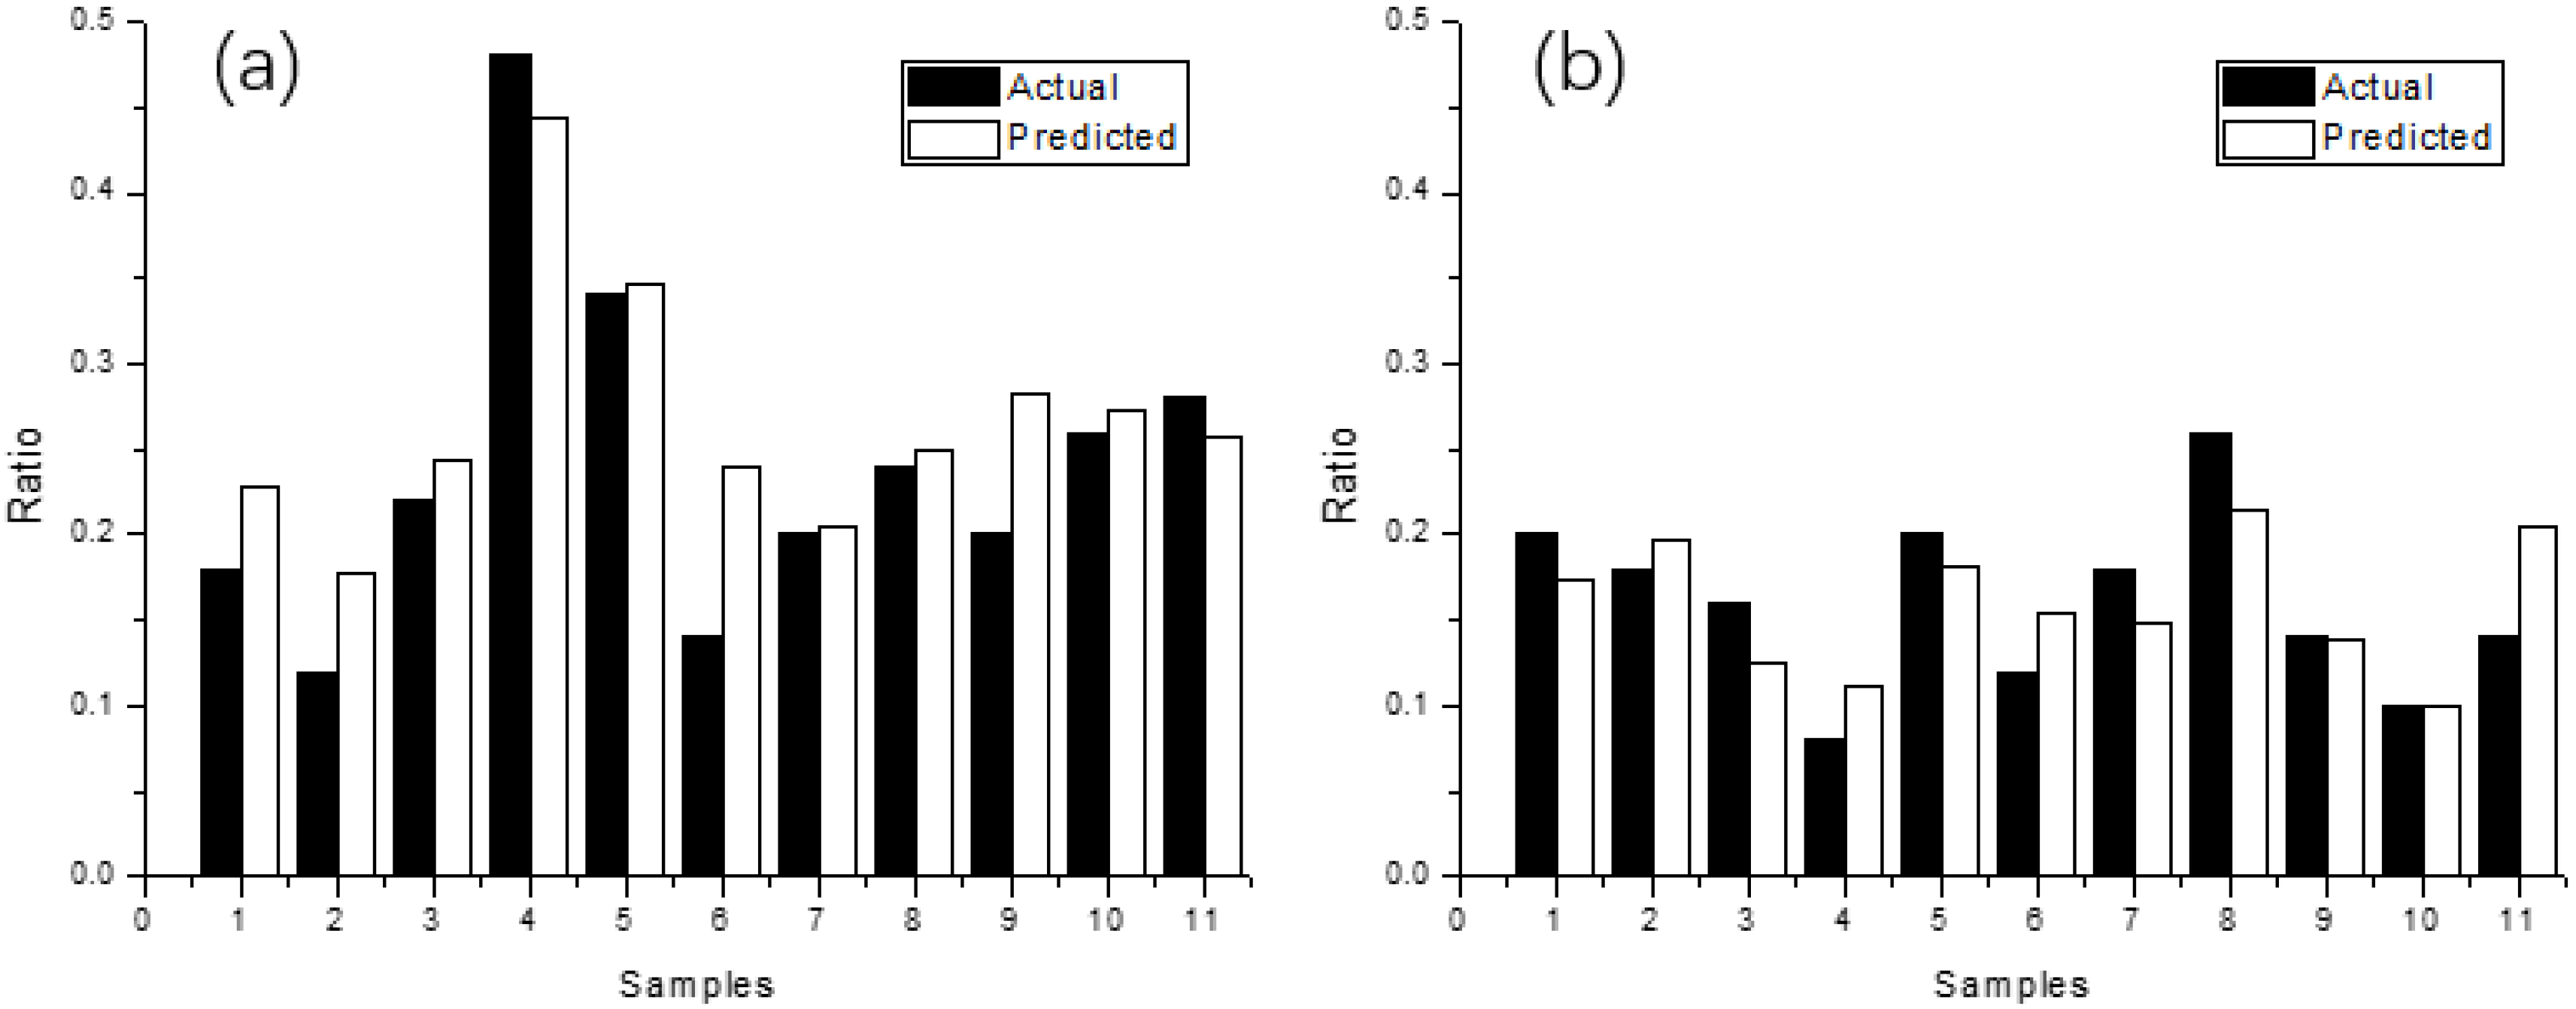
The features were structured into 24-dimensional vectors for input, which provided output in the form of the percentages of the consumer preference groups. A conversion between the high-dimensional features and the two-dimensional percentages (preferred and disliked) was needed. Thus, the ε−support vector regression (ε−SVR) algorithm, which is suitable for the problems of high-dimensional data versus small sample size, was selected for the conversion processing. The branch algorithm of SVM based on VC dimension theory and the minimum structural risk principle was consistently outperformed in terms of generalization ability and global optimization [
31]. In addition, the solution obtained from ε−SVR was understandable and expressed as below [
32]:
where
represents the preference prediction output, x represents the extracted features,
and
are Lagrange multipliers, b is the intercept of linear regression, SV is the support vector, N
NSV represents the amount of standard support vectors, and K represents the kernel function. C, ε, and γ are the penalty coefficient, tolerance boundary, and distribution width in the kernel function, respectively, which are the parameters to be optimized in the model. The optimization process based on the swarm intelligence algorithm [
19] is included as an Industrial Internet plug-in with the ε−SVR algorithm, and the entire process can be executed automatically. To evaluate different methods, the optimization process of these three parameters are set in a same parameter space as {(C, ε, γ) |C∈(16,64), ε∈(0.06,0.12), and γ∈(0.05,0.09)}.
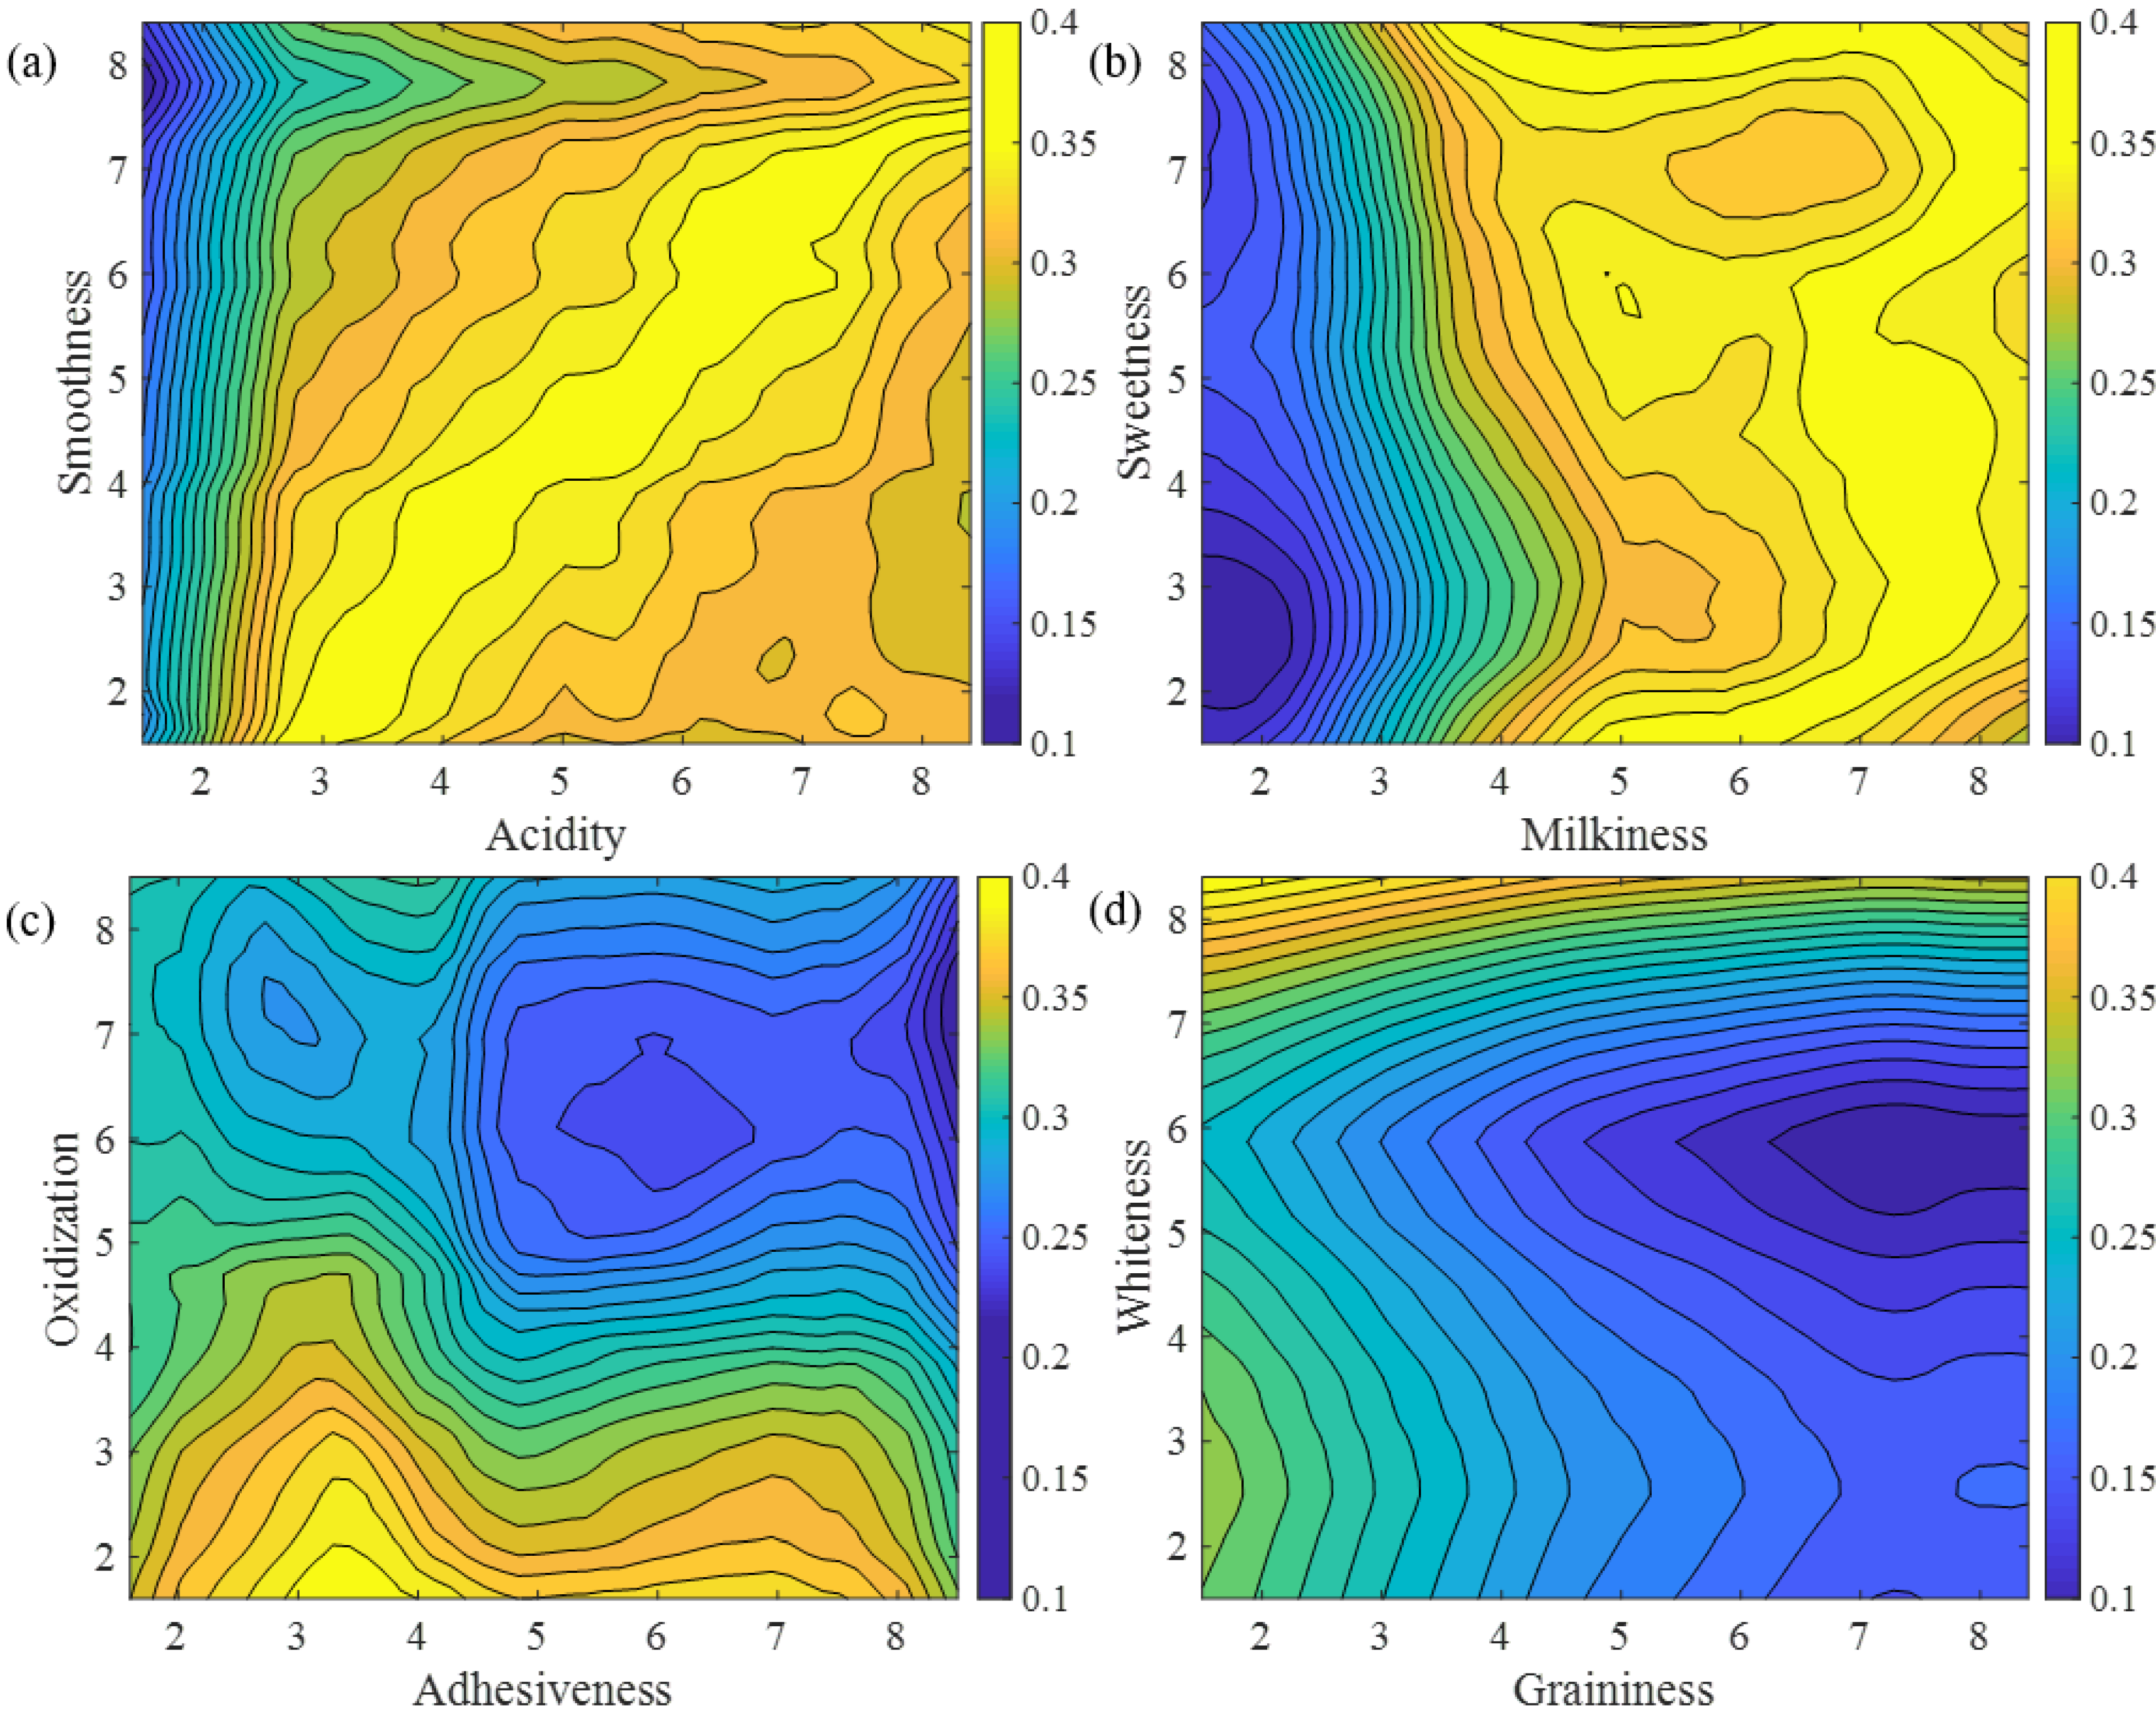
2.6. Evaluation of Consumer Preferences Using Hedonic Contour Mapping
Product sensory properties can vary over a wide range, so it is impossible to collect the actual consumer preferences on all data points. However, using the deep learning process outlined above, consumer preferences can be predicted if the specific sensory attributes were provided. The hedonic contour mapping method can generally identify preferences based on some key sensory dimensions using the process shown in
Figure 3. To help the yogurt producers to improve their product quality, the hedonic contour mapping is obtained using specific sensory dimensions instead of principle components or other explanatory variables [
33]. After collecting the preference predictions, a contour map can be generated whereby the points on the map indicate preference percentages.
Compared to the previous mapping methods, the hedonic contour mapping method can clearly display the consumer preference characteristics for specific attributes and the future improvement direction for a specific product.
2.7. Classification of Brands and Storage Conditions
The features extracted by AEs can also be used to classify the yogurt samples in relation to aspects such as brands and storage conditions. Hierarchical clustering analysis is frequently used to identify similarities among various variables. In this study, hierarchical clustering analysis with Euclidean distance and Ward’s criteria [
34] was used to classify the 36 yogurt samples of various brands and storage conditions, as shown in
Figure 3.
4. Discussion
Although at present, deep learning methods are rarely applied to food research, they have been widely used in the field of process engineering, such as process fault diagnosis [
36], and have been demonstrated more effective than the traditional methods for nonlinear dynamic processes with high uncertainty [
37]. Similarly, correlation between food sensory evaluation and consumer preference is also a dynamic, nonlinear, and highly uncertain modeling process. Thus, a novel deep learning approach combining several ideas from previous papers is proposed and compared with one of the representative traditional correlation models, PLSR. Our numerical experiments illustrated that SVR using the features extracted by AEs as input has advantages over the conventional method.
The two AEs proposed in the present work, FCAE and DCAE, both have their strength and weakness. For FCAE, its excellent learning ability could be demonstrated by the low training RMSE. The concise structure and high interpretability of FCAE make it more efficient and feasible for the application of sensory laboratories. However, when the size of the dataset is small, FCAE may face some instability and overfitting problems. For DCAE, the overfitting is reduced, and the stability is strengthened by the sparsity of convolution. With convolution and pooling operations, DCAE can consider the original heatmap more comprehensively in view of the scale of the coupling relationship among the sensory attributes. The deviations among the expert evaluators are considered as unnecessary features or noises for a yogurt sample, so they were denoised by convolution and average pooling. However, the preprocess of the dataset for DCAE is a bit time-consuming, and the size of its compiled file model is a bit large. In addition, compared to FCAE, the complexity of DCAE is higher, and its interpretability is worse. The further application of DCAE may be hindered by these factors. Even though at present, DCAE could be a good choice to treat the problem of high-dimensional regression with a small sample size, similar to our yogurt preference prediction, we expect that the excellent learning ability of FCAE may make it a more powerful model once its problem in dataset expansion is improved in the future.
Application of the deep learning approach to preference prediction provides plenty of opportunities for the future processing of food product design. The proposed hedonic contour mapping can reduce the workload of consumer investigation compared to the traditional methods, such as a series of just-about-right (JAR) questions. To explore another group of consumers’ preferences for the similar food product background, only the hedonic scores need to be acquired instead of long JAR questionnaires, because the essential food product features have been extracted and recorded in the deep learning process. In addition, the hedonic contour mapping method is effective for coupling the relationship between any two variables, which will help food enterprises explicitly improve the recipe and sensory qualities of their products. As a result of the limited dataset, the mapping results still cannot be completely correct. The market analysis using these preference data is not within the scope of this manuscript. Our role here as data scientists is to provide data, not the market analysis indicator makers. However, the results of this research can provide food enterprises and sensory researchers with more choices for the future work.
In addition, some of the data resulting from the deep learning approach can benefit the further analyses of samples, as shown by our hierarchical clustering of yogurt samples with the extracted features. Compared to the clustering results obtained from the PLSR key components in our previous study [
35], hierarchical clustering of the features extracted with AE provides better results in terms of storage condition classification, demonstrating the effectiveness of the deep learning process.
5. Conclusions
In this study, a complete AE-SVM deep learning framework is proposed for consumer preferences prediction, and the dataset of yogurt sensory attributes and corresponding consumer preferences demonstrate the feasibility, accuracy, and stability of this model. The process of feature extraction with AE is highly interpretable, and the results obtained can be also extended to the other applications. Further analyses based on the extracted features can contribute to yogurt the improvement of product processing, storage, marketing, etc. By combining hedonic contour mapping with this deep learning approach, it is interpreted that Chinese consumers prefer the yogurts of minimum oxidization/graininess, maximum whiteness, and certain levels of acidity, smoothness, sweetness, milkiness, and adhesiveness. Since the optimal values of various quality attributes revealed by hedonic contour mapping can provide helpful information to the food enterprises, it is recommended that fixed sensory assessors should be trained and prepared to perform sensory evaluation regularly. By the way, application of the proposed AE-SVM deep learning method is proven feasible and effective for quality control of food products. In addition, the feature extraction process mentioned above may provide more useful information if the other techniques for big data collection are followed.


