Article

Infrared Infusion Monitor Based on Data Dimensionality Reduction and Logistics Classifier

School of Mechanical, Electrical and Information Engineering, Shandong University, Weihai 264209, China
*
Author to whom correspondence should be addressed.
Processes 2020, 8(4), 437; https://doi.org/10.3390/pr8040437
Submission received: 13 February 2020 / Revised: 26 March 2020 / Accepted: 31 March 2020 / Published: 7 April 2020

Abstract

:
This paper presents an infrared infusion monitoring method based on data dimensionality reduction and a logistics classifier. In today’s social environment, nurses with hospital infusion work are under excessive pressure. In order to improve the information level of the traditional medical process, hospitals have introduced a variety of infusion monitoring devices. The current infusion monitoring equipment mainly adopts the detection method of infrared liquid drop detection to realize non-contact measurements. However, a large number of experiments have found that the traditional infrared detection method has the problems of low voltage signal amplitude variation and low signal-to-noise ratio (SNR). Conventional threshold judgment or signal shaping cannot accurately judge whether droplets exist or not, and complex signal processing circuits can greatly increase the cost and power consumption of equipment. In order to solve these problems, this paper proposes a method for the accurate measurement of droplets without increasing the cost, that is, a method combining data drop and a logistics classifier. The dimensionalized data and time information are input into the logistics classifier to judge the drop landing. The test results show that this method can significantly improve the accuracy of droplet judgment without increasing the hardware cost.

1. Introduction

In modern medicine, infusion is a very important and basic treatment. However, at present, the hospital mainly uses manual management of infusion information, which has low efficiency and a high labor cost. In order to improve the monitoring quality of infusion monitoring devices, researchers have done a lot of research, but the effect of detection accuracy is not very ideal. Chen, F.G. et al. proposed an infusion monitor based on gravity detection [1], but this type of monitor is very bulky and inconvenient to use and susceptible to system motion. Cataldo, A. et al. proposed a TDR- and microwave-based infusion detector solution [2], but this method has higher power consumption and cannot be flexibly applied. The method of using camera detection proposed by [3] provides a solution that can achieve higher precision detection, but its cost is too high, resulting in unsuitability for large-scale promotion and application. Garmire, E. et al. have done some research on the nature of infrared light propagation. The strong magnetic properties of infrared light and the physical properties of refraction make it ideal for non-contact measurement of droplets, but its signal is not so stable, so there are some difficulties in signal processing. Rachman has designed infrared infusion counters that support wireless communication and use a voltage comparator to process the voltage signal [4]. Zhang, Y. et al. have done a similar design and connected a monostable trigger after the voltage comparator [5]. The above two designs have proved the superiority of the infrared light detection method, but in signal processing, the voltage comparator processing method brings large measurement errors due to temperature change, and the tolerance of noise signal is very low. There are many filtering methods to solve such signal processing problems, but the filter circuit will inevitably use an extra op amp chip, and some excellent filtering circuits even need three or more op amp chips to complete, which increases the size, cost and power consumption of the device [6].
Cui, J. and Han, Z. have suggested that in order to ensure the safety and reliability of infusion monitoring, wireless communication is very necessary for the device [7]. Bluetooth Low Energy (BLE) is a very reliable communication method and it has been widely used in various embedded systems such as indoor positioning [8], outdoor tracking [9], noninvasive pulse oximeter [10], mobile electrocardiogram monitoring [11], and wearable health care equipment [12]. While compatible with various intelligent communication devices, BLE can also be combined with other communication methods to form a complex communication network to increase the size of the communication system [13]. Amano, H. et al. have also conducted research on remote infusion monitoring employing Bluetooth [14]. However, their design, like the design of Wen, X. [15], uses a separate single-chip microprocessor (SCM) to control wireless communication. The microcontroller unit (MCU) of the system is implemented by another SCM. This approach also increases the size, power consumption, and cost of the device. Therefore, the design proposed in this paper will use the CC2540 SCM produced by TI as the only MCU of the system and complete the control of wireless communication and system at the same time.
Logistic classifiers have been widely used in cancer gene selection [16], landslide susceptibility analysis [17,18], children’s sitting posture classification [19], and underwater cylindrical object detection [20], and its stability and superiority have been fully confirmed. On the premise of improving the accuracy of monitoring and counting, the hardware circuit is simplified. The circuit design without an operational amplifier reduces the cost of the circuit and the power consumption of the equipment. Since this detection method needs to store some voltage waveform information and time information, in order to reduce the complexity of the operation and improve the detection efficiency, this paper adds the data dimensionality reduction model before the design of the logistics classifier and adjusts the model parameters of data dimension reduction when training the logistics classifier to achieve more accurate detection. At the same time, in order to obtain the data of the training model and provide the communication interface for information management in practical application, this paper uses the chip supporting BLE4.0 communication control to realize communication and device control at the same time. The experimental results show that this method can improve the detection accuracy of liquid drop and reduce the requirements of hardware equipment, which is conducive to the large-scale development of intelligent infusion equipment in the future.

2. Materials and Methods

2.1. The Equipment

The propagation of infrared light requires a medium, and when the propagation medium is a uniform medium, the propagation of infrared light is a straight line. When infrared light needs to pass through two media with different refractive indices, its propagation path will change due to the refraction phenomenon. The reverse saturation current of the infrared photodiode depends on the intensity of the infrared light it receives at a fixed frequency. When the intensity changes, the reverse saturation current of the infrared photodiode also changes. Therefore, in the process of infusion, it is only necessary to fix a device which can emit infrared light with fixed frequency and intensity at one end of the transparent infusion tube, such as an infrared light-emitting diode, and fix another infrared photodiode at its relative position to detect the change of light transmission medium in the infusion tube. When there is no drop, there is only air in the infusion tube as a light propagation medium, and the infrared light propagates in a straight line. At this time, the infrared photodiode can receive infrared light of a certain intensity. When the liquid drops in the infusion tube, the light propagation medium in the infusion tube becomes air and water droplets. Due to the refraction phenomenon, the infrared ray propagation path emitted by the infrared light-emitting diode changes, so the infrared ray intensity received by the infrared receiving photodiode will change. 
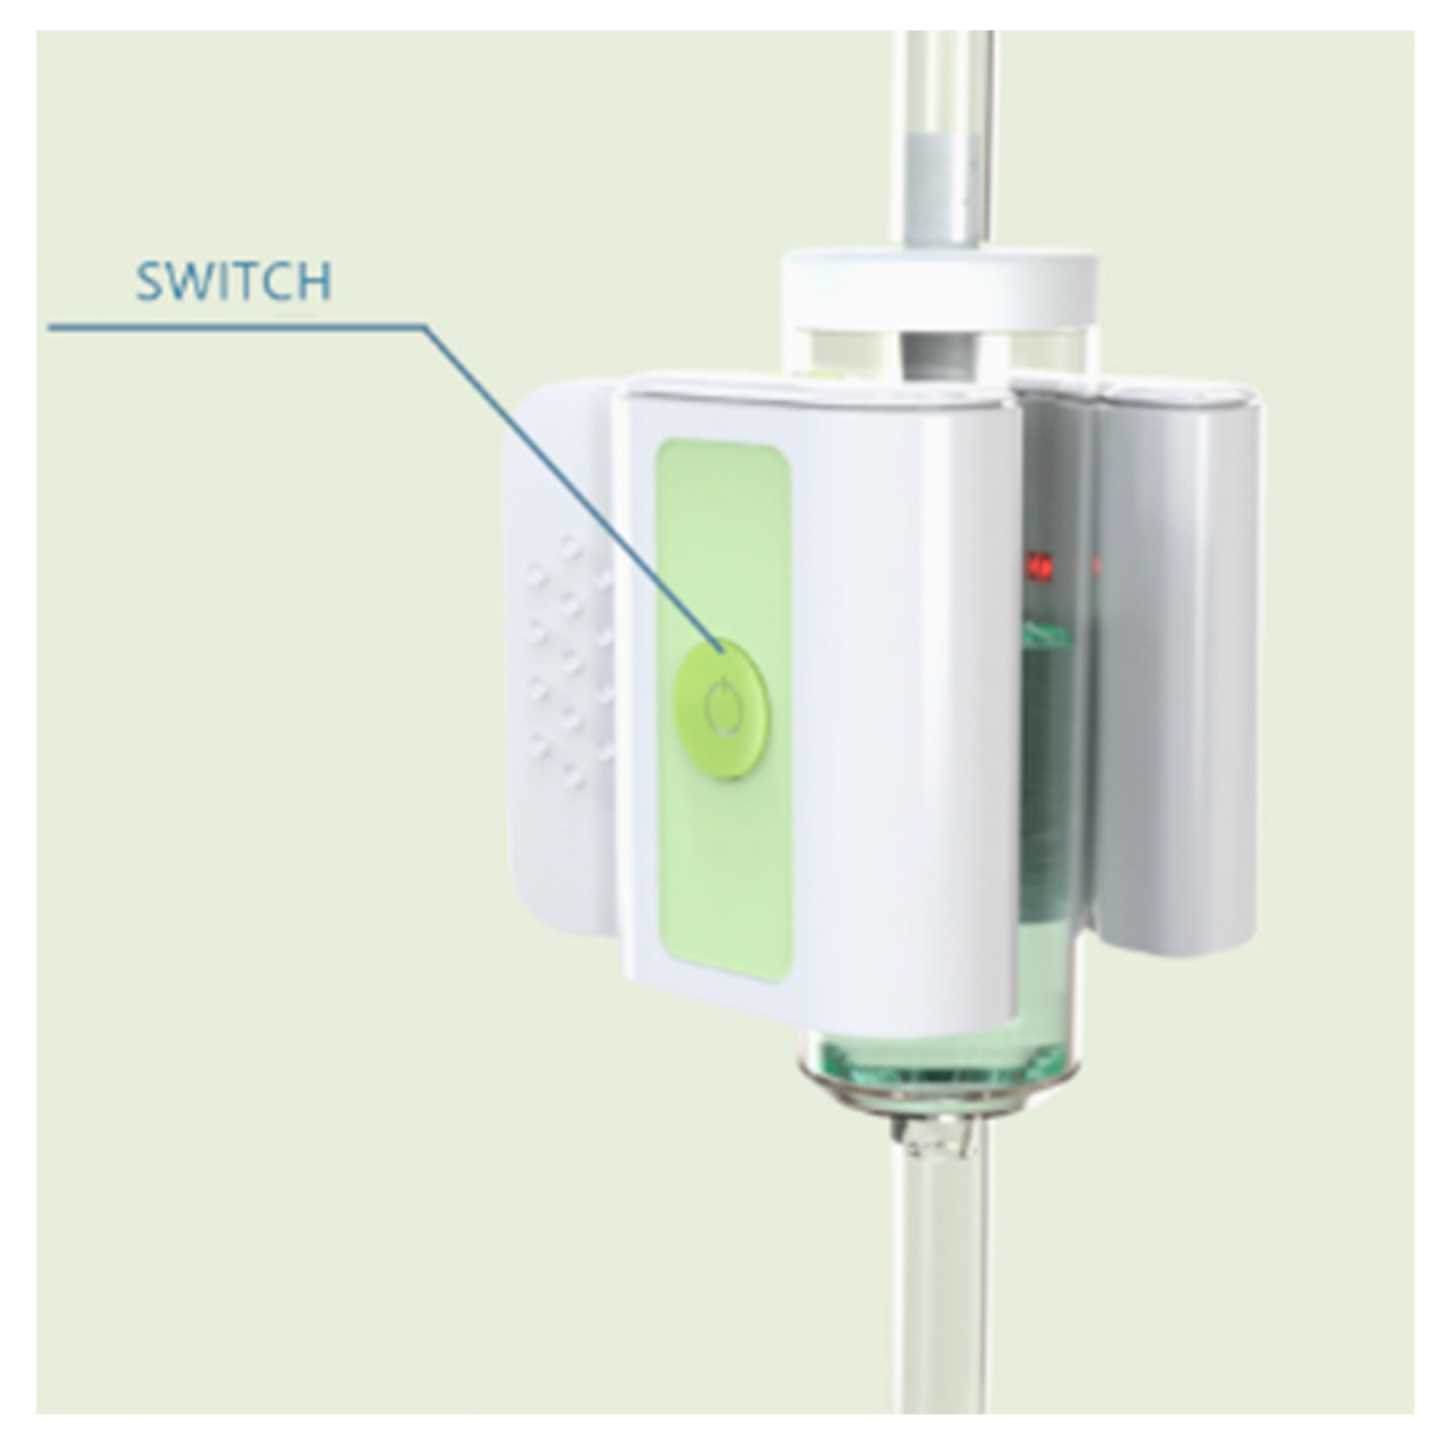
Figure 1 shows the schematic of the infusion monitor while it is in operation.
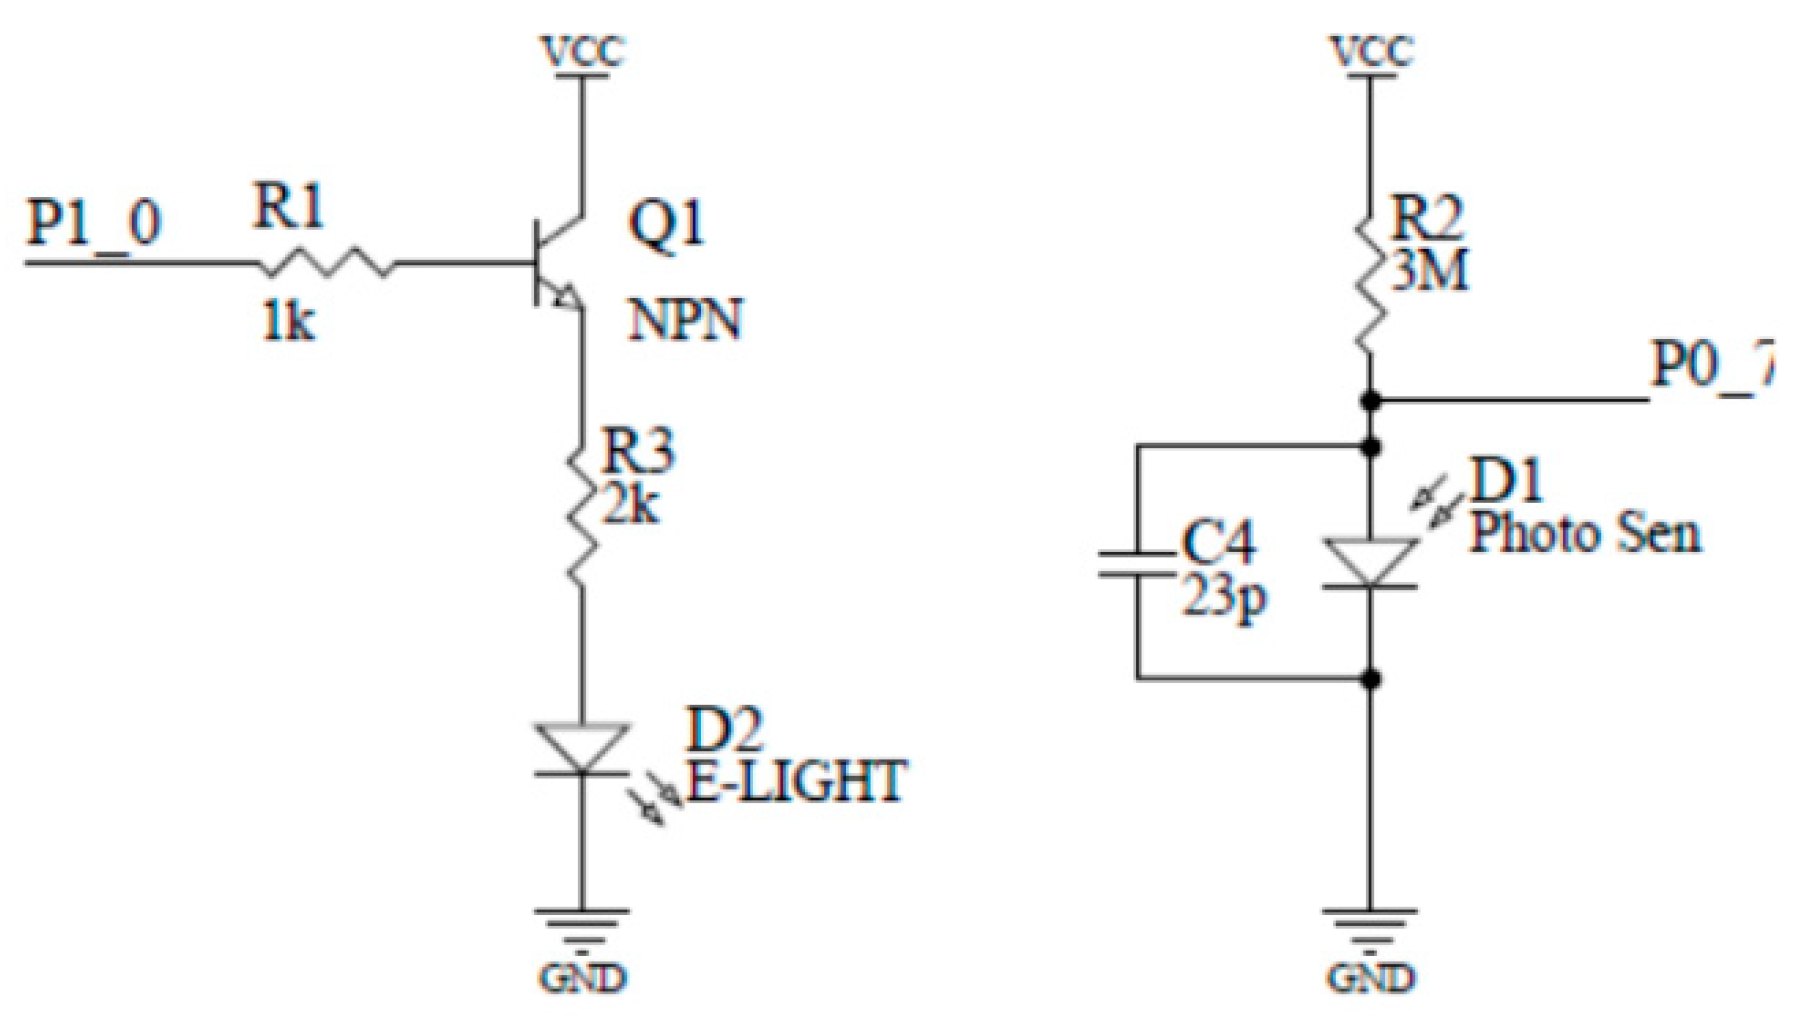
Infrared light-emitting diodes require a constant current to emit a constant intensity of light. In addition, infrared photodiodes need to convert current changes into digital signals and send them to the processor. There are a lot of active devices that can well meet the performance requirements of this circuit, but it will cause a significant increase in power and cost. The circuit shown in Figure 2 uses a bipolar junction transistor (BJT) constant current drive circuit and a passive resistor–capacitor op amp circuit to complete the relevant design requirements.
BLE4.0 is a wireless communication method widely used in embedded devices, so this paper chose the chip CC2540 that supports BLE4.0 as the MCU of the device. Figure 3 shows the MCU and wireless communication circuitry of the device. The infusion monitor device needs to receive the data sent by the host computer while transmitting the signal detected by itself to the upper computer, so the control of the system and the realization of the wireless communication are all required. The CC2540 is a wireless RF micro-controller that can communicate wirelessly with the host computer via the BLE4.0 communication protocol and the onboard inverted-F antenna [21] while completing system control. The PIN10 on the CC2540 is used to control the on and off of the BJT current to achieve LED illumination control to reduce power consumption. The PIN07 converts the analog voltage signal output from the infrared photodiode circuit into a digital signal through the ADC. The antenna section contains a balun circuit [22] to ensure that the inverted F antenna operates in a better state.
The core of the infusion monitor is to judge the drop of the droplet by the characteristics of the collected voltage signal and calculate the infusion speed and the infusion volume according to the correlation coefficient of the droplet tube. However, since the ambient light and temperature have a great influence on the characteristics of the infrared photodiode, a simple voltage shaping circuit cannot output a correct counting pulse. At the same time, the influence of temperature on the reverse saturation current of the photodiode makes the threshold judgment mode not well applied. The environmental noise will cause a large counting error in the edge judgment mode. The complex signal processing circuit will bring higher cost and energy consumption, which has a bad influence on the application prospect of the device.
What we can be sure of is that there is at least one inflection point in the voltage waveform of each droplet—of course, this does not mean that an inflection point is a droplet. Therefore, the inflection point of the voltage waveform can be used as one of the features for further judging whether or not there is a drop. At this point, our problem becomes judging whether the inflection point of a voltage signal represents the landing of a droplet. This is a typical two-category problem.

2.2. The Data Reduction Method

Logistics classifiers are a very common two-classification method. However, with the general logistics classification method, it is difficult to find a set of parameters applicable to different environments; if the environmental conditions are compensated, it is necessary to add new sensors, but such practice will still increase the cost and energy consumption of equipment. Considering that the environmental change of the equipment is continuous and gradual, the rate of change of infusion speed should be within a certain range. Therefore, the voltage characteristic and the last drop time characteristic can help judge the environment, and this change compensates. In this way, we can control the accuracy error caused by environmental changes within the first drop. Once the first drop is judged to be accurate, our equipment can work with high performance in a variety of environments.
However, the CC2540 chip used in this design has limited computing power and storage space, and it also needs to be responsible for wireless communication control, so it is difficult for it to carry out large-scale computation and excessive data storage.
Data dimensionality reduction is a compression of data. To correctly reduce the dimension of data, the first thing is to ensure that the data after the dimension reduction can also carry the information carried by the original data. Since CC2540′s computing power is not strong, the dimension reduction method used in this paper can not be too complex. This paper uses a one-step operation to compress the data and uses the data collected by the device to automatically train the parameters of this step. In order to ensure that the compressed data can carry the information expressed by the original data when training the compression operation parameters, it must be ensured that the compressed data can be restored to the original data through a one-step operation.
Through observation and summary, it is found that the data of at least seven sampling points near the inflection point should be used to represent the waveform changes caused by droplets. That is to say, the voltage input signal V i n 
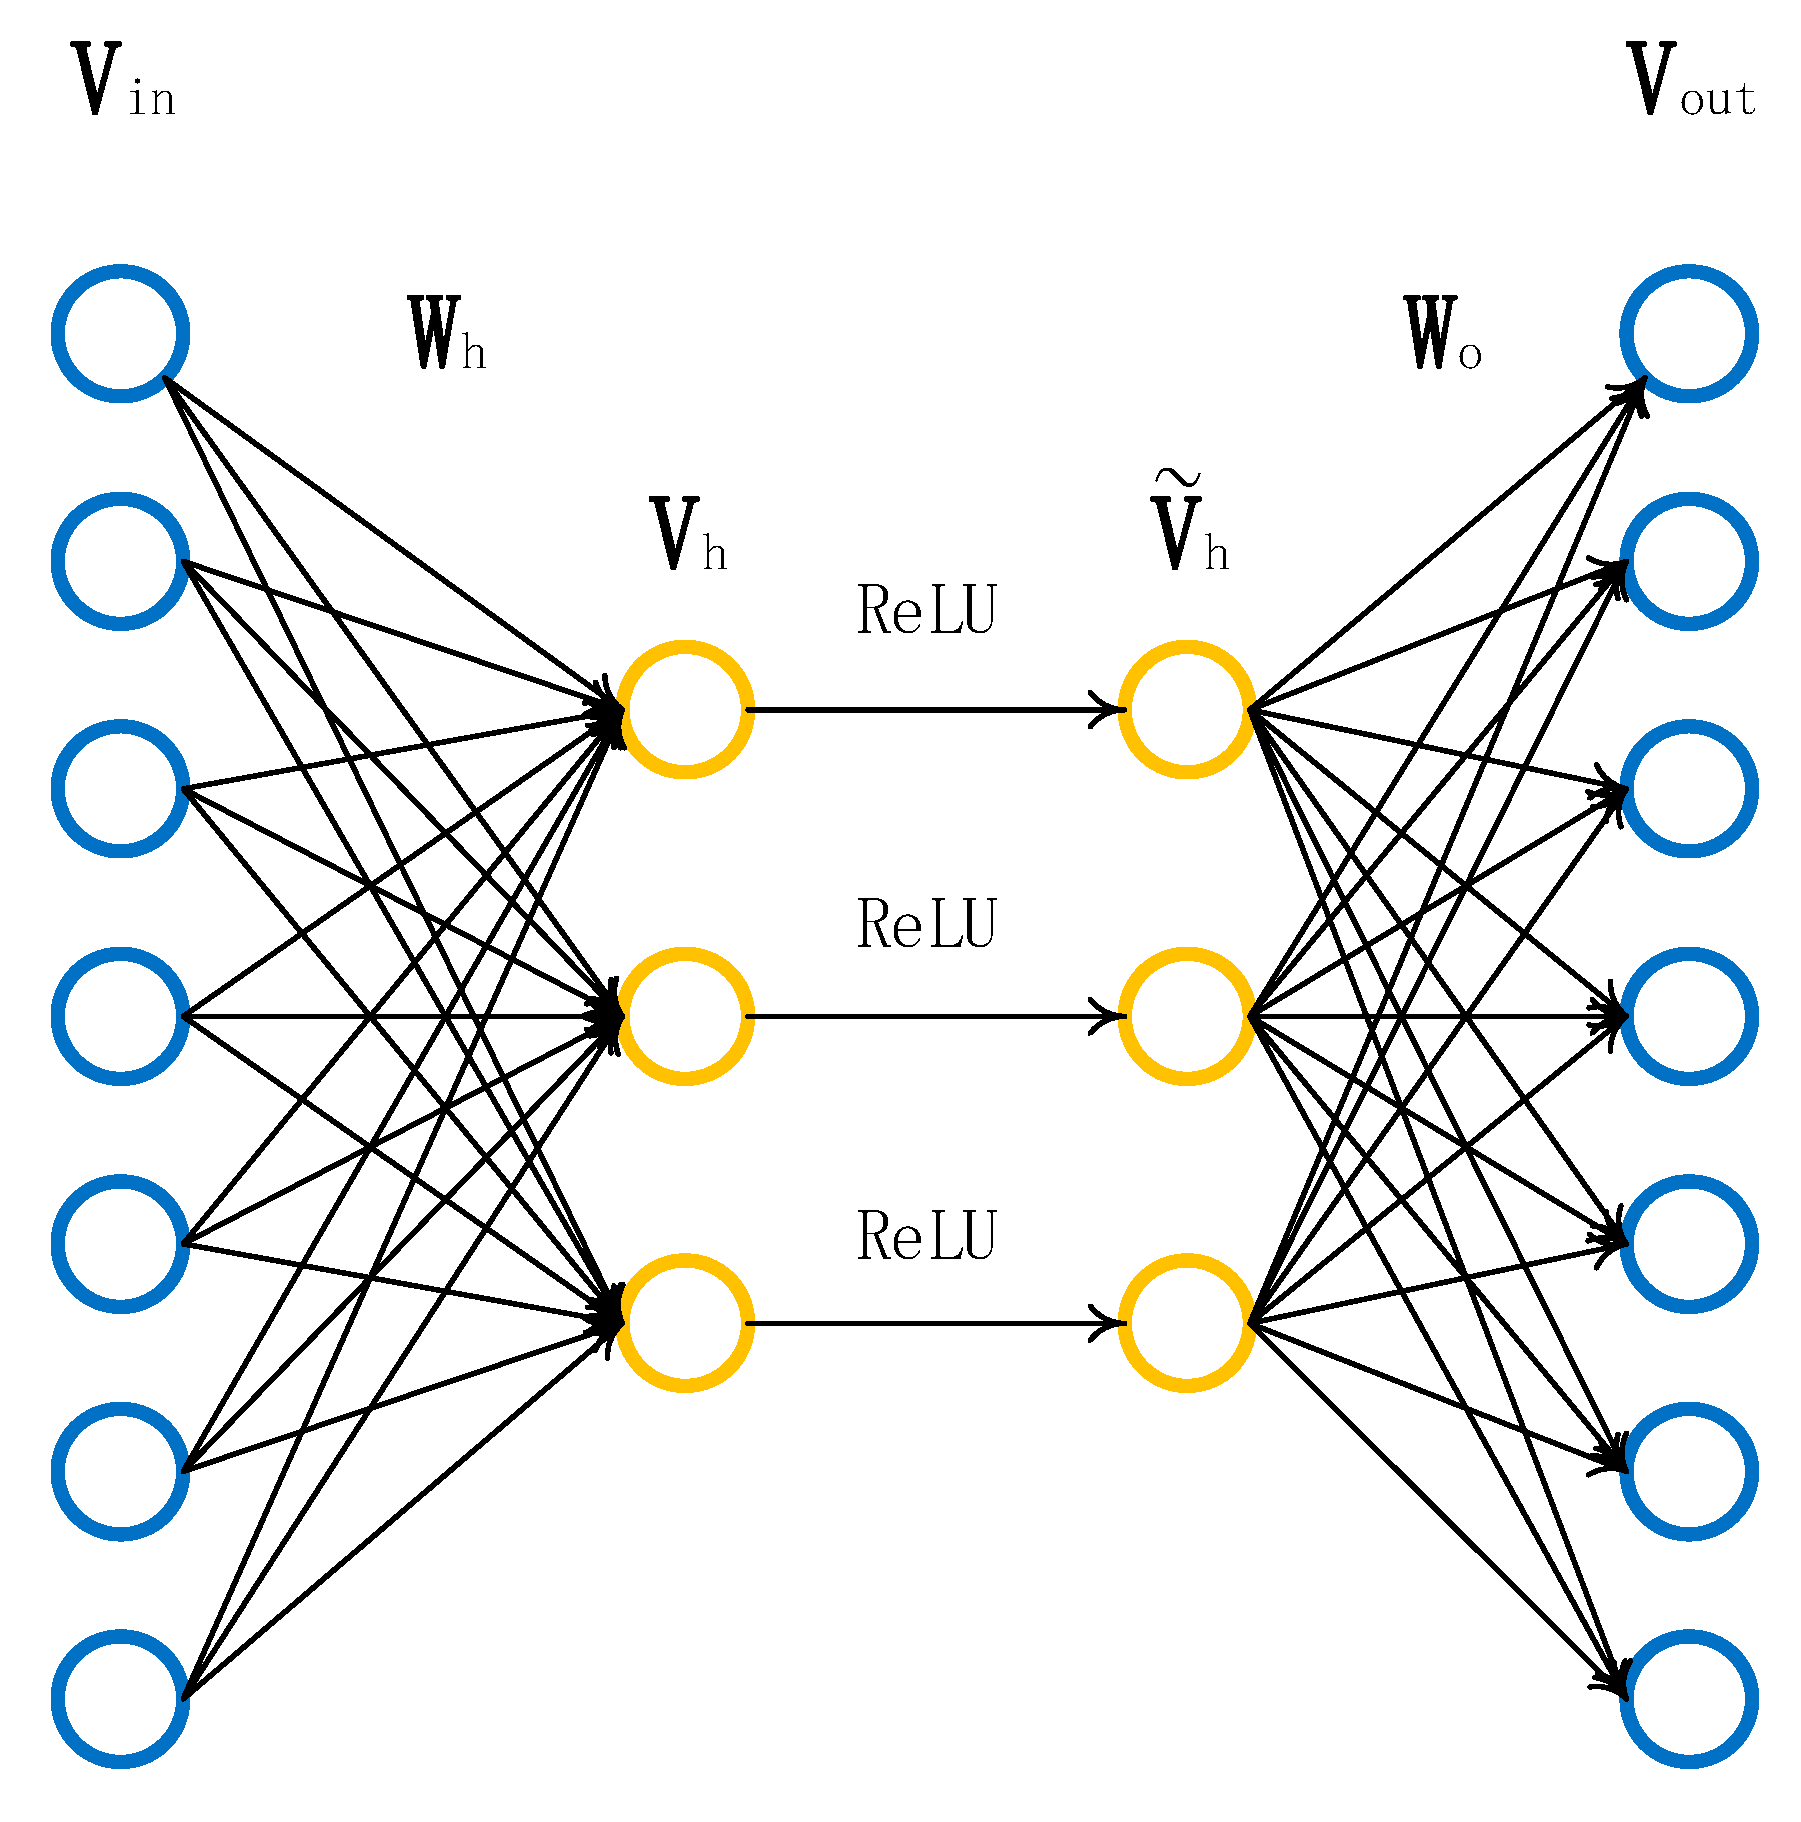
is a seven-dimensional vector. In order to simplify the calculation, this paper uses a three-dimensional vector to represent its hidden features. So, this paper proposed the following two steps:
V h = f ( V i n ) ,
V o u t = g ( V h ) ,
The intermediate variable V h is the feature that we want to extract, and the output signal V o u t is the vector equal to the input signal V i n . For these two operations, we do not care about the specific form of the output signal V o u t and its mapping mode g because they just reproduce the input signal. What is really needed is V h as the intermediate variable and its mapping method, f , because under the premise that the intermediate variable V h is different from the input signal V i n , the system can also restore the input signal V i n through the intermediate variable V h , which indicates that the intermediate variable V h has all the information input signal V i n carries, but it is expressed in a different form. This shows that the intermediate variable V h has completed the task of data dimensionality reduction.
For mapping f and mapping g , the most intuitive and efficient operation is linear transformation:
V h = V i n W h + B h ,
V o u t = V h W o + B o ,
However, the intermediate variable V h obtained by this method has a serious problem. Since there is only a linear link in the operation process, when the weight matrix W h and the offset matrix B h are acquired, there may be a problem that the feature expression is insufficient. So, this paper adds a nonlinear transformation between V h and V o u t , and make its output V ˜ h as the final voltage characteristic. The expression for V ˜ h is
V ˜ h = ReLU ( V h ) = MAX ( V ˜ h , 0 ) ,
Figure 4 shows the node calculation diagram after adding a nonlinear transformation, in which the constant bias term is omitted.
The following shows how to get the parameters W h and B h from the data samples. First, this paper takes the actual voltage data that needs to be extracted by the model as the sample data set and ensures that the data volume of this data set enables us to obtain the optimal parameters. After taking the samples, first, assign the weight matrices W h and W o to a set of values in a random manner and initialize the bias matrices B h and B o to zero vectors. Obviously, V o u t is completely different from V i n and has a big difference. In order to narrow the difference between the two, it is needed to define a function to measure this difference; here, we use the mean square function:
( i ) ( W h , B h , W O , B O ) = 1 2 ( V i n ( i ) V o u t ( i ) ) 2 ,
The constant coefficient 1/2 makes the constant coefficient after deriving the squared term is 1, which makes the formula form in the parameter optimization process simpler. Obviously, the smaller the error, the closer the output value V o u t is to the input value V i n , and the error is zero when the two are equal. In a given sample data set, this error is only related to the parameters of the model, so it can be recorded as a function with the model parameters as parameters. In addition, this paper measures the quality of the model parameters using the average of all sample errors in the sample data set:
( W h , B h , W O , B O ) = 1 n i = 1 n ( i ) ( W h , B h , W O , B O ) = 1 n i = 1 n 1 2 ( V i n ( i ) V o u t ( i ) ) 2 ,
In the optimization process, we want to find a set of model parameters, denoted as, to minimize the mean square function of the training samples:
W h , B h , W O , B O = a r g m i n W h , B h , W O , B O ( W h , B h , W O , B O ) ,
In addition, the next step is iterate over the parameters of the model so that each iteration may reduce the value of the mean squared function. In each iteration, a small batch of B is randomly selected at first, which contains a fixed number of training samples. Then, the mean square error of the derivative of the data samples with respect to the model parameters is calculated. Then, you take the product of that with a positive number reduction as model parameters in this iteration.
After the iteration is complete, this paper takes another dataset from outside the training dataset and names it the test dataset. The test data set is also the actual voltage data from the device. The test data is taken as the input of the model, the mean square error function value of the model is calculated, and the quality of the model parameters is evaluated by the magnitude of the function value. If the mean squared function value is close to 0, the model parameters meet the requirements; otherwise, iterate again.
Logistics classifiers have a good performance in the two-class problem and have been widely used in various fields such as medicine, the environment, and society. In this design, to complete the task of droplet counting, the first thing to do is whether there is a drop at a point in time. For a sampling time point, there are two states of “with droplets” and “without droplets”. The formula for the logistic classifier is
O = h ( X ) = [ o 1 o 2 ] ,
y ^ 1 = exp ( o 1 ) exp ( o 1 ) + exp ( o 2 ) ,
y ^ 2 = exp ( o 2 ) exp ( o 1 ) + exp ( o 2 ) ,
The value of the voltage on both sides of the transfer voltage inflection point and the time interval between it and the inflection point indicated by the droplet before are used to judge whether the droplet exists. Therefore, the voltage characteristic signal and time interval signal are used as the input of logistic regression, and the probability of occurrence of these two states is taken as the output of logistic regression.
The content of the function h is trained by the sample data. The gradient descent optimization method is still used when training the weight matrix [23,24]. The difference from the general regression problem is that it does not need the prediction probability to be exactly equal to the label probability. Only the predicted value of the correct result is greater than the other result, so the mean squared loss will no longer apply. The cross-entropy loss is very suitable for measuring the difference between two probability distributions. Therefore, this paper used the cross-entropy loss as the loss function of the model when optimizing the weight matrix of logistic regression. The specific formula for cross-entropy loss in this model is
H ( y ( i ) , y ^ ( i ) ) = ( y 1 ( i ) log y ^ 1 ( i ) + y 2 ( i ) log y ^ 2 ( i ) ) ,
In the above formula, y ( i ) represents the tag value of the sample data, and its elements y 1 ( i ) and y 2 ( i ) must be one for 0 and the other for 1; y ^ ( i ) is a probability prediction value obtained after the sample data is calculated, and the elements y ^ 1 ( i ) and y ^ 2 ( i ) are values between 0 and 1.
The node calculation diagram of the actual application of the data dimensionality reduction model and the logistics classifier designed in this paper is shown in Figure 5.
For its briefness, efficient and accuracy. Other machine learning methods would be too complicated for this equipment; it is hard to classify the pseudo-code in this situation, as shown in Algorithm 1, where η is the step size, γ is the specific gravity of the sliding gradient, ϵ is a constant for stability, T is a small sample size.
Algorithm 1 Data reduction algorithm
  Input: Data set:   D = { V i n ( 1 ) ,   V i n ( 2 ) ,   V i n ( 3 ) , , V i n ( m ) }
  Number of small batch samples:   T
  Training super parameters: η , γ , ϵ
  Iteration times:   I
  Output: W h and B h
  Process:
  • s 0 = 0
  • for i = 1 , 2 , , I do
  •  for t = 1 ,   2 , , T do
  • V h = V i n t W h + B h
  • V ˜ h = ReLU ( V h )
  • V o u t = V ˜ h W o + B o
  • L = ( W h , B h , W O , B O ) )
  • g t = g r a d ( L )
  • s t = γ s t 1 + ( 1 γ ) g t g t
  • ( W h , B h , W o , B o ) = ( W h , B h , W o , B o ) η s t + ϵ g t
  •  end for
  • end for;

2.3. Logistic Classifier

When the droplet falls, the voltage signal will appear in a waveform that rises first and then falls. According to this feature, the inflection point of the voltage signal, especially the inflection point from rise to fall, can be used as the characteristic point. However, since there may be such a turning point in the noise, it is not directly believed that such a turning point is a drop of water. Therefore, this paper inputs the voltage value at the inflection point, the voltage values of the first three inversion points, and the latter three sampling points into the model of feature extraction to obtain a three-dimensional voltage feature vector.
In order to make the equipment adapt to the changes of the environment, it is necessary to ensure that the logistic classifier has higher accuracy for the sample data in different environments. However, it has been found through experiments that if only one voltage value at the inflection point is used as the input variable, it is difficult to adapt the voltage signal in different environments through one set of parameters. Therefore, before the current inflection point, the knee voltage characteristic which is judged to have a drop point is used as a reference for the input signal. In addition, considering that the droplet velocity change of the droplet should be in a certain range, the interval between the droplets also has a certain influence on the confidence of the droplet existence, so this paper puts the interval between the current inflection point and the previous droplet. The time interval and the time interval of the last drop are separately inputted into the classifier as time influence factors. When the system has not yet collected the droplets during the startup, this paper burns a set of pre-set data with the appropriate droplet data into the program as the data of the 0th droplet. This approach can only control the interference caused by environmental changes in the judgment of the first droplet. Once the first droplet is judged, the system can start executing the high-precision droplet judgment algorithm.
Summarizing the above steps, the droplet detection algorithm proposed in this paper is shown in Figure 6.

3. Results

The device can be installed in various scenarios that may appear in the real world to collect and sample data near the inflection point of 50,000 voltage values, and upload the data to the upper computer through wireless transmission by using the antenna of the device. Then, thousands of iterations were conducted to train the dimensionality reduction model. At this point, the values of each parameter in algorithm 1 are shown as follows:
η = 0.02 ;   γ = 0.8 ;   ε = 10 6 ;   T = 5
In this part of the experiment, this paper applies the algorithm model to the actual equipment and tests it in the real environment. However, the other text-related products are not given to data accuracy, so compared with other products, we do not know how to start and this can only be learnt from related industries; presently related equipment cannot meet the needs of the industry for accuracy, and the application of our method, under the environment of various kinds of actual testing accuracy, meets the needs of practical application standards (the error is within 2%, or 500 mL of transfusion bottle 10 mL of error).
The mean square loss of main training times and the change of training times are shown in Figure 7. The x-coordinate is the training times and the y-coordinate is the loss degree and the data type is logarithmic. In Figure 7 and Figure 8, dark red represents the description of the original data. Bright red is used by the tensor board to filter the original data automatically, which can better show the trend of data loss rate.
In addition, the dimension-reduced data retain the characteristics of the original data. However, at the same time, it retains the characteristics of useful signals, as well as the characteristics of some useless signals, such as noise and interference. Therefore, in this paper, while training the classifier, some parameters of the data dimensionality reduction model were fine-tuned to ensure that the algorithm model can get better results. In the training process, in order to reduce the dependence of the classifier on temperature conditions and lighting environments, this paper added voltage data under different temperature conditions and lighting conditions to the training data set. Finally, the training data under different drop speeds was added to reduce the dependence of the classifier on the time characteristic parameters, so that the classification performance of the classifier can be better played in various environments. As the number of trainings increase, the cross-entropy loss of the model and the correct rate of classification are shown in Figure 8. By looking at Figure 8, it can be seen that the cross-entropy loss of the model has dropped to a very low level, and the classifier’s classification ability has reached 100%.
Next, test the actual test performance of the device. The test placed three infusion detection devices by the window, indoors, and in the shade, and started counting 100 mL of liquid every hour from 12:00 noon. Since the drop coefficient of the infusion tube is 15 drops/mL, the theoretical correct value of the infusion detector should be 1500 drops.
In the actual collection in this paper, there are 2682 data from the shady place, 3010 data from indoor, and 2611 data from by the window. When stratified sampling was conducted, 70% of the sampled data is used for training and 30% for actual testing. After training, the recall rate measured on the training set was 100%, and the accuracy rate measured on the test set was also 100%. When applied to the actual Bluetooth device, this value decreased slightly. The data records of the test are shown in Table 1, and the change in accuracy is shown in Figure 9. The conclusion is that the infusion detector has high accuracy in three environments and, at each time, is easily derived.
After the test set was constructed, two sets of test data were randomly selected in the test set. The test results are shown in Figure 10a,b, where red is the input data (original data) and green is the generalization of the basic expression algorithm of the results of the two graphs after reconstruction.

4. Conclusions

The main content of this design is the optimal design of the infusion monitor. After the completion of the basic detection method screening, this paper determined the infrared detection method to achieve our goal. Infrared infusion monitors have existed before, but there were various problems in the previous design, or there was a contradiction between cost and effect, which made the application and promotion of infrared infusion detectors very difficult. This design improves the use effect by using data dimensionality reduction and a logistics classifier without increasing hardware cost and power consumption. At the same time, we should be aware that this method of droplet detection and classification may not be applicable only to the field of medical infusion.
In the next step, we will mainly research the accuracy error caused by liquids with special physical properties and the problem of not being able to automatically identify the droplet size. Since most of the liquids involved in the infusion are transparent solutions, colloids and turbid liquids may be rare. Therefore, we did not sample the relevant data at the time of design. We will do some processing on this part of the data in the next step. In addition, the models of the infusion tubes are not the same, the volume of each drop will be different, but our model cannot automatically distinguish the droplets of different volumes, so we will optimize the structure of the classifier to get the ability to automatically identify the size of the drop.

Author Contributions

X.W. and Y.S. proposed the innovative idea; X.W. and H.Z. conceived the algorithm and wrote the first draft; Y.S. improved the algorithm; X.W. performed the experiments; Y.S. and X.W. analyzed the results; X.W. drafted the manuscript; Y.S. provided writing advice; Y.S. read and approved the final manuscript. All authors have read and agreed to the published version of the manuscript.

Funding

The research received no external funding.

Acknowledgments

We are very grateful for the technical support of the DL850E ScopeCorder. This work is supported by the National Natural Science Foundation of China under grant 61973184, 61573213, and the National Key Research and Development Plan of China under grant 2017YFB1300205. We gratefully acknowledge the technical assistance of the DL850E ScopeCorder.

Conflicts of Interest

The authors declare no conflict of interest.

References

  1. Chen, F.-G.; Wang, J.-Y.; Chen, S.; Tu, S.-C.; Chen, K.-Y. A Hang-and-Play Intravenous Infusion Monitoring System. In Proceedings of the 2015 3rd International Conference on Applied Computing and Information Technology/2nd International Conference on Computational Science and Intelligence, Okayama, Japan, 12–16 July 2015; pp. 278–281. [Google Scholar]
  2. Cataldo, A.; Cannazza, G.; De Benedetto, E.; Giaquinto, N.; Trotta, A. Reproducibility analysis of a TDR-based monitoring system for intravenous drip infusions: Validation of a novel method for flow-rate measurement in IV infusion. In Proceedings of the 2012 IEEE International Symposium on Medical Measurements and Applications Proceedings, Budapest, Hungary, 18–19 May 2012; pp. 1–5. [Google Scholar]
  3. Maaß, S.; Rojahn, J.; Hänsch, R.; Kraume, M. Automated drop detection using image analysis for online particle size monitoring in multiphase systems. Comput. Chem. Eng. 2012, 45, 27–37. [Google Scholar] [CrossRef]
  4. Rachman, F.Z. Prototype development of monitoring system in patient infusion with wireless sensor network. In Proceedings of the 2015 International Seminar on Intelligent Technology and Its Applications (ISITIA), Surabaya, Indonesia, 20–21 May 2015; pp. 397–402. [Google Scholar]
  5. Zhang, Y.; Zhang, S.; Ji, Y.; Wu, G. Intravenous infusion monitoring system based on WSN. In Proceedings of the IET International Conference on Wireless Sensor Network 2010 (IET-WSN 2010), Beijing, China, 15–17 November 2010; pp. 38–42. [Google Scholar]
  6. Kubanek, D.; Freeborn, T.; Koton, J.; Dvorak, J. Validation of Fractional-Order Lowpass Elliptic Responses of (1 + α)-Order Analog Filters. Appl. Sci. 2018, 8, 2603. [Google Scholar] [CrossRef] [Green Version]
  7. Jianwen, C.; Han, Z. Design of intravenous infusion monitoring and alarm system based on wireless communication technology. In Proceedings of the 2011 IEEE International Conference on Mechatronics and Automation, Beijing, China, 7–10 August 2011; pp. 130–134. [Google Scholar]
  8. Zhang, D.-Y.; Wang, W.-Y.; Lv, L.-R. Research on Algorithm of Indoor Positioning System Based on Low Energy Bluetooth 4.0. ITM Web Conf. 2017, 11, 03007. [Google Scholar] [CrossRef] [Green Version]
  9. Lin, Y.-J.; Chen, H.-S.; Su, M.-J. A cloud based Bluetooth Low Energy tracking system for dementia patients. In Proceedings of the 2015 Eighth International Conference on Mobile Computing and Ubiquitous Networking (ICMU), Hokkaido, Japan, 20–22 January 2015; pp. 88–89. [Google Scholar]
  10. Dai, Y.; Luo, J. Design of Noninvasive Pulse Oximeter Based on Bluetooth 4.0 BLE. In Proceedings of the 2014 Seventh International Symposium on Computational Intelligence and Design, Hangzhou, China, 13–14 December 2014; pp. 100–103. [Google Scholar]
  11. Deb, D.; Sonowal, S. Synthetic jet actuator based adaptive neural network control of nonlinear fixed pitch wind turbine blades. In Proceedings of the 2013 IEEE International Conference on Control Applications (CCA), Hyderabad, India, 28–30 August 2013; pp. 152–157. [Google Scholar]
  12. Zhang, T.; Lu, J.; Hu, F.; Hao, Q. Bluetooth low energy for wearable sensor-based healthcare systems. In Proceedings of the 2014 IEEE Healthcare Innovation Conference (HIC), Seattle, WA, USA, 8–10 October 2014; pp. 251–254. [Google Scholar]
  13. Choudhury, S.; Kuchhal, P.; Singh, R. Anita ZigBee and Bluetooth Network based Sensory Data Acquisition System. Procedia Comput. Sci. 2015, 48, 367–372. [Google Scholar] [CrossRef] [Green Version]
  14. Amano, H.; Ogawa, H.; Maki, H.; Tsukamoto, S.; Yonezawa, Y.; Caldwell, W.M. 14-A remote drip infusion monitoring system employing Bluetooth. In Proceedings of the 2012 Annual International Conference of the IEEE Engineering in Medicine and Biology Society, San Diego, CA, USA, 28 August–1 September 2012; pp. 2029–2032. [Google Scholar]
  15. Wen, X. Design of Medical Infusion Monitor and Protection System Based on Wireless Communication Technology. In Proceedings of the 2008 Second International Symposium on Intelligent Information Technology Application, Shanghai, China, 20–22 December 2008; pp. 755–759. [Google Scholar]
  16. Wu, S.; Jiang, H.; Shen, H.; Yang, Z. Gene Selection in Cancer Classification Using Sparse Logistic Regression with L1/2 Regularization. Appl. Sci. 2018, 8, 1569. [Google Scholar] [CrossRef] [Green Version]
  17. Chen, W.; Sun, Z.; Han, J. Landslide Susceptibility Modeling Using Integrated Ensemble Weights of Evidence with Logistic Regression and Random Forest Models. Appl. Sci. 2019, 9, 171. [Google Scholar] [CrossRef] [Green Version]
  18. Chen, W.; Shahabi, H.; Zhang, S.; Khosravi, K.; Shirzadi, A.; Chapi, K.; Pham, B.; Zhang, T.; Zhang, L.; Chai, H.; et al. Landslide Susceptibility Modeling Based on GIS and Novel Bagging-Based Kernel Logistic Regression. Appl. Sci. 2018, 8, 2540. [Google Scholar] [CrossRef] [Green Version]
  19. Kim, Y.; Son, Y.; Kim, W.; Jin, B.; Yun, M. Classification of Children’s Sitting Postures Using Machine Learning Algorithms. Appl. Sci. 2018, 8, 1280. [Google Scholar] [CrossRef] [Green Version]
  20. Seo, Y.; On, B.; Im, S.; Shim, T.; Seo, I. Underwater Cylindrical Object Detection Using the Spectral Features of Active Sonar Signals with Logistic Regression Models. Appl. Sci. 2018, 8, 116. [Google Scholar] [CrossRef] [Green Version]
  21. Hirvonen, M.; Pursula, P.; Jaakkola, K.; Laukkanen, K. Planar inverted-F antenna for radio frequency identification. Electron. Lett. 2004, 40, 848–850. [Google Scholar] [CrossRef]
  22. Nath, A.; Deb, D.; Dey, R.; Das, S. Blood glucose regulation in type 1 diabetic patients: An adaptive parametric compensation control-based approach. IET Syst. Biol. 2018, 12, 219–225. [Google Scholar] [CrossRef] [PubMed]
  23. Mason, L.; Baxter, J.; Bartlett, P.L.; Frean, M.R. Boosting algorithms as gradient descent. In Proceedings of the Advances in Neural Information Processing Systems, Denver, CO, USA, 29 November–4 December 1999; pp. 512–518. [Google Scholar]
  24. Nath, A.; Deb, D.; Dey, R. An augmented subcutaneous type 1 diabetic patient modelling and design of adaptive glucose control. J. Process Control 2020, 86, 94–105. [Google Scholar] [CrossRef]
Figure 1. Droplet counter working diagram.
Processes 08 00437 g001
Figure 2. Infrared photodiode circuit.
Processes 08 00437 g002
Figure 3. Microcontroller unit (MCU) and wireless module circuit.
Processes 08 00437 g003
Figure 4. Feature extraction node calculation graph.
Processes 08 00437 g004
Figure 5. The node calculation diagram of the actual application of the data dimensionality reduction model and the logistics classifier.
Processes 08 00437 g005
Figure 6. Droplet detection algorithm flow chart.
Processes 08 00437 g006
Figure 7. (a) The average square loss during training varies with the number of training sessions. (b) The average square loss during the test process varies with the number of training sessions.
Processes 08 00437 g007
Figure 8. (a) The change of cross-entropy loss with training times during training. (b) The change of cross-entropy loss with training times during testing.
Processes 08 00437 g008aProcesses 08 00437 g008b
Figure 9. The change in accuracy in this test.
Processes 08 00437 g009
Figure 10. Test set test results. (a) Random set 1; (b) random set 2.
Processes 08 00437 g010
Table 1. Test data record.
12:0013:0014:0015:0016:0017:0018:00TheoryAccuracy
By the Window1486149315041498150214961503150099.83%
Indoor1494150815121488149315021510150099.93%
Shady Place1502150314951498150114891497150099.86%

