Article

Design and Optimization of Fluidized Bed Reactor Operating Conditions for Struvite Recovery Process from Swine Wastewater

1
Department of Animal Industry Convergence, College of Animal Life Sciences, Kangwon National University, Chuncheon 24341, Korea
2
Department of Animal Resources, College of Life and Environmental Science, Daegu University, Gyeongsan 38453, Korea
3
Department of Environmental Science, College of Agricultural Sciences, IUBAT—International University of Business Agriculture and Technology, Dhaka 1230, Bangladesh
4
U.S. Pakistan Center for Advanced Studies in Water, Mehran University of Engineering and Technology, Jamshoro 76062, Sindh, Pakistan
*
Author to whom correspondence should be addressed.
These authors contributed equally to this work.
Processes 2020, 8(4), 422; https://doi.org/10.3390/pr8040422
Submission received: 10 March 2020 / Revised: 28 March 2020 / Accepted: 30 March 2020 / Published: 2 April 2020
(This article belongs to the Special Issue Control and Optimization of Wastewater Treatment Technology)

Abstract

:
Struvite crystallization using fluidized bed reactors (FBRs) is one of the most commonly used methods for nutrient recovery from different waste streams. However, struvite recovery from swine wastewater containing much higher solids using FBR has not been studied extensively. In this study, we therefore designed and optimized the key operating conditions parameters, i.e., pH (9.0, 9.5, and 10.0), circulation rate (CR) (1.5, 3.0, and 4.5 L/Lreactor·h), and hydraulic retention time (HRT) (1, 3, and 5 h) of FBR to ensure efficient nutrient removal and struvite crystallization from swine wastewater using response surface methodology (RSM) with central composite design (CCD) as experimental design. A magnesium/phosphorus (Mg/P) molar ratio of 1.3 was maintained with MgCl2 according to ortho-phosphate (O-P) concentration of influent and an air diffuser was set to supply air with 0.03 L air/Lreactor·min. The O-P recovery efficiency of over 91% was achieved through the entire runs. Among the operational parameters, pH did not show any significant effect on NH4-N recovery, particle size, and struvite production rate (SPR). The optimal CR over 2.94 L/Lreactor·h was found to be appropriate for efficient removal of nutrients and struvite crystallization. While optimizing the HRT, priority of the process operation such as the production of larger struvite particles or increased struvite productivity should be considered. Therefore, the optimal operational parameters of pH 9.0, CR > 2.94 L/Lreactor·h, and HRT of 1 or 5 h were chosen to obtain better responses through RSM analyses. The findings of this study would be useful in designing and operating either pilot- or full-scale FBR for struvite crystallization from swine wastewater.

1. Introduction

Struvite is magnesium ammonium phosphate and usually crystallizes when equimolar concentrations are achieved in alkaline conditions. It is sparingly soluble in alkaline solutions and soluble in acids [1]. Deliberate struvite crystallization can be used to prevent scaling in wastewater treatment plants, minimize sludge volume, and remove nutrients from waste sources [2,3,4]. Struvite crystallization as P recovery technology has become a topic of interest among the researchers due to increased costs of energy, diminishing P reserves, and its potentiality as an alternative to commercial P sources. [5,6,7]. However, only a few commercial full-scale struvite production facilities using sewage and municipal wastewater have been constructed up to now [8,9].
The effectiveness of the struvite recovery process depends on the reactor type as well as its recovery efficiency and recovered product quality [10]. Li et al. [11] provided information on the different reactors investigated for struvite crystallization. Among the reactors, mechanically stirred reactors (MSRs) and fluidized bed reactors (FBRs) are the most commonly used. The MSR is simple in design and widely used in the industries. It shows comparatively high phosphorus removal efficiencies, whereas high mixing intensity often produces fine and impure struvite crystals [12]. On the other hand, FBR can produce struvite crystals with desirable qualities. The FBR not only eases the scaling problem in wastewater treatment plants but also the size of the struvite crystal increases over time [13]. Despite having the advantage of producing larger struvite particles, the P recovery efficiencies of FBR are not satisfactory due to the fluidization of particles that needs a high upward flow velocity as well as the loss of struvite fines in the effluent [14,15]. Considering the above, we designed an FBR to mitigate the flushing out of struvite fines from the reactor.
Process optimization plays a significant role in ensuring optimal use of the resources or to minimize production of undesired by-products and thus improves the effectiveness and efficiency of the designed process. Diverse approaches can be adapted to optimize a chemical reaction for struvite formation. Among the methods, the response surface method (RSM) is most commonly used for optimization as it elucidates the effects of multiple explanatory variables on struvite production and general quality refinement with minimal experimental trials [16]. Moreover, RSM can be used to improve empirical models and identify uncertain phenomenon [17]. RSM produces the mathematical model with an experimental method to analyze independent variables [18] and uses an experimental design to represent as response surface of the quadratic model equation such as full factorial design, fractional factorial design, Box–Behnken design, and Doehlert design. As a fractional factorial design, central composite design (CCD) has been widely used in environmental studies [17]. Ahamdi et al. also mentioned that CCD could be applied to calculate the mathematical equation for the quantitative assessment of the process in pollutant removal [19].
Recent reviews by Kataki et al. [20] and Ahmed et al. [21] provide information on struvite recovery from different waste streams. Swine wastewater is an excellent source of struvite formation as it contains high amounts of nitrogen (N) and P. However, the magnesium (Mg) concentration in swine wastewater is generally low. An external source of Mg is therefore needed to enhance the recovery process [4]. Until now, various reactors have been used to recover struvite from swine wastewater [11,22]. Whereas struvite recovery from swine wastewater containing much higher solids using FBR has not been studied extensively. The aim of this study was therefore to optimize the key operational parameters for successful FBR operation to recover ortho-phosphate (O-P) and ammonium nitrogen (NH4-N), increase particle size, and improve struvite production rate (SPR) via struvite formation using RSM.

2. Materials and Methods

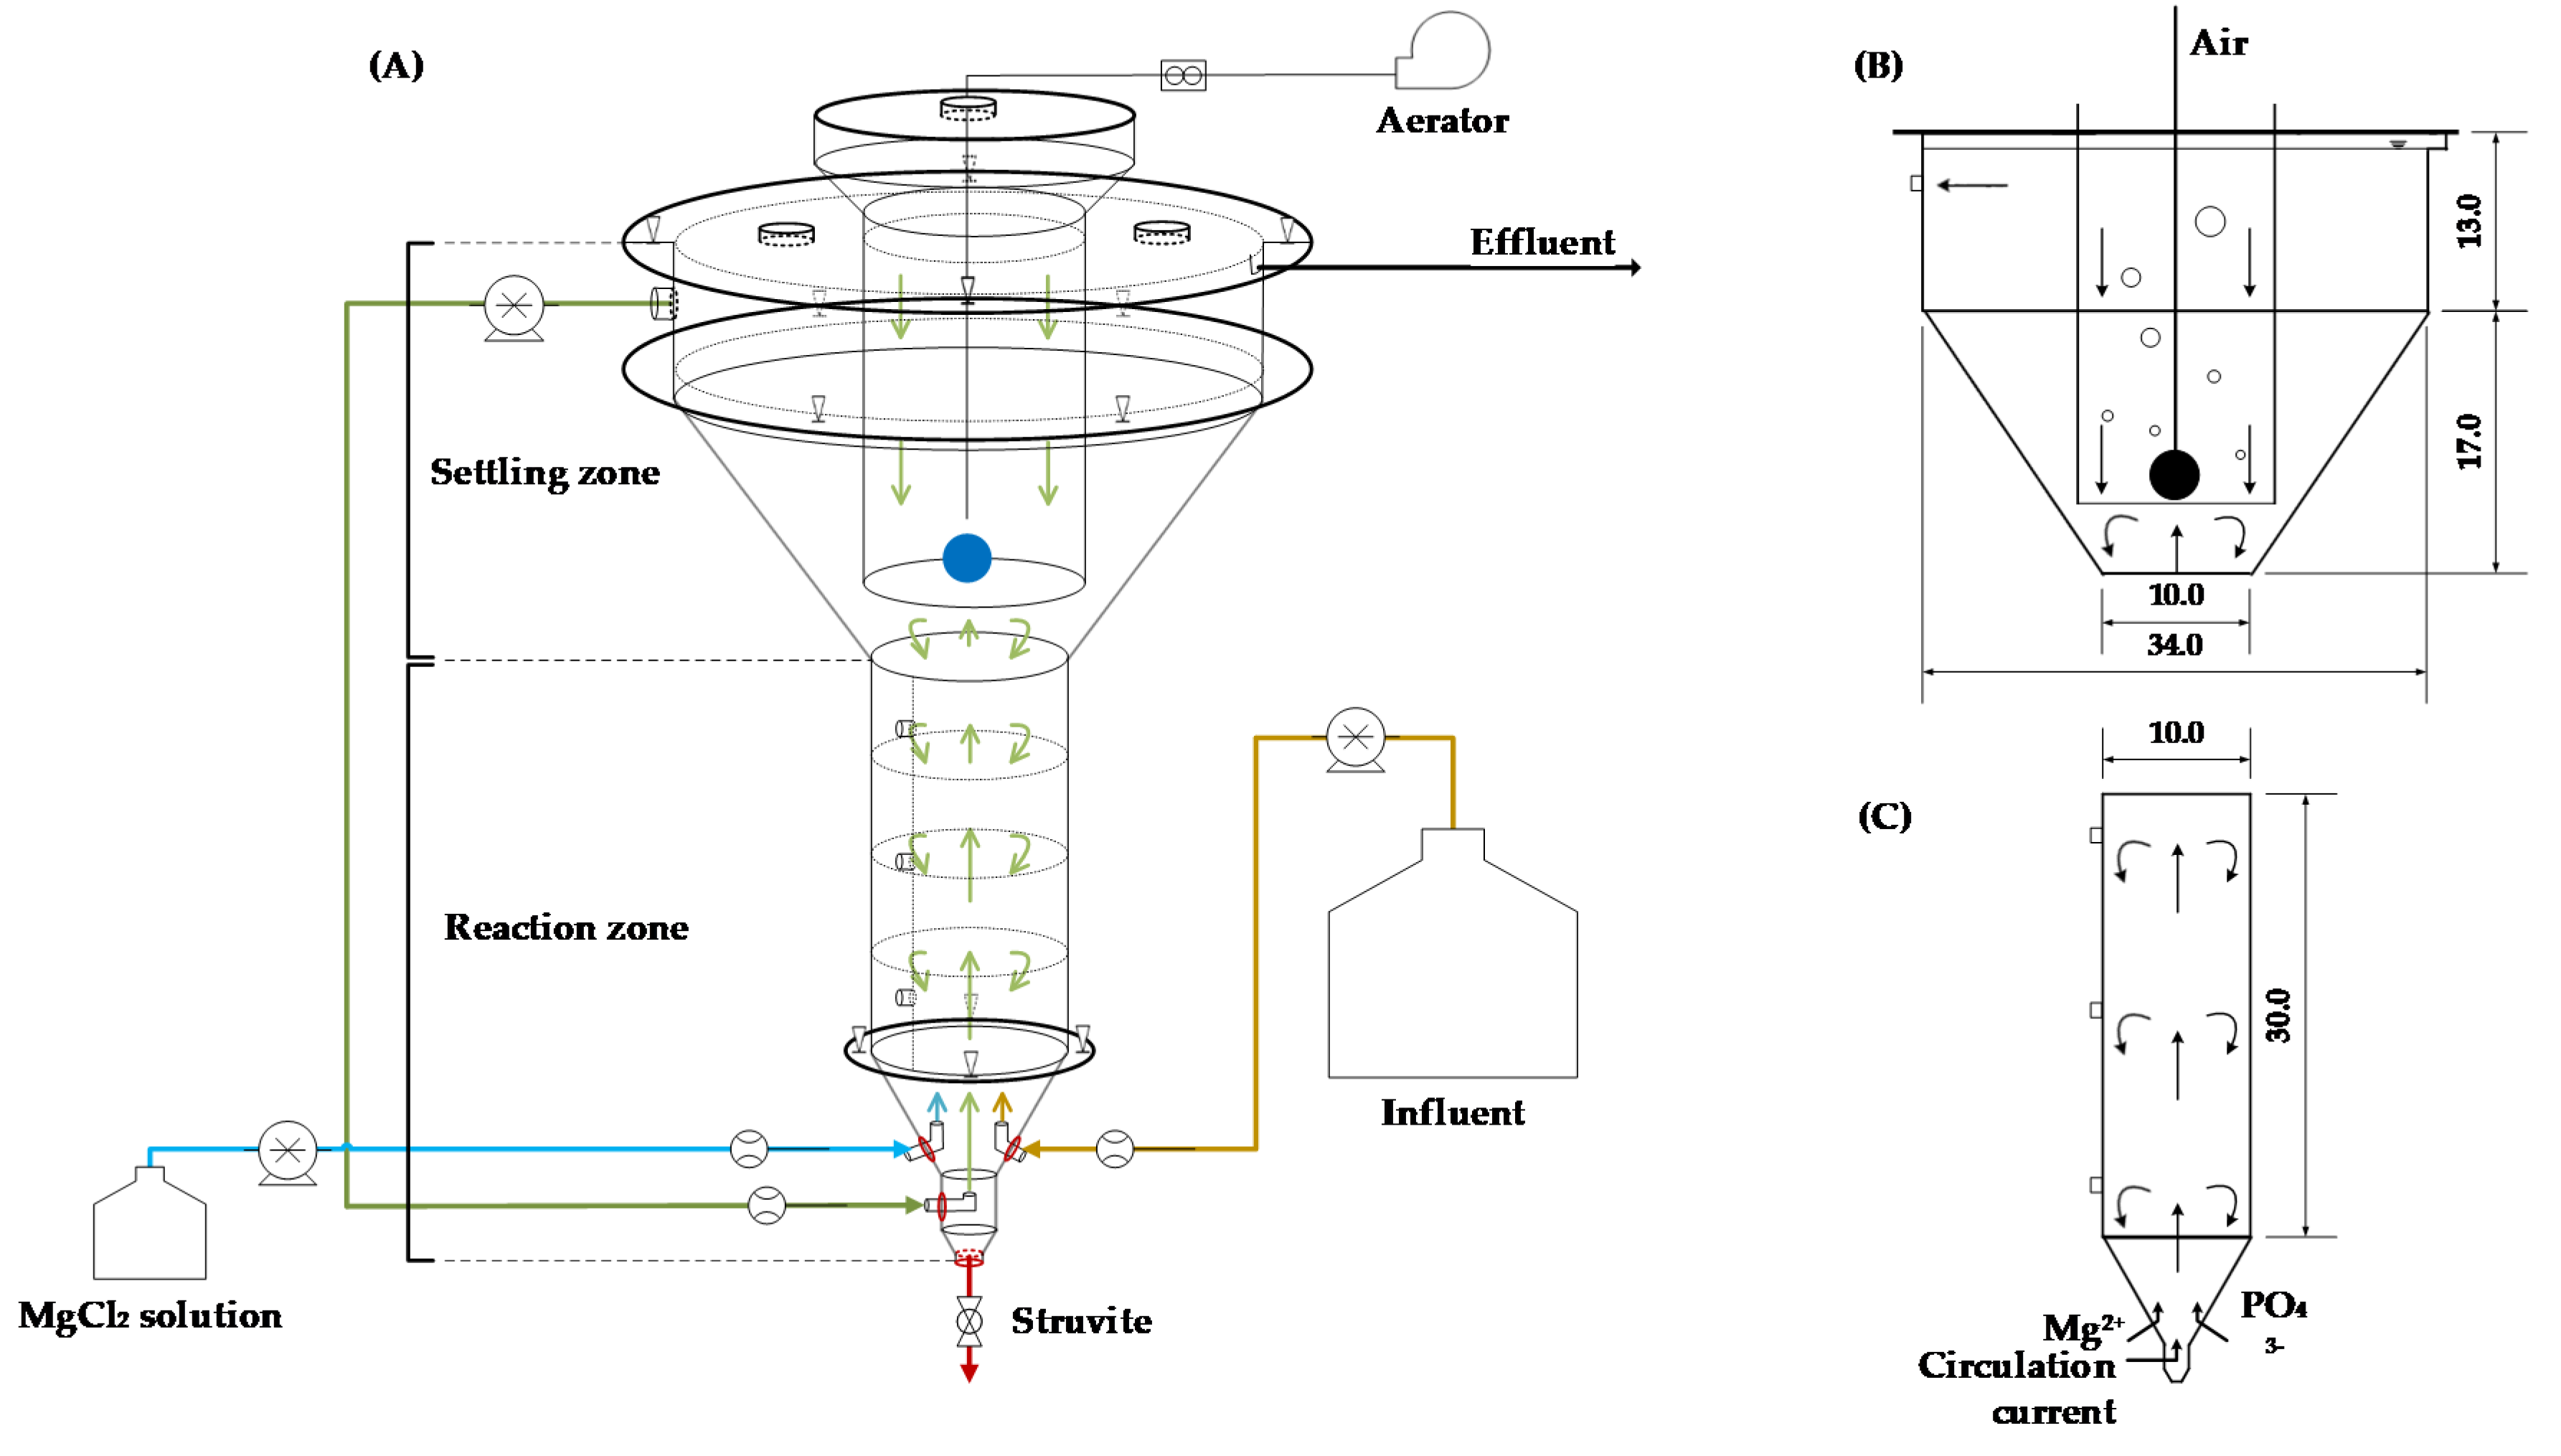
2.1. Development of the Recovery Process

The raw swine wastewater used in this study was collected from a pig farm (1500-head scale) located at Palmi-ri, Sindong-myeon, Chuncheon-si, South Korea. Sampling (400 L) was done 1–2 times a week using a pump from the top of the storage tank. The characteristics of the swine wastewater are given in Table 1. The concentration of O-P ranged only 93.9–116.4 mg/L, but NH4-N concentration as N source was very high enough for struvite formation.
The recovery process was performed in a lab-scale reactor made of acrylic fiber with total effective volume of 20 L. The reactor was divided into the reaction zone and settling zone (Figure 1A). Circulation was done from the bottom of the entire reactor and performed with a nozzle to mix the non-reacted raw wastewater from settling zone to reaction zone (top to bottom); these characteristics made fine crystal stay in the reaction zone. The diameter of the nozzle was 2 mm. Raw swine wastewater and Mg sources were supplied at the bottom of the reactor. The input amount of the Mg source was adjusted depending upon the O-P concentration. The inlet pipes of raw swine wastewater and Mg source were placed at the upper side of the circulation inlet for mixing.

2.1.1. Settling Zone

It is located just above the reaction zone of the recovery reactor. The top diameter and height of 34.0 and 13.0 cm, respectively, were designed from the prototypes of the reactor (Figure 1B). The bottom is in a conical shape that has a diameter from 34.0 to 10.0 cm with 17.0 cm height. The inner cylindrical zone was not set for the settling but the reaction of struvite formation. CO2 stripping was done by an air diffuser in the middle connected to a blower.

2.1.2. Reaction Zone

It is the cylindrical portion of the reactor (D: 10 cm, H: 30 cm) where the crystallization and growth of struvite take place (Figure 1C). When the amount of fluid is ejected from the nozzles in the center of the circular portion of the recovery tank, the Mg2+ and PO43− are mixed together to improve nucleation and increase particle size. Inside the reaction zone, the flow goes up to the top of the reaction zone, eventually weakening the flow. At this time, the larger struvite particles are settled down against the up-flow from the nozzle, which can be adjusted according to the speed of the circulating flow. To observe the changes in the internal aqueous phase, three sampling ports were placed at the bottom, middle, and upper portion of the reaction zone.
In this study, MgCl2·6H2O was used as a Mg source to induce the high recovery efficiency of soluble phosphate within a shorter reaction time. The Mg to P molar ratio was adjusted to 1.3 by Mg input.

2.2. Process Operation

The process was operated in a continuous-flow mode. Swine wastewater as an influent was periodically added to the influent tank, and NH4-N and O-P were measured before adding. During the operation period, raw swine wastewater was constantly fed according to the calculated hydraulic retention time (HRT). The desired pH of the raw swine wastewater was maintained by adding 1 M NaOH solution (97%, Daejung Chemicals & Metals Co. Ltd, Siheung-si, Korea) in the influent tank. Recirculation was controlled through a peristaltic pump (WT600-3J, Longer Pump, Baoding, China). Magnesium (Mg2+) was supplied as MgCl2·6H2O solution (98%, Daejung Chemicals & Metals Co. Ltd, Siheung-si, Korea) with a flow rate of 5 mL/min with a constant influx. For CO2-stripping, the aeration rate was set at 0.03 L air/Lreactor·min, which resists pH drop occurring due to struvite formation. Liquid samples were taken from the central sampling port to confirm the mixing status in the reaction zone, while the precipitates against the up flow by nozzle were taken from the bottom of the reactor as products.

2.3. Optimization of the Process Parameters

2.3.1. Experimental Design

The CCD was adopted as an experimental design for optimization. The three operational factors of pH, circulation rate (CR), and HRT were selected from the preliminary trial runs under the conditions of pH 9.0, CR of 3.0 L/Lreactor·h, and HRT of 3–60 h (data are not shown here). The variables of pH, CR, and HRT as key operational factors were each divided into three levels.
From the preliminary test, pH 9.0 was maintained with CO2-stripping by aeration but pH over 10.0 requires large amount of alkali solution, which causes high cost when applied to the full scale. Thus, the pH range of the operation was set from 9.0 to 10.0. The CR governs the mixing condition, which is essential for the reaction. When the preliminary test was performed, CR of 3.0 L/Lreactor·h showed enough mixing circumstances in the reaction zone, but other levels of CR were verified. Although struvite can be formed within 30 min reaction time, at least 1 h reaction time is needed to evaluate the reactor performance.
The central points of independent variable were set at pH (x1) 9.5, CR (x2) 3.0 L/Lreactor·h, and HRT (x3) 3 h and divided into three levels: low (−1), medium (0), and high (1) (Table 2). The variables are coded (xi) in advance to compare the significance of their effects on response according to Equation (1):
xi = (Xi − X0)/ΔX,
where xi is the coded value; Xi is the actual value of the independent variable; X0 is the value of Xi at the center point; and ∆X is the step change value.

2.3.2. Central Composite Design (CCD)

The CCD is available to presume conclusively of squared terms in the quadratic function model. It is easy to realize orthogonal blocking and rotatability, which are desirable features of the experimental design. Total experimental runs can be calculated by the simple equation: where k is the number of the independent variables, (Cp) is the replicate number of the central points, the number of factors is 2k, and the number of the axial point is 2k, the experimental runs can be obtained as 2k + 2k + Cp. In this experiment, pH, CR, and HRT were chosen as the determining factors that should be optimized to achieve N and P recovery, particle size, and SPR as responses.
In total, 18 combinations (including four replicates of the center point) were chosen at random order according to the central composite configuration for the three factors with three levels. The mathematical relationship between the coded levels of the independent variables, x1 (pH), x2 (CR), and x3 (HRT) and the responses to these variables were approximated as a second-order polynomial equation as follows. A curve surface of experimental results was analyzed according to a second-order polynomial Equation (2):
y = b0 + b1x1 + b2x2 + b3x3 + b11x12 + b22x22 + b33x32 + b12x1x2 + b13x1x3 + b23x2x3,
where y is the predicted response; b0 is the offset term; b1, b2, and b3 are the linear coefficients; b11, b22, and b33 are the squared coefficients; and b12, b13, and b23 are the interaction coefficients.
The 18 runs including 4 replicates at the center point for single operations are tabulated in Table 3 and each run was operated for 12 HRTs of duration after the steady-state of O-P recovery.

2.4. Analytical Methods

The pre-treatment of the sample is essential to assess the precise efficiency in the recovery process. Therefore, collected samples were divided into the liquid and solid phases. After samples were discharged from the central sampling port, they were immediately filtered through glass fiber filter (grade GF/C glass microfiber filter, ø110 mm, pore size 1.2 µm, Whatman TM) to prevent dissolution. The pH of filtrate was adjusted at below 6.5 with 2 mL of 2 M HCl to prevent struvite crystallization further. Aqueous samples were then kept at 4 °C until analyzed.
Total solids (TS) was analyzed by drying samples at 105 °C for 24 h in an oven (LDO-150N, Labtech, Korea) and total volatile solids (TVS) was measured after completely pyrolyzing samples at 550 °C for 4 h or more in a muffle furnace (Thermolyne 30400, Barnstead International, Dubuque, IA, USA). NH4-N, O-P, total Kjeldahl nitrogen (TKN), and total phosphate (TP) were analyzed using automatic analyzer (Quik Chem 8000, Lachat, Milwaukee, WI, USA). For TKN and TP, the samples were digested with sulfuric acid (95%, Daejung Chemicals & Metals Co. Ltd, Siheung-si, Korea) for 4 h at 380 °C using block digester (BD-46, Lachat, Milwaukee, WI, USA) following the standard methods [23].
A particle size analyzer (Mastersizer 2000, Malvern Panalytical Ltd, Malvern, UK) was used for the particle size measurement. Prior to the analyses of particle size, saturated solution was prepared by mixing 1.31 g/L Na2HPO4·7H2O (Sigma-Aldrich, Darmstadt, Germany), 1.6 g/L MgCl2·6H2O (Sigma-Aldrich, Darmstadt, Germany), 0.86 mL/L of 28.0–30.0% NH4OH (Junsei Chemical Co. Ltd, Chuo, Japan) solution together with struvite in order to prevent the dissolution of struvite into the background solution. The solid phase was filtered by glass fiber filter (grade GF/C glass microfiber filter, ø 110 mm, pore size 1.2 µm, WhatmanTM) again to remove excess water and then it was dried at 20 °C for 48 h. For structural identification and confirmation of recovered material, scanning electron microscopy (SEM) (AX70, Olympus, Shinjuku, Japan) and X-ray diffractogram (XRD) (PANalytical X’Pert PRO MPD, Malvern Panalytical BV, Almelo, The Netherlands) were used.

2.5. Statistical Analysis

Empirical models using key variables were set with real data and their validity was checked by analysis of variance (ANOVA) test using JMP (JMP Statistical Discovery, v10.0, SAS Institute Inc, Cary, NC, USA, 2012).

3. Results and Discussion

3.1. Preliminary Performance Evaluation

A preliminary test of the reactor was operated under the conditions of pH 9.0, CR 3.0 L/Lreactor·h, and HRT 3h for the recovery efficiency of O-P, as shown in Table 4. The recovery process showed O-P removal efficiency of 92.4% in the reaction zone and 93.0% in the settling zone with an overall O-P removal efficiency of 93.1%. The formation of struvite was almost completed in the reaction zone, and, therefore, the O-P concentration in the recovery reactor was found to be low during the recovery process. Equation (3) shows the mass balance for the state of PO43− in the recovery process:
[PO43−]total = [PO43−]struvite + [PO43−]residual,
Moreover, the higher T-P concentration in the reaction zone implies that the struvite fines mainly formed and then remained in that zone. The upward flow velocity of internal materials from the reaction zone to the settling zone slows down as the diameter increases substantially and ultimately results in low T-P concentration in the settling zone. The air diffuser positioned in the inner cylinder generates air bubbles and allows the internal fluid to flow down. The downward flow of fluids prevents the fine particles from floating on the reaction zone as well as induces struvite crystal formation and increases the particle size.
The NH4-N removal efficiency of 16% was obtained. The removal mechanism is presumably conducted with two paths; i.e., stripping by aeration with alkali condition of the solution and forming struvite crystal. The mass balance of NH4-N removal can be expressed as Equation (4):
[NH4+]total = [NH3]stripping + [NH4+]struvite + [NH4+]residual,
O-P is totally recovered through struvite crystallization process while the NH4-N is accounted for 1% of the 16% NH4-N removal efficiency, as the other 15% was degassed by ammonia (NH3) stripping. The removal efficiency of the [NH4+] corresponding to the struvite crystallization was lower than the O-P removal efficiency because a very high concentration of NH4-N was present in the influent compared to O-P. Moreover, the aeration delivers advantages for the reactor operation such as NH4-N removal with stripping, mixing effect, and pH maintenance with CO2 stripping without the addition of the reagent.
The solids were removed slightly when passed through the recovery process. Total solids and volatile solids were removed as 4.0 ± 9.9% and 4.3 ± 10.3%, respectively, by settling. Thus, few fine particles were lost during the struvite recovery process. During pre-operation, a CR of 4.5 L/Lreactor.h was found to be appropriate.
During preliminary study, the struvite crystallization reactor was continuously operated for 60 h (20 HRTs) considering the central point of each operating condition and samples were collected every 3 h from the reaction zone, setting zone, and effluent. However, due to continuous operation, the amount of struvite particles in the reaction zone increased gradually with the increase in operation time. As the main purpose of the preliminary study was to check the removal efficiency of parameters and growth of struvite particles, we did not remove the particles from the reactor. Hence, there is a high probability that some of the struvite particles may enter into effluent line due to the bulk production of struvite particles in the reaction zone and might have been lost with the effluent. Moreover, floating particles in the settling zone can also be lost with the effluent. Therefore, the removal efficiency of TS, TSS, TVSS, TKN, and TKP in the later operating periods showed much difference and indicated negative value compared to the early operating periods. Consequently, the average removal efficiencies of TS, TSS, TVS, TVSS, and TKN showed high standard deviation.

3.2. Performance Evaluation of the Recovery Process

The performance of the recovery process was evaluated by SPR of 6.4 ± 0.2 kg struvite/m3reactor·d. The theoretical struvite yield of 7.87 g struvite/g O-Pinput was calculated but the experimental result showed 9.8 ± 0.5 g struvite/g O-Pinput, which was higher than the theoretical value since the other precipitates including nuclei of struvite might have settled and recovered. In addition, a part of solids contained in the influent might have precipitated with struvite crystals during the precipitation process.
Growth of the particle size was chosen as one of the reaction parameters of the process because the bigger size can increase its settling ability, which facilitates recovering struvite from the process and its utilization as a fertilizer on arable land. The particle size of the struvite during the preliminary experiments was gradually increased up to 33 h of process operation and stopped growing (Figure 2). Therefore, 12 times of 1, 3, and 6 h HRTs (i.e., continuous operation of the reactor for 12, 36, and 60 h, respectively) in each run was selected to evaluate the responses according to the operating conditions in struvite reactor.
The experimental runs were carried out by CCD schedule. A comparison of the results is presented in Table 5. Another comparison of settling and reaction zones in the struvite reactor shows that there is little difference in the O-P recovery efficiency (data are not shown here), which indicates that homogenous circulation of the liquid inside the reactor during the process operation. The particle size collected from the reactor showed an average size of 43.2 µm after 12 HRTs. The maximum particle size of 74.3 µm on average was obtained in Run 4, while the operational condition of Run 2 showed the smallest size of 12 µm. The operational condition strongly affected particle size, which may govern the handling and market values when applied as a fertilizer. Moreover, wide variation in standard deviation of the particle size indicates the sensitivity of the process and thus help in optimizing the process parameters.

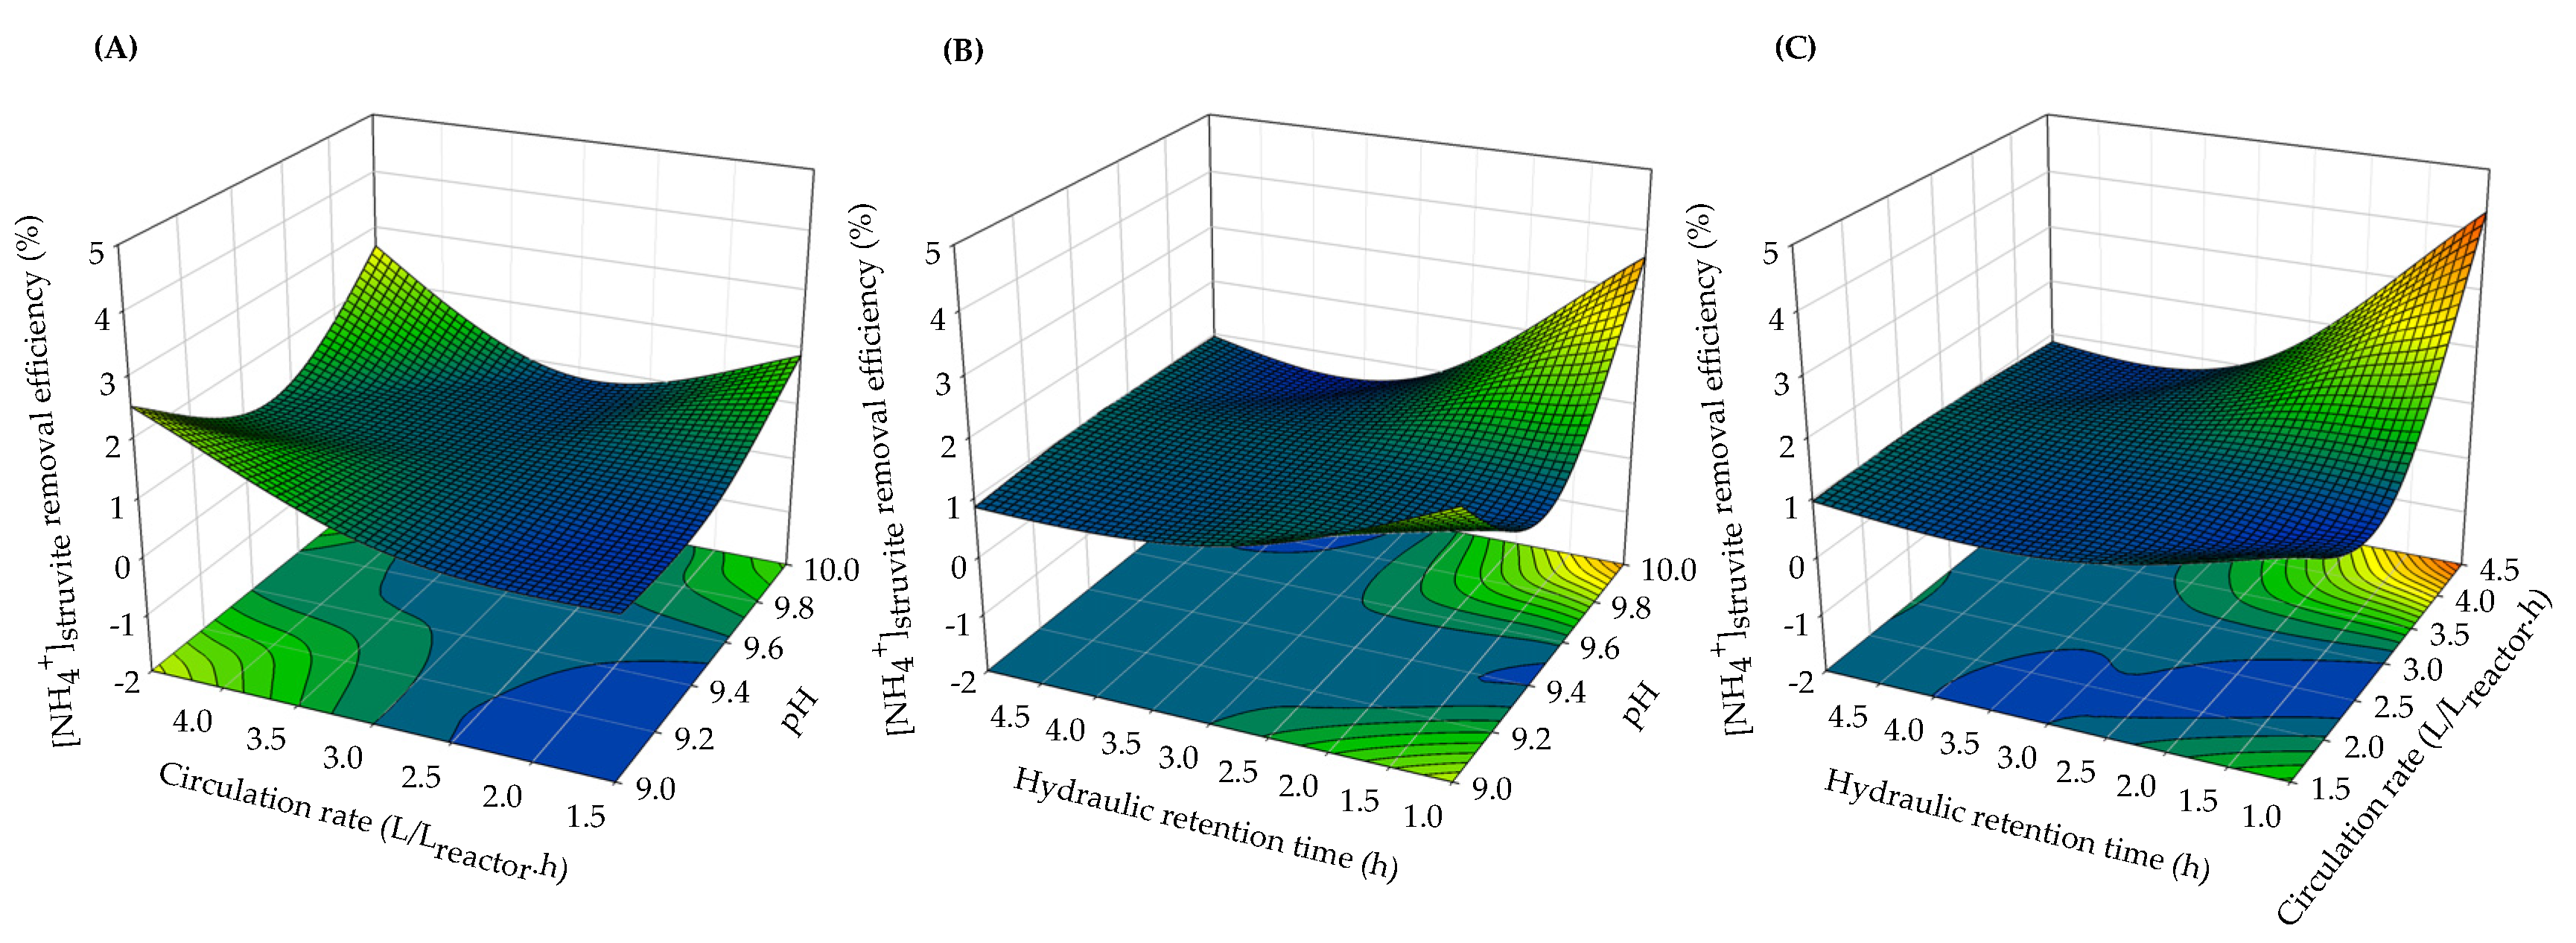
3.3. Effect of Process Parameters on Nutrient Recovery

All runs showed an average O-P recovery efficiency of 91.0 ± 4.3%, while NH4-N removal efficiency was only 12.6 ± 5.0% with relatively low deviation through the entire runs (Table 5). Such a high O-P removal efficiency may be caused by high pH (9–10) of the operation, as pH strongly influences the Mg2+ and PO43− concentrations and struvite solubility. This finding is in line with earlier studies [24], which observed that struvite was actively formed at pH 9–10. Previous studies also showed that, within the pH range of 8–11 and at a Mg to O-P ratio of over 1.0, the O-P removal from swine wastewater reached around 90% regardless of other operational parameters such as CR and HRT [1,25,26,27,28], while a pH below 7.5 resulted in a much lower O-P recovery efficiency [11]. Therefore, the response analysis for O-P recovery was not expected to have meaningful results, and its relationship could not be built with the operational parameters.
The Mg source used in this study was adjusted to meet the Mg/P molar ratio of 1.3, regardless of the increase or decrease of other factors. Moreover, Li et al. reported that the Mg/P molar ratio between 1 and 2 increased the supersaturation of Mg2+ and PO43− and, consequently, improved the nutrient recovery efficiency [11]. The maximum O-P removal efficiency of 97.1% was achieved in Run 14, whereas the relationships of the operational conditions with the response were not found as expected.
NH4-N removal occurred in two ways, i.e., NH3 stripping under relatively high pH over 9.0 and struvite formation. As tabulated in Table 4, the influent contained a much higher amount of NH4-N (6131.5 mg/L) than other elements (Mg and P) for struvite formation, and most NH4-N can be removed by NH3 stripping with aeration equipped in the struvite crystallization reactor. The air diffuser was primarily installed for pH maintenance through CO2-air stripping, but it also controlled NH3 stripping simultaneously. As a result of mass balance analysis, average NH4-N removal of 12.6 ± 5.0% was achieved by NH3 stripping of 11.2 ± 4.6%, and just 1.4 ± 1.1% was recovered as struvite (Table 5). The response of NH4-N removal via the changes in operational conditions was not found since the efficiency of NH3 stripping is closely related to pH variation.
On the basis of the generated experimental data analysis, it was observed that most of the NH4-N was removed by NH3 stripping, and this process was dependent on the pH. The interaction of CO32+ ions caused by aeration increased the solution pH, converted stable NH4+ ions in the solution to NH3 and finally released NH3 to the air. Therefore, the NH4-N removal efficiency was expected to have a lot of effect on the pH. Regarding NH4-N recovery by struvite formation, the following second-order polynomial equation was derived:
NH4-Nstruvite recovery (%) = 0.68 + 0.23x1 + 0.54*x2 − 0.81*x3 − 0.24x1x2 − 0.26x1x3 − 0.69*x2x3 + 0.39x12 + 0.44x22 + 0.39x32, (R2 = 0.84, p < 0.05 (0.0200))
* Asterisk indicates the coefficients significantly influenced on particle sizes.
For struvite formation, NH4-N recovery was significantly contributed by CR (x2) and HRT (x3) as well as interaction of CR (x2) × HRT(x3). As shown in Figure 3, pH 9.0 and 10.0 except pH 9.5 with higher CR of 4.5 L/Lreactor·h indicated better performance for NH4-N recovery. When compared with HRT, short HRT and high pH 10.0 showed that a high amount of NH4-N was reacted for struvite formation. Since pH range was already in alkaline condition, the mixing status and the supply of reactant were closely related to NH4-N recovery. Consequently, the operational conditions of pH 10, CR of 4.5 L/Lreactor·h, and HRT of 1 h were selected to obtain high performance of N recovery via struvite formation.

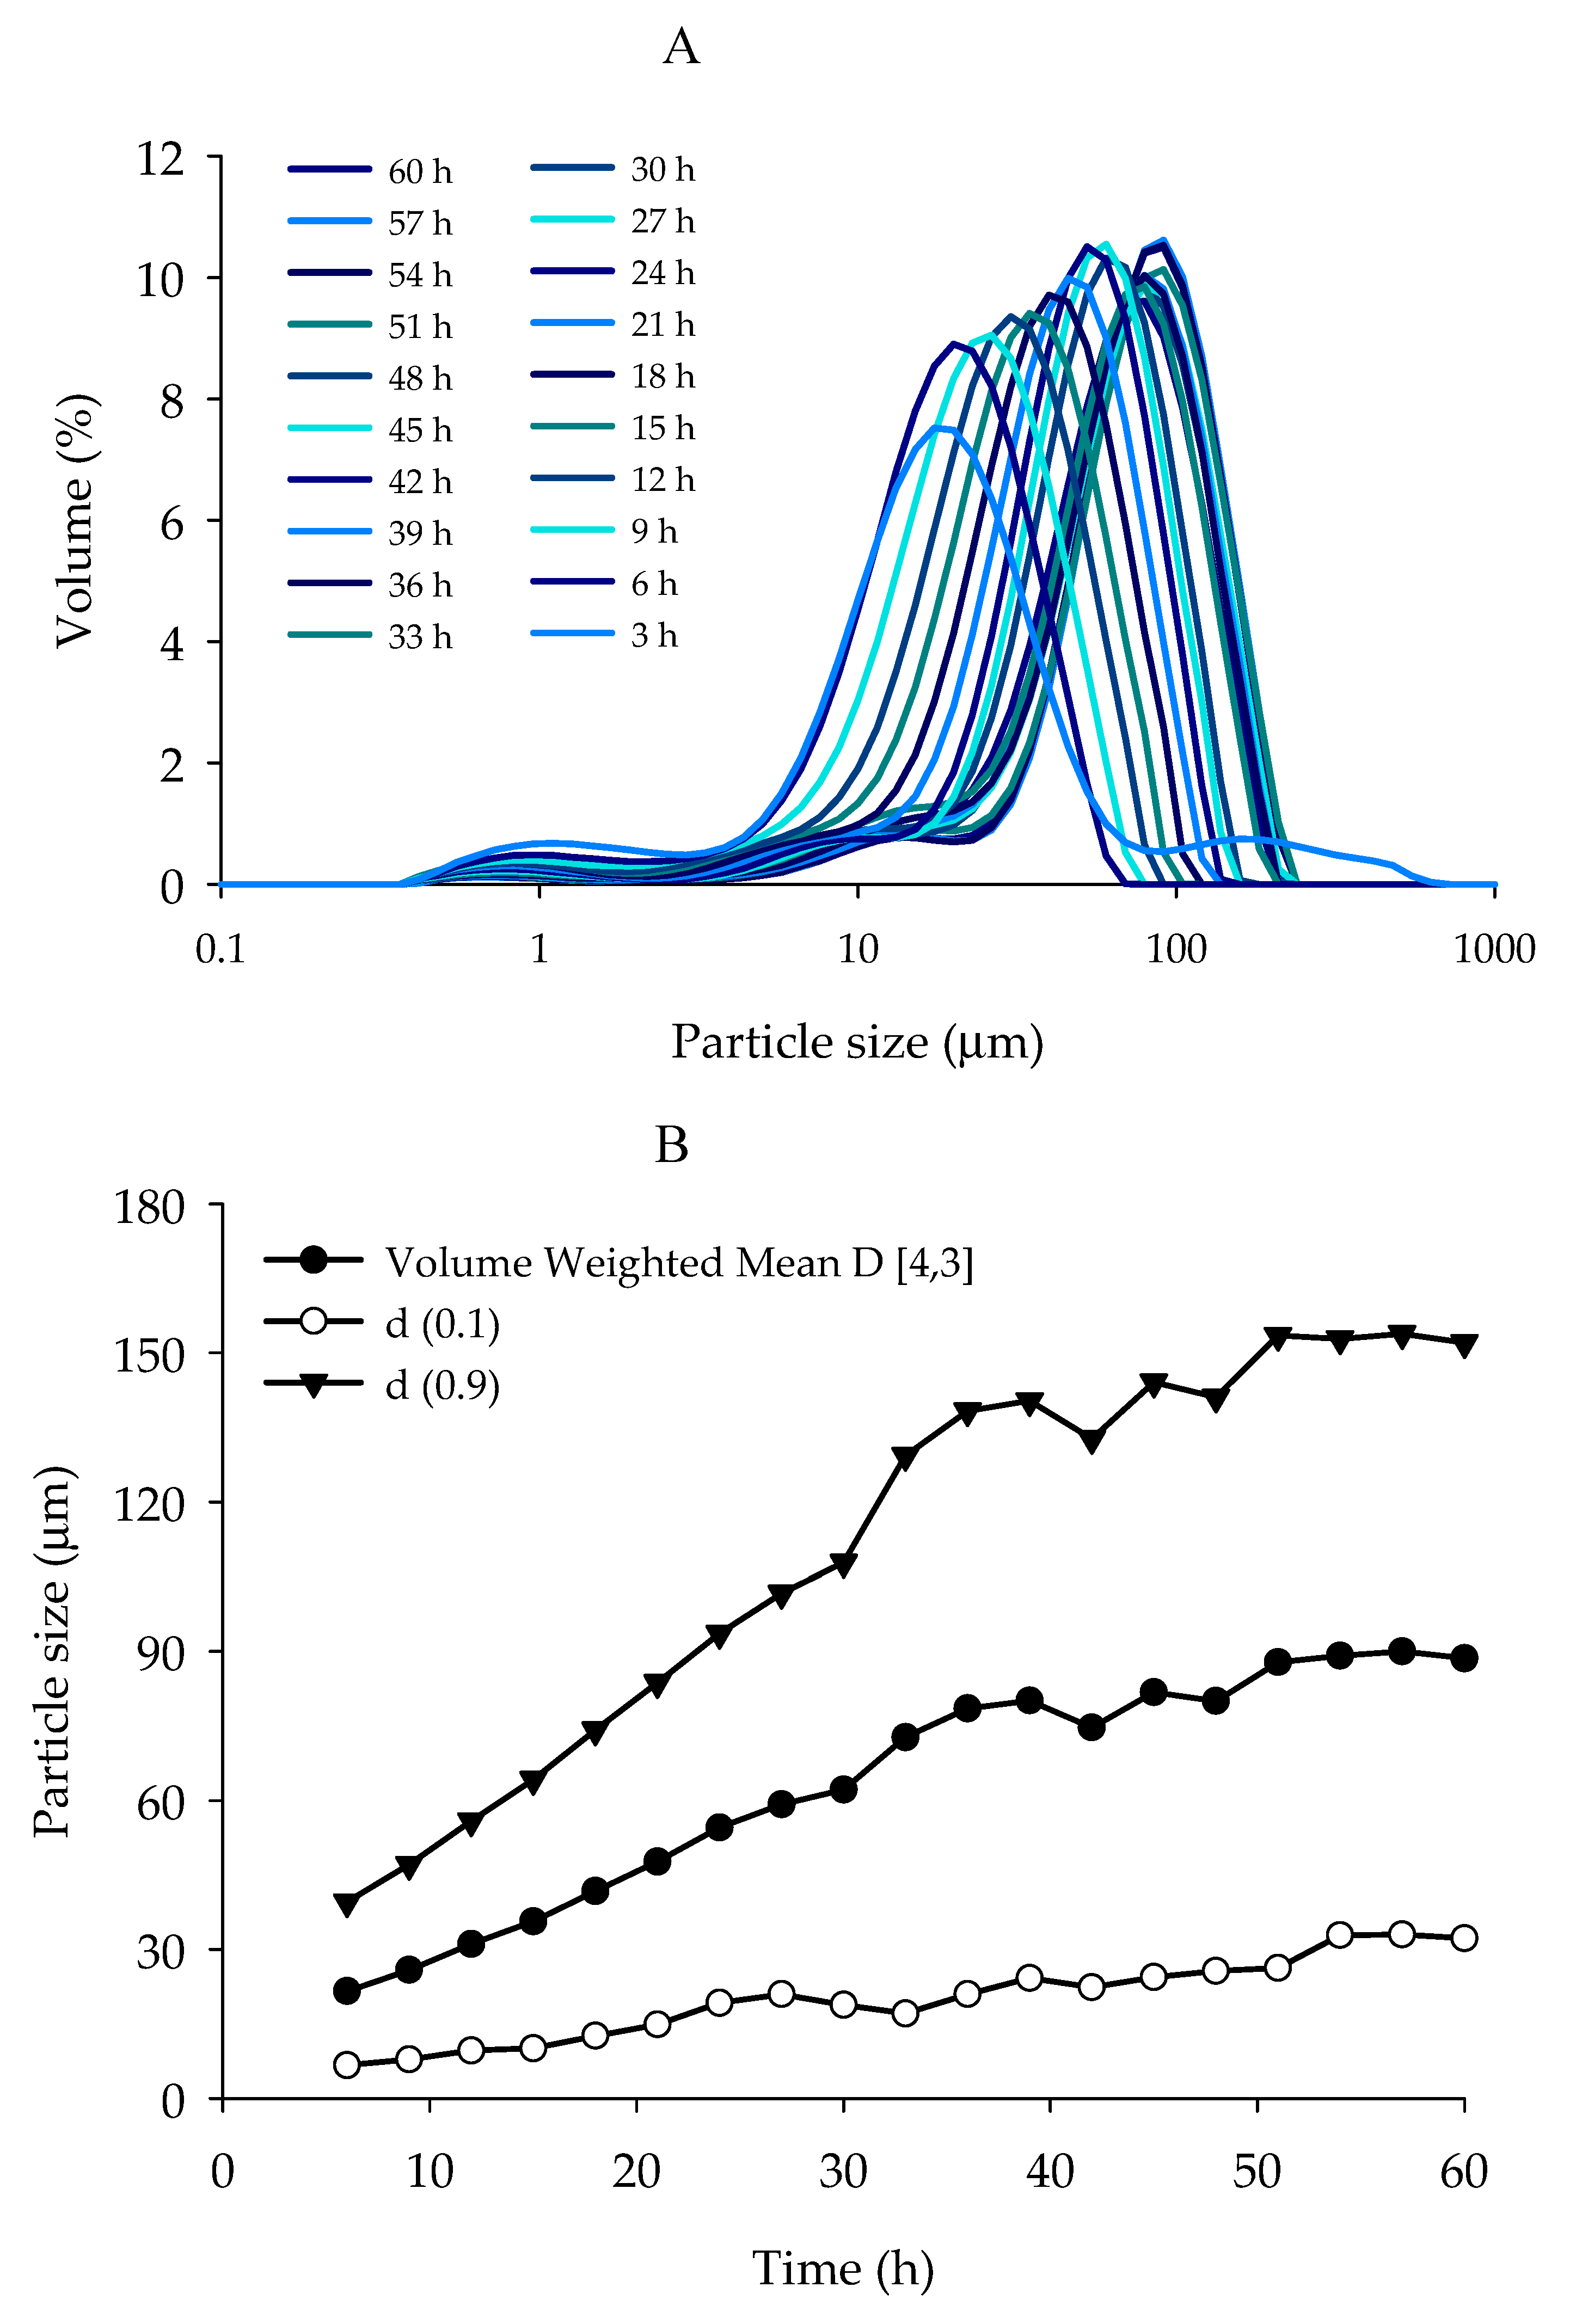
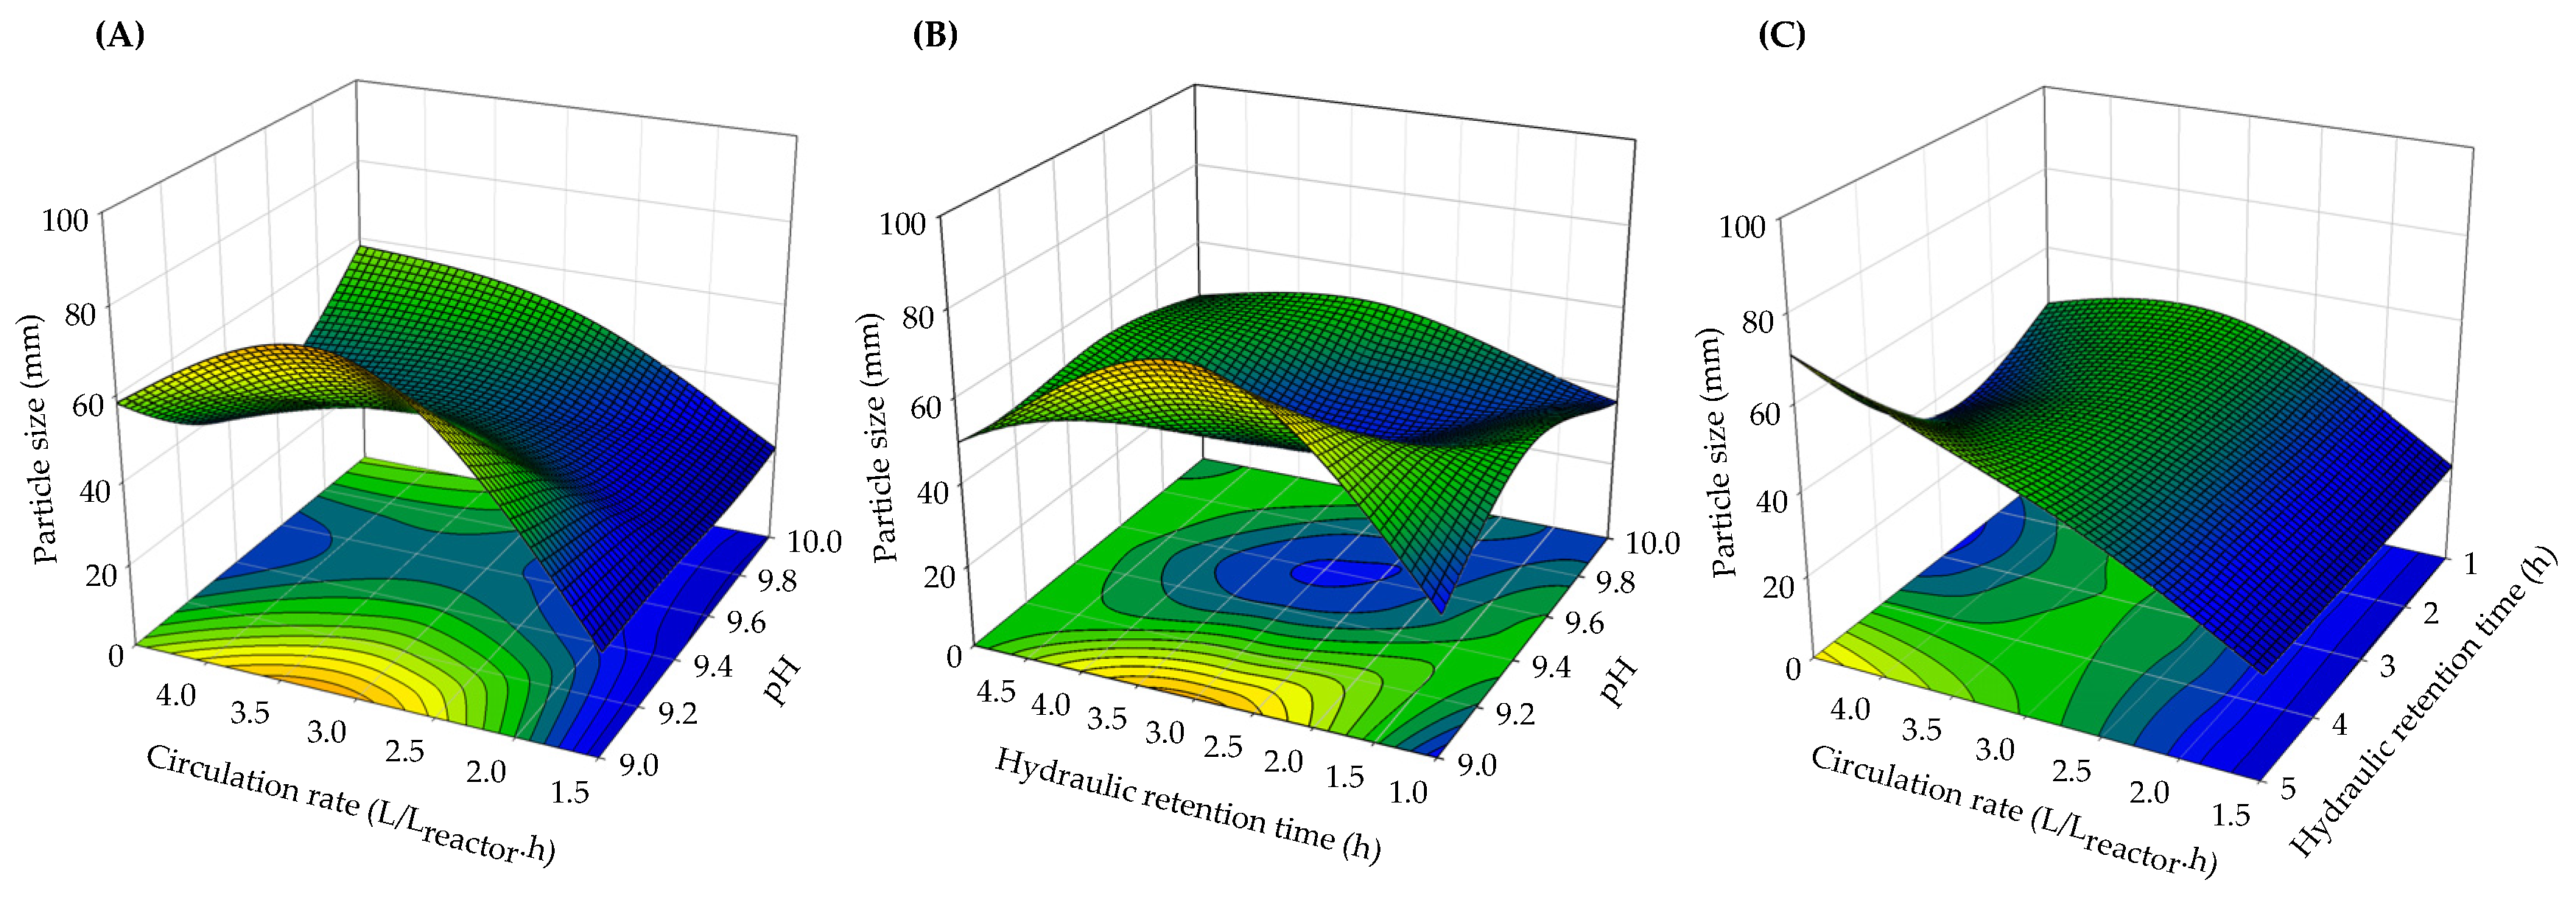
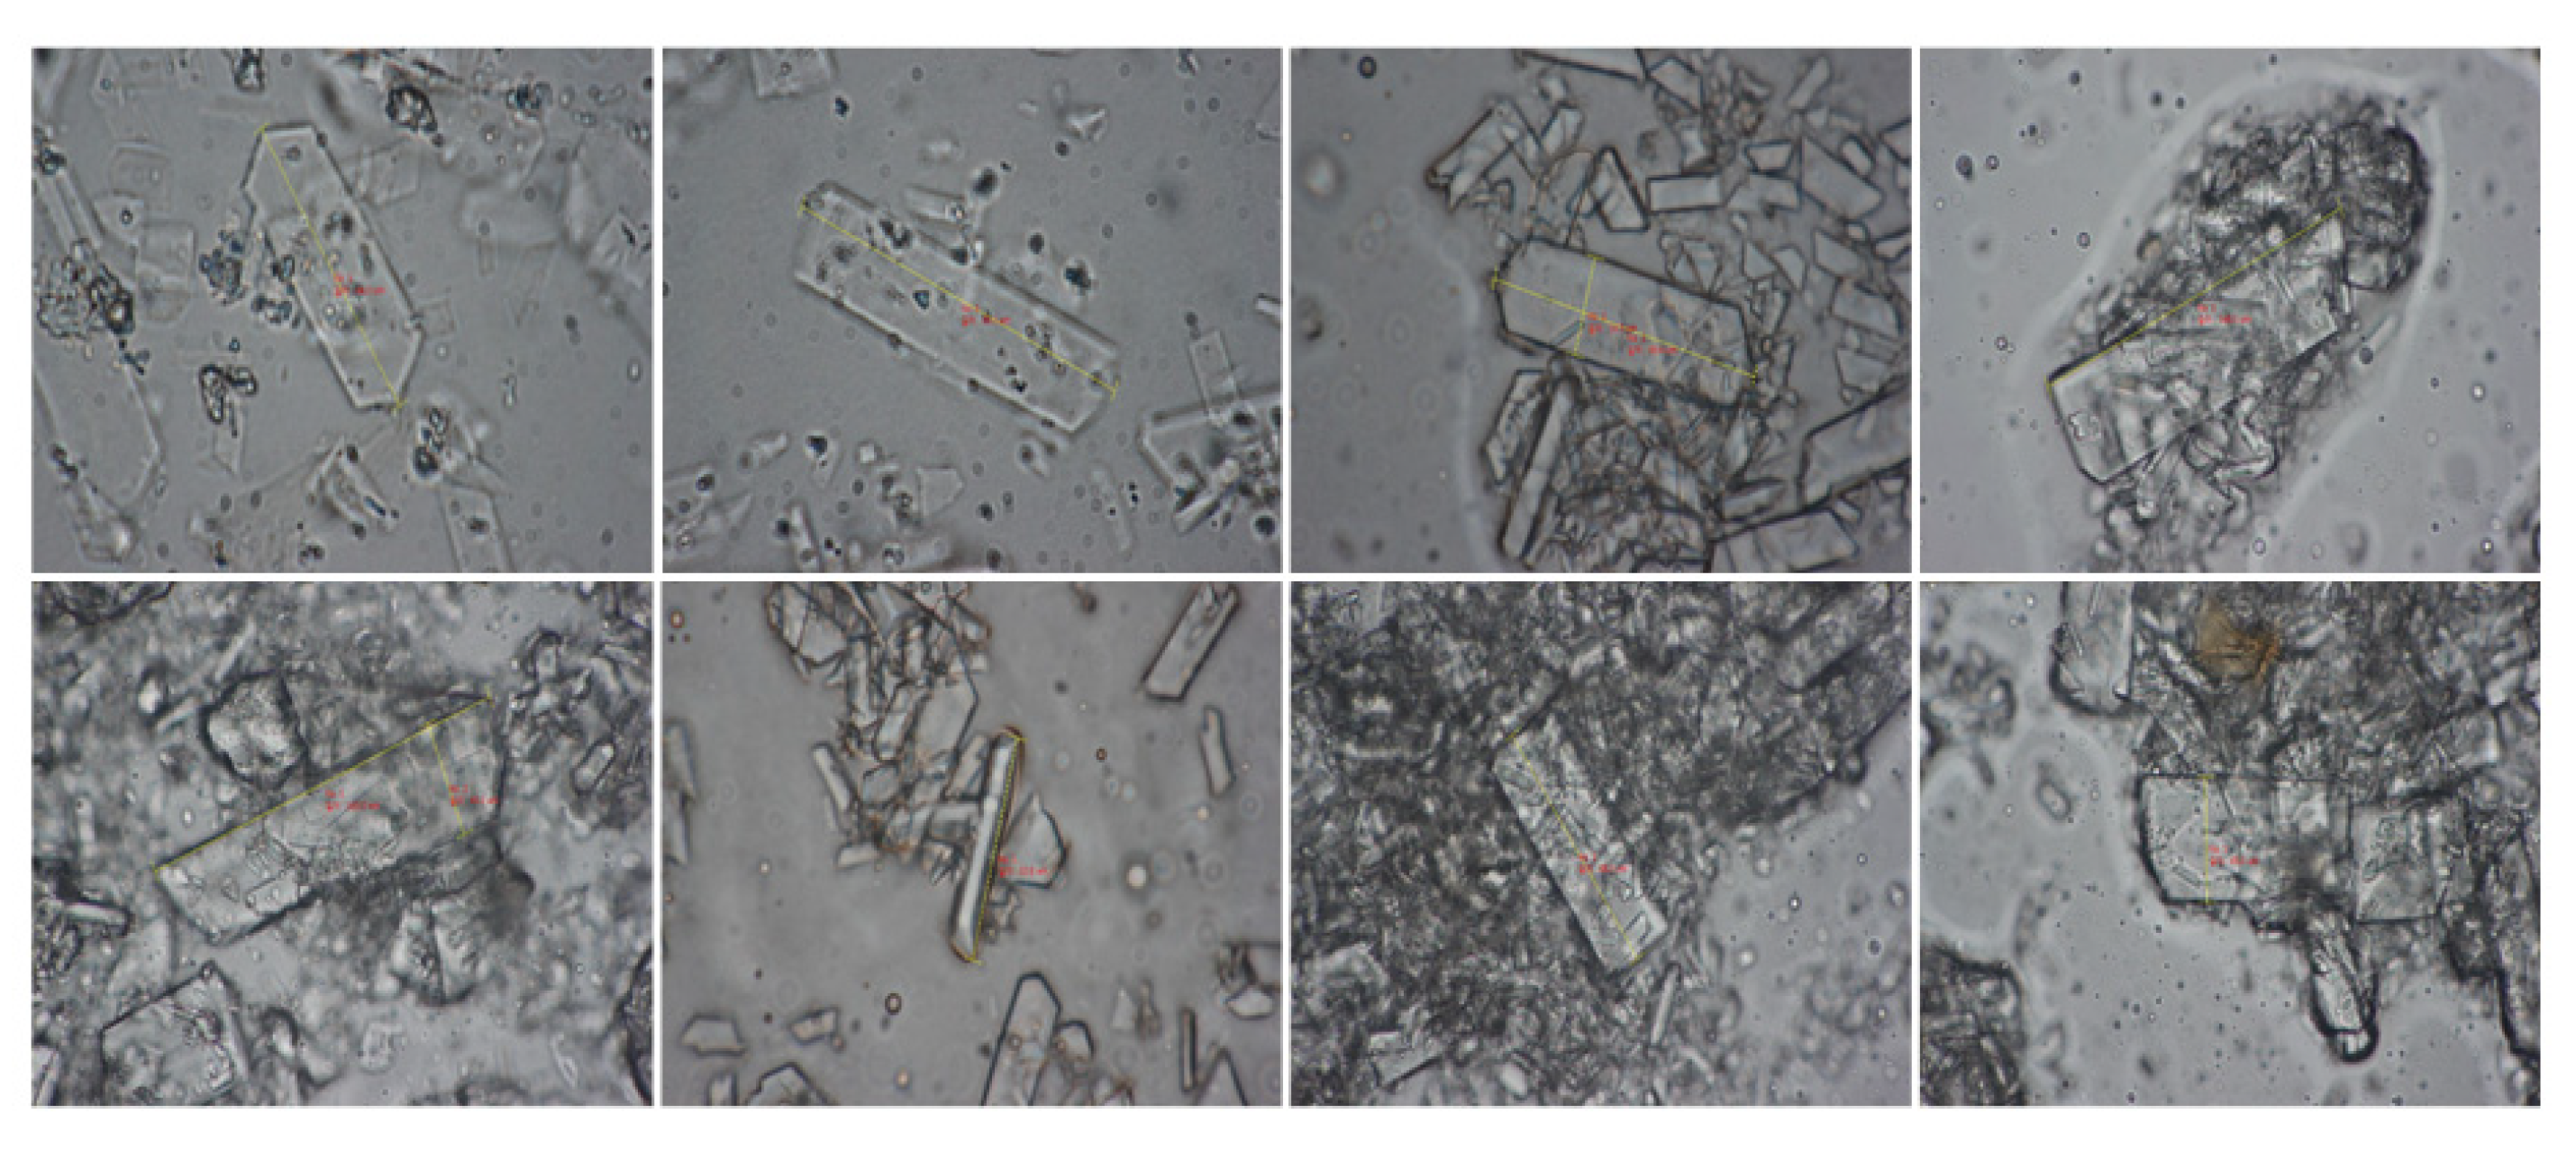
3.4. Effect of Process Parameters on Struvite Particle Size

For the recovery process, a second-order polynomial equation (Equation (6)) was derived for the particle size analysis. The control of particle size may be critical since it determines the methods to recover the struvite precipitated from the supernatant and the application of struvite on-site as a fertilizer. The bigger size induces better settling ability and easier handling.
Particle size (µm) = 43.13 + 0.53x1 + 10.72*x2 + 1.42x3 − 3.69x1x2 − 5.76x1x3 + 9.29*x2x3 + 13.84*x12 − 13.41*x22 + 1.49x32, (R2 = 0.83, p < 0.05 (0.0263))
*Asterisk indicates the coefficients significantly influenced on particle sizes.
The distribution of particle size was followed by the above equation. The p-value of 0.0263 was shown by ANOVA analysis, contained within a confidence level of 95% (Figure 4). The regression coefficient (R2= 0.83) showed the relationship between an empirical value and the model expression indicated the statistical significance between the particle size and the variables (pH, CR, and HRT).
According to Equation (6), CR (x2), CR(x2) × HRT(x3), pH (x12), and CR (x22) closely influenced the growth of the particle size and the control of particle size can be performed without deterioration of recovery efficiency of 91% on average in all runs. As a result of analysis, the particle size changes were influenced mainly by CR changes, which caused a physical phenomenon intensifying collision of particles. Slow vortex is known to lead to more nucleation than the crystal growth under high supersaturating condition; cracking of the crystal by the strong stirring rate in the recovery tank is also possible. Equipment with no impeller for stirring in the fluidized bed will not cause any crystal cracking [24]. On the other hand, with the importance of mixing circumstance by CR changes, the appropriate supply of reactant and HRT control were also significantly related, as seen in the term of CR(x2) × HRT(x3).
As shown in Figure 4A–C, the bigger sized particles were found at the conditions of pH 9.0 and 10.0 rather than pH 9.5 with CR of over 2.4 L/Lreactor·h. Studies reported that an increase in pH from 9 to 11 during the crystallization process could reduce the particle size due to formation of small nuclei [29,30]. In addition, the HRT of around 3 h resulted in the bigger particle size under the conditions of pH 9.0 and 10.0, which improve the granularity of struvite nuclei. However, the analysis showed no significant effect of HRT on particle size though the biggest particle size was obtained at a longer HRT of 5 h. In Figure 4C, it is observed that the combination of longer HRT and higher CR may help to increment particle size. However, the short HRT is preferred because it is closely related to the economic efficiency of the process operation, typically at an industrial scale. Therefore, the optimal operational conditions for particle size were selected as pH 9.0, CR of 4.32 L/Lreactor·h, and HRT of 5 h.

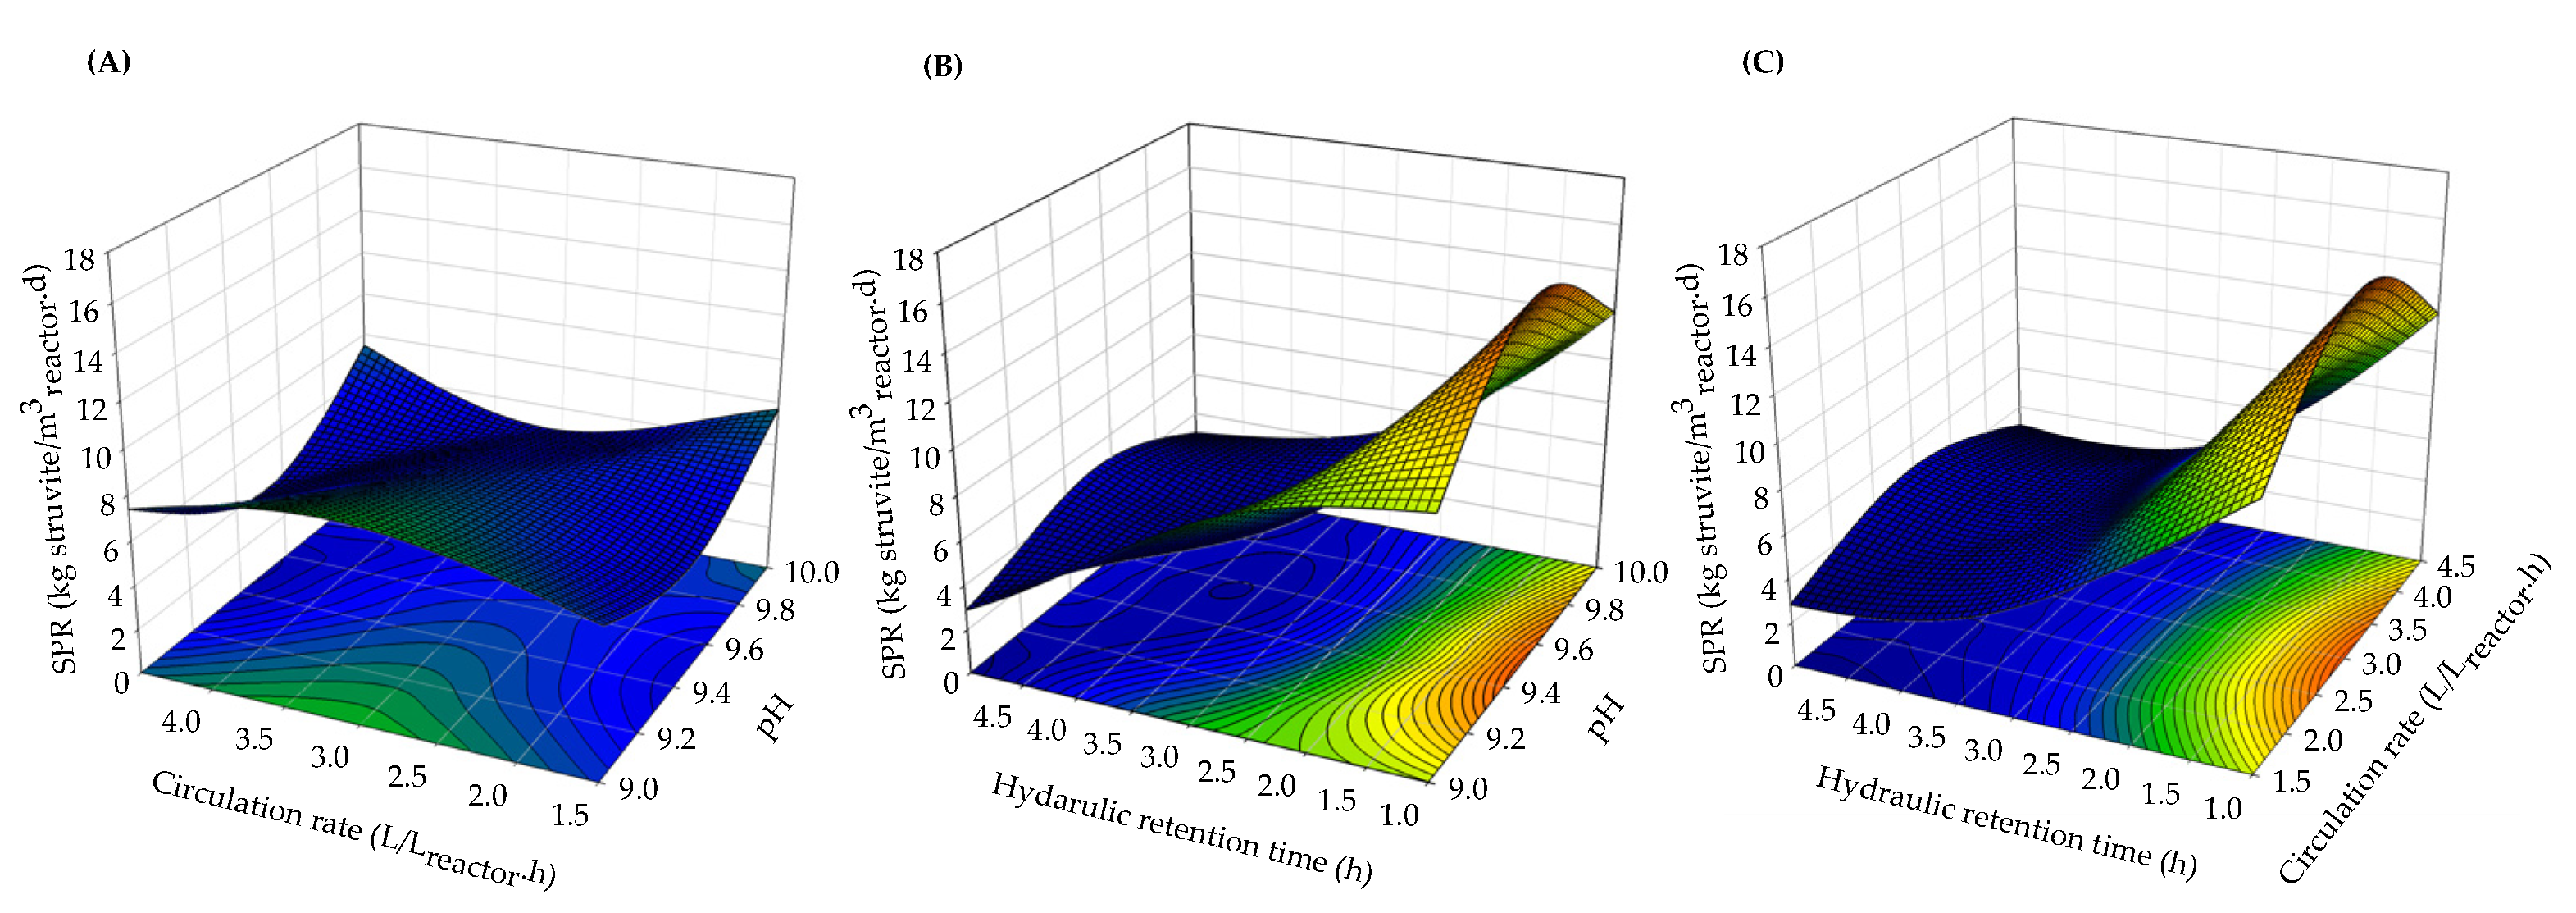
3.5. Effect of Process Parameters on Struvite Production Rate

Struvite production rate is another important parameter to determine the reactor performance. Different from the production yield, the production rate involves factors such as HRT and the amount of struvite recovered, which are related to the influent flow rate. The following second-order polynomial equation was derived for SPR:
SPR (kg struvite/m3reactor·d) = 5.75 − 0.17x1 − 0.01x2 − 4.62*x3 − 0.24x1x2 − 0.21x1x3 − 0.01x2x3 + 0.15x12 − 2.25*x22 + 3.90*x32, (R2 = 0.93, p < 0.05 (0.0012))
* Asterisk indicates the coefficients significantly influenced on particle sizes.
The empirical data for struvite productivity were significantly fit to the second-order polynomial equation and HRT (x3), CR2 (x22), and HRT2 (x32) highly contributed to change SPR. The average SPR of 6.74 kg struvite/m3reactor·d was obtained from the 18 runs and the calculated maximum value of 14.4 kg struvite/m3reactor·d can be predicted under the condition of pH 9.0, CR of 2.94 L/Lreactor·h, and HRT of 1 h. According to the 3D response surface plots created using Equation (7) (Figure 5), HRT played a significant role on the improvement of SPR and shorter HRT resulted in higher production rate, as it increases the daily treatment capacity of the reactor. In contrast to the HRT changes, the pH variation did not give substantial changes of SPR. The CR2 displayed the optimal condition of 2.94 L/Lreactor·h with the shortest HRT of 1 h. The highest SPR was calculated and reported as 14.46 kg struvite/m3reactor·d using Equation (7) under the condition of pH 10, CR of 2.94 L/Lreactor·h, and HRT of 1 h.

3.6. Optimized Process Parameters

Comparing the values of process parameters for each response, CR of over 2.94 L/Lreactor·h was found to satisfy all the responses of NH4-N recovery, particle size, and SPR. However, the pH and HRT showed opposite character for the responses such as pH 10.0 vs. 9.0 vs. 10.0 and HRT 1 vs. 5 vs. 1 h. When pH was adjusted to 9.0, Equations (5) and (7) showed no significant influence of pH on NH4-N recovery and SPR. The NH4-N recovery of 4.19% and SPR of 14.35 kg struvite/m3reactor· d were 95.5% and 88.6% of the calculated maximum value, respectively, and therefore the loss might be ignored. Since pH over 9.0 was already high enough for the struvite formation, pH 9.0 or 10.0 showed relatively better effects over pH 9.5. Moreover, all the responses were not significantly influenced by pH, and low pH had a benefit in decreasing the cost for the pH adjustment. However, the problematic issue may lie on HRT, which can be figured out with consideration of targets in the market; i.e., the priority of process operation is size increment of struvite or productivity as well as O-P removal. Considering the above, the optimal operational parameters of pH 9.0, CR > 2.94 L/Lreactor·h, and HRT of 1 or 5 h were selected to obtain better responses through RSM analyses.

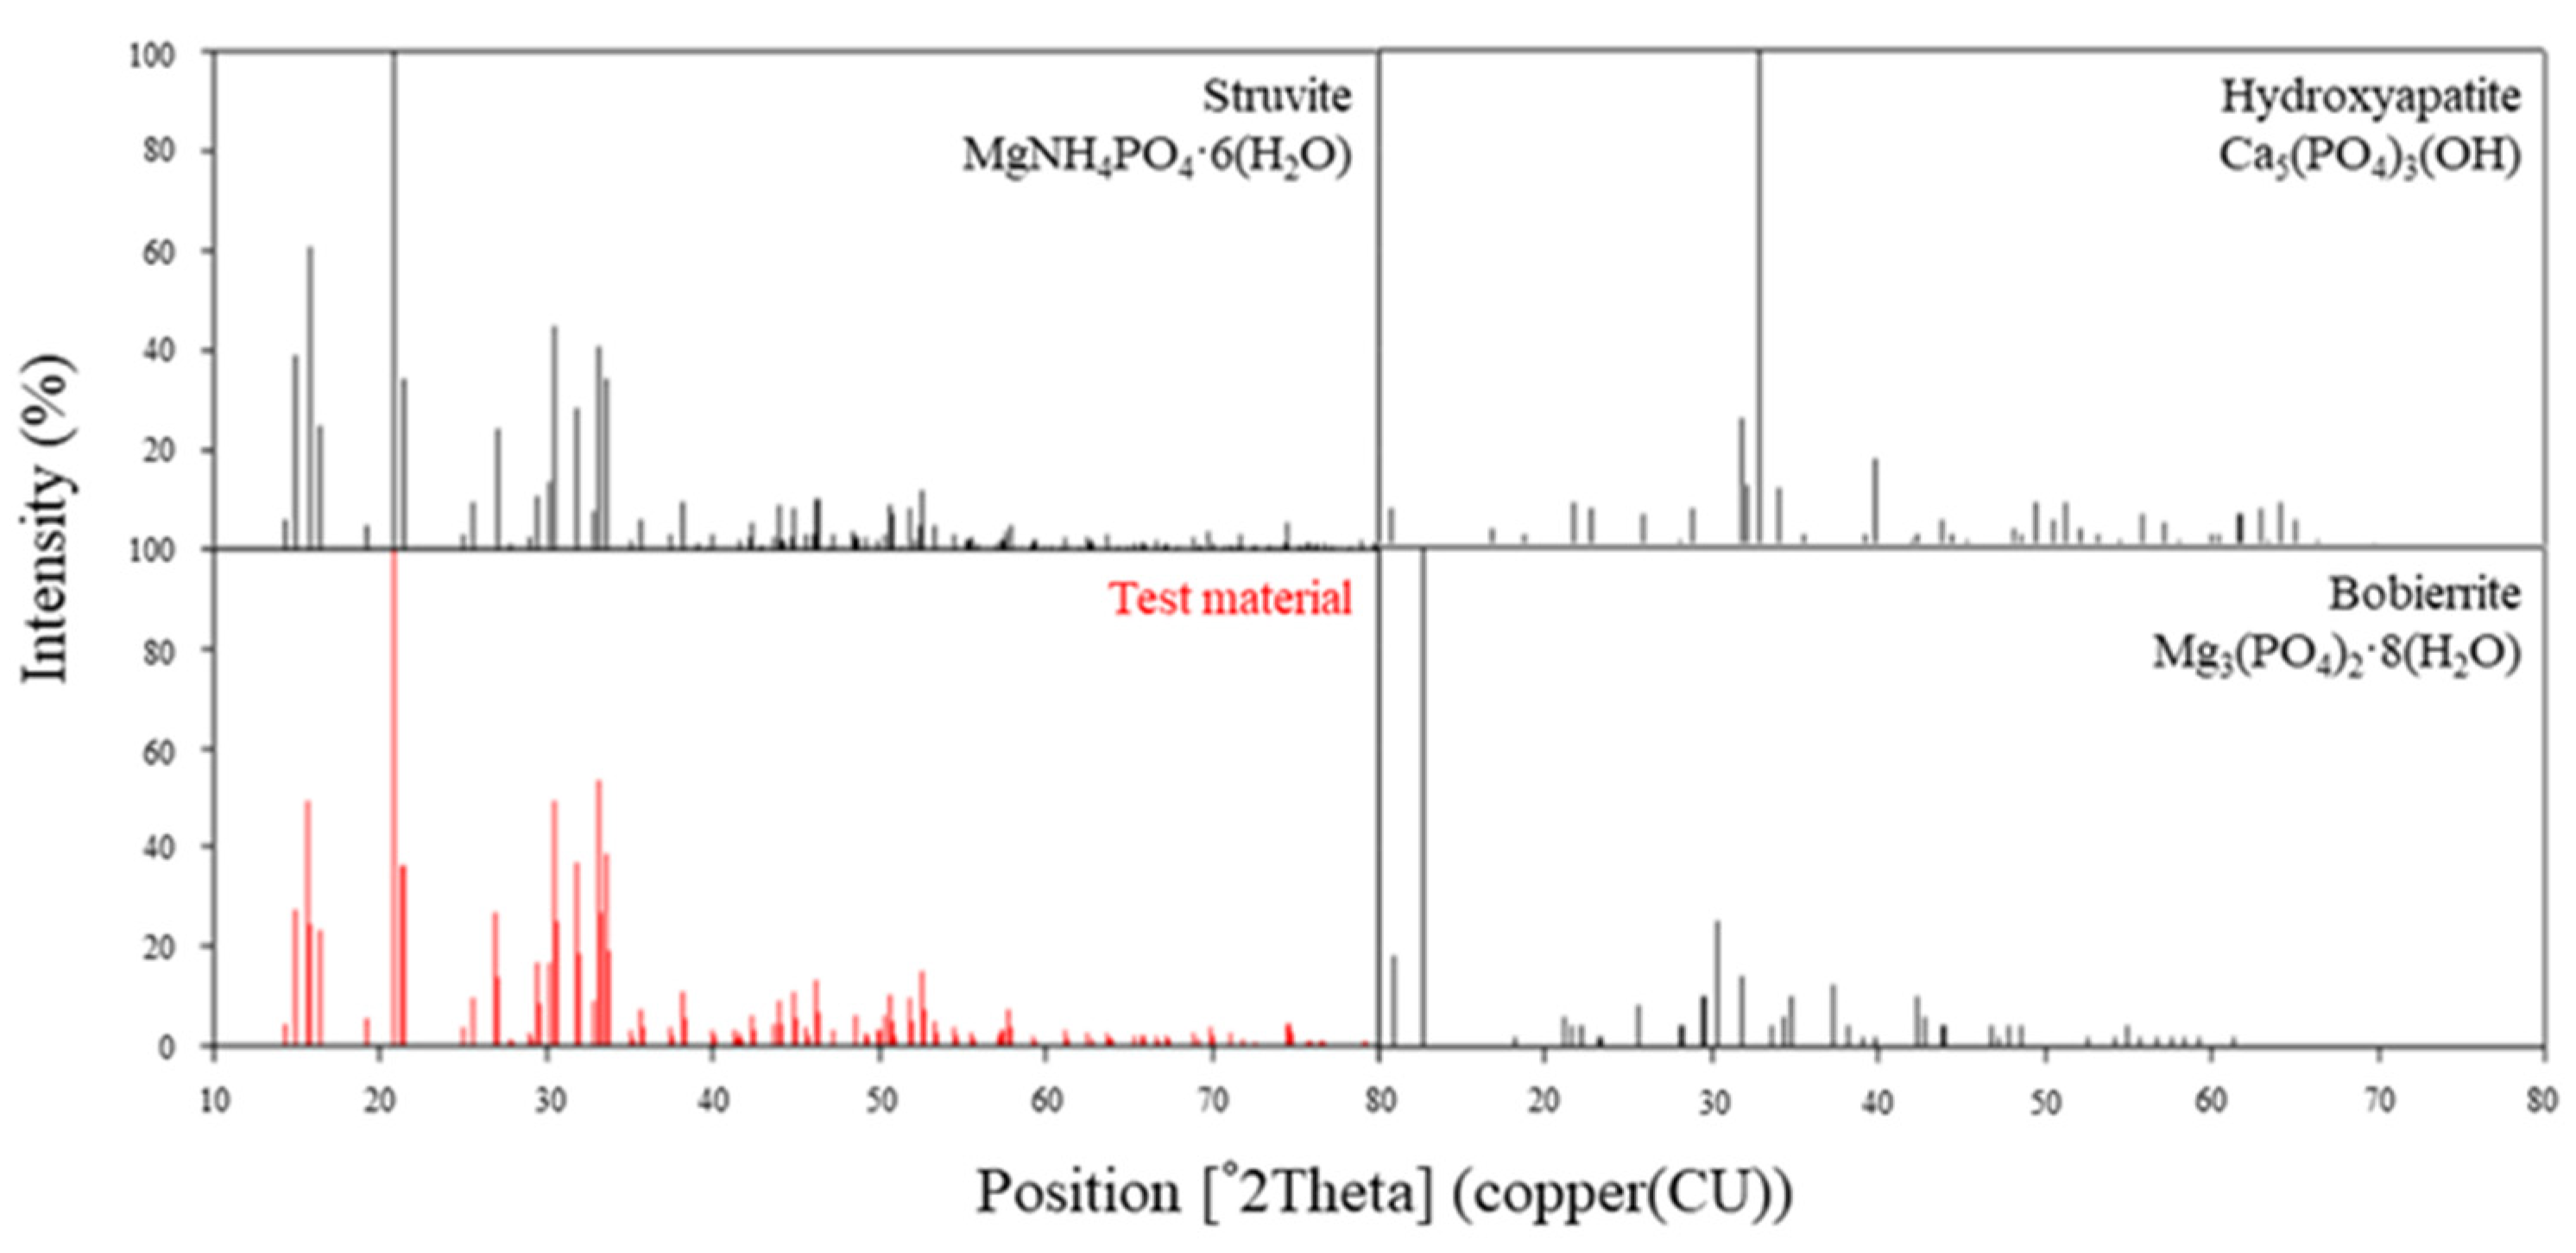
3.7. Identification and Characterization of the Recovered Material

The recovered material was precipitated as fine light brown particles and collected from the bottom of the reactor. The recovered material was compared with struvite (magnesium ammonium phosphate (MAP), MgNH4PO4.6H2O), hydroxyapatite (Ca5(PO4)3(OH)), and bobierrite (Mg3(PO4)2.8H2O) and showed similar appearance as struvite in XRD analysis (Figure 6). Under SEM analysis, the structure of struvite appeared as irregular, rectangular, and ortho-rhombic crystals (Figure 7).
Struvite, when recovered, has very high moisture content. The recovered struvite was therefore dried and checked for the presence of MAP and trace metals to compare with the Korean standards for fertilizer and feed raw materials. The recovered material was composed of 21.6% P, 5.0% N, 18.1% Mg, and 6.0% calcium (Ca), of which concentrations were higher over the theoretical values. The selected heavy metal contents were also very low compared to the trace levels or limits for the use as feed or fertilizer (Table 6).
Since the settling performance of the reactor was well achieved, non-reacted P source combined with other particles was settled, and further Ca and Mg originated from swine wastewater itself. The production rate of struvite may be quite fluctuating based on the P content of the wastewater type. The commercially available phosphate fertilizer has 8.7% P, which is much lower than the P content of the struvite produced in this study. The recovered material containing high P content may sufficiently replace the existing chemical fertilizers in the market.

4. Conclusions

In this study, the struvite crystallization process was constructed to mitigate the problems of FBR, such as loss of the struvite fines and control the proper pH. The performance of the process was evaluated for swine wastewater, and the optimal operating conditions were selected using RSM designed with CCD as a fractional factorial design. The independent operational conditions of pH, CR, and HRT were estimated via CCD in 18 runs against the responses of NH4-N recovery in struvite formation, particle size, and SPR. The O-P recovery efficiency of over 91.0% was achieved through the entire runs. The particle size was formed in the range of 23.7–74.3 µm. The results of the RSM revealed that pH did not show any significant effect on NH4-N recovery, particle size, and SPR. The optimal CR over 2.94 L/Lreactor·h may be appropriate, but the optimal HRT can be considered with market demand such as the priority of particle size or productivity of struvite. Hence, the operational conditions pH 9.0, CR > 2.94 L/Lreactor·h, and HRT of 1 or 5 h were suggested to obtain better responses through RSM analyses. The recovered material from the recovery process was identified as struvite using XRD analysis. The component analysis showed that 21.6% P, 5.0% N, 18.1% Mg, and 6% Ca were present in the recovered material. The P percentage in the recovered struvite was higher than the available P-fertilizers in the market. Therefore, the struvite recovered from swine wastewater has the potential to be used as an alternative P source in fertilizer and feed industries.

Author Contributions

Conceptualization, S.W. and C.R.; methodology, S.W. and C.R.; software, S.S. and A.R.; formal analysis, S.S. and S.K.; investigation, S.S. and S.K.; resources, C.R.; data curation, S.S. and S.K.; writing—original draft preparation, N.A. and A.R.; writing—review and editing, S.W., A.R., and C.R.; visualization, S.W. and A.R.; supervision, S.W. and C.R.; project administration, C.R.; and funding acquisition, C.R. All authors have read and agreed to the published version of the manuscript.

Funding

This research was funded by the Institute of Planning and Evaluation for Technology in Food, Agriculture and Forestry of Korea, grant number C1011562-01-03 and partially supported by the Kangwon National University.

Conflicts of Interest

The authors declare no conflict of interest. The funders had no role in the design of the study; in the collection, analyses, or interpretation of data; in the writing of the manuscript, or in the decision to publish the results.

References

  1. Rahman, M.M.; Liu, Y.; Kwag, J.-H.; Ra, C. Recovery of struvite from animal wastewater and its nutrient leaching loss in soil. J. Hazard. Mater. 2011, 186, 2026–2030. [Google Scholar] [CrossRef] [PubMed]
  2. Doyle, J.D.; Parsons, S.A. Struvite formation, control and recovery. Water Res. 2002, 36, 3925–3940. [Google Scholar] [CrossRef]
  3. Le Corre, K.S.; Jones, E.V.; Hobbs, P.; Parsons, S.A. Phosphorus recovery from wastewater by struvite crystallization: A review. Crit. Rev. Environ. Sci. Technol. 2009, 39, 433–477. [Google Scholar] [CrossRef] [Green Version]
  4. Moerman, W.; Carballa, M.; Vandekerckhove, A.; Derycke, D.; Verstraete, W. Phosphate removal in agro-industry: Pilot- and full-scale operational considerations of struvite crystallization. Water Res. 2009, 43, 1887–1892. [Google Scholar] [CrossRef] [Green Version]
  5. Carballa, M.; Moerman, W.; De Windt, W.; Grootaerd, H.; Verstraete, W. Strategies to optimize phosphate removal from industrial anaerobic effluents by magnesium ammonium phosphate (MAP) production. J. Chem. Technol. Biotechnol. 2009, 84, 63–68. [Google Scholar] [CrossRef]
  6. Forrest, A.L.; Fattah, K.P.; Mavinic, D.S.; Koch, F.A. Optimizing struvite production for phosphate recovery in WWTP. J. Environ. Eng. 2008, 134, 395–402. [Google Scholar] [CrossRef]
  7. Reza, A.; Shim, S.; Kim, S.; Ahmed, N.; Won, S.; Ra, C. Nutrient leaching loss of pre-treated struvite and its application in sudan grass cultivation as an eco-friendly and sustainable fertilizer source. Sustainability 2019, 11, 4204. [Google Scholar] [CrossRef] [Green Version]
  8. Ueno, Y.; Fujii, M. Three years experience of operating and selling recovered struvite from full-scale plant. Environ. Technol. 2001, 22, 1373–1381. [Google Scholar] [CrossRef]
  9. Marchi, A.; Geerts, S.; Weemaes, M.; Wim, S.; Christine, V. Full-scale phosphorus recovery from digested waste water sludge in Belgium—Part I: Technical achievements and challenges. Water Sci. Technol. 2015, 71, 487–494. [Google Scholar] [CrossRef]
  10. Ye, X.; Ye, Z.L.; Lou, Y.; Pan, S.; Wang, X.; Wang, M.K.; Chen, S. A comprehensive understanding of saturation index and upflow velocity in a pilot-scale fluidized bed reactor for struvite recovery from swine wastewater. Powder Technol. 2016, 295, 16–26. [Google Scholar] [CrossRef]
  11. Li, B.; Boiarkina, I.; Yu, W.; Huang, H.M.; Munir, T.; Wang, G.Q.; Young, B.R. Phosphorus recovery through struvite crystallization: Challenges for future design. Sci. Total Environ. 2019, 648, 1244–1256. [Google Scholar] [CrossRef] [PubMed]
  12. Desmidt, E.; Ghyselbrecht, K.; Zhang, Y.; Pinoy, L.; Van der Bruggen, B.; Verstraete, W.; Rabaey, K.; Meesschaert, B. Global phosphorus scarcity and full-scale P-recovery techniques: A review. Crit. Rev. Environ. Sci. Technol. 2015, 45, 336–384. [Google Scholar] [CrossRef]
  13. Lougheed, T. Phosphorus recovery: New approaches to extending the life cycle. Environ. Health Perspect. 2011, 116, A302–A305. [Google Scholar] [CrossRef] [PubMed]
  14. Fattah, K.P.; Mavinic, D.S.; Koch, F.A. Influence of process parameters on the characteristics of struvite pellets. J. Environ. Eng. 2012, 138, 1200–1209. [Google Scholar] [CrossRef]
  15. Fattah, K.P. Assessing struvite formation potential at wastewater treatment plants. Int. J. Environ. Sci. Dev. 2012, 3, 548–552. [Google Scholar]
  16. Ye, Z.L.; Chen, S.H.; Wang, S.M.; Lin, L.F.; Yan, Y.J.; Zhang, Z.J.; Chen, J.S. Phosphorus recovery from synthetic swine wastewater by chemical precipitation using response surface methodology. J. Hazard. Mater. 2010, 176, 1083–1088. [Google Scholar] [CrossRef]
  17. Won, S.G.; Baldwin, S.A.; Lau, A.K.; Rezadehbashi, M. Optimal operational conditions for biohydrogen production from sugar refinery wastewater in an ASBR. Int. J. Hydrog. Energy 2013, 38, 13895–13906. [Google Scholar] [CrossRef]
  18. Baş, D.; Boyacı, İ.H. Modeling and optimization I: Usability of response surface methodology. J. Food Eng. 2007, 78, 836–845. [Google Scholar] [CrossRef]
  19. Ahmadi, M.; Vahabzadeh, F.; Bonakdarpour, B.; Mofarrah, E.; Mehranian, M. Application of the central composite design and response surface methodology to the advanced treatment of olive oil processing wastewater using Fenton’s peroxidation. J. Hazard. Mater. 2005, 123, 187–195. [Google Scholar] [CrossRef]
  20. Kataki, S.; West, H.; Clarke, M.; Baruah, D.C. Phosphorus recovery as struvite from farm, municipal and industrial waste: Feedstock suitability, methods and pre-treatments. Waste Manag. 2016, 49, 437–454. [Google Scholar] [CrossRef]
  21. Ahmed, N.; Shim, S.; Won, S.; Ra, C. Struvite recovered from various types of wastewaters: Characteristics, soil leaching behaviour, and plant growth. Land Degrad. Dev. 2018, 29, 2864–2879. [Google Scholar] [CrossRef]
  22. Rahman, M.M.; Salleh, M.A.M.; Rashid, U.; Ahsan, A.; Hossain, M.M.; Ra, C. Production of slow release crystal fertilizer from wastewaters through struvite crystallization—A review. Arab. J. Chem. 2014, 7, 139–155. [Google Scholar] [CrossRef] [Green Version]
  23. APHA; AWWA; WEF; WPCF. Standard Methods for the Examination of Water and Wastewater, 21st ed.; American Public Health Association: Washington, DC, USA, 2005. [Google Scholar]
  24. Ronteltap, M.; Maurer, M.; Hausherr, R.; Gujer, W. Struvite precipitation from urine–influencing factors on particle size. Water Res. 2010, 44, 2038–2046. [Google Scholar] [CrossRef] [PubMed]
  25. Kim, B.U.; Lee, W.H.; Lee, H.J.; Rim, J.M. Ammonium nitrogen removal from slurry-type swine wastewater by pretreatment using struvite crystallization for nitrogen control of anaerobic digestion. Water Sci. Technol. 2004, 49, 215–222. [Google Scholar] [CrossRef] [PubMed]
  26. Ye, Z.L.; Chen, S.H.; Lu, M.; Shi, J.W.; Lin, L.F.; Wang, S.M. Recovering phosphorus as struvite from the digested swine wastewater with bittern as a magnesium source. Water Sci. Technol. 2011, 64, 334–340. [Google Scholar] [CrossRef]
  27. Shim, S.; Won, S.; Reza, A.; Kim, S.; Ahn, S.; Jung, B.; Yoon, B.; Ra, C. In vivo toxicity and in vitro solubility assessment of pre-treated struvite as a potential alternative phosphorus source in animal feed. Animals 2019, 9, 785. [Google Scholar] [CrossRef] [Green Version]
  28. Kim, M.; Shim, S.; Reza, A.; Kim, S.; Won, S.; Jung, B.; Kim, J.; Ra, C. Evaluation of struvite recovered from swine wastewater as an alternative phosphorus source in broiler feed. Agriculture 2019, 9, 221. [Google Scholar] [CrossRef] [Green Version]
  29. Kozik, A.; Hutnik, N.; Piotrowski, K.; Mazienczuk, A.; Matynia, A. Precipitation and crystallization of struvite from synthetic wastewater under stoichiometric conditions. Adv. Chem. Eng. Sci. 2013, 3, 20. [Google Scholar] [CrossRef] [Green Version]
  30. Tansel, B.; Lunn, G.; Monje, O. Struvite formation and decomposition characteristics for ammonia and phosphorus recovery: A review of magnesium-ammonia-phosphate interactions. Chemosphere 2018, 194, 504–514. [Google Scholar] [CrossRef]
Figure 1. Schematic layout of: (A) the recovery process, (B) the settling zone, and (C) the reaction zone.
Processes 08 00422 g001
Figure 2. Variation of particle size according to: (A) elapsed time in preliminary experiment, and (B) average, upper, and bottom 10%.
Processes 08 00422 g002
Figure 3. 3D response surface plots showing the effects on NH4-N recovery of: (A) pH × circulation rate, (B) pH × hydraulic retention time, and (C) circulation rate × hydraulic retention time.
Processes 08 00422 g003
Figure 4. 3D response surface plots showing the effects on struvite particle size of: (A) pH × circulation rate, (B) pH × hydraulic retention time, and (C) circulation rate × hydraulic retention time.
Processes 08 00422 g004
Figure 5. 3D response surface plots showing the effects on struvite production rate of: (A) pH × circulation rate, (B) pH × hydraulic retention time, and (C) circulation rate × hydraulic retention time.
Processes 08 00422 g005
Figure 6. Result of XRD analysis of recovered material.
Processes 08 00422 g006
Figure 7. SEM picture of recovered material.
Processes 08 00422 g007
Table 1. Characteristics of swine wastewater.
ParametersValue a
TS 112,879.0–15,251.7
TVS 25122.2–6975.6
TSS 31070.0–1265.0
TVSS 4910.0–1130.0
O-P 593.9–116.4
NH4-N 65788.9–6425.2
T-P 7100.2–136.7
TKN 86033.7–6400.7
pH8.9–9.1
a Units in (mg/L) except for pH. 1 TS, total solid; 2 TVS, total volatile solid; 3 TSS, total suspended solid; 4 TVSS, total volatile suspended solid; 5 O-P, ortho phosphate; 6 NH4-N, ammonium nitrogen; 7 T-P, total phosphorus; 8 TKN, total Kjeldahl nitrogen.
Table 2. Operating conditions of optimization of the recovery process.
VariablesLevels (Codes)
Low (−1)Medium (0)High (1)
pH (x1)9.09.510.0
CR 1 (L/Lreactor·h) (x2)1.53.04.5
HRT 2 (h) (x3)1.03.05.0
Aeration rate (L air/Lreactor·min)0.03
Mg/P1.3
1 CR, circulation rate; 2 HRT, hydraulic retention time.
Table 3. The central composite design with coded and real values for three independent variables.
Run #Coded ValueReal Value
x1x2x3pHCR 1HRT 2
1−1−1−19.01.51
2−1−119.01.55
3−11−19.04.51
4−1119.04.55
51−1−110.01.51
61−1110.01.55
711−110.04.51
811110.04.55
9−1009.03.03
1010010.03.03
110−109.51.53
120009.53.03
1300−19.53.01
140019.53.05
150009.53.03
160009.53.03
170009.53.03
180009.53.03
1 CR, circulation rate; 2 HRT, hydraulic retention time.
Table 4. Characteristics of the parts of recovery process from the preliminary test.
ParametersInfluentReaction ZoneSettling ZoneEffluentRemoval Efficiency
mg/L%
TS 113,706.2 ± 1.014,822.5 ± 4.913,318.2 ± 2.413,157.4 ± 0.64.0 ± 9.9
TVS 25565.7 ± 0.85485.4 ± 2.85380.8 ± 1.25325.4 ± 0.64.3 ± 10.3
TSS 31183.0 ± 92.61281.4 ± 54.51198.5 ± 47.71125.0 ± 31.44.9 ± 8.0
TVSS 4991.0 ± 82.31058.0 ± 71.3978.2 ± 29.4925.7 ± 38.46.6 ± 9.2
O-P 5112.2 ± 8.18.5 ± 4.67.9 ± 2.07.7 ± 2.993.1 ± 1.2
NH4-N 66131.5 ± 349.85337.8 ± 276.05289.7 ± 352.95149.4 ± 1,099.216.0 ± 6.6
T-P 7118.5 ± 25.9258.2 ± 32.757.2 ± 10.524.7 ± 4.579.1 ± 3.3
TKN 86217.2 ± 259.57258.5 ± 356.26074.5 ± 494.25318 ± 533.014.4 ± 27.3
1 TS, total solid; 2 TVS, total volatile solid; 3 TSS, total suspended solid; 4 TVSS, total volatile suspended solid; 5 O-P, ortho phosphate; 6 NH4-N, ammonium nitrogen; 7 T-P, total phosphorus; 8 TKN, total Kjeldahl nitrogen.
Table 5. Experimental results from 18 runs by CCD.
Run#Operational ConditionResponse
pHCR 1
(L/Lreactor·h)
HRT 2
(h)
Removal Efficiency (%)Particle Size
(µm)
SPR 5
(kg struvite/m3reactor·d)
O-P 3NH4N 4(NH3)stripping(NH4+)struvite
19.01.5183.45.85.20.625.710.6
29.01.5586.12.11.20.923.72.8
39.04.5193.212.98.74.240.911.8
49.04.5589.18.67.70.874.33.0
510.01.5191.915.713.12.751.312.5
610.01.5585.89.88.71.024.52.9
710.04.5193.220.516.14.450.011.8
810.04.5589.617.616.70.962.13.1
99.03.0393.116.015.01.069.98.7
1010.03.0390.014.814.10.851.94.9
119.51.5395.010.810.00.831.14.9
129.54.5381.410.09.51.136.23.9
139.53.0193.516.814.10.849.816.2
149.53.0597.111.610.61.051.34.9
159.53.0394.58.67.80.843.95.3
169.53.0394.121.420.70.834.54.8
179.53.0393.010.910.41.240.84.5
189.53.0393.913.613.00.639.74.7
Ave. 91.012.611.21.443.26.7
Std. 4.35.04.61.117.04.1
1 CR, circulation rate; 2 HRT, hydraulic retention time; 3 O-P, ortho-phosphate; 4 NH4-N, ammonium nitrogen; 5 SPR, struvite production rate.
Table 6. Characteristics of recovered material from swine wastewater and the Korean standard limits of raw materials for fertilizer and feedstock.
ParametersTest Materials RecoveredStandard Limits (DM Basis)
FertilizerFeedstock
Phosphorus (%)21.6--
Nitrogen (%)5.0--
Magnesium (%)18.1--
Calcium (%)6.0--
Potassium (mg/kg)3567.6--
Zinc (mg/kg)ND 2900-
Nickel (mg/kg)ND45-
Copper (mg/kg)15.7360-
Cadmium (mg/kg)ND51.0
Lead (mg/kg)0.000113010.0
Arsenic (mg/kg)0.0012452.0
Chromium (mg/kg)ND200100.0
Mercury (mg/kg)ND20.4
Selenium (mg/kg)ND-2.0
1 DM, dry matter; 2 ND, not detected.

