Article

Temperature Distribution Estimation in a Dwight–Lloyd Sinter Machine Based on the Combustion Rate of Charcoal Quasi-Particles

1
Department of Materials Process Engineering, Kyushu University, 744 Motooka, Nishi-ku, Fukuoka 819-0395, Japan
2
Department of Materials Science and Engineering, Faculty of Engineering, Kyushu University, 744 Motooka, Nishi-ku, Fukuoka 819-0395, Japan
3
Department of Materials Process Engineering, Graduate School of Engineering, Kyushu University, Now at JFE Steel, 1 Mizushima-kawasaki-dori, Kurashiki, Okayama Prefecture 712-8511, Japan
*
Authors to whom correspondence should be addressed.
Processes 2020, 8(4), 406; https://doi.org/10.3390/pr8040406
Submission received: 27 February 2020 / Revised: 23 March 2020 / Accepted: 25 March 2020 / Published: 31 March 2020
(This article belongs to the Special Issue Process Modeling in Pyrometallurgical Engineering)

Abstract

:
The coke combustion rate in an iron ore sintering process is one of the most important determining factors of quality and productivity. Biomass carbon material is considered to be a coke substitute with a lower CO2 emission in the sintering process. The purpose of this study was to investigate the combustion rate of a biomass carbon material and to use a sintering simulation model to calculate its temperature profile. The samples were prepared using alumina powder and woody biomass powder. To simplify the experimental conditions, alumina powder, which cannot be reduced, was prepared as a substitute of iron ore. Combustion experiments were carried out in the open at 1073 K~1523 K. The results show that the combustion rates of the biomass carbon material were higher than that of coke. The results were analyzed using an unreacted core model with one reaction interface. The kinetic analysis found that the kc of charcoal was higher than that of coke. It is believed that the larger surface area of charcoal may affect its combustion rate. The analysis of the sintering simulation results shows that the high temperature range of charcoal was smaller than that of coke because of charcoal’s low fixed carbon content and density.

Graphical Abstract

1. Introduction

CO2 emission from Japan’s industrial sector is much higher than that from other sectors. In 2017, it accounted for approximately 37.2% of the total emission. In the industrial sector, the iron and steel-making industry accounts for approximately 39.4% of energy consumption. The steel industry emits approximately 13% of the CO2 in Japan [1]. The demands of global environmental conservation require a greenhouse gas reduction. Currently, approximately 80 million tons of pig iron are produced by blast furnace annually in Japan. Coal and coke are used as reducing materials and heat sources, respectively, and a large amount of CO2 is emitted in the iron-making process. Therefore, the development of innovative technologies is required to reduce the CO2 emission.
Trees absorb carbon dioxide during photosynthesis. When wood from forests is burned as fuel, carbon dioxide is generated. If the forest is renewed after tree cutting, the carbon dioxide will be absorbed by the trees again during the growth process. Thus, the use of wood for energy is carbon neutral. Therefore, using wood instead of fossil fuels makes it possible to reduce carbon dioxide emissions and contribute to the prevention of global warming [2].
It is increasingly difficult to prepare a sintering iron ore due to the high price of raw materials, environmental regulations and inferior quality raw materials. Limited work [3,4,5,6] has been conducted to investigate the application of biomass in the sintering process to replace coke breeze, with this work mainly focused on its environmental impacts and low substitution rates. Therefore, it is necessary to improve the sintering iron ore method. In the sintering process, the coke combustion rate is one of the most important determining factors of quality and productivity.
However, little research has been conducted on the combustion behavior of biomass carbon material quasi-particles during the sintering process. The purpose of this study was to investigate the combustion rate of a biomass carbon material and use a sintering simulation model to calculate its temperature profile.

2. Experimental Sample and Procedure

To simulate the test particles, the samples were prepared using alumina powder and woody biomass powder. The woody biomass powder used in this study was commercial mangrove charcoal, which is normally used for barbecues. To simplify the experimental conditions, alumina powder was prepared as a substitute for iron ore. Alumina eliminated the effects of melt formation, reduction and re-oxidation of iron ore during coke combustion. Charcoal powder with a particle diameter of −125 μm and 125~250 μm was used in this experiment. The particle size of iron ore was to simulate the adhere powder layer, but not the coke particle. Coke powder with the same particle diameter was used to compare the results. Alumina powder with a particle diameter of −250 μm was prepared to match the particle size of the iron ore. The analysis of the results of prepared carbon material are listed in Table 1. Compared with coke, charcoal has a lower ash ratio and higher volatile matter content and therefore charcoal has a lower fixed carbon. The surface area of charcoal is higher than that of coke. This was also observed by an SEM, as shown in Figure 1. Figure 2 shows the overall view of raw materials and samples. After the alumina and coke powders were mixed, 0.5 mass % flour was mixed as a binder. The flour was just used to enable keeping the tablet shape until it was inserted to the platinum basket. It was thought that the effect of the flour could be negligible, because flour evaporates at a lower temperature—600 K—than the experimental temperature in this study. Then, the mixture was pressed into 10 mm diameter tablets by stainless dies. The height of the tablet was 10 mm with a void ratio of 35%. The void ratio was decided from the information on the tablet volume and the true density of the sample mixture. Each true density of the sample materials was measured by pycnometer. The weight ratio of coke in each sample was fixed at 20 mass %. To ensure that the volume ratio of the samples was the same as the hematite and alumina samples, 22.1 mass % coke with 77.9 mass % alumina and 20.8 mass % charcoal with 79.2 mass % alumina was also prepared.
The measurement of the sample weight loss during coke combustion was done by the thermobalance shown in Figure 3. The sample was placed in a platinum basket. A vertical electric resistance furnace was used to do isothermal heating. The isothermal zone was heated up to 1073 K, 1223 K, 1373 K and 1523 K. Before the combustion experiment, heat treatment of the samples was carried out at each of the given temperatures in a N2 atmosphere for 30 mins to remove water, Volatile matter (V.M.) and the binder from the samples. Then, air was passed through the reaction tube. The air flow rate was 4 NL/min. When a weight change in the sample was not observed, the experiment was terminated. It was hypothesized that coke ash did not influence the weight loss of the sample because the amount of coke in every sample stayed the same.

3. Results

The reaction ratio in the study was defined as the removal ratio of fixed carbon from the sample. A carbon combustion reaction can be described using the following chemical reaction, if CO gas formation is ignored:
C ( s ) + O 2 ( g ) = CO 2 ( g )
In the combustion experiment, the sample weight loss was attributed to the decrease in the amount of fixed carbon. Therefore, the reaction ratio (F) at a reaction time can be described by Equation (2):
F = Δ w t W
Fractional reaction curves at 1073 K are shown in Figure 4. The figure shows that combustion rates of charcoal were quicker than those of coke. This tendency was also observed at 1223 K, 1373 K and 1523 K.
To verify the reaction mechanism of the combustion reaction, samples with a reaction ratio of 50% were also prepared under 1073 K and 1523 K and cross-sectional and microscopic observations were made. Figure 5 and Figure 6 show the cross-sectional observation and the microstructure at the reaction interfaces of each sample. It was clear that the combustion reaction was a topochemical reaction.

4. Kinetic Analysis

4.1. Unreacted Core Model for Coke

From the fractional reaction curves obtained from the combustion experiment, the combustion reaction rate constant was determined using the unreacted core model [7]. The combustion reaction has five processes [8].
1.
O2 transport from the gas phase to the particle surface through the gas film:
n ˙ g O 2 = 4 π r 0 2 k f ( C O 2 C O 2 s )
2.
O2 transport from the particle surface to the reaction interface through the alumina powder layer after coke combustion:
n ˙ d O 2 = ( D O 2 ) e f f 4 π r 0 r i r 0 r i ( C O 2 s C O 2 i )
3.
The combustion reaction at the reaction interface:
R ˙ = 4 π r i 2 k c ( C O 2 i C CO 2 i K )
4.
CO2 transport from the reaction interface to the particle surface through the alumina powder layer after coke combustion:
n ˙ d CO 2 = ( D CO 2 ) e f f 4 π r 0 r i r 0 r i ( C CO 2 i C CO 2 s )
5.
CO2 transport from the particle surface to the gas phase through the gas film:
n ˙ g CO 2 = 4 π r 0 2 k f ( C CO 2 s C CO 2 )
The overall rate equation can be described by the quasi-steady state analysis method below:
n ˙ = 4 π r 0 2 ( K 1 + K ) ( C O 2 C CO 2 ) 1 k f + 1 D e r 0 ( r o r i ) r i + 1 k c K 1 + K ( r 0 r i ) 2
1 D e = K 1 + K ( 1 ( D O 2 ) e f f + 1 K ( D CO 2 ) e f f )
Equation (8) can be expressed by the following equation, assuming that the combustion reaction of coke was an irreversible reaction and the equilibrium constant K infinite:
n ˙ = 4 π r 0 2 C O 2 1 k f + 1 D e r 0 ( r 0 r i ) r i + 1 k c ( r 0 r i ) 2
n ˙ can be replaced by the following equation:
n ˙ = d d t ( 4 3 π r i 3 ρ C m ) = 4 π r i 2 ρ C m d r i d t
The reaction ratio F is expressed by Equation (12):
F = 1 ( r i r 0 ) 3
When Equations (10)–(12) are combined and integrated under boundary conditions; r = r0 at t = 0 and r = ri at t = t, Equation(13) is obtained:
t = ρ C m r 0 C O 2 [ F 3 k f + d r 16 D e { 3 3 ( 1 F ) 2 3 + 2 F } + 1 k C { 1 ( 1 F ) 1 3 } ]
The gas film mass transfer coefficient, kf, can be calculated from Ranz–Marshall’s Equation [9]. The value of the effective diffusion coefficient in the alumina layer, De, and the interfacial reaction rate coefficient of coke, kC, was obtained by parameter-fitting using the nonlinear least-squares method to the fractional reaction curves.
De, and kC can be expressed by substituting the coefficients in Arrhenius’ equation as shown:
k C = A ( k C ) e x p ( E a ( k C ) R T )
D e = A ( D e ) e x p ( E a ( D e ) R T )
Equations (13) and (14) can be transformed into the following equations:
l n k C = E a ( k C ) R 1 T + l n A ( k C )
l n D e = E a ( D e ) R 1 T + l n A ( D e )
Figure 7 shows the Arrhenius plot of kc. The values of kc are at the same level in all samples.
The temperature dependence of kc is expressed as
Coke  (−125 μm)  kc = 6.02 × 10⁻² exp(−9.32 × 10³/RT)  (m/s)
  (125~250 µm)  kc = 4.51 × 10⁻² exp(−5.12 × 10³/RT)  (m/s)
Figure 7. Temperature dependence of the reaction rate constants kc.
Processes 08 00406 g007
Figure 8 shows the Arrhenius plot of De. The temperature dependence of De can be expressed as
Coke  (−125 μm)  De = 1.79 × 10³ exp(−36.4 × 10³/RT)  (m/s)
  (125~250 µm)  De = 3.06 × 10⁻³ exp(−36.6 × 10³/RT)  (m/s)
Figure 8. Temperature dependence of the effective diffusivities De.
Processes 08 00406 g008

4.2. Chemical Reaction Control Step for Charcoal

Because the surface area of charcoal is larger than that of coke, when a combustion reaction takes place, the reaction area of charcoal will also be larger. Moreover, due to the low ash ratio in the charcoal, the O2 transportation rate in the alumina layer will be large. Therefore, the reaction is based on the chemical reaction control step.
For the charcoal samples, the chemical reaction control step can be used in the analysis method shown below:
The combustion reaction at the reaction interface can be expressed by Equation (5).
The combustion rate can be expressed as
n ˙ = 4 π r 0 2 ( K 1 + K ) ( C O 2 C C O 2 K ) 1 k c K 1 + K ( r 0 r i ) 2
Under boundary conditions, r = r0 at t = 0 and r = ri at t = t, and this gives Equation (19):
[ 1 ( 1 F ) 1 3 ] = C O 2 ρ c m r 0 k c t
Based on the reaction curves obtained by the experiments, kc was determined using the unreacted core model [3].
kC can be substituted in Arrhenius’ equation as shown by Equation (14) which also can be transformed as Equation (16).
Figure 9 shows the Arrhenius plot of kc.
The temperature dependence of kc can be expressed as
Coke  (−125 μm)  kc = 8.24 × 10 3 exp ( 10.6   ×   10 3 / R T )   (m/s)
  (125~250 µm)  kc = 8.54 × 10 3 exp ( 10.3   ×   10 3 / R T )   (m/s)
Figure 9. Temperature dependence of the reaction rate constants kc.
Processes 08 00406 g009

5. Sintering Simulation Model

5.1. Simulation Method

The simulation condition was based on the study results using Ohno’s model [10]. The model has S’-type, C-type and P-type quasi-particles as shown in Figure 10. The S’ type was calculated using Hottel’s equation [11,12,13], while the C and P types were calculated based the results obtained in this study.
Our mathematical model is based on the Dwight–Lloyd sinter machine and the calculation range is from the ignition point on the pallet to the discharge of the sinter ore.
The numerical analysis was based on the control volume method shown in Figure 11. The control volume method is obtained by dividing the analysis target region into equal minute portions. Various basic equations, representing phenomena, such as the continuous and energy conservation equations, govern the inside of the analysis target area and are relational equations to be established in each control volume. Assuming that these control volumes are in a sufficiently small area, there would not be a large error even if the changes in various quantities inside the control volumes were linear or approximated to be constant values. In other words, changes in various quantities in a certain control volume can be represented using values at a representative point in the control volume adjacent to the representative point. In our mathematical model, the sintering material layer was divided into minute control volumes in one dimension, the basic governing equations were discretized, and each difference approximation equation was solved using an explicit method.
In the model used, the temperature distribution was estimated considering the combustion of carbonaceous materials, the decomposition reaction of CaCO3, the evaporation and condensation of water, and the formation and solidification of calcium ferrite melt according to Ohno’s model [10].
De depends on coke distribution.
The combustion reaction rate of the quasi-particles is expressed by Equations (20) and (21):
r Q u a s i p a r t i c l e * = 4 π r Q u a s i p a r t i c l e 2 k C O 2
k = 1 / ( 1 k f + r 0 ( r 0 r i ) D e r i + r 0 2 k c r i 2 )
In this equation, De has a value of 108 because the resistance of the diffusion can be ignored.
The material balance is calculated using Equation (22):
ρ i x | t + Δ t ρ i x | t Δ t = ( ρ Z + Δ Z u i ) | Z + Δ Z ( ρ Z u i 1 ) | Z Δ Z + r i , x *
The material balance equations of N2, O2, CO2 and H2 respectively, can be expressed as follows:
( ρ N 2 u ) Z = ρ N 2 t
( ρ O 2 u ) Z = ρ O 2 t r C o k e *
( ρ C O 2 u ) Z = ρ C O 2 t + r C o k e * + r C a C O 3 *
( ρ H 2 O u ) Z = ρ H 2 O t + r H 2 O *
Because convection did not occur in the solid phase, the thermal budget of the phase considering heat transfer and reaction heat can be represented as
ρ s C P s T s t 6 ( 1 ε a ) d ˙ h ( T g T s ) + H C o k e ( r C o k e * n C o k e + r Q u a s i p a r i t c l e * n Q u a s i p a r t i c l e ) + H C a C O 3 r C a C O 3 * n C a C O 3 + H H 2 O V r H 2 O V * + H C F G r C F G * + H C F S r C F S * = k 2 T s Z 2
The thermal budget of the gas phase factoring the heat transfer and combustion reaction heat can be expressed as
ρ g C P g T g t 6 ( 1 ε a ) d ˙ h ( T s T g ) + C P g ρ g u T g Z = k 2 T g Z 2
The particles were charged in the control volume. Therefore, the pressure loss of the fluid also needed to be considered. The pressure loss of a laminar-turbulent transition area can be represented by Ergun’s equation as shown:
Δ P Δ Z = 150 ( 1 ε a ) 2 ( φ d ) 2 ε a 3 μ g ρ g U + 1.75 1 ε a φ d ε a 3 U 2

5.2. Calculation Conditions

Table 2 lists the common calculation conditions for the sintering process. The composition of raw materials was set to simplify the calculation condition. The influence of MgO was not considered in this study. The particle size of hematite was set to 2.5 mm and 0.25 mm. It was assumed that 2.5 mm and 0.25 mm were the sizes of the nuclear particle and the adhering fine ores, respectively, in the quasi-particle. The 5.1 mass % charcoal calculation was compared with the 4 mass % coke calculation when the fixed carbon content is the same which means that the combustion heat of coke and charcoal during this process is the same. However, in this study, the effect of V.M. was not discussed. As a thought, the gas generated when V.M. is heated may improve the permeability and affect the temperature profile in the same way as a gas fuel injection, mentioned by Oyama [14]. Further research is needed to clarify this factor.
Table 3 lists the state of the coke quasi-particles in the sinter bed for calculation using the date of the sinter pot test based on Hida’s study [15].

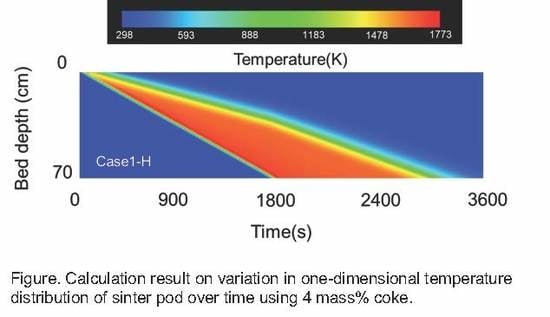
5.3. Calculation Results

Figure 12 and Figure 13 show the temperature profiles of the cases of coke and charcoal at a depth of 20 cm and 40 cm, respectively. The basic case was 4 mass% coke mixing condition. It was compared with cases of 4 mass % and 5.1 mass % charcoal mixing conditions. The influence of particle size is not apparent. Compared with the results for coke, charcoal has a lower temperature profile and a shorter holding time at a high temperature. This is thought to be due to the low fixed carbon content and the density of charcoal which leads to the presence of unreacted charcoal. As a result, the temperature of charcoal in all the sinter cakes was lower than that of coke.
However, when the amount of charcoal was 5.1 mass %, the holding times at a high temperature of both kinds of carbon material were at the same level. The highest temperature of charcoal was higher than that of coke. The rate of the temperature increase of charcoal was also faster than that of coke. This is because the combustion rate of charcoal is higher than that of coke, i.e., if the fixed carbon content of charcoal is equivalent to that of coke, the temperature profile of the same level can be obtained. Therefore, the sintering simulation results of this study show that there are probabilities that charcoal can replace coke in the sintering process.

6. Conclusions

The study aimed to understand the combustion rate of a biomass carbon material using a sintering model to calculate its temperature profile. The following conclusions were made:
  • Compared with coke, the reaction curves of charcoal combustion show that the combustion reaction of charcoal is faster.
  • The interfacial chemical reaction rate coefficient of charcoal for the experimental data was calculated as follows:
Coke  (−125 μm)  kc = 8.24 × 10 3 exp ( 10.6   ×   10 3 / R T )   (m/s)
  (125~250 µm)  kc = 8.54 × 10 3 exp ( 10.3   ×   10 3 / R T )   (m/s)
  • Calculations using the rate equation obtained in the sintering simulation model found that the high temperature range of charcoal is smaller than that of coke due to charcoal’s low fixed carbon content and density.
  • If the fixed carbon content of charcoal is the same as that of coke, which means that the combustion heat of carbon materials is the same, a temperature profile of the same level can be obtained.
  • The sintering simulation results suggest that there are probabilities that biomass carbon materials can replace coke in the sintering process.

Author Contributions

Conceptualization, K.-i.O., and K.K.; Methodology, T.M.; Validation, K.-i.O., T.M., and Z.W.; Formal Analysis, S.N., and T.M.; Investigation, S.N.; Data Curation, Z.W., S.N., and T.M.; Writing-Original Draft Preparation, Z.W., and S.N.; Writing-Review and Editing, K.-i.O., and T.M.; Visualization, Z.W., and S.N.; Supervision, K.K.; Project Administration, K.-i.O. All authors have read and agreed to the published version of the manuscript.

Funding

This research received no external funding.

Conflicts of Interest

The authors declare no conflict of interest.

Nomenclature

A(kc,De)Frequency factor (m/s)
C(O2, CO2)O2 or CO2 concentration in the gas phase (mol/m3)
C(O2, CO2)·iO2 or CO2 concentration at the reaction interface (mol/m3)
C(O2, CO2)·sO2 or CO2 concentration at the particle surface (mol/m3)
CpSpecific heat (J/kg/K)
dParticle size (m)
DeEffective diffusion coefficient in the Al2O3 powder layer (m2/s)
(DO2, CO2)effEffective diffusion coefficient of O2 or CO2 in the Al2O3 powder layer (m2/s)
Ea(kc,De)Activation energy (J/mol)
FReaction ratio (–)
HReaction heat of each reaction (J/mol)
hConvection heat transfer coefficient (J/m2/s/K)
KEquilibrium constant (–)
kCInterfacial chemical reaction rate coefficient (m/s)
kfMass transfer coefficient in the gas film (m/s)
kHeat conductivity (J/m/s/K)
k’Overall reaction rate (m/s)
n(Coke, Quasi-particle, Lime, Ore)The amount of coke, quasi-particle, lime and ore among unit volume (-)
ΔPPressure loss (atm)
r0Initial radius (m)
riRadius of the non-reaction nucleus (m)
ri,x *Generation rate of the component x in the number i cell (kg/s/m3)
rQuasi-particleDistance from the left of the particle to the reaction interface of the quasi-particle (m)
r *Reaction ratio of the component in the sample (–)
r *Quasi-particleReaction rate per one particle of the quasi-particle (mol/s)
TgTemperature of gas in the control volume (K)
TsTemperature of solid in the control volume (K)
ΔwtSample weight change (kg)
USuperficial velocity (m/s)
uGas flow rate (m/s)
WWeight change of the sample during the experiment (kg)
ΔZLength of the control volume (m)
PxDensity of component x (kg/m3)
ρCmCarbon concentration in the sample (mol/m3)
ρN2, O2,CO2, H2ODensity of gas in the sample(kg/m3)
εaPorosity (-)
Φ(Surface area of a ball which has the same volume with the particle)/(Surface area of the particle) (-)
μgViscosity of gas (Pa·s)

References

  1. Japan’s National Greenhouse Gas Emissions in Fiscal Year 2017 (Final Figures); Ministry of the Environment: Tokyo, Japan, 2019.
  2. Takeshima, S. Biomass, Carbon-neutral and Renewable Energy. K. J. JIME 2012, 47, 133. [Google Scholar] [CrossRef] [Green Version]
  3. Lovel, R.R.; Vining, K.R.; Dell’Amico, M. The influence of fuel reactivity on iron ore sintering. ISIJ Int. 2009, 49, 195–202. [Google Scholar] [CrossRef] [Green Version]
  4. Zandi, M.; Martinez-Pacheco, M.; Fray, T. Biomass for iron ore sintering. Miner. Eng. 2010, 23, 1139–1145. [Google Scholar] [CrossRef]
  5. Ooi, T.; Aries, E.; Ewan, B.; Thompson, D.; Anderson, D.R.; Fisher, R.; Fray, T.; Tognarelli, D. The study of sunflower seed husks as a fuel in the iron ore sintering process. Miner. Eng. 2008, 21, 167–177. [Google Scholar] [CrossRef]
  6. Gan, M.; Fan, X.; Chen, X.; Ji, Z.; Lv, W.; Wang, Y.; Yu, Z.; Jiang, T. Reduction of pollutant emission in iron ore sintering process by applying biomass fuels. ISIJ Int. 2012, 52, 1574–1578. [Google Scholar] [CrossRef] [Green Version]
  7. Yagi, T.; Ono, Y. A method of analysis for reduction of iron oxide in mixed-control kinetics. Trans. ISIJ 1968, 8, 377. [Google Scholar]
  8. Ohno, K.; Noda, K.; Nisioka, K.; Maeda, T.; Shimizu, M. Combustion rate of coke in quasi-particle at iron ore sintering process. ISIJ Int. 2013, 53, 1588–1593. [Google Scholar] [CrossRef] [Green Version]
  9. Ranz, W.E.; Marshall, W.R. Evaporation from drops. Chem. Eng. Prog. 1952, 48, 173–180. [Google Scholar]
  10. Ohno, K.; Noda, K.; Nisioka, K.; Maeda, T.; Shimizu, M. Effect of coke combustion rate equation on numerical simulation of temperature distribution in iron ore sintering process. ISIJ Int. 2013, 53, 1642–1647. [Google Scholar] [CrossRef] [Green Version]
  11. Tu, C.M.; Davis, H.; Hottel, H.C. Combustion rate of carbon-combustion of spheres in flowing gas streams. Ind. Eng. Chem. 1934, 26, 749–757. [Google Scholar] [CrossRef]
  12. Davis, H.; Hottel, H.C. Combustion rate of carbon-combustion at a surface overlaid with stagnant gas. Ind. Eng. Chem. 1934, 26, 889–892. [Google Scholar] [CrossRef]
  13. Parker, A.S.; Hottel, H.C. Combustion rate of carbon study of gas-film structure by microsampling. Ind. Eng. Chem. 1936, 28, 1334–1341. [Google Scholar] [CrossRef]
  14. Oyama, N.; Iwami, Y.; Yamamoto, T.; Machida, S.; Higuchi, T.; Sato, H.; Sato, M.; Takeda, K.; Watanabe, Y.; Shimizu, M.; et al. Development of secondary-fuel injection technology for energy reduction in the iron ore sintering process. ISIJ Int. 2011, 51, 913–921. [Google Scholar] [CrossRef] [Green Version]
  15. Hida, Y.; Sasaki, M.; Enokido, T.; Umezu, Y.; Iida, T.; Uno, S. Effect of the existing state of coke breeze in quasi-particles of raw mix on coke combustion in the sintering process. Tetsu-to-Hagané 1982, 68, 400–409. [Google Scholar] [CrossRef] [Green Version]
Figure 1. Scanning electron micrograph of coke and charcoal (−125 µm).
Processes 08 00406 g001
Figure 2. Overall view of the raw materials and the sample.
Processes 08 00406 g002
Figure 3. Schematic of the device used in the experiment.
Processes 08 00406 g003
Figure 4. Fractional reaction curves of coke and charcoal combustion at 1073 K.
Processes 08 00406 g004
Figure 5. Cross-sectional view of the samples.
Processes 08 00406 g005
Figure 6. Microstructure of the samples at the reaction interface.
Processes 08 00406 g006
Figure 10. Classification of the quasi-particles.
Processes 08 00406 g010
Figure 11. Pattern diagram of the control volume.
Processes 08 00406 g011
Figure 12. Calculation results of the temperature profile (20cm).
Processes 08 00406 g012
Figure 13. Calculation results of the temperature profile (40cm).
Processes 08 00406 g013
Table 1. Properties of carbon materials.
Ash
(mass %)
V.M.
(mass %)
Fix.C.
(mass %)
Specific Surface Area (m2/g)
Charcoal (−125 μm)1.8429.269.061.0
Charcoal (125~250 μm)28.5
Coke (−125 μm)10.11.7188.22.59
Coke (125~250 μm)0.92
Table 2. Common calculation conditions.
▪Sinter Bed
Bed depth450 mm
Porosity of sinter bed35%
▪Composition of Raw materials
Hematite85.0 mass %
Lime (CaO)10.0 mass %
Moisture5.0 mass %
Coke, Charcoal4.0 mass % (additionally)
Charcoal5.1 mass % (additionally)
▪Diameter of Raw Materials
Hematite2.5 mm:0.25 mm ≈ 88.6:11.4
Lime (CaO)2.0 mm
▪Others
Initial temperature298 K
Ignition temperature1573 K
Ignition time90 s
Gas flow rate (outlet)0.6 m/s
Calculation cell5 mm
Time step0.001 s
Courant number0.2
Table 3. Existing state of the coke quasi-particles in the sinter bed.
Existing State of Coke (%)TotalAmount of Coke and Charcoal in Sinter Bed (%)
S’-TypeC-TypeP-Type
40.030.030.01004.0, 5.1

