Article

Ketone Solvent to Reduce the Minimum Miscibility Pressure for CO2 Flooding at the South Sumatra Basin, Indonesia

1
Department of Energy and Mineral Resources Engineering, Sejong University, Seoul 05006, Korea
2
Department of Energy and Resources Engineering, Kangwon National University, Chuncheon, Kangwon 24341, Korea
3
Petroleum Engineering Department, Bandung Institute of Technology, Bandung 40132, Indonesia
*
Authors to whom correspondence should be addressed.
Processes 2020, 8(3), 360; https://doi.org/10.3390/pr8030360
Submission received: 17 February 2020 / Revised: 12 March 2020 / Accepted: 18 March 2020 / Published: 21 March 2020

Abstract

:
This paper experimentally analyzes the chemical additives, i.e., methanol and ethanol, as alcohol solvents, and acetone as a ketone solvent, and the temperature influencing the minimum miscibility pressure (MMP) that is essential to design miscible CO2 flooding at an oil field, the South Sumatra basin, Indonesia. The experiments were designed to measure CO2-oil interfacial tension with the vanishing interfacial tension (VIT) method in the ranges up to 3000 psi (208.6 bar) and 300 degrees Celsius. The experiment results show that lower temperatures, larger solvent volumes, and the acetone were effective in reducing MMP. The acetone, an aprotic ketone solvent, reduced MMP more than the methanol and the ethanol in the CO2-oil system. The high temperature was negative to obtain the high CO2 solubility into the oil as well as the lower MMP. The experimental results confirm that the aprotic ketone solvent could be effective in decreasing the MMP for the design of miscible CO2 flooding at the shallow mature oilfields with a low reservoir temperature.

1. Introduction

Minimum miscibility pressure (MMP), i.e., the minimum pressure making CO2 and a crude oil mixture miscible in a reservoir, is essential to designing CO2 flooding as one of the enhanced-oil-recovery (EOR) methods [1,2,3]. The MMP is a key design guideline of injecting-fluid facilities, but a lot of oil fields have reservoir pressures lower than the MMP so that they are not able to implement miscible flow in the South Sumatra basin in Indonesia. Indonesia was the world’s fourth-largest emitter of greenhouse gases in 2015 and it is targeting a 29–49% reduction in emissions by 2030, compared to “business as usual” [4,5]. In addition to CO2 capture, CO2 geological storage has been a growing interest as enhanced oil recovery, i.e., CO2–EOR, in mature oil fields [6,7,8,9]. Indiscriminate exploration and development of oil fields have led to a reduction of reservoir pressure above expected levels so that gas injection into the reservoir had to be implemented to maintain reservoir pressure. However, maintaining the high reservoir pressure requires a large amount of natural gas or nitrogen for injection into mature oilfields, and, therefore, CO2–EOR would become an eco-friendly sequestration and also a profit-generating business model in Indonesia.
CO2 has been used to enhance the miscible oil recovery process in a wide range of oil reservoirs since CO2 has a lower MMP value than other gases, e.g., methane and nitrogen. If the reservoir pressure is below MMP, i.e., CO2 and oil do not form a single phase, the immiscible flow is generated depending on oil viscosity reduction and oil swelling; the accomplishment of optimal CO2 solubility is difficult because the degree of oil swelling and its viscosity is related to the CO2 solubility in oil in a complex manner [7]. Thus, the lower MMP enlarges the reservoir ranges applicable with miscible flow.
The selection of materials suitable to reduce MMP has been challenging. Much research has examined various chemicals as additives in the CO2–oil mixture [3,10,11,12,13,14,15]. Typically, they used long-chained alcohol mixtures, e.g., butanol, pentanol, and hexanol [10,13]. Choubineh et al. [12] showed that MMP increased in the presence of impurities, e.g., methane and nitrogen, and proposed ethane and butane as effective materials to reduce MMP. Liu et al. [3] suggested a hydrocarbon agent as a good additive. A few pieces of research have shown that acetone (an aprotic ketone solvent), soluble in water, could reduce the interfacial tension (IFT) of the water-oil system, e.g., smart-water flooding (chemical-water flow) [14,15]. They suggested that this acetone-water mixture could increase CO2 solubility and reduce the IFT related to the mutual-solvent volume and CO2 pressure released from the carbonate rocks. However, the performance of additives depends on the environmental conditions, e.g., temperature, pressure, the salinity, the reservoir heterogeneity, and the crude-oil composition. The field application would be limited because of the difficulty of supplying large amounts of additives even though lab-experiments selected the effective materials.
Unlike in previous works, which tested the long-chain and branched alcohol mixtures, this work pays attention to a ketone-type solvent, e.g., acetone, and alcohols with hydroxy polar group, i.e., methanol and ethanol, since they are abundant materials and easily accessible in Indonesia [16,17]. The research motives are from the possibility of solvent-CO2 on reducing the IFT similar to the water–oil system [14,15]. This paper experimentally investigates the solvent types (alcohols and ketone solvent) and temperature that would reduce MMP for miscible CO2 flooding at an onshore sandstone reservoir. Vanishing interfacial tension (VIT) apparatus is established to determine MMP under the high pressure and high temperature (HPHT) environment. The effects of additives and temperatures are investigated experimentally to reduce the MMP of the crude oil samples from the Sumatra basin, Indonesia.

2. Methodology

2.1. Properties of the Crude Oil Samples and the Chemical Additives
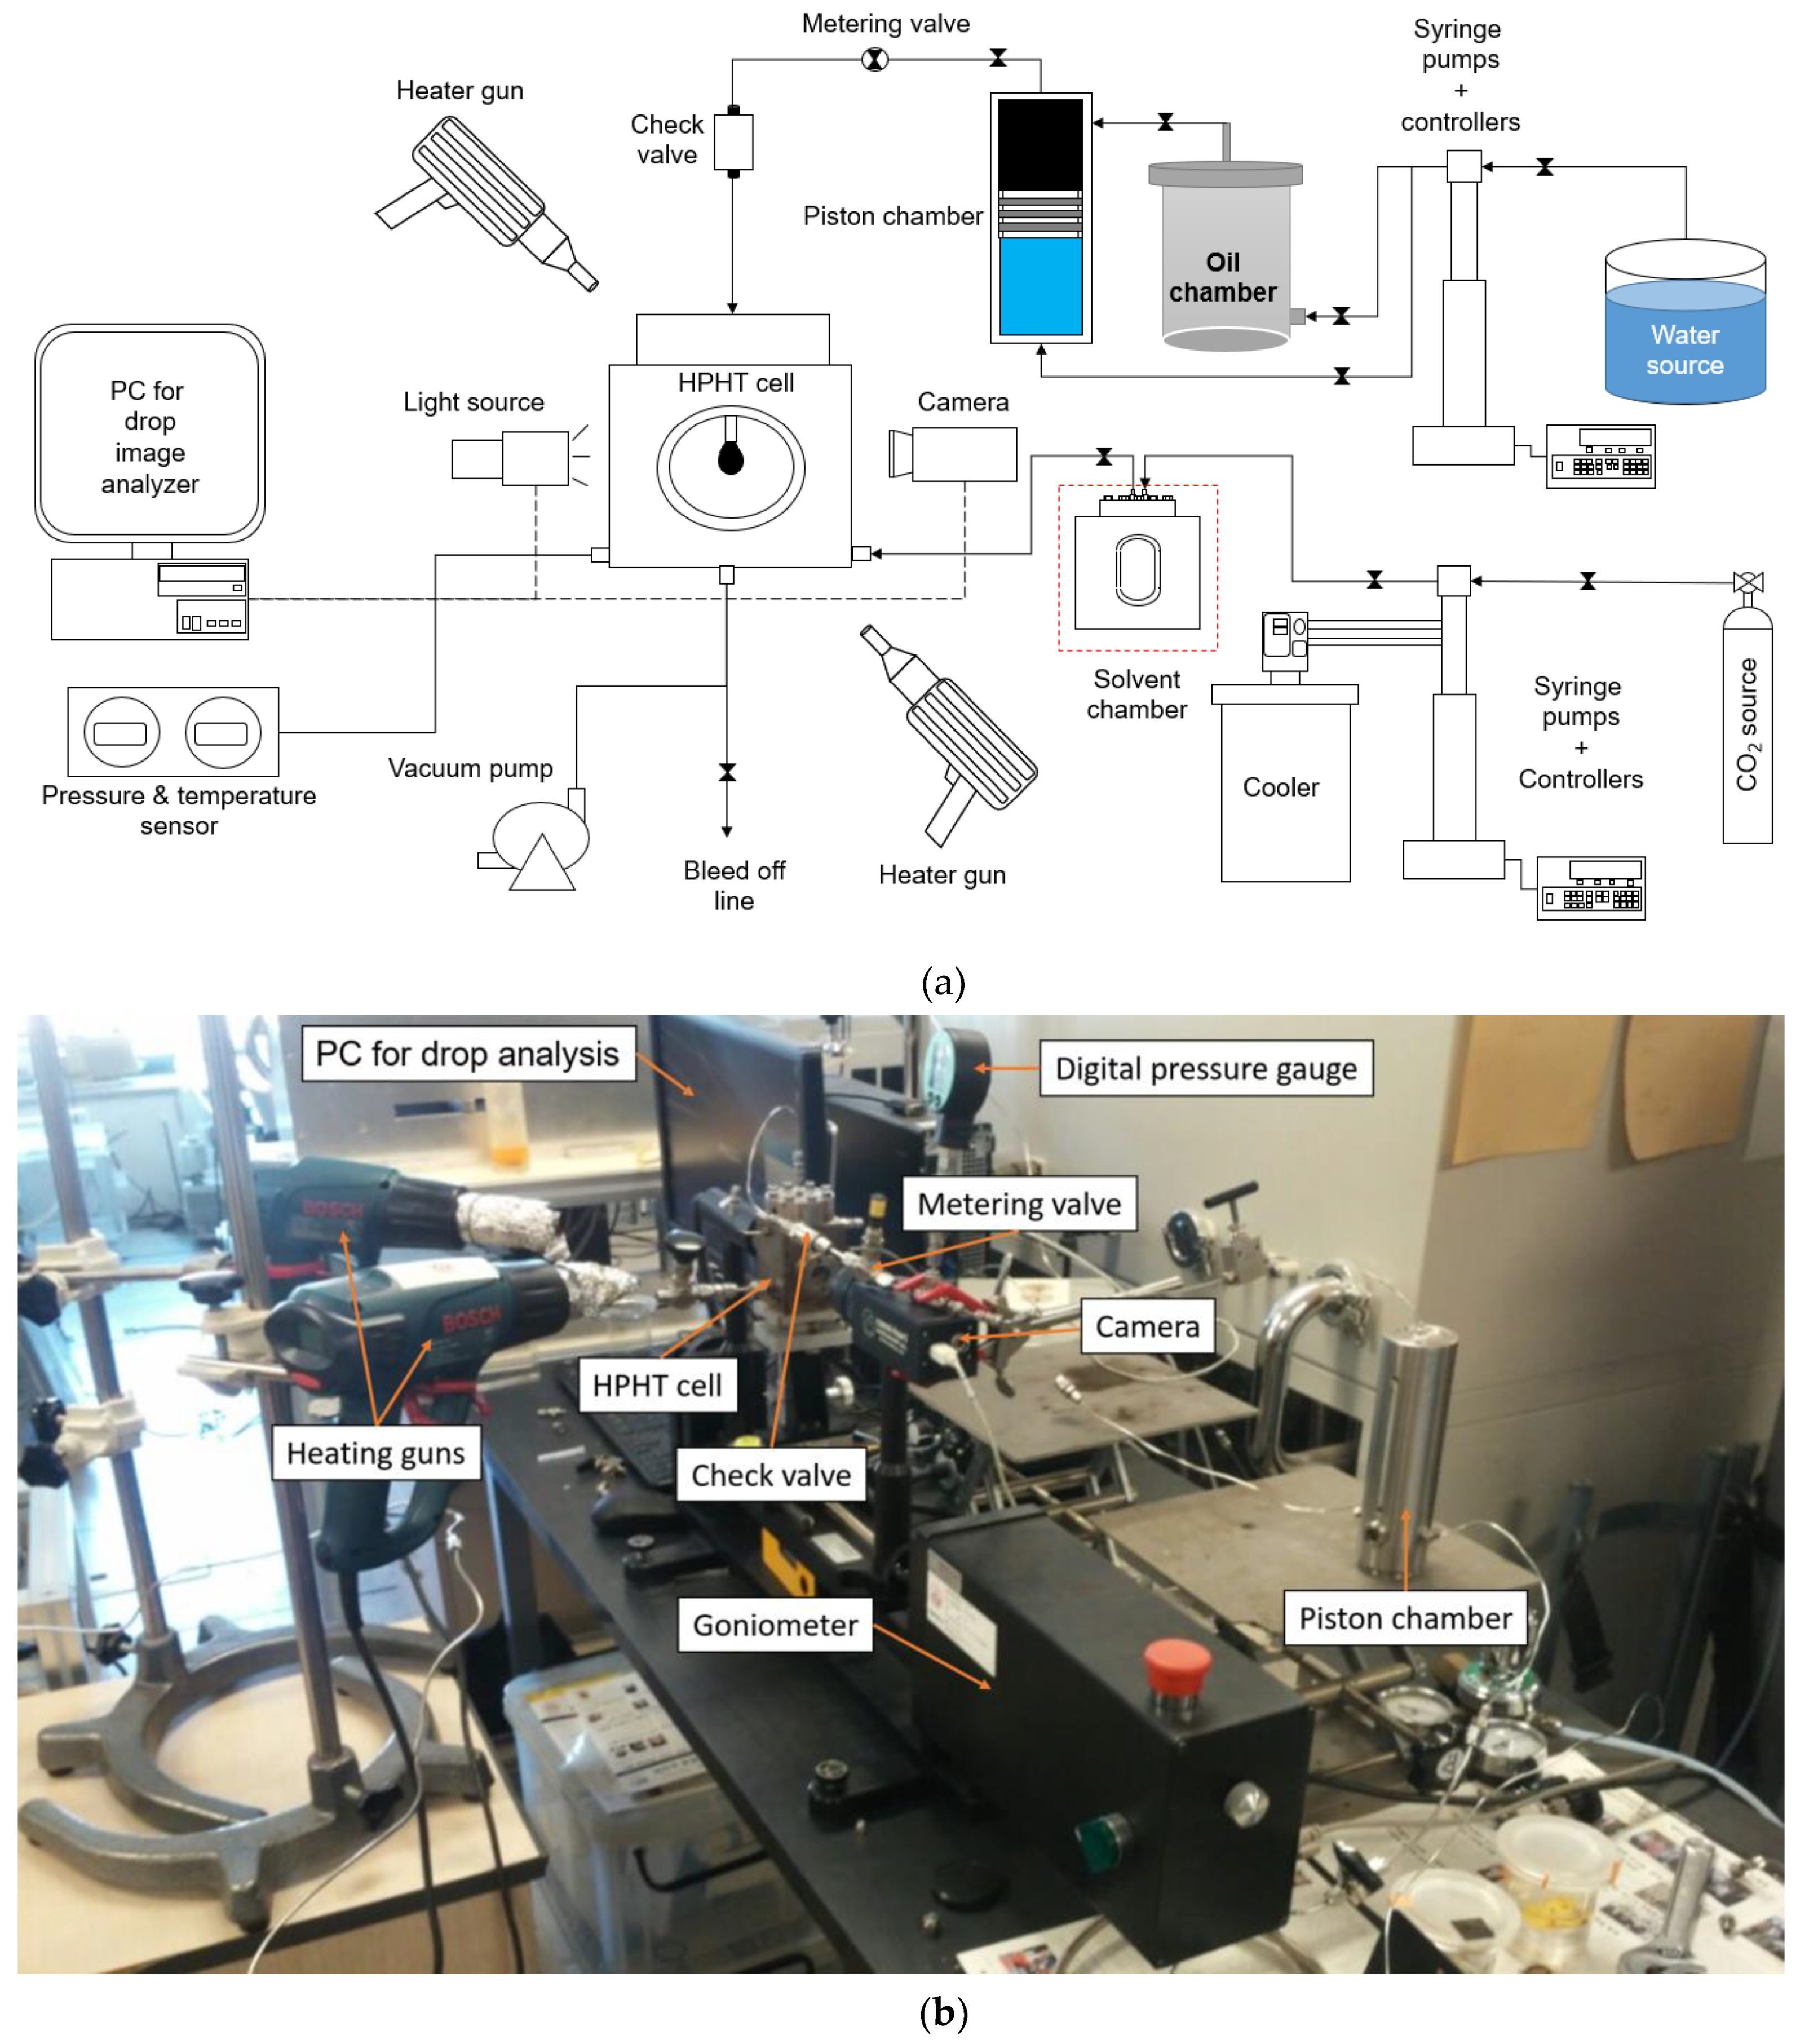
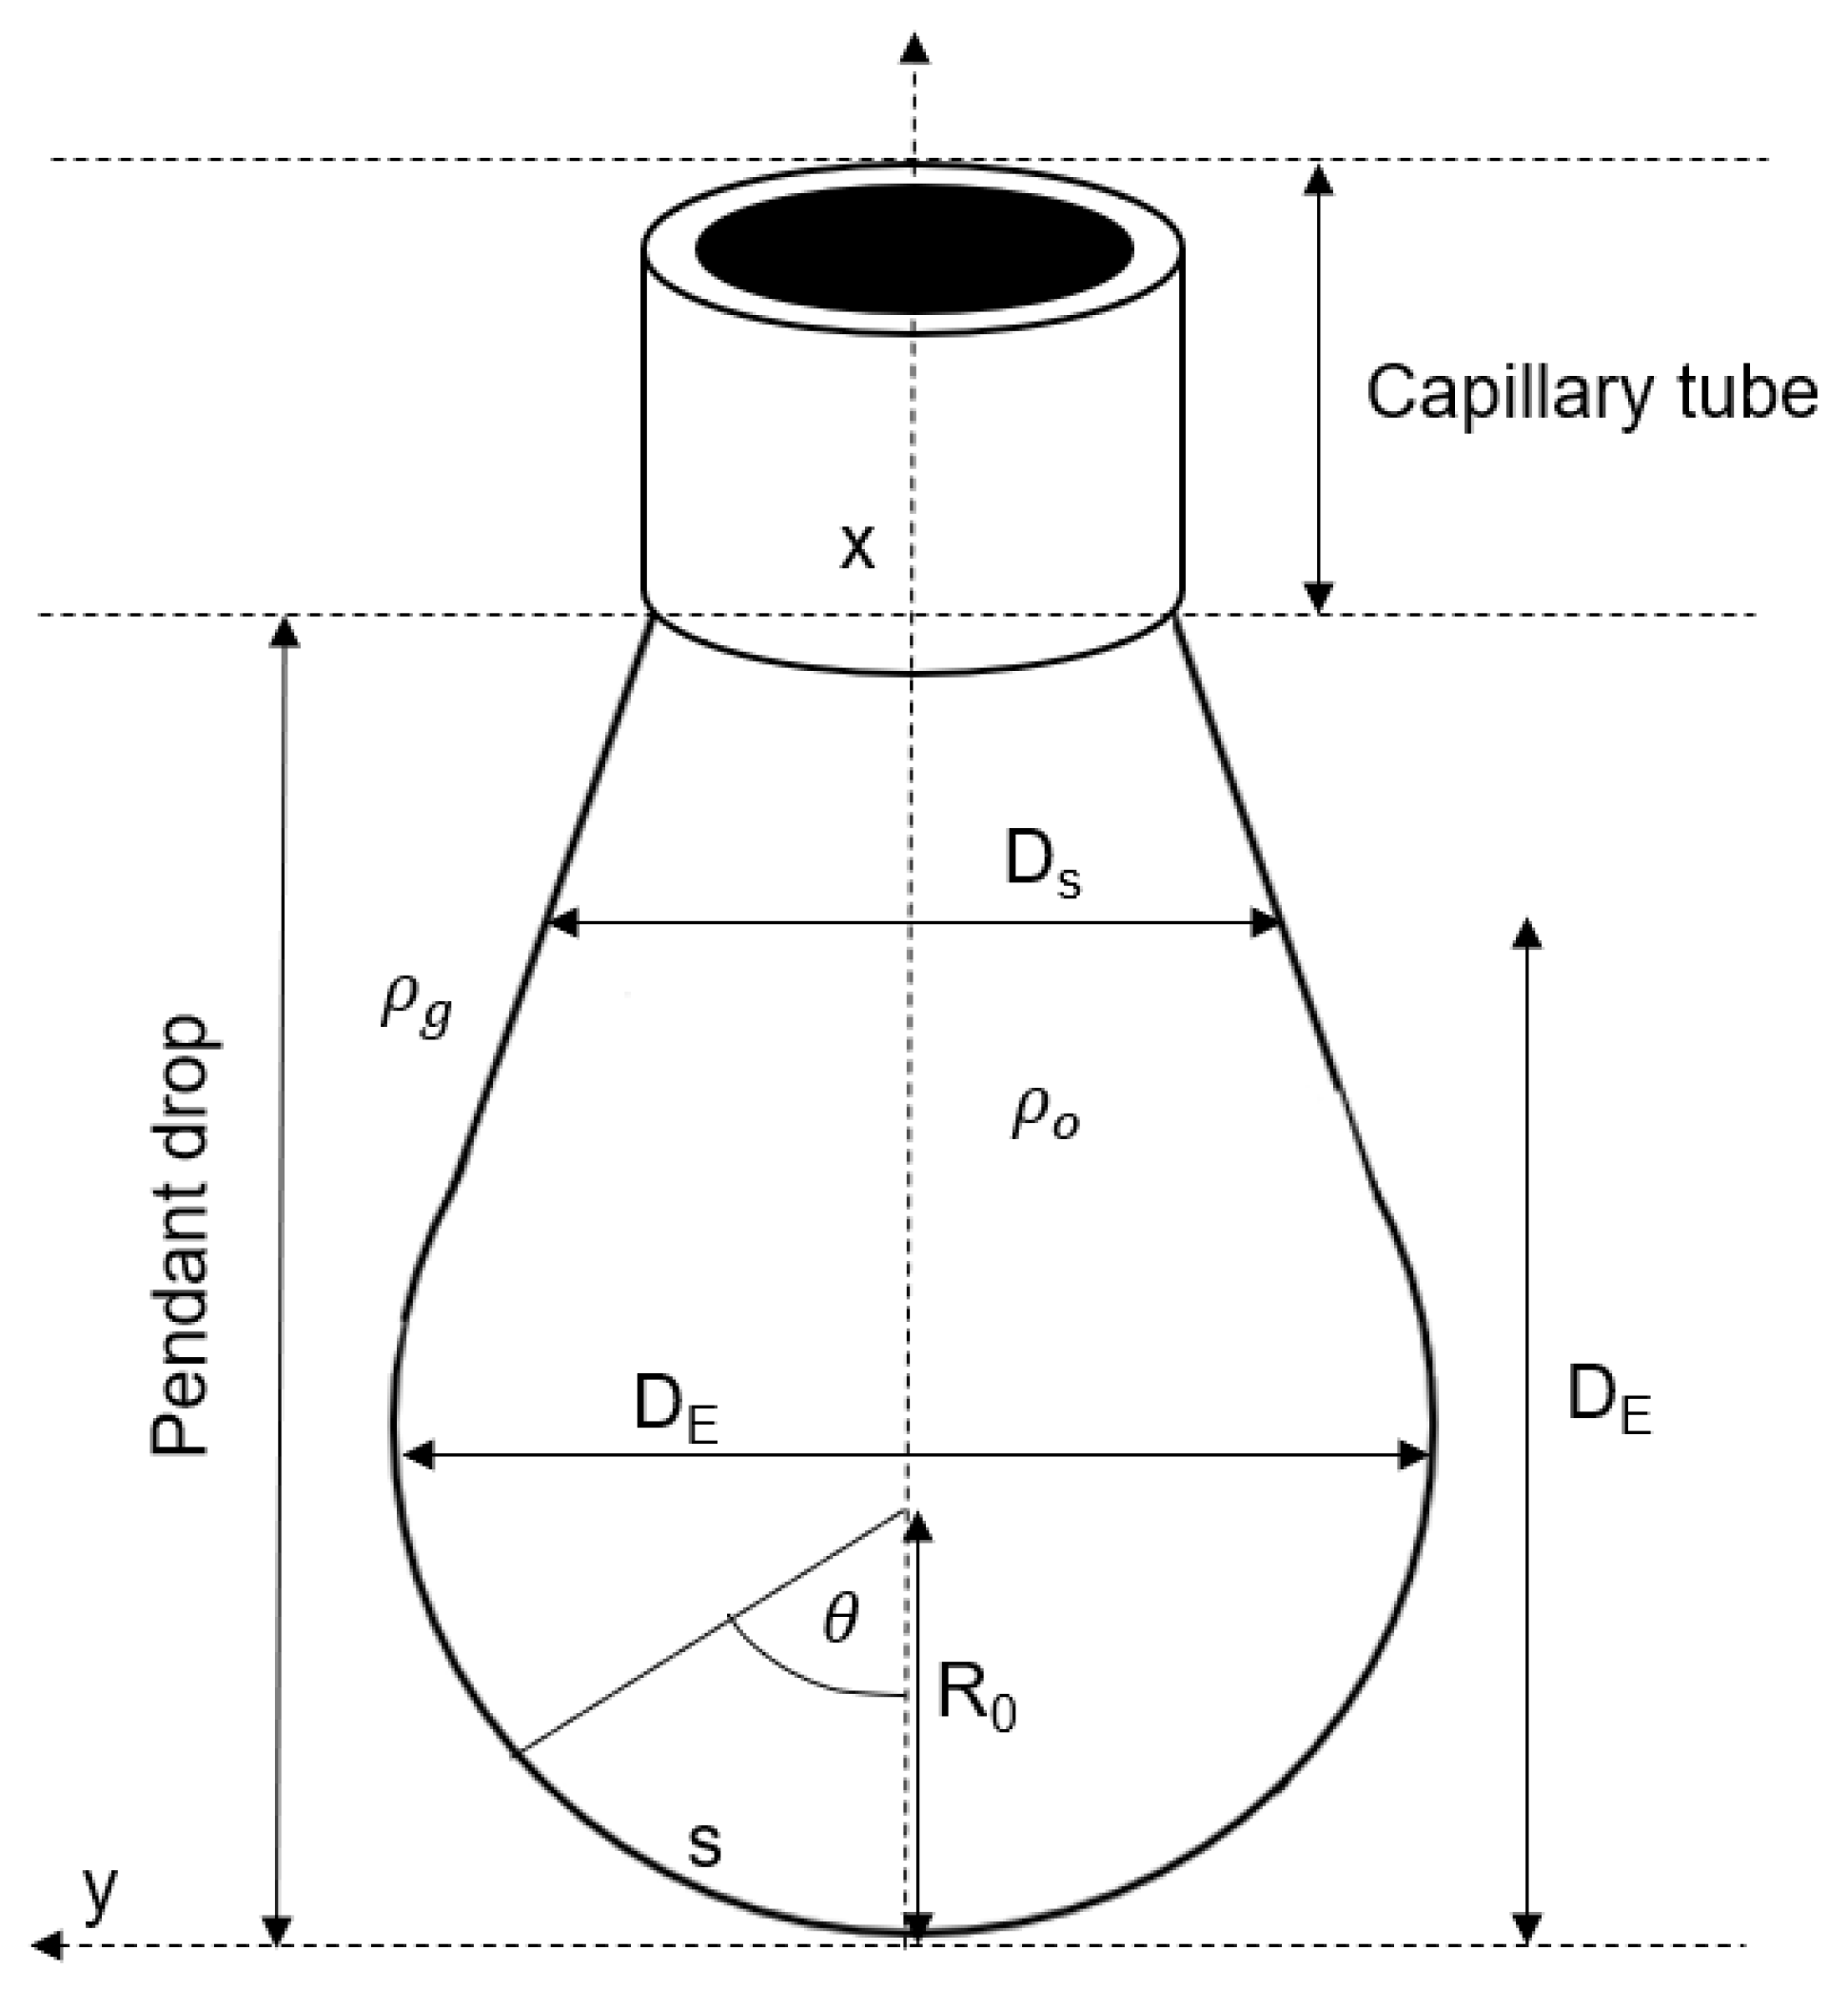
Two crude-oil samples were obtained from the oil reservoir, the Air Benakat formation, located at the South Sumatra basin, Indonesia (Figure 1; [18]). The era of Air Benakat formation, a part of the Palembang Group, is estimated to be in the middle and early Miocene and the lithology is composed of shale and sandstone from the shallow fluvio and deep marine sedimentation. The source rock was the shale sediment in the Eocene-Oligocene era, and the compressional local faults played the migration process. The mean porosity is about 25%, and the light oil, with approximately 40 0API (The American Petroleum Institute gravity), is produced with little gas appearance. The drive mechanism is a combination of solution gas and water drive.
Table 1 summarizes the compositions of crude oils sampled from the target reservoir, i.e., crude oil A and B. The densities are 812.8 kg/m3 for sample A, and 815.1 kg/m3 for sample B. Most compositions are similar, but the hexane in sample A is four times smaller than in sample B. There is less dissolved gas, so they can be classified as dead oils. Table 2 lists three eco-friend additives, i.e., methanol (CH4OH), ethanol (C2H5OH), and acetone (C3H6O). Their densities are similar at 25 °C and 1 bar. The experimental conditions range from 600 psi (lb/in2; = 41.4 bar) to 2000 psi (= 137.9 bar) and two temperatures (60 °C and 80 °C; degrees Celsius). Methanol and ethanol are in a liquid phase at low pressure (600 psi), but they turn to a compressible liquid phase at high pressure (2000 psi). Acetone maintains its phase as the compressible liquid at the aforementioned conditions.

2.2. VIT Experiment

Experimental methods have approximated the MMP value, e.g., slim-tube displacement, rising bubble apparatus, pressure-composition diagram, and VIT. The slim-tube test has been common to determine MMP since it is able to consider the CO2-oil interaction as well as the characteristics of pore structure. The slim-tube test plots oil recovery for each pressure value and estimates MMP from the sudden change in slope of increasing oil recovery with pressures. The strength is an accurate estimation of MMP, while the drawback is the requirement of longer testing time and more oil samples. To obtain one point for a given pressure and temperature, the slim-tube test needs around 200 cm3 of crude oil to saturate the slim tube and 1.2 pore volume of CO2 with a supercritical condition to displace oil from the tube. The experiment takes a lot of time for the oil saturation and CO2 injection process; these processes are repeated at each pressure; obtaining one point for the given pressure consumes 1 or 2 days. In short, the slim-tube test takes 1 to 2 weeks or one month to evaluate MMP because, to interpolate the points, at least 8 points are recorded.
In contrast, the VIT test consumes fewer samples and less experiment time, e.g., it needs 4 to 6 h to observe the oil drops to determine MMP, despite that its accuracy is less than with the slim-tube test. The VIT test observes any alteration of interfacial tension (IFT) in the isolated CO2-crude oil system with the designed pressures and temperatures. Figure 2 shows the schematic diagram of the VIT test apparatus (Figure 2a) and a real picture (Figure 2b). The VIT system consists of a goniometer (Ramé-hart Instrument co., New Jersey, USA) and HPHT cell uniquely designed for high pressures up to 3000 psi and high temperatures up to 300 °C. The goniometer has a light source and a camera for capturing oil-drop images. The DROPimage-advanced software (Ramé-hart Instrument co., New Jersey, USA) analyzes the digitalized image of oil drops and determines the CO2-oil IFT. The axisymmetric drop shape analysis (ASDA; [1,9,19,20,21]) estimates the IFT using the oil-drop shape captured by the camera at the given pressure and temperature.
The oil-drop image is captured under the isolated condition within the optical HPHT cell. Table 3 shows the components of the HPHT cell. The cell is made of a cubical stainless-steel material with a pair of 3-cm-diameter and 1-cm-thick sapphire glass windows on both sides of the cell, which allow medium-transmitting light to pass through from the light source to observe the oil-drop images. The stainless steel with 1.6-cm thickness surrounds the chamber (Table 3; Figure 3). Two Teledyne ISCO syringe pumps (Lincoln, NE, USA) are utilized for the VIT test: one is to pressurize the piston chamber containing the crude oil sample, i.e., a liquid pump, while the other is to inject CO2 into the HPHT cell. The latter pump has a cooling system to the temperature inside the pump chamber below 4 °C. Two heating guns (BOSCH, Gerlingen-Schillerhöhe, Germany) and four 50-watt heater cartridges are employed to control the cell temperature that the digital thermocouple measures, connected to the cell body. The vacuum pump removes air from inside the cell to measure the IFT under vacuum conditions.
ADSA measures the IFT of a pendant drop hanging at a capillary tube tip (Figure 4; Equation (1)).
γ = ρ g R 0 2 β
In Equation (1), γ means the IFT (dyne/cm). ρ is the difference between oil density ( ρ o ) and gas density ( ρ g ) (g/cm3). g is gravitational acceleration (980 cm/s2). β represents a form factor calculated from Equation (2), and R 0 denotes a curvature radius of drop apex defined in Equation (3).
{   β = 0.12836 0.7577 σ + 1.7713 σ 2 0.5426 σ 3         σ = D s D E = 0.09987 + 0.1971 β 0.0734 β 2 + 0.34708 β 3
R 0 = D E 2 σ
In Equations (2) and (3), D E denotes the maximum diameter of the pendant drop and D S is the diameter measured at the position D E from the drop apex. σ is the ratio of D S to D E .
All components of the experimental apparatus should be cleaned with toluene before conducting the VIT tests; the toluene removes the oil clog inside all lines; all equipment is allowed to dry for one day under room temperature. The pressurized air ensures that all the dried equipment is clean. All lines are filled with water or CO2, e.g., the lines connected to the water pump are filled with water. CO2-oil IFTs are measured while changing the CO2 injection pressures (600–2000 psi). Two temperatures (60 °C and 80 °C) are assigned since they are typical in the South Sumatra basin. The crude oil flows through the tubing lines equipped with the metering valves and the backpressure valves. After the oil-drop reaches the needle tip, the stable drop-shape is maintained for 40 to 60 s to obtain a consistent image [22]. The camera captures the image, and the DROPimage software determines the IFTs. The additives, i.e., two alcohols (methanol and ethanol) and a ketone (acetone), are placed in the solvent chamber in the middle of two pumps (the red-dashed bracket in Figure 2a). Before injecting CO2 into the HPHT cell, CO2 is mixed with the additive inside the solvent chamber. During the 3-h mixing process, the HPHT cell is isolated by closing the valve between the HPHT cell and the solvent chamber. After injecting the CO2-solvent mixture into the HPHT cell, the IFT is measured.

3. Results and Discussion

3.1. Effects of Temperature and Crude Oils on MMP

The MMPs were measured for two kinds of crude oils, i.e., crude oil A and B, and two temperature conditions, i.e., 60 and 80 °C, respectively. Figure 5 describes the oil-drop images observed at 60 °C while changing oil samples and CO2 injection pressures. Figure 6 depicts the IFTs at given CO2 injection pressures; six points were obtained for the injection pressures. The pressures with zero IFT, i.e., MMP values, were 1767 psi for the crude oil A and 1901 psi for the sample B at 60 °C. On the other hand, at 80 °C, they increased up to 2134 psi (sample A) and 2273 psi (sample B) (Figure 6). Figure 6 and Figure 7 prove that CO2-oil IFT tends to decrease more under low temperatures.
A notable result was found where MMP of crude oil A was less than B. The densities of two samples were similar but the difference was the C5+ component, i.e., 73.98 mol% for A but 86.84 mol% for B. This result can be inferred as the heavier the oil, the more likely it is to have higher MMP value. Another discussion is a trend towards decreasing the IFT. At a given temperature, the slopes towards zero tension were similar; −2.4 for A and −2.5 dyne/(cm·100 psi) for B at 60 °C while −1.9 for A and −2.0 dyne/(cm·100 psi) for B at 80 °C (see Figure 6). However, the trend of reducing the tension was gentle with higher temperature, in other word, its slope at the low temperature is more steep (Figure 7). The MMP value is smaller at the low temperature and therefore the design of miscible CO2 flooding is easy where the reservoir temperature is low, i.e., a shallow reservoir. As the result of oil samples and temperatures, it is easy to configure the miscible flow at shallow oil fields.

3.2. Mixture Design with Solvents to Reduce MMP

The MMP values were measured according to two different volumes, i.e., 5 and 15 cm3, three additives, i.e., methanol, ethanol, and acetone, under different temperatures and crude oils. Figure 8 depicts the oil-drop images in the mixture of CO2 and 15 cm3 acetone at 60 °C. Compared with pure CO2 (Figure 5), the oil-drop is small, which denotes the low IFT. Figure 9 depicts MMP observed at each condition. Table 4 and Table 5 summarize the results of the CO2-solvent mixtures. The small amount of additives (5 cm3 injection) negligibly influences the MMP reduction, while the larger volume (15 cm3) makes notable decrements regardless of temperatures and crude oils. Acetone shows the largest decrement in MMP with additive types (refer to the case of 15 cm3 injection under 60 °C and 80 °C). Briefly, 15 cm3 acetone reduces MMP by about 300 psi for crude oil A and by 400–455 psi for crude oil B. On the other hand, the performance of the other alcohols is not remarkable enough to emphasize.
This work discusses the possible reasons why the acetone influences the MMP decrement. Unlike the alcohol-type solvents, the ketone-type acetone and CO2 have high affinity molecular-structures that can mix each other, and, therefore, it is easy to form a homogeneous mixture. Acetone has been especially effective in dissolving protic solutes, e.g., carboxylic acid, because the carbonyl group acts as a hydrogen bond acceptor [23,24]. Acetone has the lowest cohesive energy density that is most close to that of CO2. According to the Hilderbrand solution theory, cohesive energy density or Hilderbrand solubility parameter is one of the most important properties that governs miscibility between chemical species. The less is the difference between the solubility parameters of binary components, the more miscible the mixture becomes. Hilderbrand solubility parameters of methanol, ethanol, and acetone are 29.6, 26.5, and 19.9 MPa1/2, respectively [23]. Acetone contains two methyl groups (CH3) located at each side. It was reported from the molecular orbital calculations based on the density functional theory that the carbonyl group of the acetone has specific interactions with CO2 [25]. The local polarity of the quadrupole moment in the linear CO2 structure enhances the solubility of slightly polar molecules in high pressure CO2. Acetone provides the increased affinity of the solution towards oil phase. By dissolving acetone in CO2, the solubility parameter of CO2 becomes closer to that of oil phase and the methyl groups of acetone (lipophilic moiety) increases the affinity towards oil phase [23,24,25]. On the other hand, methanol has the largest polarity among the additives so that its performance is poor, for they are non-symmetric protic solvents. Their mixtures (CO2-alcohol) cannot completely mix together and, therefore, CO2-alcohol tends to separate each other, i.e., CO2 (the lighter substance) can be accumulated at the upper side of the cell. A contacting point of CO2 and the alcohols is located at the bottom part; the lighter CO2 moves upward, bypassing the alcohols, and a few portions of the non-mixed alcohols move along with CO2. The alcohols might play the impurities and influence the increment of MMP.
This paper carries out VIT tests for two oil samples, two temperature conditions, and three additives, respectively. The limited number of case studies remain an estimation based on observations, not from quantitative analysis. It may be hasty to conclude that large amounts of acetone are always effective in reducing MMPs regardless of reservoir conditions, e.g., rock properties, oil compositions, salinities, and so on. The results show that the aprotic ketone solvent is effective in reducing MMP, but the optimal design of the CO2-acetone mixture is not proposed in these experiments, which is essential for CO2-injecting facilities. In addition, this study does not analyze the microscopic characteristics of the CO2-solvent-oil mixture. Some key factors related to the solublity should have been examined, e.g., Hilderbrand solubility parameters, cohesive pressure, and initial pressure, so as to confirm the chemical reactions of ketone solvents [23]. As future work, additional CO2 coreflooding tests are required to achieve field applicability. The microscopic investigation between the solvents and CO2 is challenging.
The experimental results are a milestone using ketone solvents, e.g., ether-based additives and methyl-ethyl ketone, for deriving MMP reduction through factor analyses and CO2-solvent mixing designs. This work observes that the ketone solvent reduces the IFT, as well as the MMP, in a CO2-oil system, and, therefore, the selection of a suitable solvent can improve the performances of CO2 flooding at shallow sandstone reservoirs with low reservoir pressures. In addition to the existing methodology in water-oil systems, the positive effects of ketone solvents are experimentally shown in CO2-oil system.

4. Conclusions

This paper presents the experimental analyses for the effects of solvents, temperatures, and oil types on MMP decrement. This study is aimed to contribute to the enlargement of solvent types from the typical alcohols to the ketones to reduce MMP; acetone (an aprotic ketone-type solvent of specific interaction with CO2 and low solubility parameter), compared with methanol and ethanol (the alcohols with hydroxy polar group), was effective to reduce MMP regardless of temperature and oil type. The larger the volume of acetone injected, the more MMP reduction was observed. The low temperature and the small amount of C5+ were favorable to accomplish the lower MMP, and, thus, miscible CO2 flooding would be easy to design for the shallow reservoirs with light oil. The results of the VIT test are applicable to the field-oriented design of miscible CO2 flooding where the reservoir pressure is lower than MMP.

Author Contributions

Conceptualization, A.N. and A.K.P.; methodology, A.N.; validation, W.B. and S.S.R.; investigation, C.P.; resources, A.N. and A.K.P.; data curation, A.N. and S.S.R.; writing—original draft preparation, A.N.; writing—review and editing, W.B. and C.P.; visualization, A.N.; supervision, W.B.; project administration, C.P. and W.B.; funding acquisition, C.P. All authors have read and agreed to the published version of the manuscript.

Funding

This study was supported by Basic Science Research Program through the National Research Foundation of Korea (NRF) funded by the Ministry of Education (2017R1D1A1B04033060), by the Korea Institute of Energy Technology Evaluation and Planning (KETEP), and the Ministry of Trade, Industry & Energy (MOTIE; Nos. 20172510102150; 20172510102160), Korea.

Acknowledgments

The authors wish to express appreciation to Wonsun Ryoo (Hongik University, Korea) who gave his time and knowledge in revising this paper.

Conflicts of Interest

The authors declare no conflict of interest.

References

  1. Ghorbani, M.; Momeni, A.; Gandomkar, A. Modified vanishing interfacial tension (VIT) test for CO2–oil minimum miscibility pressure (MMP) measurement. J. Nat. Gas Sci. Eng. 2014, 20, 92–98. [Google Scholar] [CrossRef]
  2. Hassan, A.; Elkatatny, S.; Abdulraheem, A. Intelligent prediction of minimum miscibility pressure (MMP) during CO2 flooding using artificial intelligence techniques. Sustainability 2019, 11, 7020. [Google Scholar] [CrossRef] [Green Version]
  3. Liu, J.; Sun, L.; Li, Z.; Wu, X. Experimental study on reducing CO2–oil minimum miscibility pressure with hydrocarbon agents. Energies 2019, 12, 1975. [Google Scholar] [CrossRef] [Green Version]
  4. Abdurrahman, M.; Permadi, A.K.; Bae, W.S.; Masduki, A. EOR in Indonesia: Past, present, and future. Int. J. Oil Gas Coal Technol. 2017, 16, 250–270. [Google Scholar] [CrossRef]
  5. Carbonbrief. Available online: https://www.carbonbrief.org/the-carbon-brief-profile-indonesia (accessed on 1 February 2020).
  6. Gozalpour, F.; Ren, S.R.; Tohidi, B. CO2 EOR and storage in oil reservoir. Oil Gas Sci. Technol. 2005, 60, 537–546. [Google Scholar] [CrossRef] [Green Version]
  7. Perera, M.S.A.; Gamage, R.P.; Rathnaweera, T.D.; Ranathunga, A.S.; Koay, A.; Choi, X. A review of CO2–enhanced oil recovery with a simulated sensitivity analysis. Energies 2016, 9, 481. [Google Scholar] [CrossRef]
  8. Handayani, K.; Krozer, Y.; Filatova, T. Trade–offs between electrification and climate change mitigation: An analysis of the Java–Bali power system in Indonesia. Appl. Energy 2017, 208, 1020–1037. [Google Scholar] [CrossRef]
  9. Bahadori, A. Fundamentals of Enhanced Oil and Gas Recovery from Conventional and Unconventional Reservoirs; Gulf Professional Publishing: Cambridge, MA, USA, 2018; ISBN 9780128130278. [Google Scholar] [CrossRef]
  10. Moradi, B.; Awang, M.; Bashir, A.; Sabil, K.M. Effects of alcohols on interfacial tension between carbon dioxide and crude oil at elevated pressures and temperature. J. Pet. Sci. Eng. 2014, 121, 103–109. [Google Scholar] [CrossRef]
  11. Rommerskirchen, R.; Nijssen, P.; Bilgili, H.; Sottmann, T. Reducing the miscibility pressure in gas injection oil recovery processes. In Proceedings of the SPE Abu Dhabi International Petroleum Exhibition and Conference, Abu Dhabi, UAE, 7–10 November 2016. [Google Scholar] [CrossRef]
  12. Choubineh, A.; Helalizadeh, A.; Wood, D.A. The impacts of gas impurities on the minimum miscibility pressure of injected CO2–rich gas–crude oil systems and enhanced oil recovery potential. Pet. Sci. 2019, 16, 117–126. [Google Scholar] [CrossRef] [Green Version]
  13. Yang, Z.; Wu, W.; Dong, Z.; Lin, M.; Zhang, S.; Zhang, J. Reducing the minimum miscibility pressure of CO2 and crude oil using alcohols. Colloid Surf. A 2019, 568, 105–112. [Google Scholar] [CrossRef]
  14. Jödecke, M.; Kamps, Á.P.; Maurer, G. Experimental investigation of the solubility of CO2 in (acetone + water). J. Chem. Eng. Data 2007, 52, 1003–1009. [Google Scholar] [CrossRef]
  15. Nowrouzi, I.; Mohammadi, A.H.; Manshad, A.K. Utilization of methanol and acetone as mutual solvents to reduce interfacial tension (IFT) in enhance oil recovery process by carbonated smart water injection. J. Mol. Liq. 2020, 304, 112733. [Google Scholar] [CrossRef]
  16. Suntana, A.S.; Vogt, K.A.; Turnblom, E.C.; Upadhye, R. Bio–methanol potential in Indonesia: Forest biomass as a source of bio–energy that reduces carbon emissions. Appl. Energy 2009, 86, S215–S221. [Google Scholar] [CrossRef]
  17. Khatiwada, D.; Silveira, S. Scenarios for bioethanol production in Indonesia: How can we meet mandatory blending targets? Energy 2017, 119, 351–361. [Google Scholar] [CrossRef]
  18. Doust, H.; Noble, R.A. Petroleum systems of Indonesia. Mar. Pet. Geol. 2008, 25, 103–129. [Google Scholar] [CrossRef]
  19. Yang, Z.; Liu, X.; Hua, Z.; Ling, Y.; Li, M.; Lin, M.; Dong, Z. Interfacial tension of CO2 and crude oils under high pressure and temperature. Colloid Surface A 2015, 482, 611–616. [Google Scholar] [CrossRef]
  20. Ahmad, W.; Vakili–Nezhaad, G.; Al–Bemani, A.S.; Al–Wahaibi, Y. Experimental determination of minimum miscibility pressure. Procedia Eng. 2016, 148, 1191–1198. [Google Scholar] [CrossRef] [Green Version]
  21. Naser, M.A.; Permadi, A.K.; Bae, W.S.; Al–Bemani, A.S.; Dang, S.T. A novel experimental method to generate steam within a small optical cell for measuring interfacial properties. Arab. J. Sci. Eng. 2015, 40, 2795–2804. [Google Scholar] [CrossRef]
  22. Hemmati–Sarapardeh, A.; Ayatollahi, S.; Ghazanfari, M.; Masihi, M. Experimental determination of interfacial tension and miscibility of the CO2–crude oil system; temperature, pressure, and composition effects. J. Chem. Eng. Data 2014, 59, 61–69. [Google Scholar] [CrossRef]
  23. Reichardl, C.; Welton, T. Solvents and Solvent Effects in Organic Chemistry, 4th ed.; Wiley–VCH Verlag GmbH & Co. KGaA: Weinheim, Germany, 2011; ISBN 9783527324736. [Google Scholar]
  24. Ciborowski, P.; Silberring, J. Proteomic Profiling and Analytical Chemistry, 2nd ed.; Elsevier: Amsterdam, The Netherlands, 2016; ISBN 9780444636881. [Google Scholar]
  25. Miller, M.B.; Chen, D.; Luebke, D.R.; Johnson, J.K.; Enick, R.M. Critical assessment of CO2 solubility in volatile solvents at 298.15 K. J. Chem. Eng. Data 2011, 56, 1565–1572. [Google Scholar] [CrossRef]
Figure 1. A target reservoir planned CO2 flooding at the South Sumatra basin, Indonesia.
Processes 08 00360 g001
Figure 2. Vanishing interfacial tension (VIT) test apparatus measuring the interfacial tension (IFT): (a) a schematic diagram of the VIT test system and (b) a photograph of the actual experiment equipment.
Processes 08 00360 g002
Figure 3. HPHT optical cell: (a) a schematic diagram with part details and (b) an actual equipment.
Processes 08 00360 g003
Figure 4. Variables to estimate the IFT with an oil-drop image.
Processes 08 00360 g004
Figure 5. Oil-drop images at CO2 injection pressures and crude oil samples at 60 °C.
Processes 08 00360 g005
Figure 6. IFT versus CO2 injection pressure for samples A and B at (a) 60 and (b) 80 °C without additives, i.e., pure CO2 and crude oils.
Processes 08 00360 g006
Figure 7. IFT versus CO2 injection pressure as different temperatures: (a) crude oil A and (b) crude oil B without additives, i.e., pure CO2 and the specific oil.
Processes 08 00360 g007
Figure 8. Oil-drop images of the mixture of CO2 and 15 cm3 acetone at 60 °C.
Processes 08 00360 g008
Figure 9. Effects of additive volumes and types on decreasing minimum miscibility pressure (MMP): (a) crude oil A and (b) crude oil B. The larger acetone volume results in more decrement of MMP values.
Processes 08 00360 g009
Table 1. Hydrocarbon composition of crude oil samples A and B.
ComponentCrude Oil ACrude Oil B
Mole%Weight%Mole%Weight%
Hydrogen sulfide0.000.000.000.00
Carbon dioxide0.090.030.380.10
Nitrogen0.010.000.470.08
Methane17.432.5411.281.14
Ethane2.500.680.160.03
Propane2.831.130.250.07
Iso-Butane1.200.630.180.07
n-Butane1.961.030.440.16
Iso-Pentane1.681.102.321.05
n-Pentane1.320.862.631.19
Hexanes2.722.1213.277.17
Heptane plus68.2689.8868.6288.94
Total100.00100.00100.00100.00
Table 2. Properties of solvents, i.e., two alcohols and one ketone, used in the experiments.
SolventsAlcoholsKetone
MethanolEthanolAcetone
Molecular weight (g/mol) 32.04246.06958.079
Boiling point (°C) 164.7078.2056.08
Density (liquid; kg/m3) 1786.3785.3784.5
Critical pressure (bar)82.262.546.9
Critical temperature (°C)240.2240.8235.0
Triple point pressure (bar)1.86 × 1064.3 × 1092.33 × 105
Triple point temperature (°C)−97.7−123.15−94.7
1 The values are given for liquid at 25 °C and 1 bar.
Table 3. Specifications of high pressure and high temperature (HPHT) cell.
Parameter, UnitValue
Cell inner diameter (cm)3.0
Cell height (cm)6.0
Wall thickness of cell (cm)1.6
Needle inner diameter (cm)approximately 0.9
Needle length (cm)5
Sapphire thickness (cm)1
Sapphire diameter (cm)3
Cell working pressure (psi)3000
Cell working temperature (°C) 300
Table 4. Summary of MMP for crude oil A with additive volumes and types.
Crude Oil AAdditive Volume: 5 cm3Additive Volume: 15 cm3
MMP
at 60 °C (psi)
MMP
at 80 °C (psi)
MMP
at 60 °C (psi)
MMP
at 80 °C (psi)
Pure CO21767213417672134
CO2 + Methanol16991997N/AN/A
CO2 + Ethanol1625194315781841
CO2 + Acetone1838210814611732
Table 5. Summary of MMP for crude oil B with the additive volumes and types.
Crude Oil BAdditive Volume: 5 cm3Additive Volume: 15 cm3
MMP
at 60 °C (psi)
MMP
at 80 °C (psi)
MMP
at 60 °C (psi)
MMP
at 80 °C (psi)
Pure CO21901227319012273
CO2 + Methanol1851220417372026
CO2 + Ethanol1861229717431922
CO2 + Acetone1879223215061818

