Article

Ultrasonic-Assisted Extraction (UAE) Process on Thymol Concentration from Plectranthus Amboinicus Leaves: Kinetic Modeling and Optimization

by
Nur Amirah Asifa Raisha Zahari
1,*,
Gun Hean Chong
2,
Luqman Chuah Abdullah
3,* and
Bee Lin Chua
4
1
Institute of Tropical Forestry and Forest Products, University Putra Malaysia, Serdang 43400, Selangor, Malaysia
2
Department of Food Technology, Faculty of Food Science and Technology, University Putra Malaysia, Selangor 43400, Serdang, Malaysia
3
Department of Chemical and Environmental Engineering, Faculty of Engineering, University Putra Malaysia, Serdang 43400, Selangor, Malaysia
4
School of Engineering, Taylor’s University, Lakeside Campus, No 1, Jalan Taylor’s, Subang Jaya, Selangor 47500, Malaysia
*
Authors to whom correspondence should be addressed.
Processes 2020, 8(3), 322; https://doi.org/10.3390/pr8030322
Submission received: 10 January 2020 / Revised: 31 January 2020 / Accepted: 2 February 2020 / Published: 9 March 2020

Abstract

:
Thymol shows potential medical values and it can be extracted from plants and herbs. In this study, ultrasonic-assisted extraction (UAE) was used to extract thymol from Plectranthus amboinicus leaves. From the extraction kinetics analysis of UAE on thymol, it was found that the highest concentration was collected at temperature of 25 °C with 5.51% of thymol concentration yield. An equilibrium-dependent solid–liquid extraction (EDSLE) model was found to be the best fitted model for thymol extraction using UAE. The parameters for optimization were the temperature of extraction (40 to 60 °C), extraction time (20 to 40 min), and the solid to solvent ratio (1:30 to 1:40 g/mL). The optimal UAE conditions were found at a temperature of 55 °C, 23 min of extraction, and a solid–solvent ratio of 1:35 g/mL. The changes in the structural surface of P. amboinicus after undergoing the UAE process were investigated using scanning electron microscopy (SEM). The possible mechanism of UAE was explained using the SEM images. These findings suggest that UAE is capable of breaking the structural surface of the leaves to extract compounds inside the leaves to the body of the solvent.

Graphical Abstract

1. Introduction

Herbal medicines are the oldest and still the most widely used system of medicine in the world today. Currently, plant-based medicines are the most used in various fields for maintaining good health [1]. In the scientific community, they are highly interested in essential oils found in natural products [2]. This grassy plant is also found throughout India, Ceylon, and Moluccas [3]. The aromatic leaves are used for food flavoring, and they are eaten as vegetables and as traditional folk remedies [4].
One of the important steps when studying medical plants is extraction. Currently, some modifications were done based on conventional methods in the processing of medicinal products, which are aimed at increasing yield at lower cost [3]. Ultrasonic-assisted extraction (UAE) is one of the modifications, where the extraction process is assisted with the usage of ultrasound waves. Two major factors that increase the efficiency of using ultrasound waves are cell disruption and the effective mass transfer [5]. UAE was shown to be a viable alternative to the conventional extraction procedure for the higher extraction yield of thymol as compared to conventional methods [6]. UAE is also able to shorten the duration of extraction to achieve the optimum extraction efficiency [7].
Thymol is the compound of interest in this research. Thymol shows anti-inflammatory, immunomodulatory, antioxidant, antibacterial, and antifungal properties [8,9,10,11]. Thymol found in the herb is used in mouthwashes since it contains antiseptic. Thymol is also used for various bacterial infections [12]. Research was done on essential oils of the extract from P. amboinicus leaves, and the qualitative results were analyzed using gas chromatography (GC) and GC–mass spectroscopy (GC–MS). The major chemical compound found is thymol [13]. Therefore, UAE process parameters need to be optimized in order to increase the production of thymol. Thus, response surface methodology (RSM) is one of the most efficient techniques used to optimize the impact of the parameters on their response. The advantages of RSM include lowering the number of experiments and allowing interpretation of the interactive impacts of parameters using two-dimensional (2D) contour and three-dimensional (3D) surface plots [14].
In this study, the extraction kinetics of thymol extract was studied using UAE. UAE parameters, such as extraction temperature, extraction time, and solvent-to-solid ratio, were optimized using respond surface methodology (RSM) by employing the central composite design (CCD) to maximize the extraction of thymol from P. amboinicus leaves. Leaf surface morphological and roughness analyses were conducted, and a potential extraction mechanism of thymol using UAE was proposed.

2. Materials and Methods

2.1. Sample preparation

The drying process of the leaves was carried out using z tray drier (SOLTEQ, model: BP 772, Selangor, Malaysia) at 55 °C for 18 h. The drying process was considered completed when the weight of the leaves after the drying process reached constant weight. These leaves were then ground into powder form and kept in an air-tight container and stored in a cool and dark place.

2.2. Ultrasonic-Assisted Extraction

Ultrasonic-assisted extraction was applied in this study. The solvent for the extraction process was ethanol. A sonicator (Sonics, 130 W, 20 kHz, Church Hill Road, Newtown, Australia) was used to generate the ultrasound effect. The temperature was controlled using a water bath placed below the extraction set-up, as shown in Figure 1. The ultrasonic probe was immersed directly into the solvent containing the sample. The ultrasonic device could induce a cavitation with a bubble implosion effect to help in the extraction process. Two experiments were conducted using UAE: extraction kinetic studies and optimization of the extraction process.

2.3. Extraction Kinetics Studies

The extraction process was carried out with controlled solute-to-solvent ratio of 1:30 (g/mL) [15]. The extraction experiments of P. amboinicus leaves were carried out at temperatures of 25, 40 and 60 °C for 40 min. In the first 20 min, the extract was sampled every 5 min, followed by every 10 min for the remaining duration until 40 min. The extracts were collected for further determination using gas chromatography for thymol concentration analysis.

2.4. Extraction Kinetic Models

Several mathematical models were applied in this study to model the kinetics of thymol extraction, namely, the pseudo-first-order model, Peleg’s model, power law model, and equilibrium-dependent solid–liquid extraction (EDSLE) model.

2.4.1. Pseudo-First-Order Model

This model was developed by Veljkovic and Milenovic (2002) [16], and the extraction kinetics were divided into two steps: extraction of bioactive compounds on or near the surface of the samples (washing process) and extraction of the compounds located inside the cells (slow diffusion). Equation (1) describes the mathematical model.
y = y 1 [ 1 f exp ( K 1 t ) ( 1 f ) exp ( K 2 t ) ] ,
where y and y1 are the extract yield and the extract yield at saturation, respectively, f is the extract fraction washed from broken cells on the particle surface, t is the extraction time, and K1 and K2 are the rate constants for washing and diffusion, respectively. The fraction of extract dissolved by washing is assumed as constant. The model also assumes that the washing step is faster than the diffusion step, i.e., K1 is greater than K2. The values of k are functions of the Arrhenius equation in Equation (2).
k = A exp ( E a R T ) ,
where k is a constant, A is a pre-exponential factor, Ea is the activation energy, R is the gas constant, and T is the temperature. This model was derived by Sovova (1994) [17] to extract bioactive compounds from essential oils. Since the washing process is much faster than diffusion (K1 > K2), Equation (2) can be reduced to a simpler model where the instantaneous washing is followed by diffusion.
y = y 1 [ 1 ( 1 f ( exp ) ( K 2 t ) ] .
Considering that the washing process does take place (f = 0), the extraction yield increases exponentially due to diffusion, as shown in Equation (4), i.e., the pseudo-first-order model [18].
y = y 1 [ 1 exp ( K 2 t ) ] .

2.4.2. Peleg Model

The model developed by Peleg (1988) [19] for the description of sorption curves was used to describe the solid–liquid extraction process (Equation (5)).
C ( t ) = C 0 + t K 1 + K 2 ( t ) ,
where C(t) represents the concentration extraction yield at time t, K1 is Peleg’s rate constant (extraction rate at the very beginning of the extraction process), K2 is Peleg’s capacity constant (maximum extraction yield during the extraction process), and C0 is the concentration of extraction yield at time t = 0. At t = 0, C0 is equal to zero; thus, Equation (5) can be reduced to Equation (6) [20].
C ( t ) = t K 1 + K 2 ( t ) .

2.4.3. Power Model

The power law model is another effective empirical equation for solid–liquid extraction. The power law model can be expressed as follows:
C t = K t n ,
where n is the diffusional exponent, and K is a constant of the model. In the literature, n is less than 1 when extracting from vegetal material [21].

2.4.4. Equilibrium-Dependent Solid–Liquid Extraction (EDSLE) Model

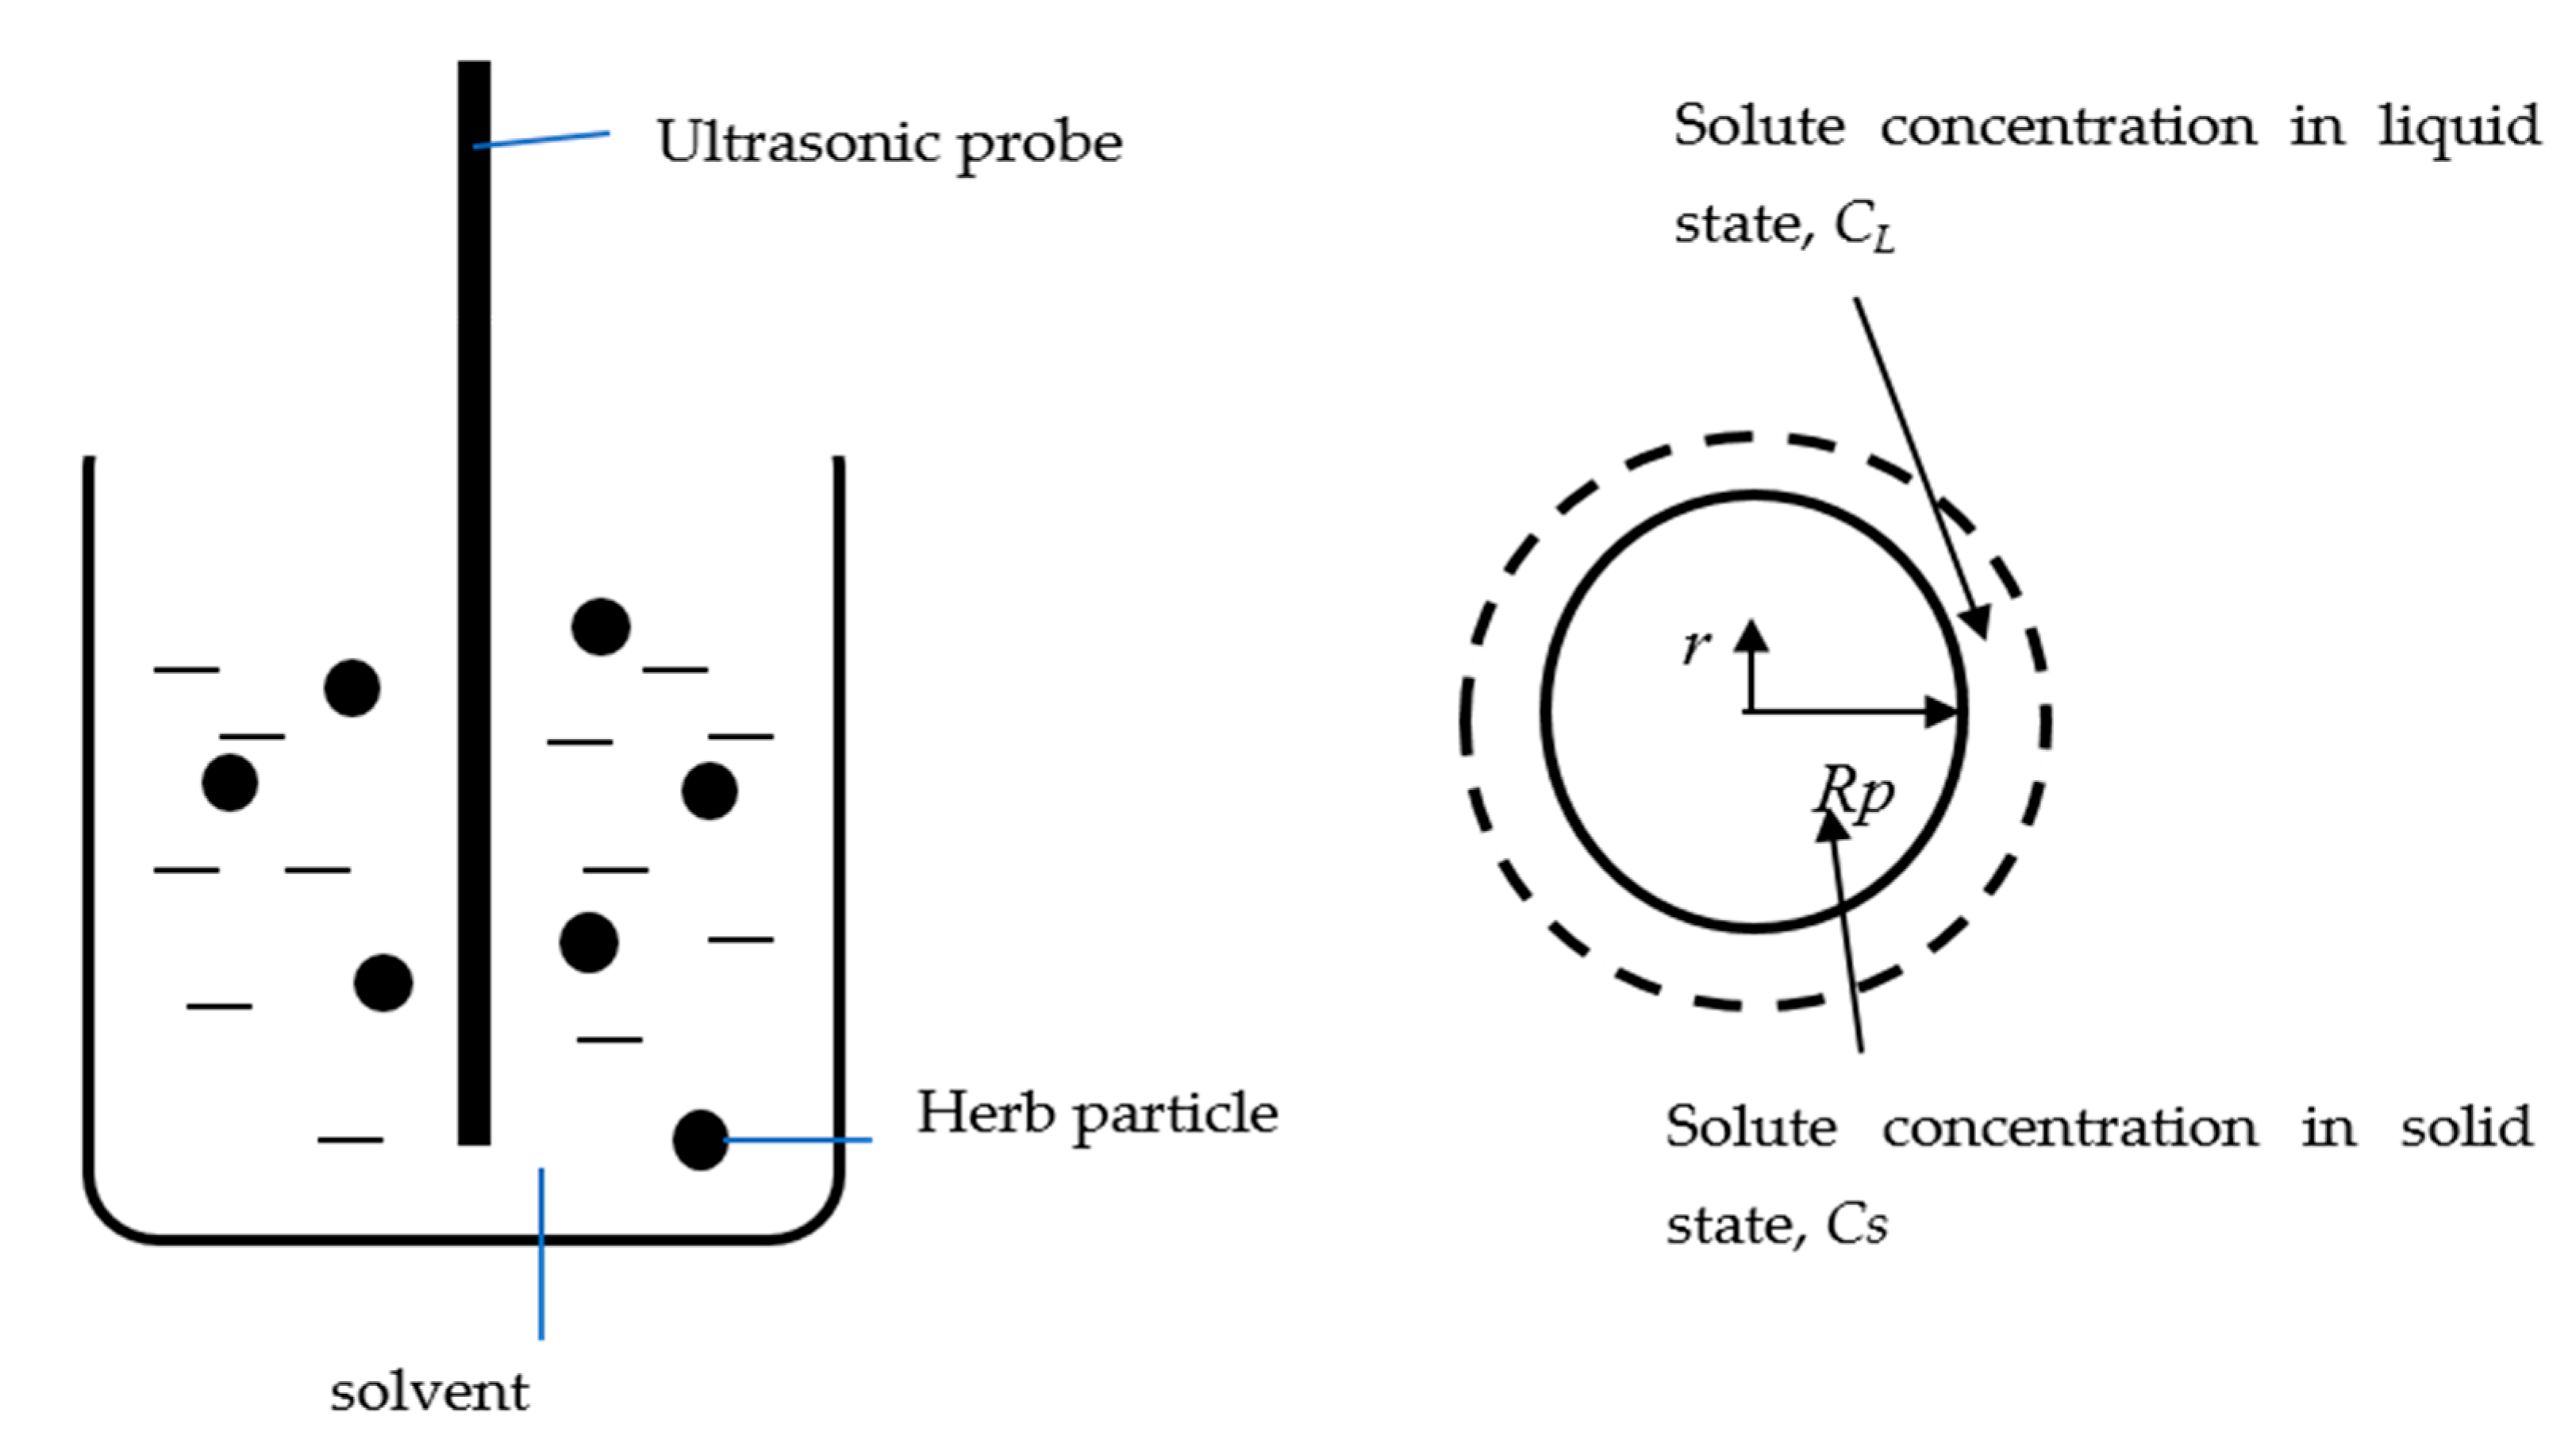
This model was reported by Pin et al. (2009) [22] for the extraction of P. betle leaves. Figure 2 shows the extraction process during which solid particles are suspended in the solvent. The system uses a probe to transfer ultrasound waves. The representation of a solid particle with a radius of Rp is also shown in Figure 2. The solute concentration in the liquid phase is denoted as CL, while the solute concentration in the solid phase is given as CS. The position from the center of the solid is expressed as r.
The equilibrium-dependent model was developed based on the mass transfer between the solid and the liquid phase of the solute. The mass transfer is assumed to be driven by the gradient of the liquid phase concentration of the solute and the concentration of the equilibrium solute. The equilibrium of the process depends on the temperature of extraction and the solvent-to-solid ratio. The internal diffusion within the solid is neglected in this model. Other assumptions of this model include the following:
  • The liquid phase is initially free of solute.
  • The solute concentration within the solid is uniform throughout the process.
  • The liquid phase is well mixed.
  • The system is at a constant temperature.
The mass balance of the solute within the system is calculated as the total solute in the solvent = total solute transfer from the solids.
V L d C L d t = A K [ C e C L ( t ) ] ,
where VL is the volume of solvent (cm3), CL is the solute concentration in liquid phase at time, t (g∙cm−3), Ce is the equilibrium solute concentration in liquid phase, A is the total surface area of the solids (cm2), and K is the mass transfer coefficient (cm∙s−1).
Rearranging Equation (8) yields
1 C e C L ( t ) d C L = A K V L d t .
With initial conditions of t = 0, CL = 0, Equation (9) can be integrated from t = 0 to t = t.
0 t 1 C e C L ( t ) d C L = 0 t A K V L d t .
[ ln ( C e C L ( t ) ) ln C e ] = A K V L t .
C L ( t ) = C e [ 1 e A K V L t ] .
The total surface area of the particles is given by
A = M σ ,
where M is the weight of total solid particles (g), and σ is the specific surface area of the solid (cm2g−1).
The ratio of solvent to solid, Rss, is calculated as follows:
R s s = M V L .
Substituting Equations (12) and (13) into Equation (14) yields
C L ( t ) = C e [ 1 e σ R s s K t ] .

2.4.5. Solution of Mathematical Models

An R2 value close to unity denotes a better fit between experimental results and predicted data. EDSLE, Peleg, pseudo-first-order, and power models were solved using SOLVER in Microsoft Excel 2010. An R2 close to unity was the criterion selected for determining the relationship between the experimental data and the models. This criterion was calculated as follows:
R 2 = 1 [ n = 1 N ( C L , exp , n C L , p r e , n ) 2 n = 1 N ( C L , exp , n C L , exp ¯ ) 2 ] .

2.5. Gas Chromatography (GC)

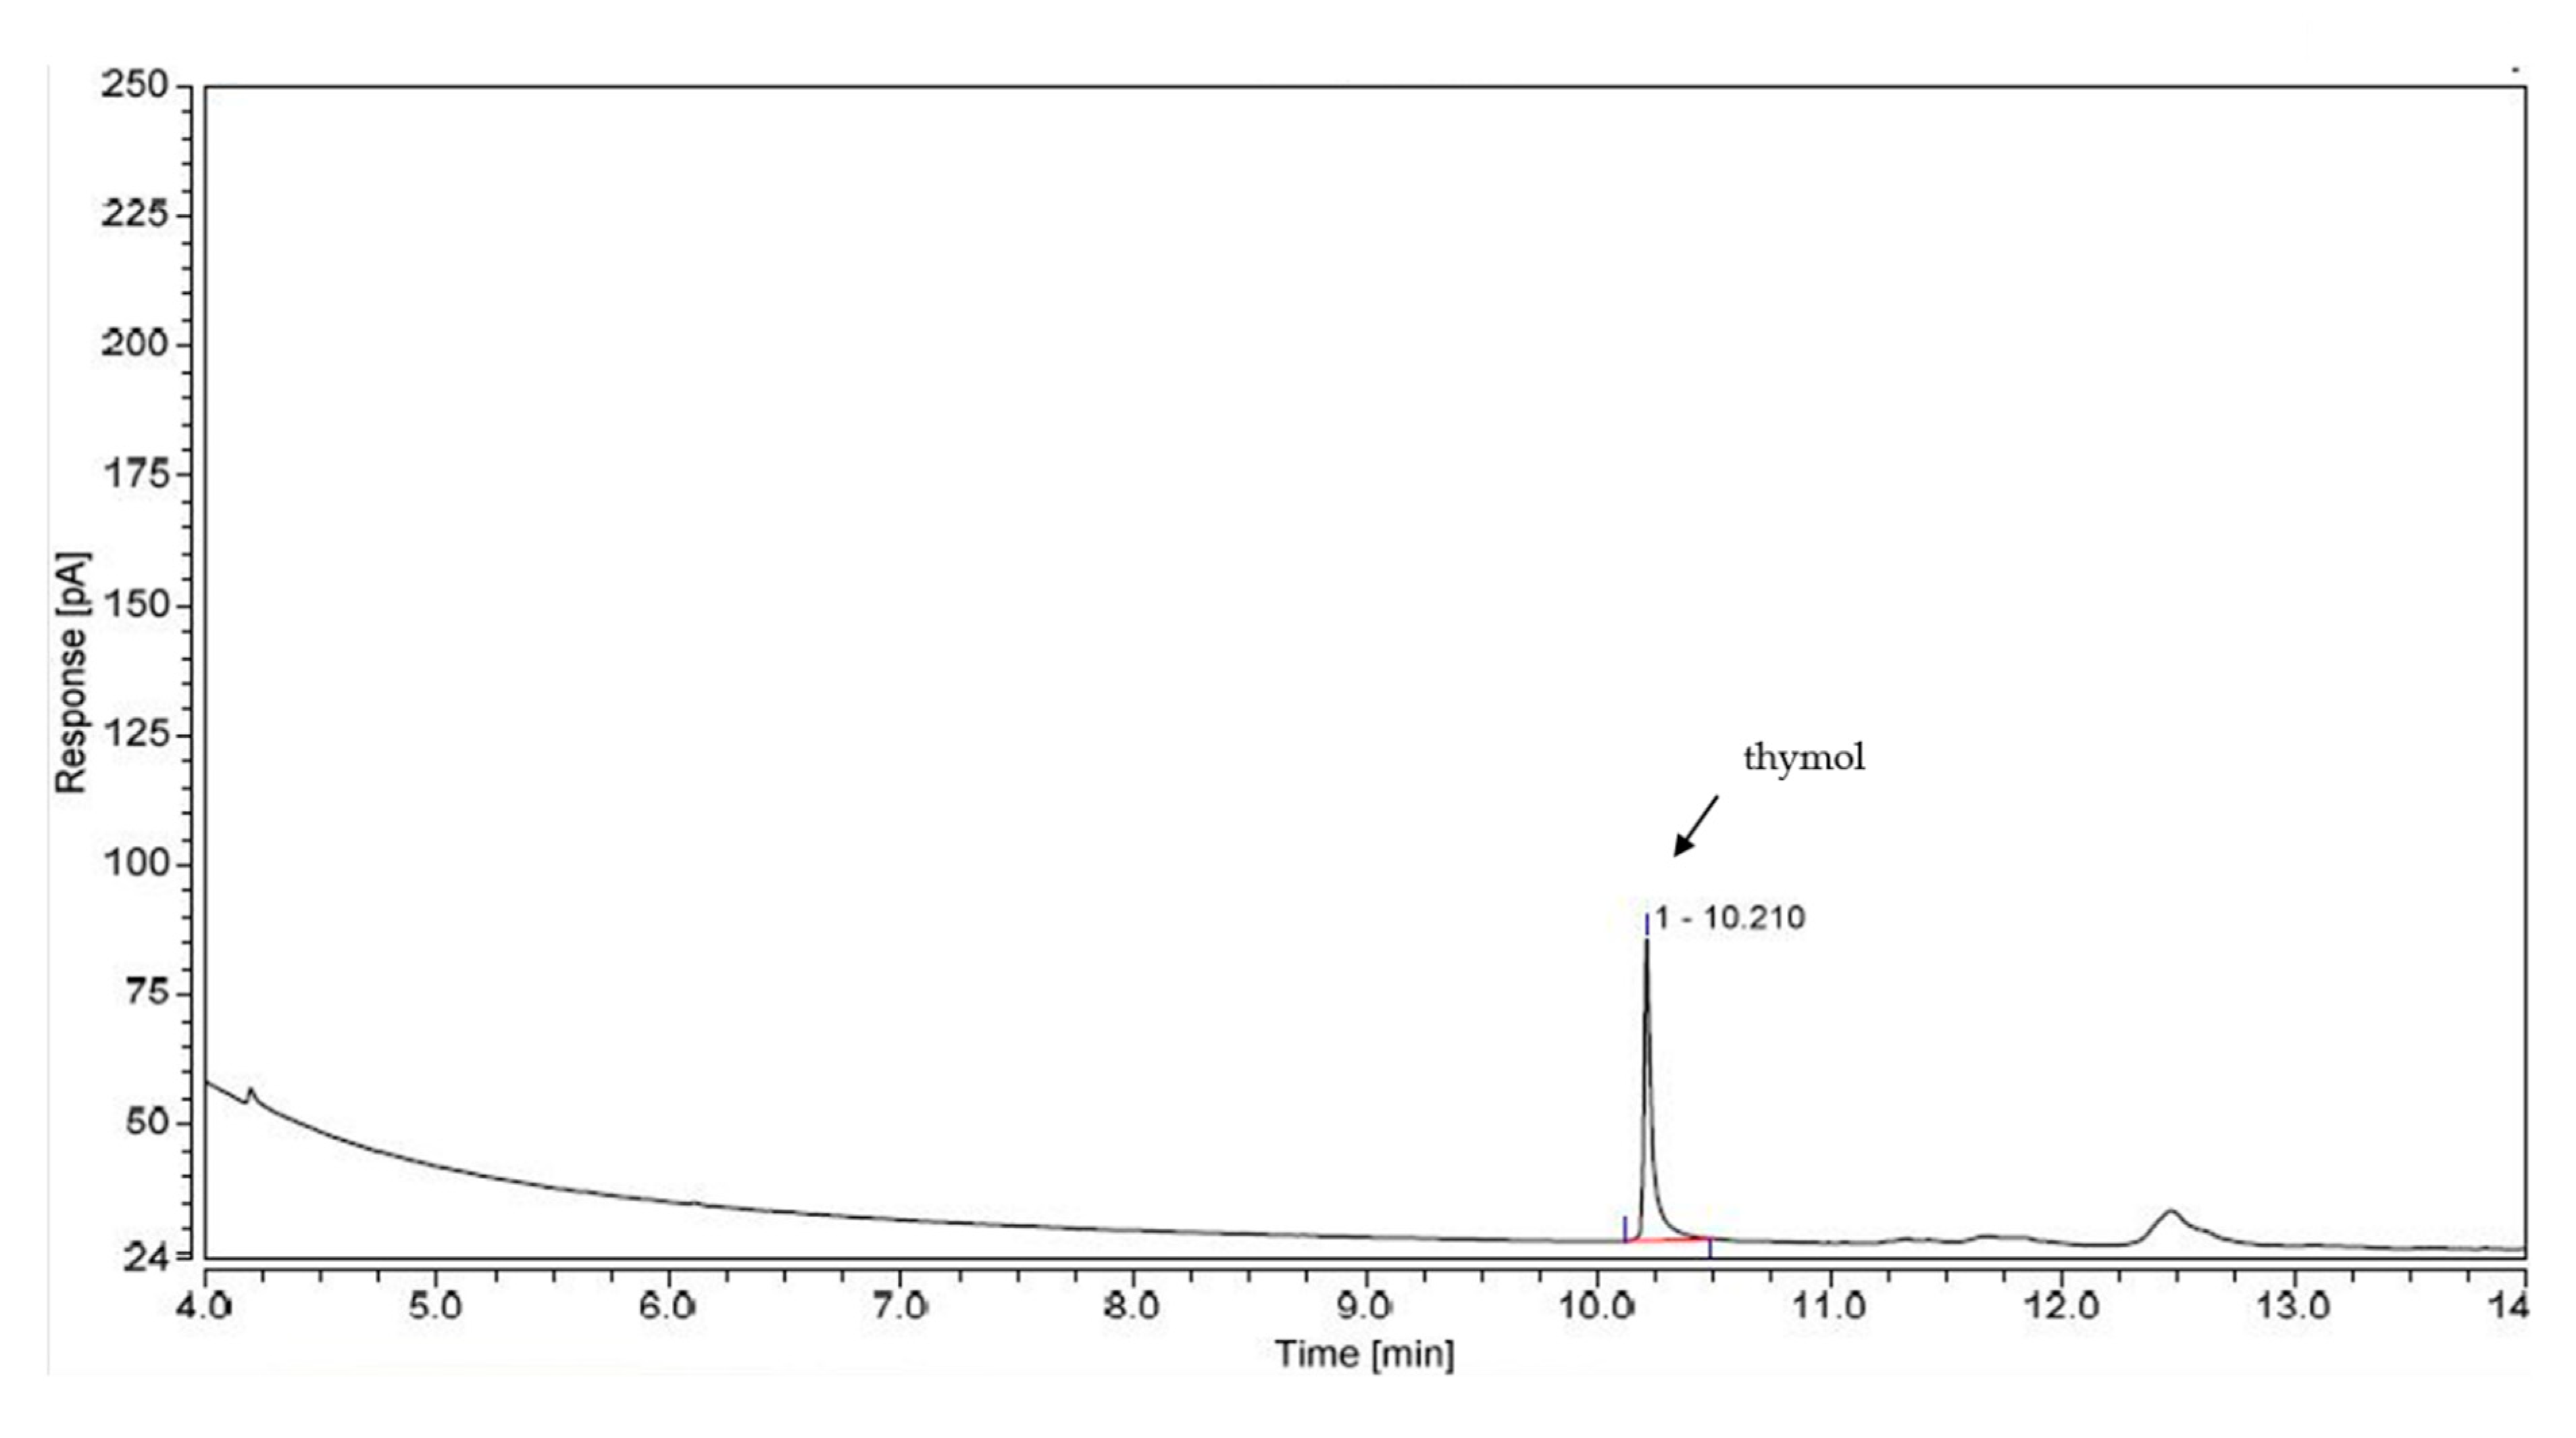
The quantitative analysis of thymol extract from the P. amboinicus was performed using gas chromatography (Trace 1300, Thermo Scientific, Third Avenue Waltham, MA, USA), and analysis was carried out on Zebron phase ZB.5 (3 m × 0.25 mm × 0.25 μm of cross-linked phenyl-methyl siloxane, Madrid, VA, USA) equipped with a flame ionization detector (FID). The initial column temperature was programmed at 60 °C. It was raised at a rate of 10 °C/min to 180 °C for 12 min. The injector and detector temperatures were programmed at 260 and 280 °C, respectively. Nitrogen was used as the carrier gas with a flow rate of 2 mL/min. The samples were injected into GC in split mode with a split ratio of 1:50 [15]. The percentage composition of the thymol extract was computed by the normalization from the GC peak area. Figure 3 shows the GC analysis result for thymol.

2.6. Optimization of Concentration of Thymol from Extraction of P. amboinicus

Respond surface methodology was used to optimize the process parameter of P. amboinicus extraction using UAE. Central composite design (CCD) was selected to fit the model using the least squares technique. Analysis of variance (ANOVA), residual plots, and contour plots were used to determine the optimum. The study was designed using Design Expert version 7.1.5 (Stat-Ease, Minneapolis, MN, USA). Three parameters (temperature, extraction time, and volume of solvent) were studied, and the response was the concentration of thymol.
The independent variables were temperature (A), volume of solvent (B), and extraction time (C), and concentration of thymol was the dependent variable. The independent variables were transformed to ranges between −1 and +1 for the appraisals of factors. Table 1 shows the level of variable in the RSM design.
The 20 experiments were performed and randomized as listed in Table 2. To determine the possible interaction of process variables and their effect on the yield and concentration of thymol, an analysis of variance (ANOVA) was carried out. The significance level was stated at 95%, with a p-value of 0.05. The adequacy of the CCD for ultrasound-assisted extraction for the thymol concentration polynomial model to predict the experiment was determined with correlation coefficient, R2. Experimental data were fitted to the second-order polynomial model, and the regression coefficient model was obtained. The generalized second-order polynomial proposed for the response surface analysis was as follows:
Y = β 0 + t = 1 3 β i Χ i + i 3 β i i Χ i 2 + i 1 2 j = i + 1 3 β i j Χ i Χ j ,
where β0, βi, βii, and βij are regression coefficients for the intercept, linear, quadratic, and interaction terms, respectively. Xi and Xj are coded values for the independent variable [28].

2.7. Leaf Surface Structure: Morphological and Roughness Analysis

Scanning electron microscopy (SEM) (Hitachi, Model S3400N, Iowa City, Japan) was used to analyze the surface structure of the leaves after extraction. The images of the leaf structure were then analyzed using Image J 1.50b (Scion Corporation, Maryland, MD, USA).

3. Results and Discussion

3.1. Kinetic Study of Thymol Extraction

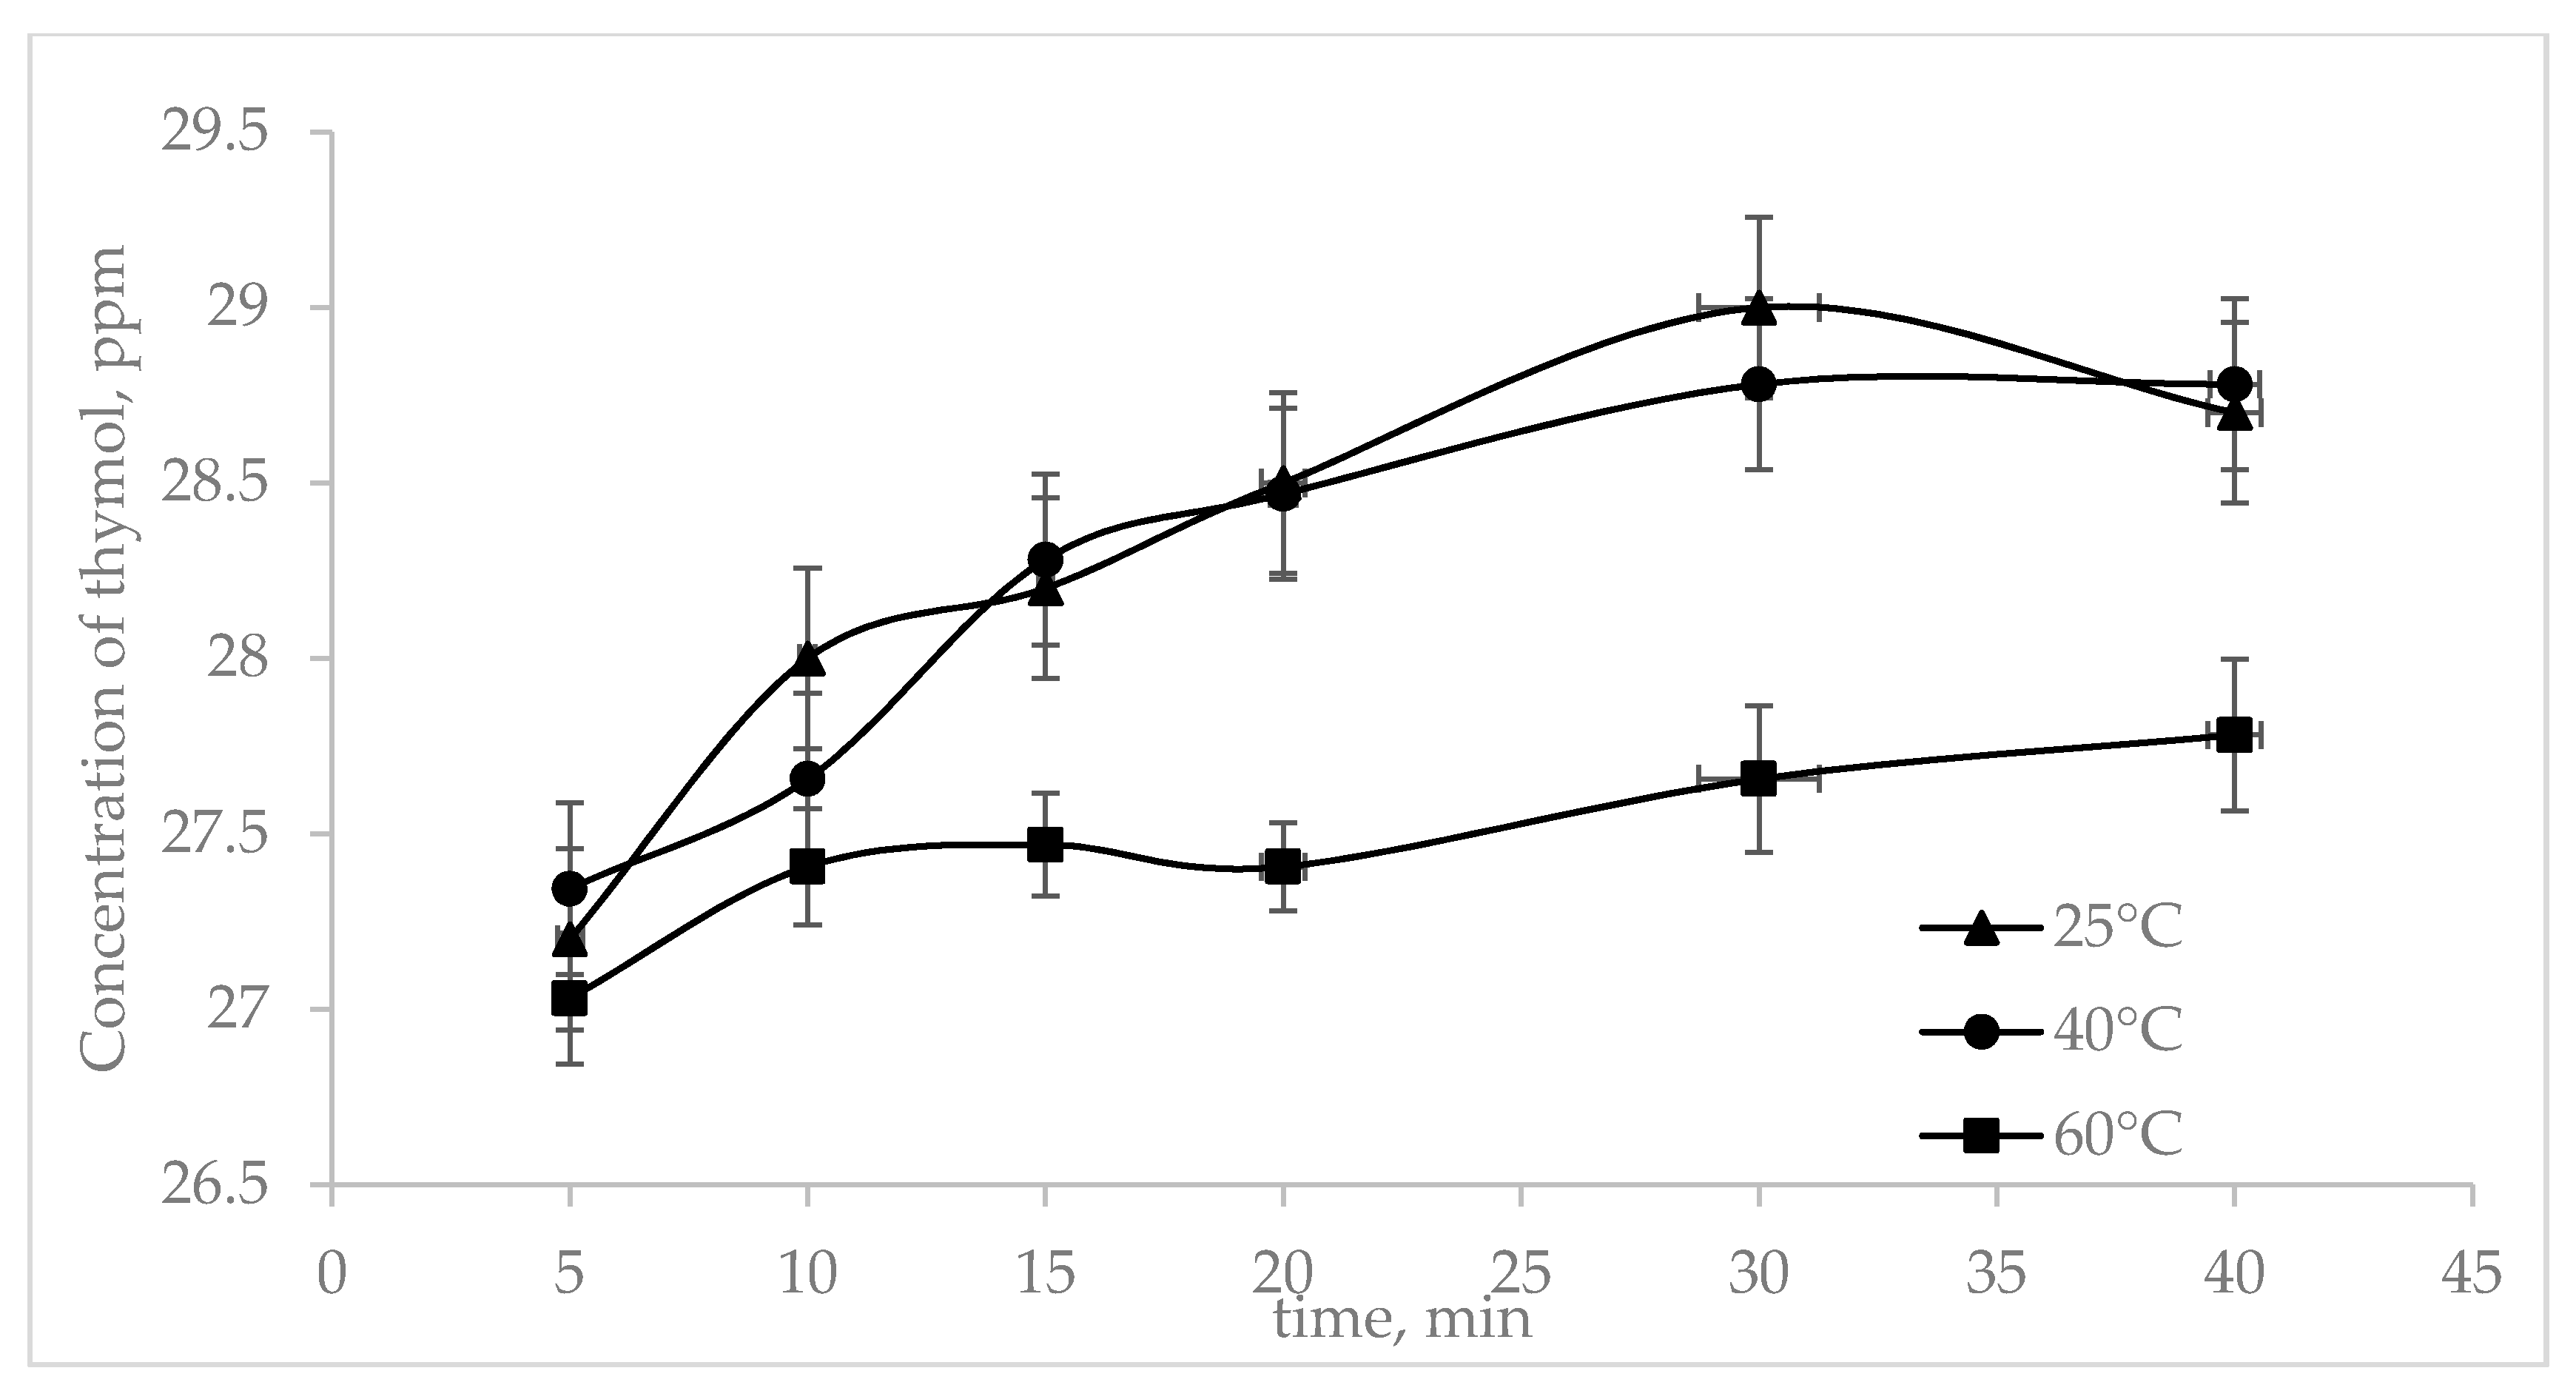
Figure 4 shows the extraction process of thymol from P. amboinicus leaves. The extraction process was rapid at the beginning of the process, reaching the equilibrium state, before starting to decrease near the end of the experiment. The lowest thymol concentration was collected at 60 °C with 2.78% of yield as compared with the other temperatures (5.51% and 5.26% yields of thymol for 25 and 40 °C, respectively). This was due to the elevated temperature of extraction since thymol is a secondary metabolite which is heat-sensitive. The thymol concentration collected decreased as the temperature of extraction increased. These results are in line with findings reported by Novak et al. (2010) [29] who studied thymol extraction from Origanum spp. (Lamiaceae). The concentrations of thymol collected at 25 °C started decreasing upon reaching 40 min of extraction duration. This indicates that, at 40 min, the thymol concentration extracted approached its equilibrium state.
Based on kinetic data shown in the Figure 1, the extraction process took 40 min to achieve maximum yield. This process is considered fast compared to other traditional herbal extracts, which usually take about 4–6 h, depending on the type of herb. The extraction process achieved its equilibrium in a short time due to the usage of ultrasonic waves, along with optimal temperature, which helped to break down the cell wall of the leaves faster than other extraction methods. This potentially happened because of the presence of hydroxyl groups in the thymol structure. Hydroxyl groups can form a hydrogen bond with the solvent, thus further enhancing its solubility, resulting in a faster extraction process for thymol [22].

3.2. Extraction Kinetic Models

Table 3 shows the extraction kinetic models for thymol extraction at different temperatures. Regression values (R2) were calculated in order to find the best fitted model for describing the thymol extraction kinetics. Table 3 also summarizes the values for the constants for pseudo-first-order, Peleg’s, power law, and EDSLE models.
EDSLE was found to be the best fitted model with the highest R2 values, for temperatures 25, 40, and 60 °C, which were 0.999, 0.987, and 0.981, respectively. The lowest R2 values were observed in the pseudo-first-order model, which were 0.577, 0.551, and 0.669 for temperatures 25, 40, and 60 °C, respectively. For the pseudo-first-order and power law models, at a temperature of 60 °C, the values of R2 were the lowest compared to the other temperatures, which were 0.577 and 0.601, respectively. This was probably due to the decrease in thymol concentration at those temperatures. By comparing the R2 values, the EDSLE model clearly provided a better fit compared to other model because its values of R2 were closer to unity. The value of Ce decreased as the temperature increased, thus lowering the solubility. The usage of higher temperature would lead to a decrease in solubility since the solubility of thymol is optimal within the range of 30–43 °C for ethanol [11]. Since the thymol concentration decreased as the temperature increased, the same response was achieved for K, which represents the rate of extraction.

3.3. Optimization of UAE Parameter Using CCD

The influence of extraction parameters on the yield of thymol concentration can be described using ANOVA. It is crucial to analyze the influence of extraction parameters to effectively extract thymol from the P. amboinicus leaves. A p-value less than 0.05 indicates that the model terms were significant, whereas a p-value greater than 0.1 indicates that the terms were not significant. The independent parameters of temperature (A) and extraction time (C), as well as the interactive parameters of AC, and the quadratic parameters of A2 and C2, were the significant model terms in this study. Table 4 shows the ANOVA analysis for the response surface quadratic model.
The regression coefficient indicates the effect of each parameter on the experimental response; the magnitude of the coefficient is related to the weight of its effect, and the sign indicates an increase or decrease [30]. The regression coefficient for A was positive, while that for C was negative. The positive regression coefficient means that an increase in A would lead to an increase in the yield of thymol. The negative regression coefficient for C indicates that its increase would lead to a decrease in yield of thymol. The regression coefficient of AC was negative, and that of A2 and C2 was positive. The value stated for the regression coefficients gave the size of the effect on the dependent variable. For parameter A, an increase by 1 unit would lead to a 9.09-fold increase in the yield of thymol, while an increase by 1 unit of C would lead to a 7.59-fold decrease in the yield of thymol. The empirical model for the parameters on the yield of thymol is given below.
Yield = 30.74 + 10.16(A) − 0.14(B) − 10.09(C) + 0.64 (A)(B) − 9.88(A)(C)(1)+ 0.16
(B)(C) + 4.44 (A2) + 0.11 (B2) + 5.51(C2),
where Y is the concentration of thymol in essential oil, A is the temperature, B is the solid-to-solvent ratio, and C is the extraction time.
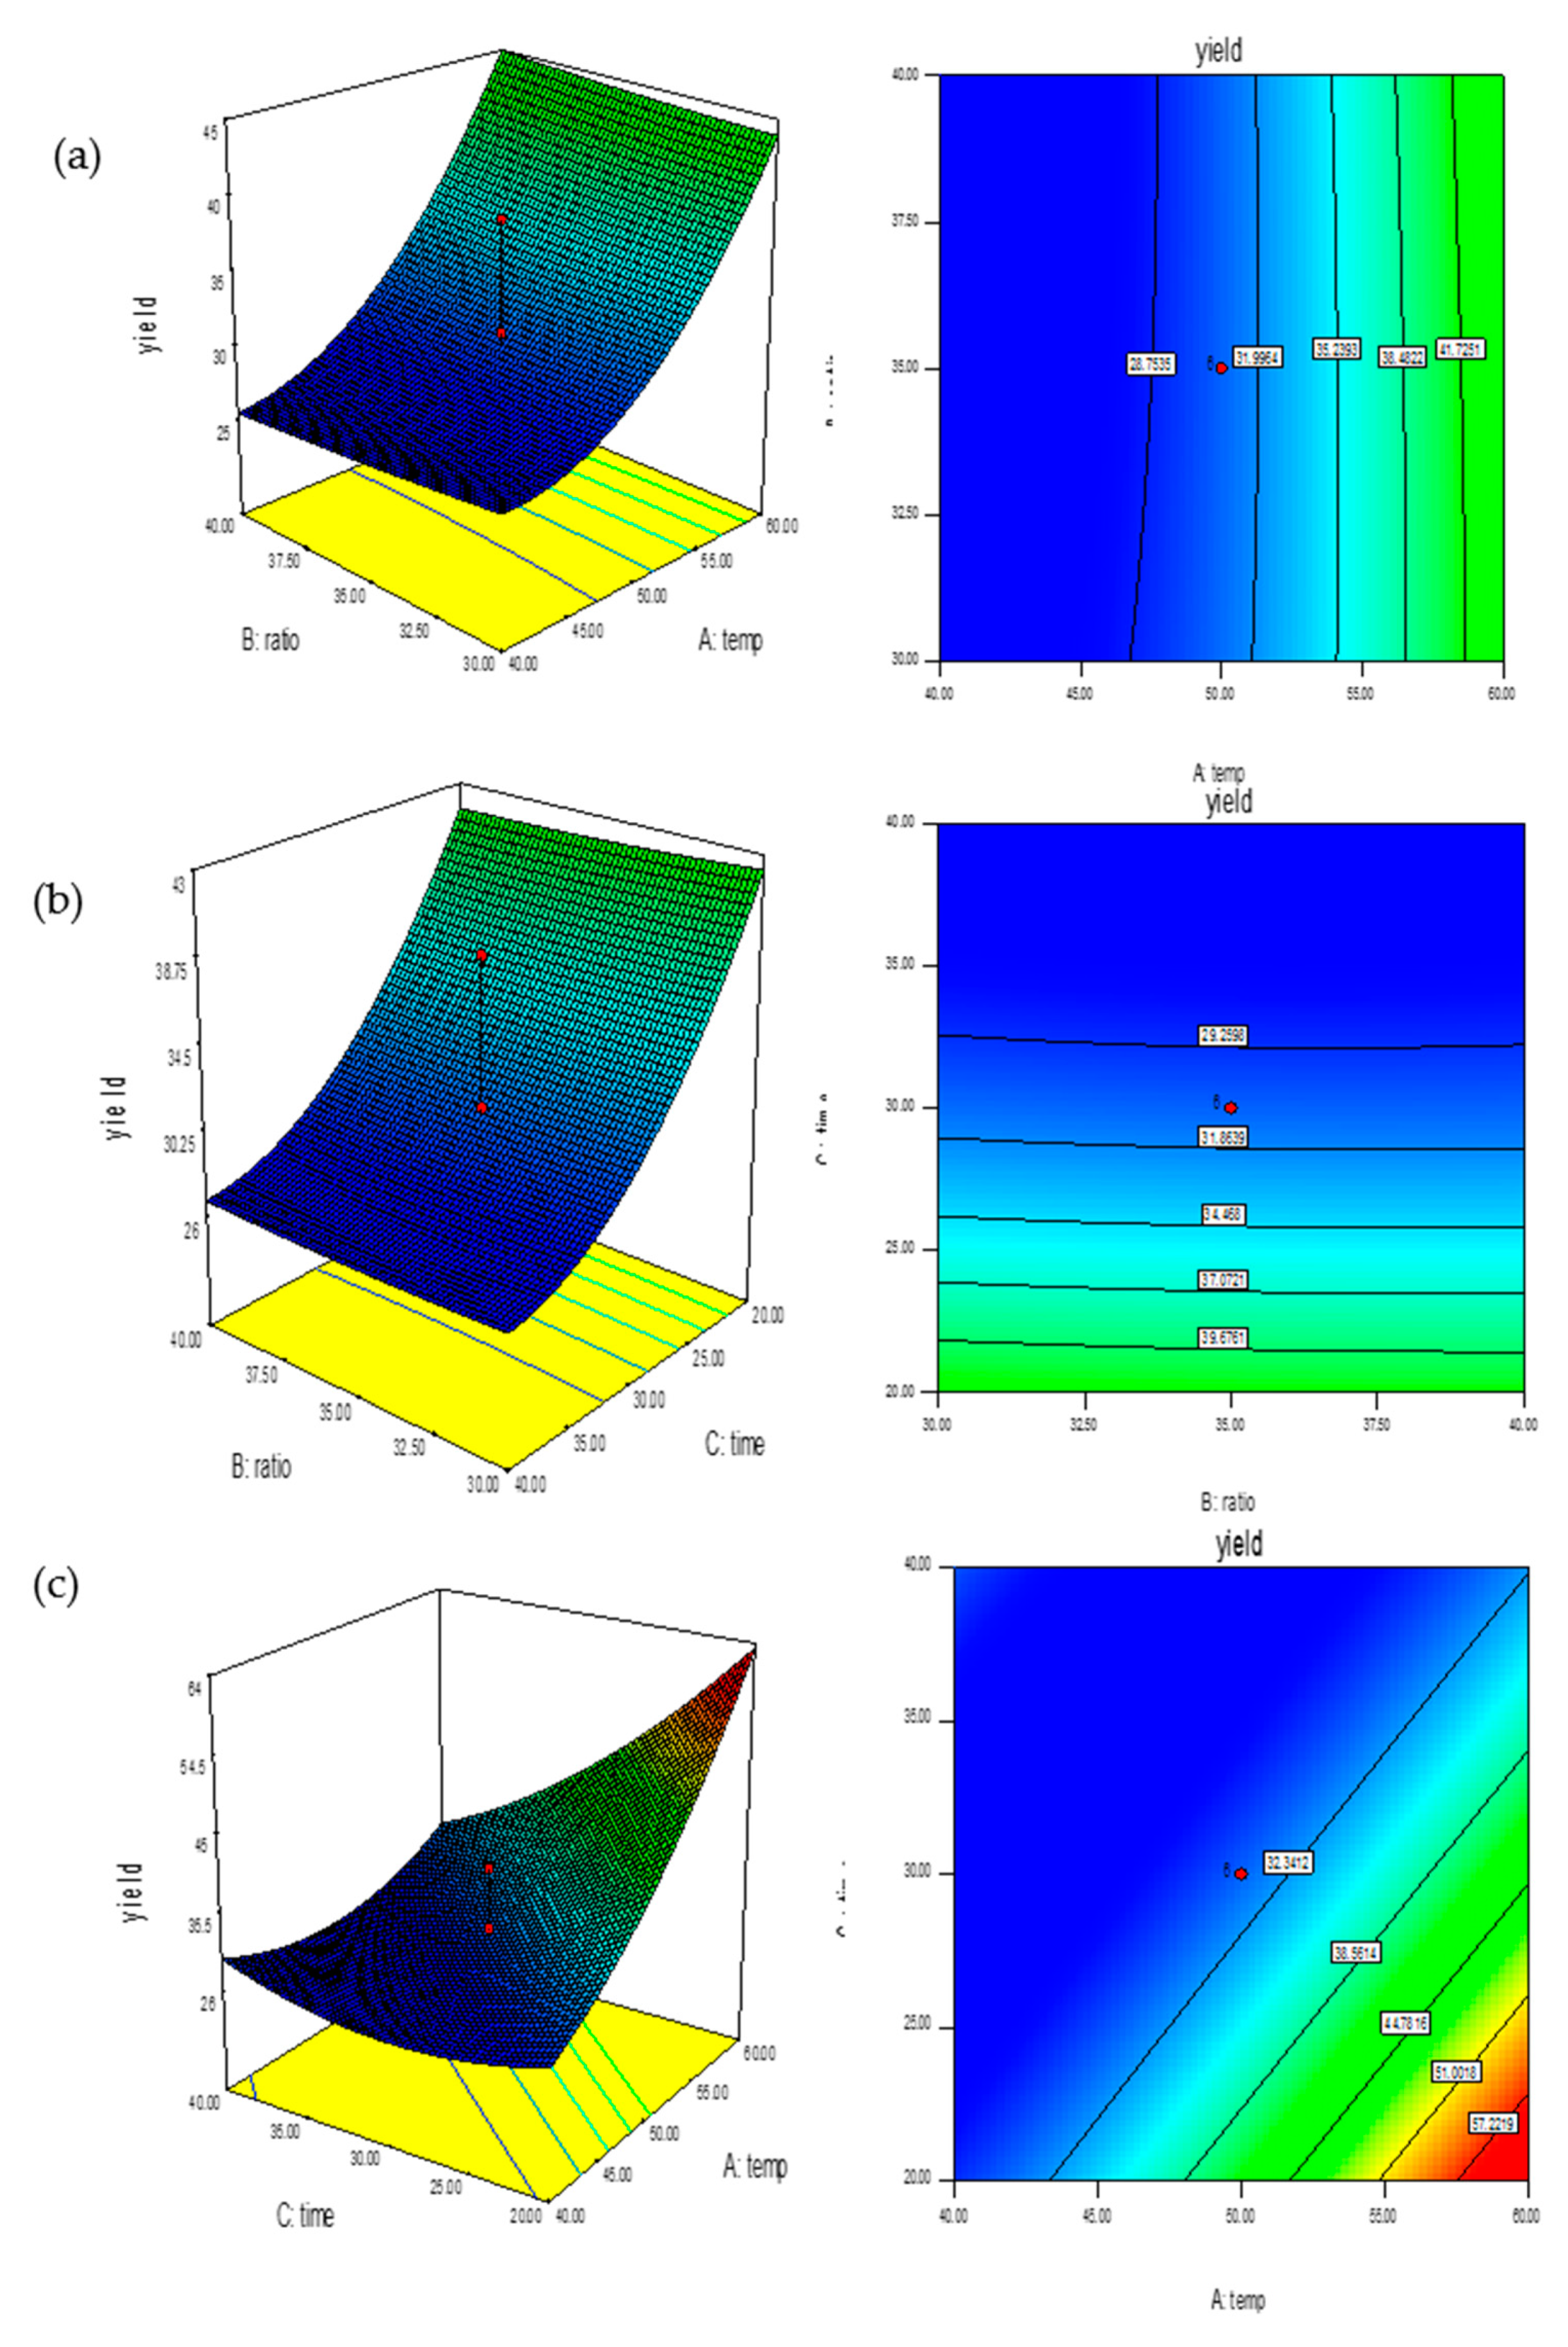
Figure 5 shows the response surface plots constructed based on the fitted model. The plots were constructed with one variable kept at a medium level and the other two kept within the experimental range. Figure 5a shows the plot for variables of temperature and ratio with a medium level of time. As stated in Table 4, temperature was significant (p < 0.0001), while ratio was not significant (p = 0.9159). An increase in temperature to 60 °C would increase the yield of thymol. This would increase the number of cavitation bubbles, leading to a greater solid–solvent contact area, thereby improving of solvent diffusivity with a consequent ultimate increase in the desorption of the compound of interest. This effect was, however, reduced when the temperature was near to the boiling point of the solvent, with most authors reporting a beneficial effect of low temperature (below 30 °C) [31]. Figure 5b shows the plot for solid-to-solvent ratio and time with a medium level of temperature. Time was significant (p < 0.0001) in the study, and a decrease in of time would increase the thymol concentration. This confirmed that the yield of thymol production depended on the time of extraction. A shorter time of extraction is one of the advantages of using the UAE method. A longer exposure to the ultrasound potentially results in free radical production inside the solvent, causing cell disruption [32]. Lastly, Figure 5c shows the plot for time and temperature with a medium level of solid-to-solvent ratio, where both time and temperature were significant. An increase in temperature and a decrease in time would increase the yield of thymol, while a change in solid-to-solvent ratio did not have much of an effect on the thymol yield.

3.4. Validation of Optimization Parameter

Many numerical optimizations were carried out to identify the best possible combination to achieve the desired results. The optimized condition was obtained at 55 °C, with a solid-to-solvent ratio of 35 mL, and an extraction time of 23 min. The experimental results produced a yield of 46.6 ppm of thymol with a residual of 6.8% (Table 5). It was found that, in UAE extraction, a smaller ratio of solvent and a shorter time produced the highest extract of thymol from the leaves. This result is in agreement with the study reported by Kuok Loong et al. (2014) [15]. In their study, the optimized yield of thymol extract was achieved with a small ratio of solvent and a shorter time. Good correlation between the expected response and experimental responses suggest that the models can adequately predict thymol extraction yield using UAE.

3.5. Mechanism of Thymol Extraction Using UAE

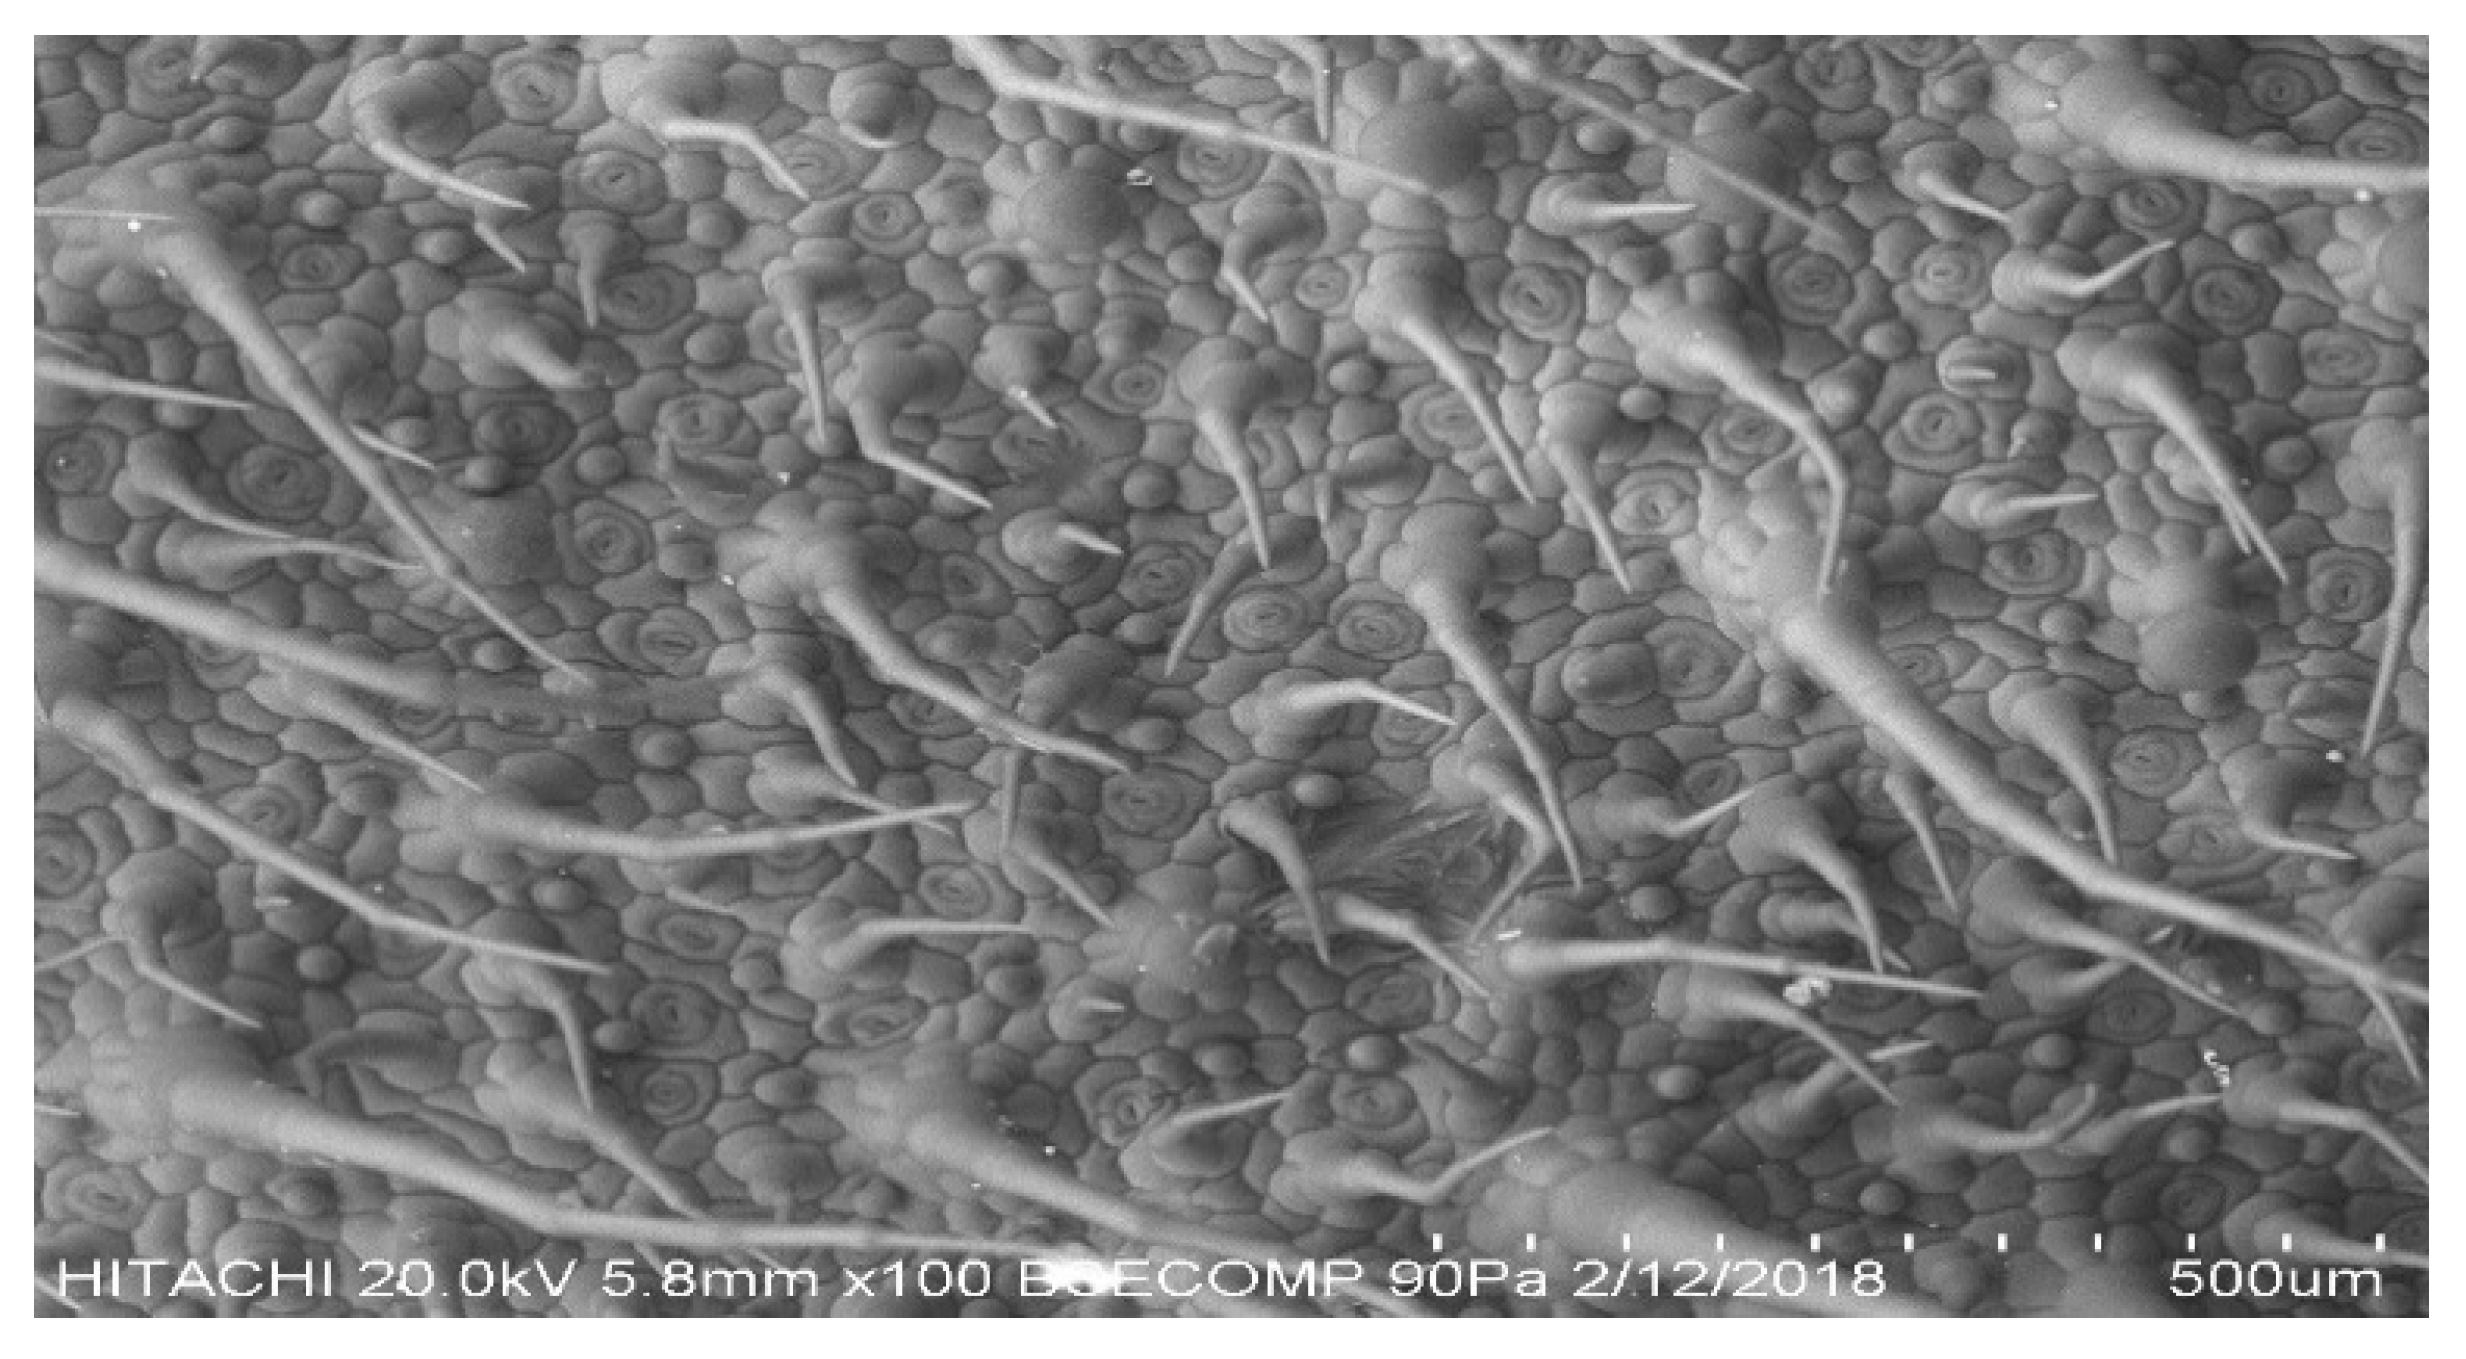
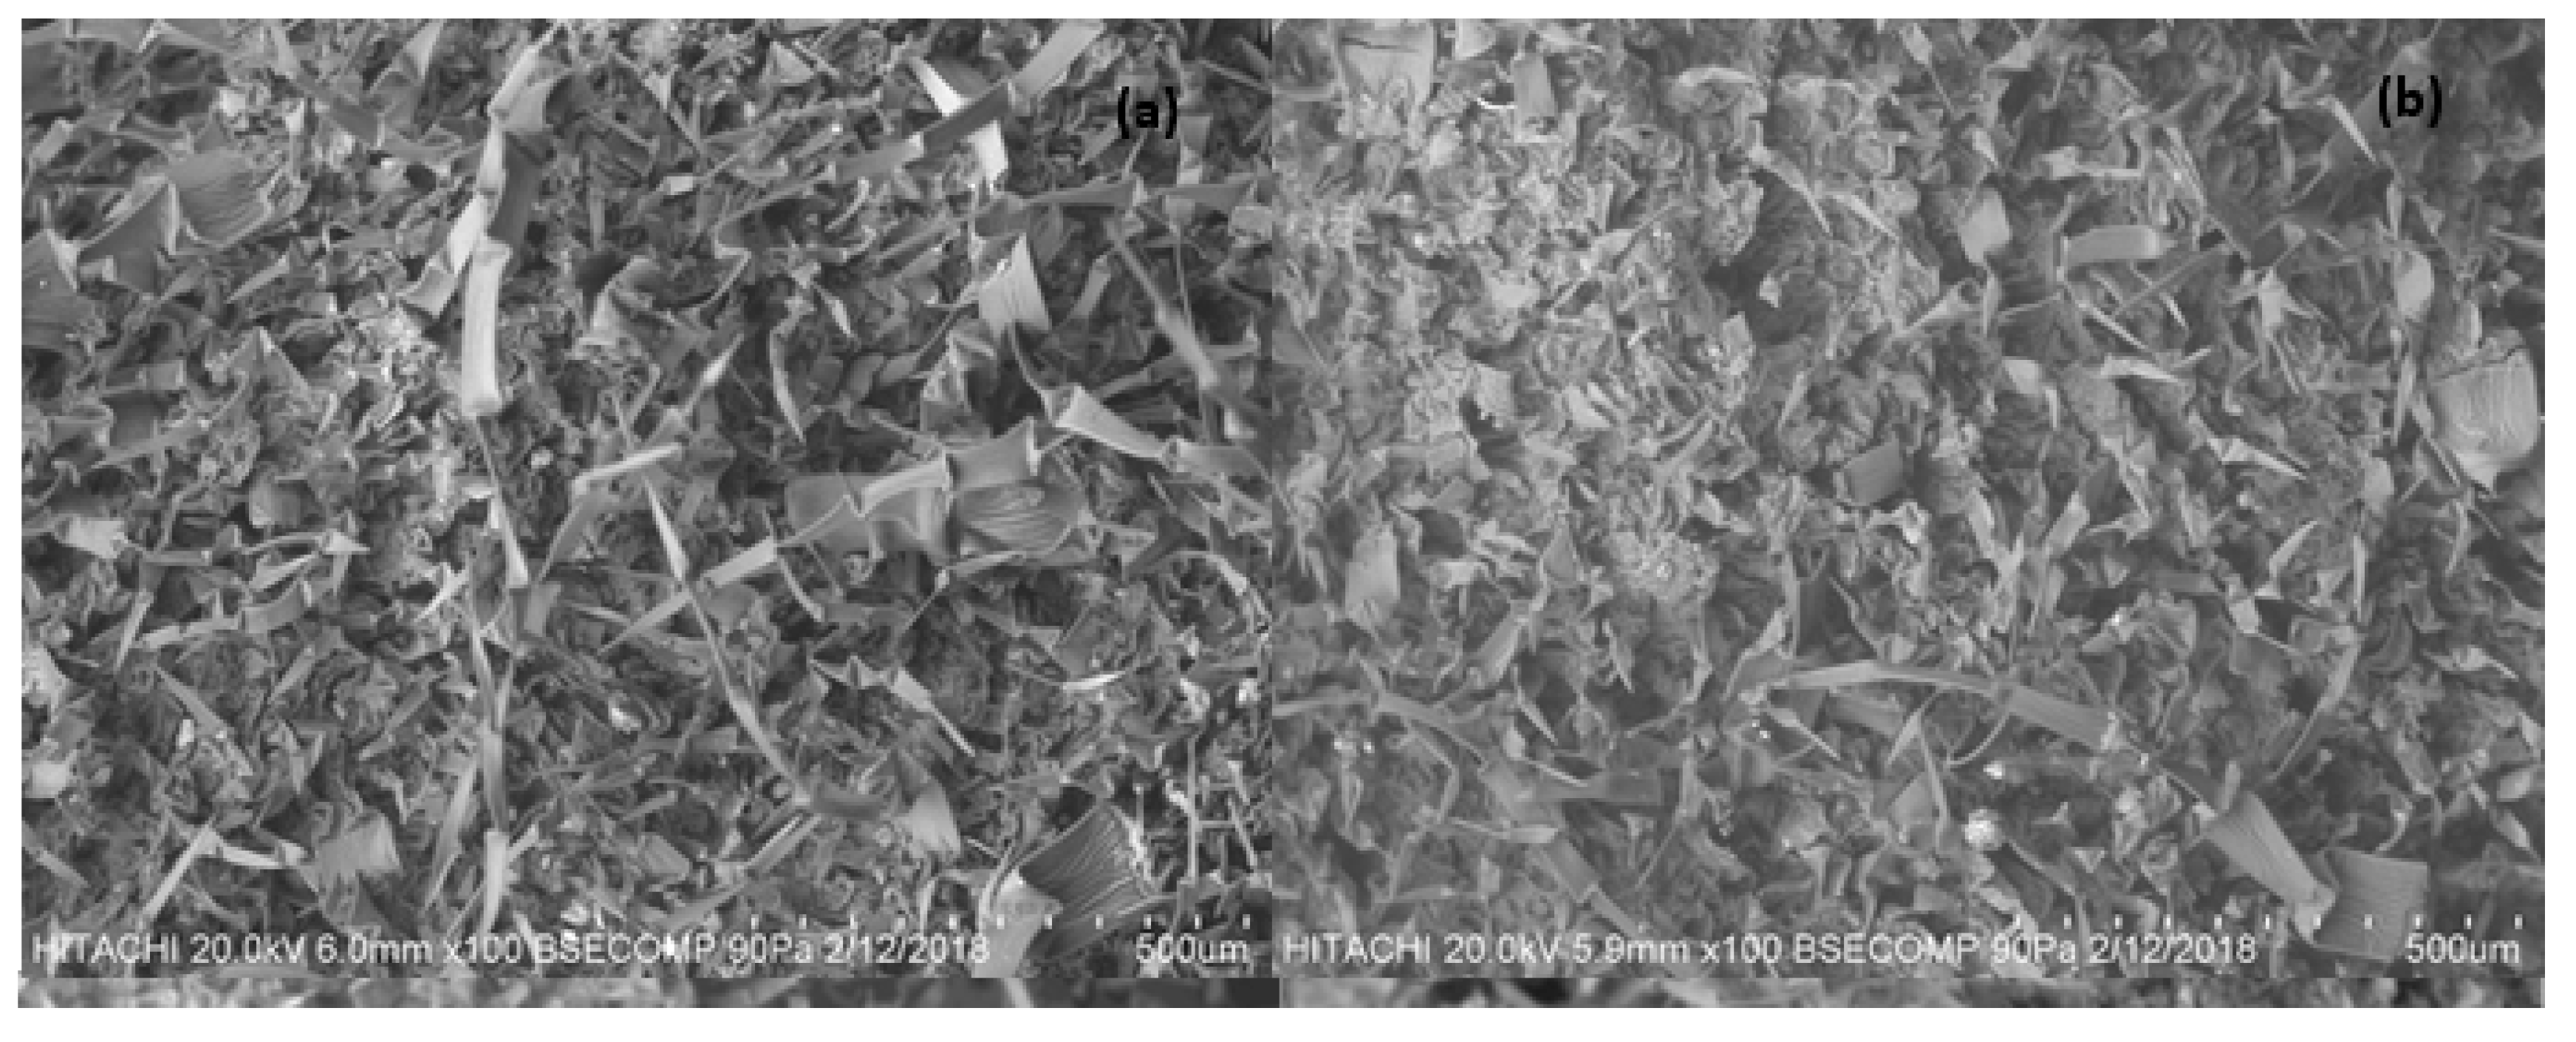
Figure 6 shows the SEM image of raw P. amboinicus leaves before undergoing the extraction process. The roughness value calculated using ImageJ software was 109.259 µm. The image and the value were compared with other images of the leaves after UAE and Soxhlet extraction with different parameters. Figure 7a,b show the SEM image of ultrasonic-assisted extraction after 20 and 40 min of extraction time at constant temperature and volume of solvent. Based on the images, at 40 min of extraction, the surface of the leaves showed more degradation compared to 20 min of extraction time. Using the Image J software, the roughness values calculated for 20 and 40 min were 110.654 and 122.999 µm, respectively. This shows that a longer time taken for the extraction process would lead to more degradation on the surface of the leaves. In conclusion, for UAE at 40 min, the leaves were rougher compared to 20 min of extraction time. In terms of great time management, UAE is suitable for extraction. These studies showed that the reduction in extraction time due to the use of ultrasound favored cell-wall rupture, with a subsequent increase in solvent penetration [25].
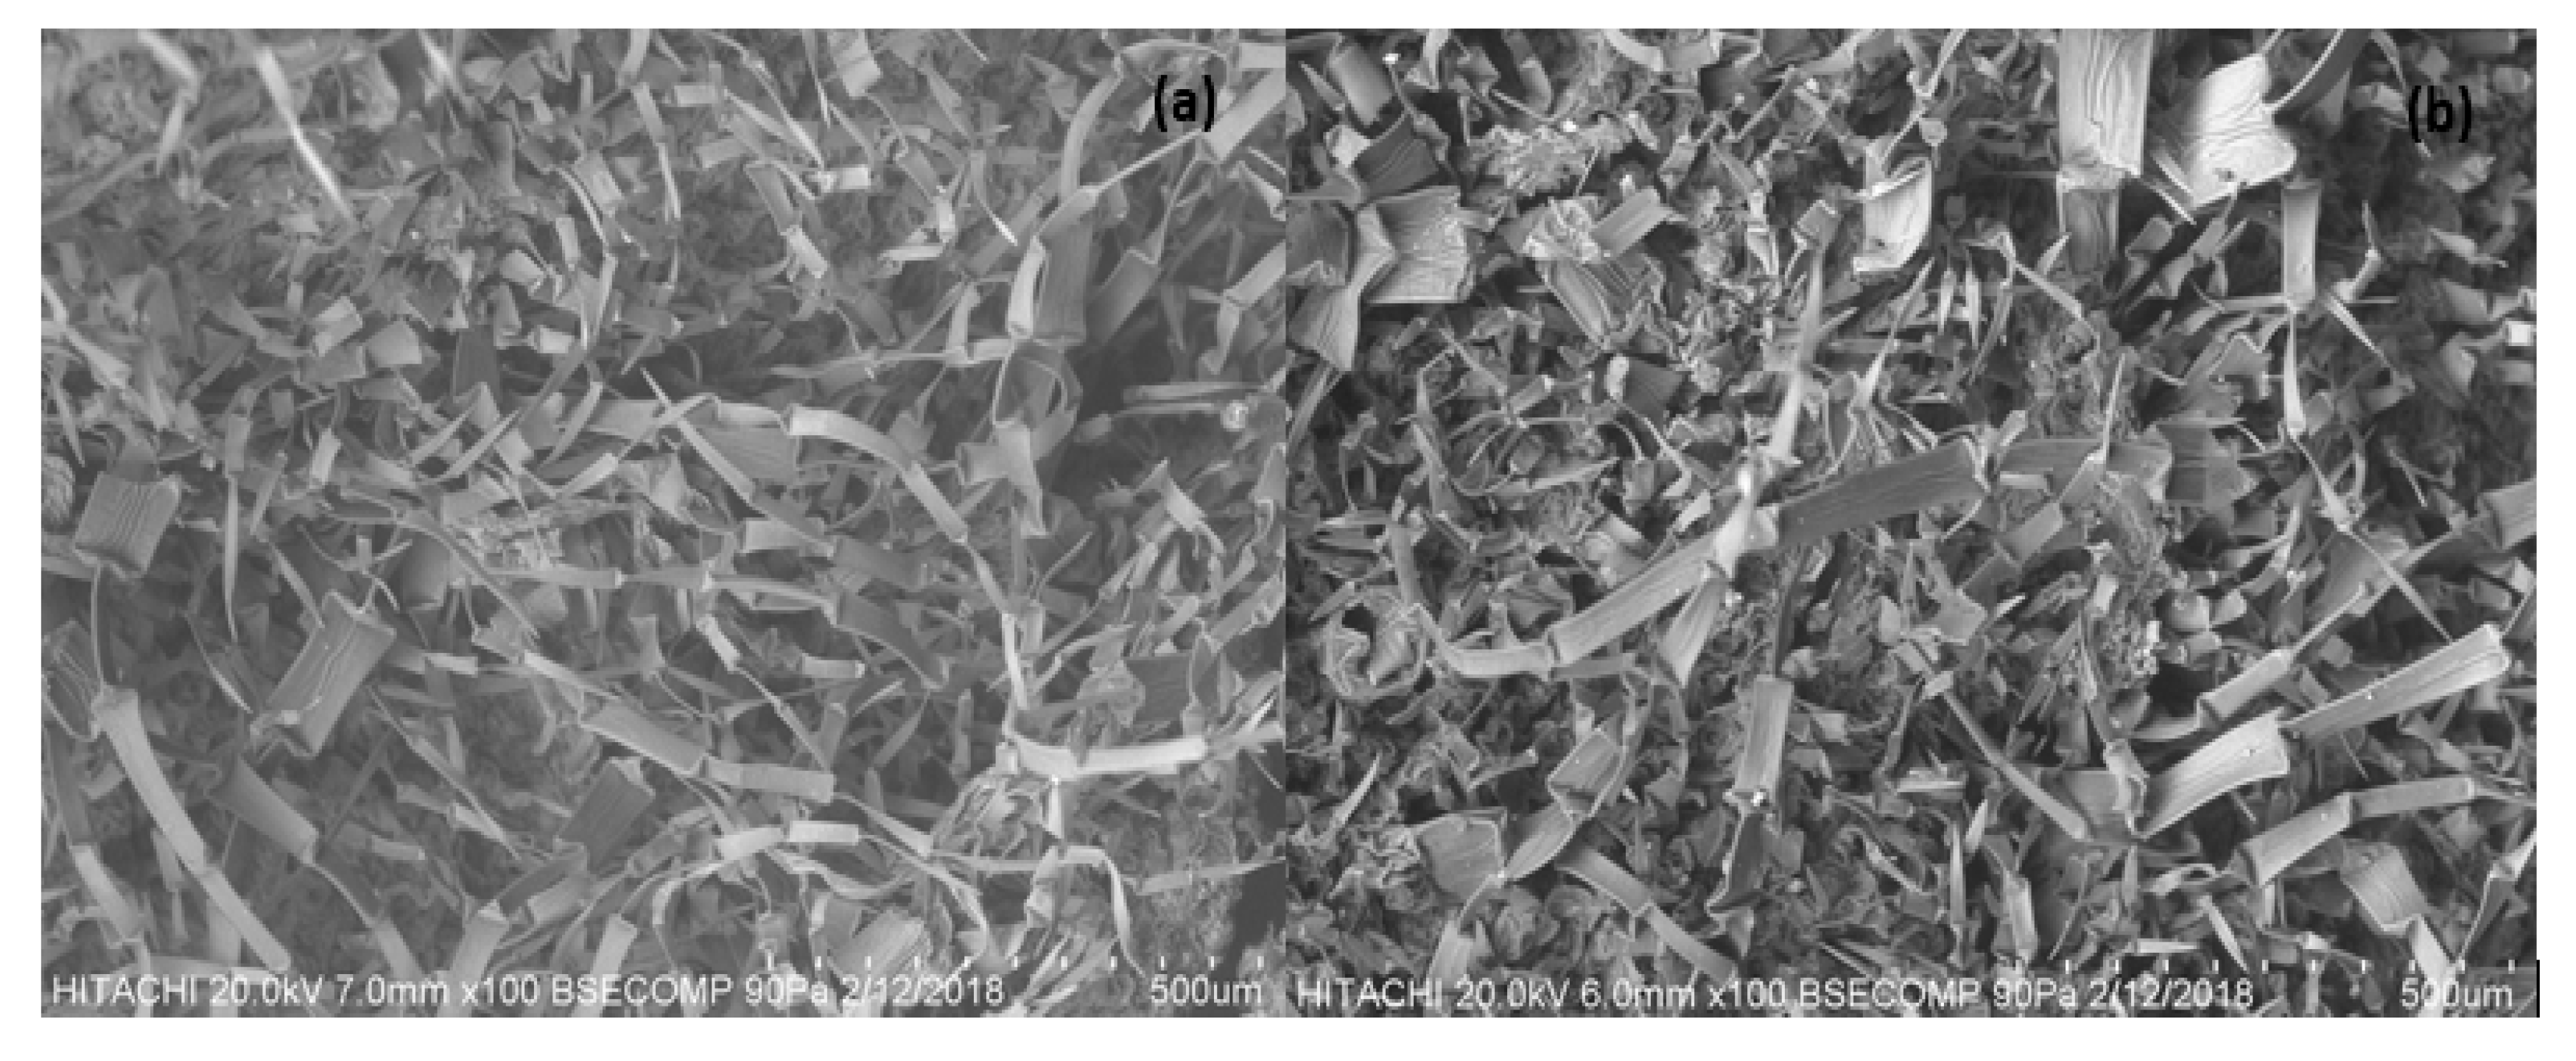
Figure 8 shows the comparison of SEM images of the UAE process at different temperatures of 40 and 60 °C with a constant extraction time and volume of solvent. The roughness values were 121.545 and 111.528 µm for 40 and 60 °C, respectively. Based on the value of roughness at 40 °C, the leaf structure was rougher as compared to 60 °C. UAE at lower temperature gave a higher value of roughness for the structure of the leaves. Table 6 shows the overall roughness, Ra, for all SEM images based on different parameters.
Several mechanisms were identified for UAE. Based on Figure 7 and Figure 8, the extraction process happens when an ultrasonic wave is produced by the ultrasonic probe that induces the formation of cavitation bubbles. Longitudinal waves are generated in sonication processes as a sonic wave encounters a liquid medium, which creates regions of alternating compression and rarefaction (expansion) among the molecules of the medium. Cavitation of formed gas bubbles occurs in these regions, thereby varying the pressure [33]. The bubbles attach to the solid particles, and, upon the collapse of the bubbles, they break down the cell wall of the solid particles, leading to the chemical components inside diffusing into the solvent. The same explanation was presented by Medina-Torres et al. (2017) [25], with the aim of improving the penetration of liquid inside the solid particle via bubble explosion. The breakdown of cavitation bubbles on the surface of the leaves causes degradation or erosion of plant structures released in the extraction medium (solvent). Erosion is a known effect of ultrasound, and it is used for many purposes, such as for cleaning or sonochemical reactions, e.g., with metals [31]. Figure 9 illustrates the potential mechanism that could occur during thymol extraction from P. amboinicus leaves using UAE.

4. Conclusions

The kinetic extraction study of UAE showed that a lower concentration of thymol was extracted at higher temperature compared to that at lower temperature. At 60 °C, the thymol concentration was the lowest compared to other temperatures with only a 2.78% yield of thymol. The increase in extraction time led to a decrease in thymol yield. The EDSLE method was the best fitted model with R2 values of 0.999, 0.950, and 0.93 for extraction temperatures of 25, 40, and 60 °C, respectively. The optimization study for thymol concentration found that the optimum condition was at 55 °C with an extraction time of 23 min and a solid-to-solvent ratio of 1:35 g/mL. By using ultrasound, the extraction process can be carried out faster, since the optimum time of extraction was 23 min, which is faster than many other extraction processes. The leaf surface morphology was also studied using SEM for different extraction parameters. A possible mechanism for UAE was also proposed.

Author Contributions

Methodology, L.C.A., G.H.C., and B.L.C.; Investigation, N.A.A.R.Z., and L.C.A.; Writing-original draft preparation, N.A.A.R.Z.; Writing-review and editing, L.C.A, and G.H.C. All authors have read and agreed to the published version of the manuscript.

Funding

This research received no external funding.

Acknowledgments

This authors would like to express their gratitude to all laboratory staff at Department of Chemical and Environmental Engineering, Universiti Putra Malaysia for assisting in this research.

Conflicts of Interest

The authors declare no conflict of interest.

References

  1. Swamy, K.M.; Pokharen, N.; Dahal, S. Phytochemical and antimicrobial studies of leaf extract of Euphorbia neriifolia. J. Med. Plants Res. 2011, 5, 5785–5788. [Google Scholar]
  2. De Lira Mota, K.S.; De Oliveira Pereira, F.; De Oliveira, W.A.; Lima, I.O.; De Oliveira Lima, E. Antifungal activity of Thymus vulgaris L. essential oil and its constituent phytochemicals against rhizopus oryzae: Interaction with ergosterol. Molecules 2012, 17, 14418–14433. [Google Scholar] [CrossRef] [PubMed] [Green Version]
  3. Asiimwe, S.; Karlsson, A.B.; Azeem, M.; Mugisha, K.M.; Namutebi, A.; Gakunga, N.J. Chemical composition and toxicological evaluation of the aqueous leaf extracts of Plectranthus amboinicus Lour. Spreng. Int. J. Pharm. Sci. Invent. 2014, 3, 19–27. [Google Scholar]
  4. Sathasivam, A.; Elangovan, K. Evaluation of phytochemical and antibacterial activity of Plectranthus Amboinicus. Int. J. Res. Ayurveda Pharm. 2011, 2, 292–294. [Google Scholar]
  5. Azwanida, N. A Review on the extraction methods use in medicinal plants, principle, strength and limitation. Med. Aromat. Plants 2015, 4, 3–8. [Google Scholar]
  6. Mnayer, D.; Fabiano-Tixier, A.S.; Petitcolas, E.; Ruiz, K.; Hamieh, T.; Chemat, F. Extraction of green absolute from thyme using ultrasound and sunflower oil. Resour. -Effic. Technol. 2017, 3, 12–21. [Google Scholar] [CrossRef]
  7. Roldán-Gutiérrez, J.M.; Ruiz-Jiménez, J.; De Castro, M.L. Ultrasound-assisted dynamic extraction of valuable compounds from aromatic plants and flowers as compared with steam distillation and superheated liquid extraction. Talanta 2008, 75, 1369–1375. [Google Scholar] [CrossRef]
  8. Aghamohammadi, A.; Azadbakht, M.; Hosseinimehr, S.J. Quantification of thymol content in different extracts of Zataria multiflora by HPLC method. Pharm. Biomed. Res. 2016, 2, 8–13. [Google Scholar] [CrossRef] [Green Version]
  9. Gujar, J.G.; Wagh, S.J.; Gaikar, V.G. Experimental and modeling studies on microwave-assisted extraction of thymol from seeds of Trachyspermum ammi (TA). Sep. Purif. Technol. 2010, 70, 257–264. [Google Scholar] [CrossRef]
  10. Malik, N.R. Optimization of process parameters in extraction of Thyme oil using response surface methodology (RSM). Sci. Eng. Technol. 2016, 16, 248–258. [Google Scholar]
  11. Villanueva Bermejo, D.; Angelov, I.; Vicente, G.; Stateva, R.P.; Rodriguez García-Risco, M.; Reglero, G.; Fornari, T. Extraction of thymol from different varieties of thyme plants using green solvents. J. Sci. Food Agric. 2015, 95, 2901–2907. [Google Scholar] [CrossRef] [PubMed]
  12. Basch, E.; Ulbricht, C. Thyme (Thymus vulgaris L.), Thymol thyme (Thymus vulgaris L.). Thymol. J. Herb. Pharm. 2014, 4, 49–67. [Google Scholar] [CrossRef]
  13. Senthilkumar, A.; Venkatesalu, V. Chemical composition and larvicidal activity of the essential oil of Plectranthus amboinicus (Lour.) Spreng against Anopheles stephensi: A malarial vector mosquito. Parasitol. Res. 2010, 107, 1275–1278. [Google Scholar] [CrossRef] [PubMed]
  14. Chuyen, H.V.; Roach, P.D.; Golding, J.B.; Parks, S.E.; Nguyen, M.H. Ultrasound-Assisted Extraction of GAC Peel: An Optimization of Extraction Conditions for Recovering Carotenoids and Antioxidant Capacity. Processes 2020, 8, 8. [Google Scholar] [CrossRef] [Green Version]
  15. Kuok Loong, N.G.; Wahida, P.F.; Chong, C.H. Optimisation of extraction of thymol from Plectranthus amboinicus leaves using response surface methodology. J. Eng. Sci. Technol. 2014, 2013, 79–88. [Google Scholar]
  16. Veljkovi, V.B.; Milenovi, D.M. Extraction of resinoids from St. John’s wort (Hypericum perforatum L). II. Modeling of extraction kinetics. Hem. Ind 2002, 56, 60–67. [Google Scholar] [CrossRef] [Green Version]
  17. Sovova, H. Rate of the vegetable oil extraction with supercritical CO2 -I. Modeling of extraction curves. Chem. Eng. Sci. 1994, 49, 409–414. [Google Scholar] [CrossRef]
  18. Dias, A.L.B.; Sergio, C.S.S.; Santos, P.; Barbero, G.F.; Rezende, C.A.; Martinez, J. Ultrasound-assisted extraction of bioactive compounds from dedo de moça pepper (Capsicum baccatum L.): Effects on the vegetable matrix and mathematical modeling. J. Food Eng. 2017, 198, 36–44. [Google Scholar] [CrossRef]
  19. Peleg, M. An empirical model for the description of moisture sorption curves. J. Food Sci. 1988, 53, 1212–1217. [Google Scholar] [CrossRef]
  20. Tuˇsek, A.J.; Benkovi´c, M.; Cvitanovi´c, A.B.; Valinger, D.; Jurina, T.; Kljusuri´c, J.G. Kinetics and thermodynamics of the solid-liquid extraction process of total polyphenols, antioxidants and extraction yield from Asteraceae plants. Ind. Crop. Prod. 2016, 91, 205–214. [Google Scholar]
  21. Dong, Z.; Gu, F.J.; Xu, F.; Wang, Q. Comparison of four kinds of extraction techniques and kinetics of microwave-assisted extraction of vanillin from Vanilla planifolia Andrews. Food Chem. 2014, 149, 54–61. [Google Scholar] [CrossRef] [PubMed]
  22. Pin, K.Y.; Chuah, A.L.; Rashih, A.A.; Rasadah, M.A.; Law, C.L.; Choong, T.S.Y. Solid-liquid extraction of betel leaves (Piper betle L.). J. Food Process Eng. 2009, 34, 549–565. [Google Scholar] [CrossRef]
  23. Kuo, C.H.; Chen, B.Y.; Liu, Y.C.; Chang, C.M.J.; Deng, T.S.; Chen, J.H.; Shieh, C.J. Optimized ultrasound-assisted extraction of phenolic compounds from Polygonum cuspidatum. Molecules 2014, 19, 67–77. [Google Scholar] [CrossRef] [PubMed] [Green Version]
  24. Tekin, K.; Akalın, M.K.; Şeker, M.G. Ultrasound bath-assisted extraction of essential oils from clove using central composite design. Ind. Crop. Prod. 2015, 77, 954–960. [Google Scholar] [CrossRef]
  25. Medina-Torres, N.; Ayora-Talavera, T.; Espinosa-Andrews, H.; Sánchez-Contreras, A.; Pacheco, N. Ultrasound assisted extraction for the recovery of phenolic compounds from vegetable sources. Agronomy 2017, 7, 47. [Google Scholar] [CrossRef]
  26. Esclapez, M.D.; García-Pérez, J.V.; Mulet, A.; Cárcel, J.A. Ultrasound-assisted extraction of natural products. Food Eng. Rev. 2011, 3, 108. [Google Scholar] [CrossRef]
  27. Kowalski, R.; Wawrzykowski, J. Effect of ultrasound-assisted maceration on the quality of oil from the leaves of thyme Thymus vulgaris L. Flavour Fragr. J. 2009, 24, 69–74. [Google Scholar] [CrossRef]
  28. Tabaraki, R.; Nateghi, A. Optimization of ultrasonic-assisted extraction of natural antioxidants from rice bran using response surface methodology. Ultrason. Sonochem. 2011, 18, 1279–1286. [Google Scholar] [CrossRef]
  29. Novak, J.; Lukas, B.; Franz, C. Temperature influences thymol and carvacrol differentially in Origanum spp. (Lamiaceae). J. Essent. Oil Res. 2010, 22, 412–415. [Google Scholar] [CrossRef]
  30. Garcia-Vaquero, M.; Rajauria, G.; Tiwari, B.; Sweeney, T.; O’Doherty, J. Extraction and yield optimisation of fucose, glucans and associated antioxidant activities from Laminaria digitata by applying response surface methodology to high intensity ultrasound-assisted extraction. Mar. Drugs 2018, 16, 257. [Google Scholar] [CrossRef] [Green Version]
  31. Chemat, F.; Rombaut, N.; Sicaire, A.G.; Meullemiestre, A.; Fabiano-Tixier, A.S.; Abert-Vian, M. Ultrasound assisted extraction of food and natural products. Mechanisms, techniques, combinations, protocols and applications. A review. Ultrason. Sonochem. 2017, 34, 540–560. [Google Scholar] [CrossRef] [PubMed]
  32. Panda, D.; Manickam, S. Cavitation technology—The future of greener extraction method: A review on the extraction of natural products and process intensification mechanism and perspectives. Appl. Sci. 2019, 9, 766. [Google Scholar] [CrossRef] [Green Version]
  33. Azmin, S.N.H.M.; Manan, Z.A.; Alwi, S.R.W.; Chua, L.S.; Mustaffa, A.A.; Yunus, N.A. Herbal processing and extraction technologies. Sep. Puification Rev. 2016, 45, 305–320. [Google Scholar] [CrossRef]
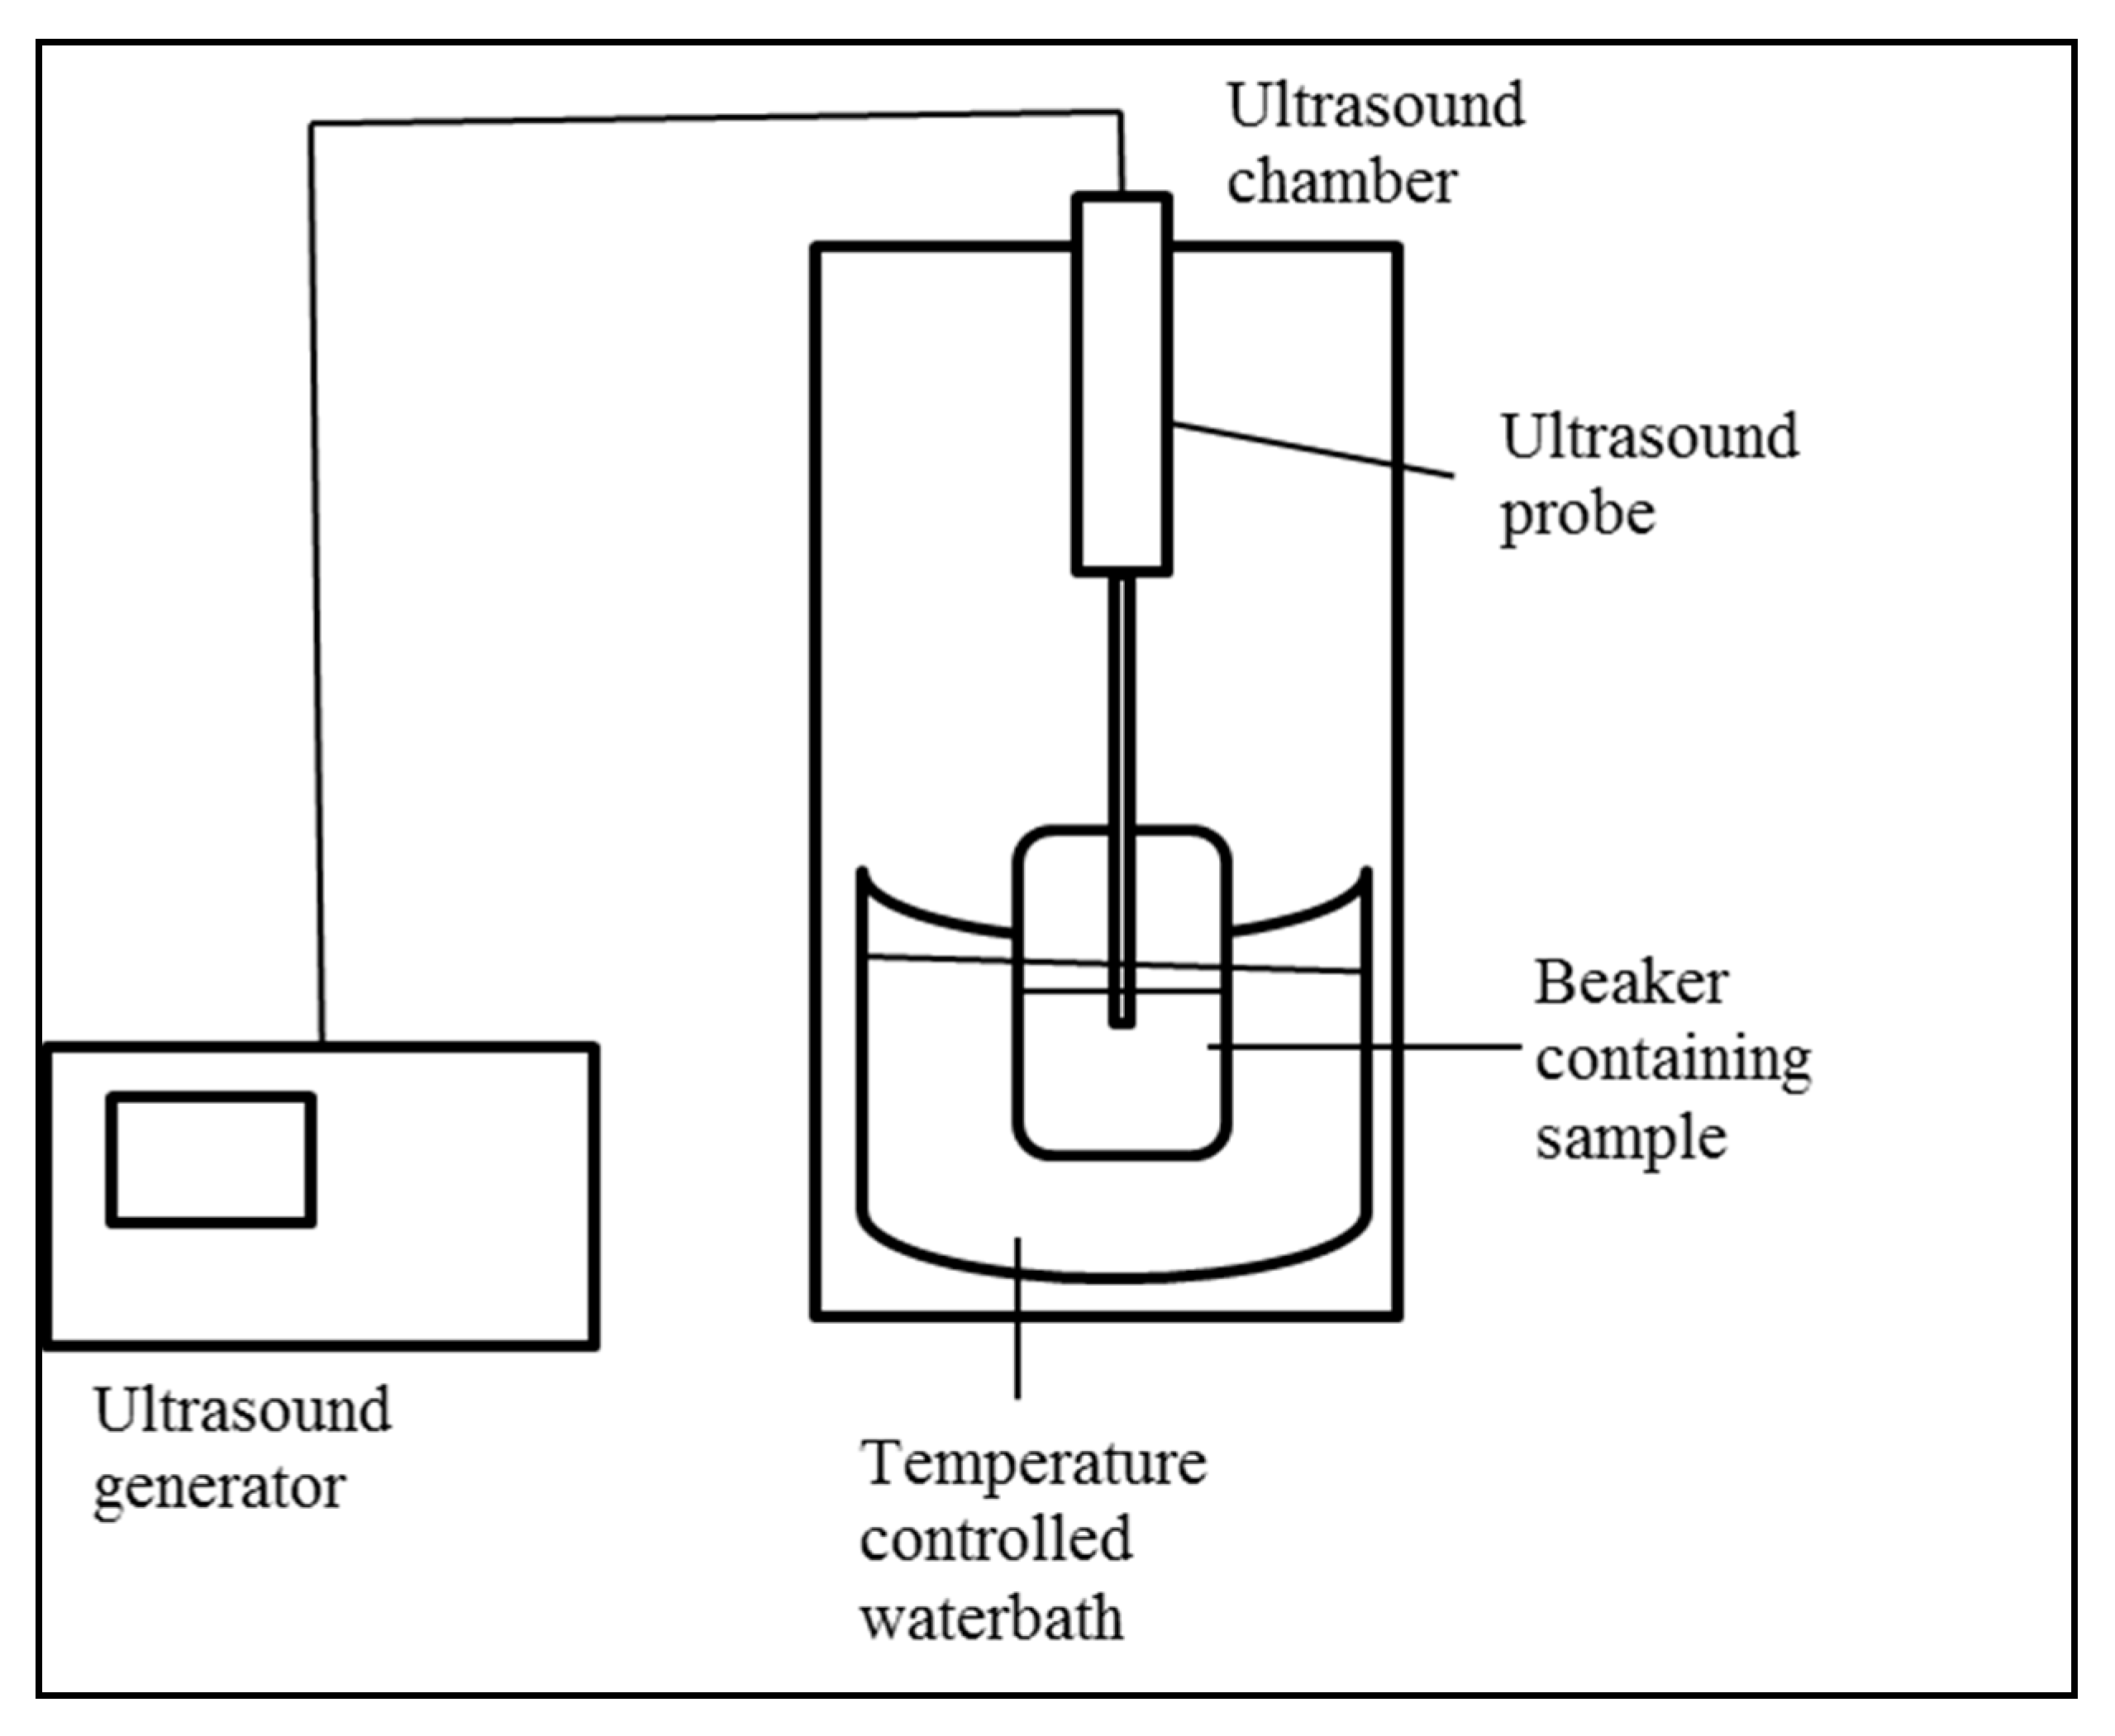
Figure 1. Ultrasound-assisted extraction set-up.
Processes 08 00322 g001
Figure 2. Schematic diagram of extraction process and solid.
Processes 08 00322 g002
Figure 3. GC analysis of thymol from Plextranthus amboinicus.
Processes 08 00322 g003
Figure 4. Kinetic study of thymol extraction at different temperatures.
Processes 08 00322 g004
Figure 5. Response surface plots representing the effects of (a) A and B, (b) B and C, and (c) A and C on the yield of thymol. A, temperature; B, solid-to-solvent ratio; C, extraction time.
Processes 08 00322 g005
Figure 6. SEM image of raw P. amboinicus leaves.
Processes 08 00322 g006
Figure 7. SEM image of leaves after UAE: (a) at 20 min; (b) at 40 min.
Processes 08 00322 g007
Figure 8. SEM image of leaves after UAE: (a) at 40 °C; (b) at 60 °C.
Processes 08 00322 g008
Figure 9. Possible mechanism of thymol extraction using UAE: (a) image of solid particles of leaves inside solvent; (b) the formation of agitation bubble; (c) the breakdown of the cavitation bubble; (d) release of chemical components into the solvent.
Processes 08 00322 g009
Table 1. The level use in central composite design (CCD).
Factor NameLow ActualHigh ActualLow CodedHigh CodedMeanReferences
ATemperature, °C40.0060.00−1.001.0050.00[23,24]
BSolid to solvent ratio, g/mL1:30.001:40.00−1.001.0035.00[9,15,25]
CTime, min20.0040.00−1.001.0030.00[24,25,26,27]
Table 2. CCD for the ultrasound-assisted extraction (UAE) of thymol concentration.
StandardRunTemperature ( °C)Solid to Solvent Ratio (g:mL)Extraction Time (min)
110401:3020
24601:3020
33401:4020
416601:4020
512401:3040
618601:3040
78401:4040
82601:4040
91533.181:3530
10666.821:3530
1117501:26.5930
129501:43.4130
131501:3513.18
1411501:3546.82
1513501:3530
167501:3530
1720501:3530
185501:3530
1914501:3530
2010501:3530
Table 3. Kinetic models for thymol extraction at different temperatures.
ModelTemperature ( °C)ConstantsR2
Pseudo-first-order25A1 = 28.383
A2 = 0.627
0.577
40A1 = 28.417
A2 = 0.644
0.551
60A1 = 27.547
A2 = 0.793
0.669
Peleg’s25B1 = 0.012
B2 = 0.035
0.898
40B1 = 0.11
B2 = 0.035
0.885
60B1 = 0.002
B2 = 0.0036
0.577
Power25C1 = 4.593 x 1044
C2 = 0.032
0.894
40C1 = 9.059 × 1043
C2 = 0.032
0.871
60C1 = 5.398 × 1078
C2 = 0.018
0.601
EDSLE25K = 4.091
Ce = 28.501
0.999
40K = 2.669
Ce = 28.443
0.987
60K = 2.541
Ce = 27.681
0.981
Table 4. Estimation regression coefficient and analysis of variance (ANOVA) for the investigated parameters.
FactorRegression Coefficient F-Valuep-ValueRemarks
Intercept30.7412.310.0009Significant
A (temperature)9.0959.24<0.0001Significant
B (ratio)−0.140.0120.9159Not significant
C (time)−7.5958.41<0.0001Significant
AB0.640.120.7386Not significant
AC−8.0426.680.0009Significant
BC0.167.13 × 10−30.9348Not significant
A24.4916.540.0036Significant
B20.160.010.9222Not significant
C23.525.50.001Significant
Lack of fit 1.060.4434Not significant
R20.9326Adjusted R20.8568
Table 5. Residual calculation based on predicted and experimentally obtained results in optimal conditions.
Temperature (°C)Solid-to-Solvent Ratio (g:mL)Extraction Time (min)Yield (ppm)Residual (%)
Predicted551:352350.006.8 ± 5.8
Obtained551:352346.60
Table 6. Roughness value, Ra, for UAE SEM images.
ParameterRa (µm)
20 min110.654
40 min122.999
40 °C121.545
60 °C111.528
Raw P. amboinicus leaves109.259