Article

Synthesis, Electrical Properties and Na+ Migration Pathways of Na2CuP1.5As0.5O7

by
Ohud S. A. ALQarni
1,
Riadh Marzouki
1,2,3,*,
Youssef Ben Smida
4,
Majed M. Alghamdi
1,
Maxim Avdeev
5,6,
Radhouane Belhadj Tahar
1 and
Mohamed Faouzi Zid
3
1
Chemistry Department, College of Science, King Khalid University, Abha 61413, Saudi Arabia
2
Chemistry Department, Faculty of Sciences of Sfax, University of Sfax, Sfax 3038, Tunisia
3
Laboratoire de Matériaux, Cristallochimie et Thermodynamique Appliquée, Faculté des Sciences de Tunis, Université de Tunis El Manar, El Manar II, Tunis 2092, Tunisia
4
Laboratory of valorization of useful materials, National Center of Materials Sciences Research, Technopole Borj Cedria, BP 73, Soliman 8027, Tunisia
5
Australian Centre for Neutron Scattering, Australian Nuclear Science and Technology Organisation, Sydney 2234, Australia
6
School of Chemistry, The University of Sydney, Sydney 2006, Australia
*
Author to whom correspondence should be addressed.
Processes 2020, 8(3), 305; https://doi.org/10.3390/pr8030305
Submission received: 10 February 2020 / Revised: 1 March 2020 / Accepted: 3 March 2020 / Published: 6 March 2020
(This article belongs to the Special Issue Materials Processing for Production of Nanostructured Thin Films)

Abstract

:
A new member of sodium metal diphosphate-diarsenate, Na2CuP1.5As0.5O7, was synthesized as polycrystalline powder by a solid-state route. X-ray diffraction followed by Rietveld refinement show that the studied material, isostructural with β-Na2CuP2O7, crystallizes in the monoclinic system of the C2/c space group with the unit cell parameters a = 14.798(2) Å; b = 5.729(3) Å; c = 8.075(2) Å; β = 115.00(3)°. The structure of the studied material is formed by Cu2P4O15 groups connected via oxygen atoms that results in infinite chains, wavy saw-toothed along the [001] direction, with Na+ ions located in the inter-chain space. Thermal study using DSC analysis shows that the studied material is stable up to the melting point at 688 °C. The electrical investigation, using impedance spectroscopy in the 260–380 °C temperature range, shows that the Na2CuP1.5As0.5O7 compound is a fast-ion conductor with σ350 °C = 2.28 10−5 Scm−1 and Ea = 0.6 eV. Na+ ions pathways simulation using bond-valence site energy (BVSE) supports the fast three-dimensional mobility of the sodium cations in the inter-chain space.

Graphical Abstract

1. Introduction

The research exploration of new inorganic materials with open framework constructed of polyhedra sharing faces, edges and/or corners forming 1D channels, 2D inter-layer spaces or 3D networks where cations are located, is currently an area of intense activity including several disciplines, in particular solid-state chemistry. In particular, alkali metal phosphates were found to have various applications because of their electric, piezoelectric, ferroelectric, magnetic, and catalytic properties [1,2,3,4]. Among those, the families of materials with the melilite structure [5], the olivine structure [6] and the natrium super ionic conductor (NaSICON) structure [7], attracted attention for their ionic conduction and exchange of ions [6,7].
More recently, in a series of studies arsenate analogs have been synthesized [8,9,10]. But, until today phosphate compounds are more studied as cathodes [11,12] compared to arsenate and this is perhaps due to the toxicity of arsenic III (As2O3). However, the oxide of arsenic V (As2O5) is less toxic. In addition, the introduction of arsenic into a structure changes its physical and chemical properties and even toxicity. On the other hand, the comparison of the electrochemical properties of LiCoPO4 and LiCoAsO4 both with olivine structure and close unit cell parameters, shows reversible (de)intercalation from/into material at average voltages of 4.8 and 4.6 V, respectively for LiCoAsO4 [10] and a voltage average of 2.5–5 V for LiCoPO4 [11].
The Na2MP2O7 systems (M = transition metal) [13,14] have a layered structure with the layers [MP2O7]n2n− and the sodium cations localized in the interlayer space, which favors high ionic conductivity. We recently investigated the effect of the substitution of P by As with a larger ionic radius for ionic conductivity and showed the improvement of ionic conductivity for Na2CoP1.5As0.5O7 [
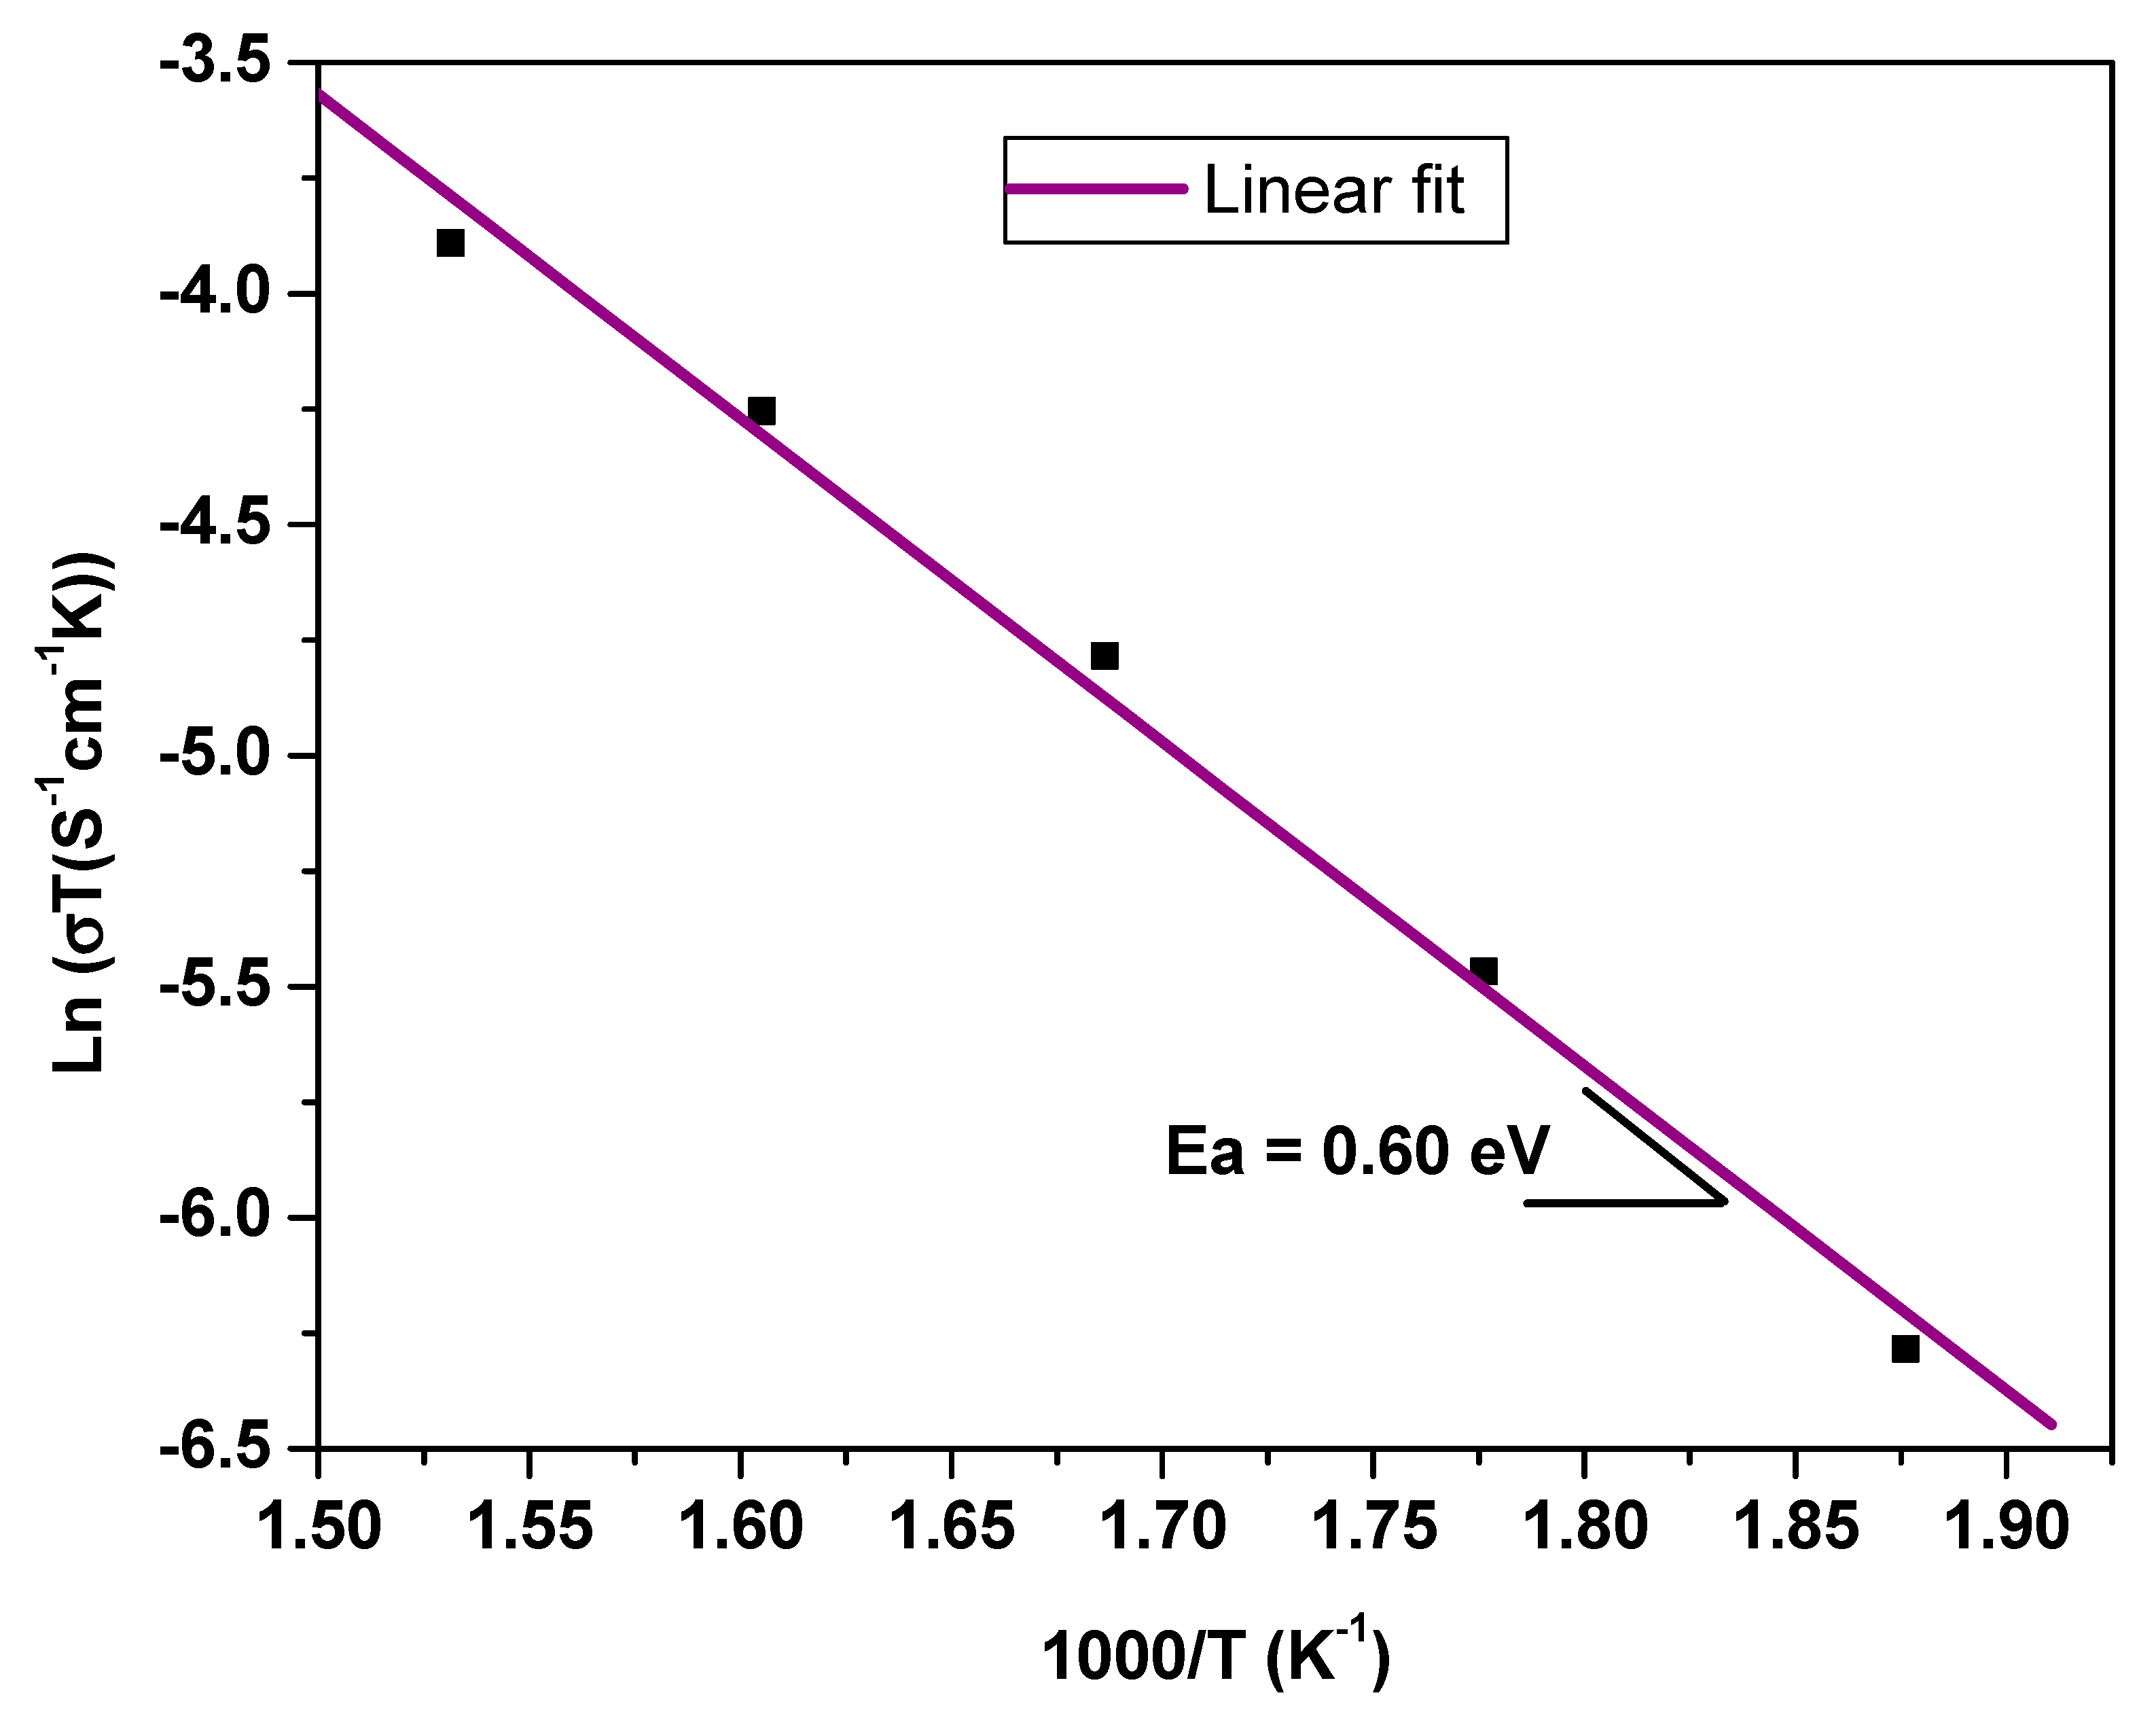
15], which has an electrical conductivity value of σ240 °C = 7.91×10⁻⁵ Scm−1 and an activation energy Ea = 0.56 eV compared to Na2CoP2O7300 °C = 2 × 10⁻⁵ Scm−1; Ea = 0.63 eV) [13].
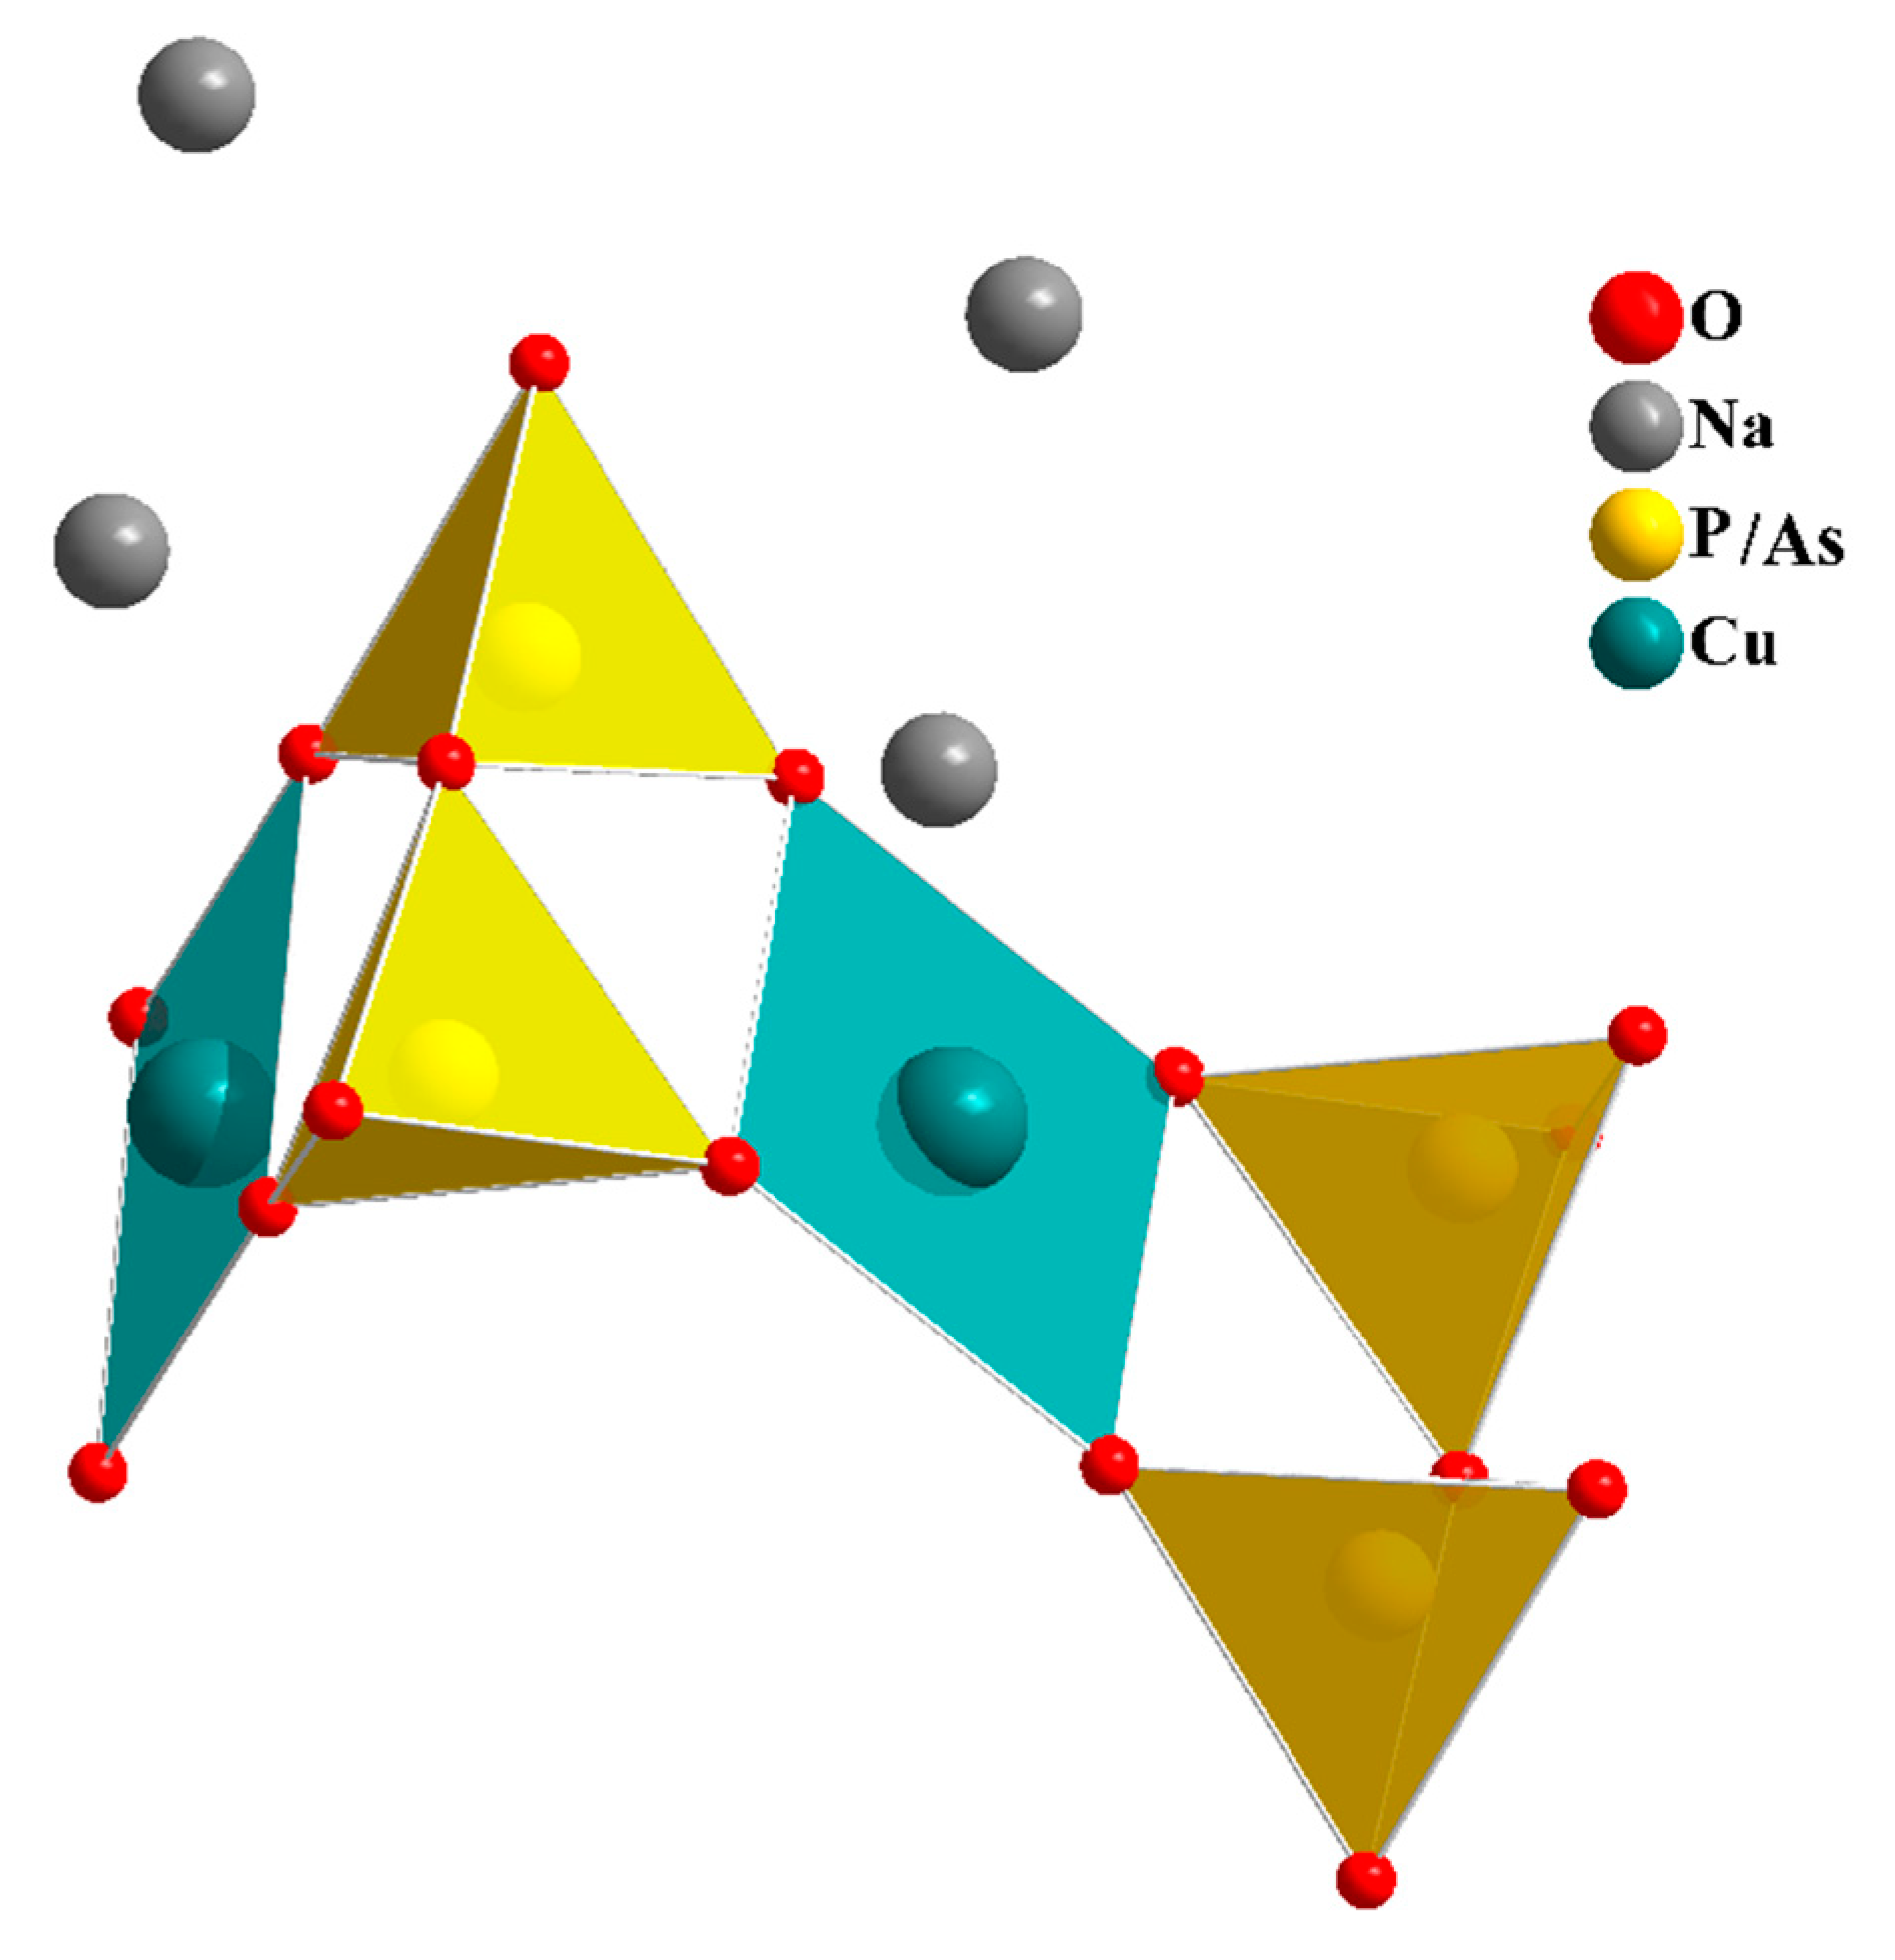
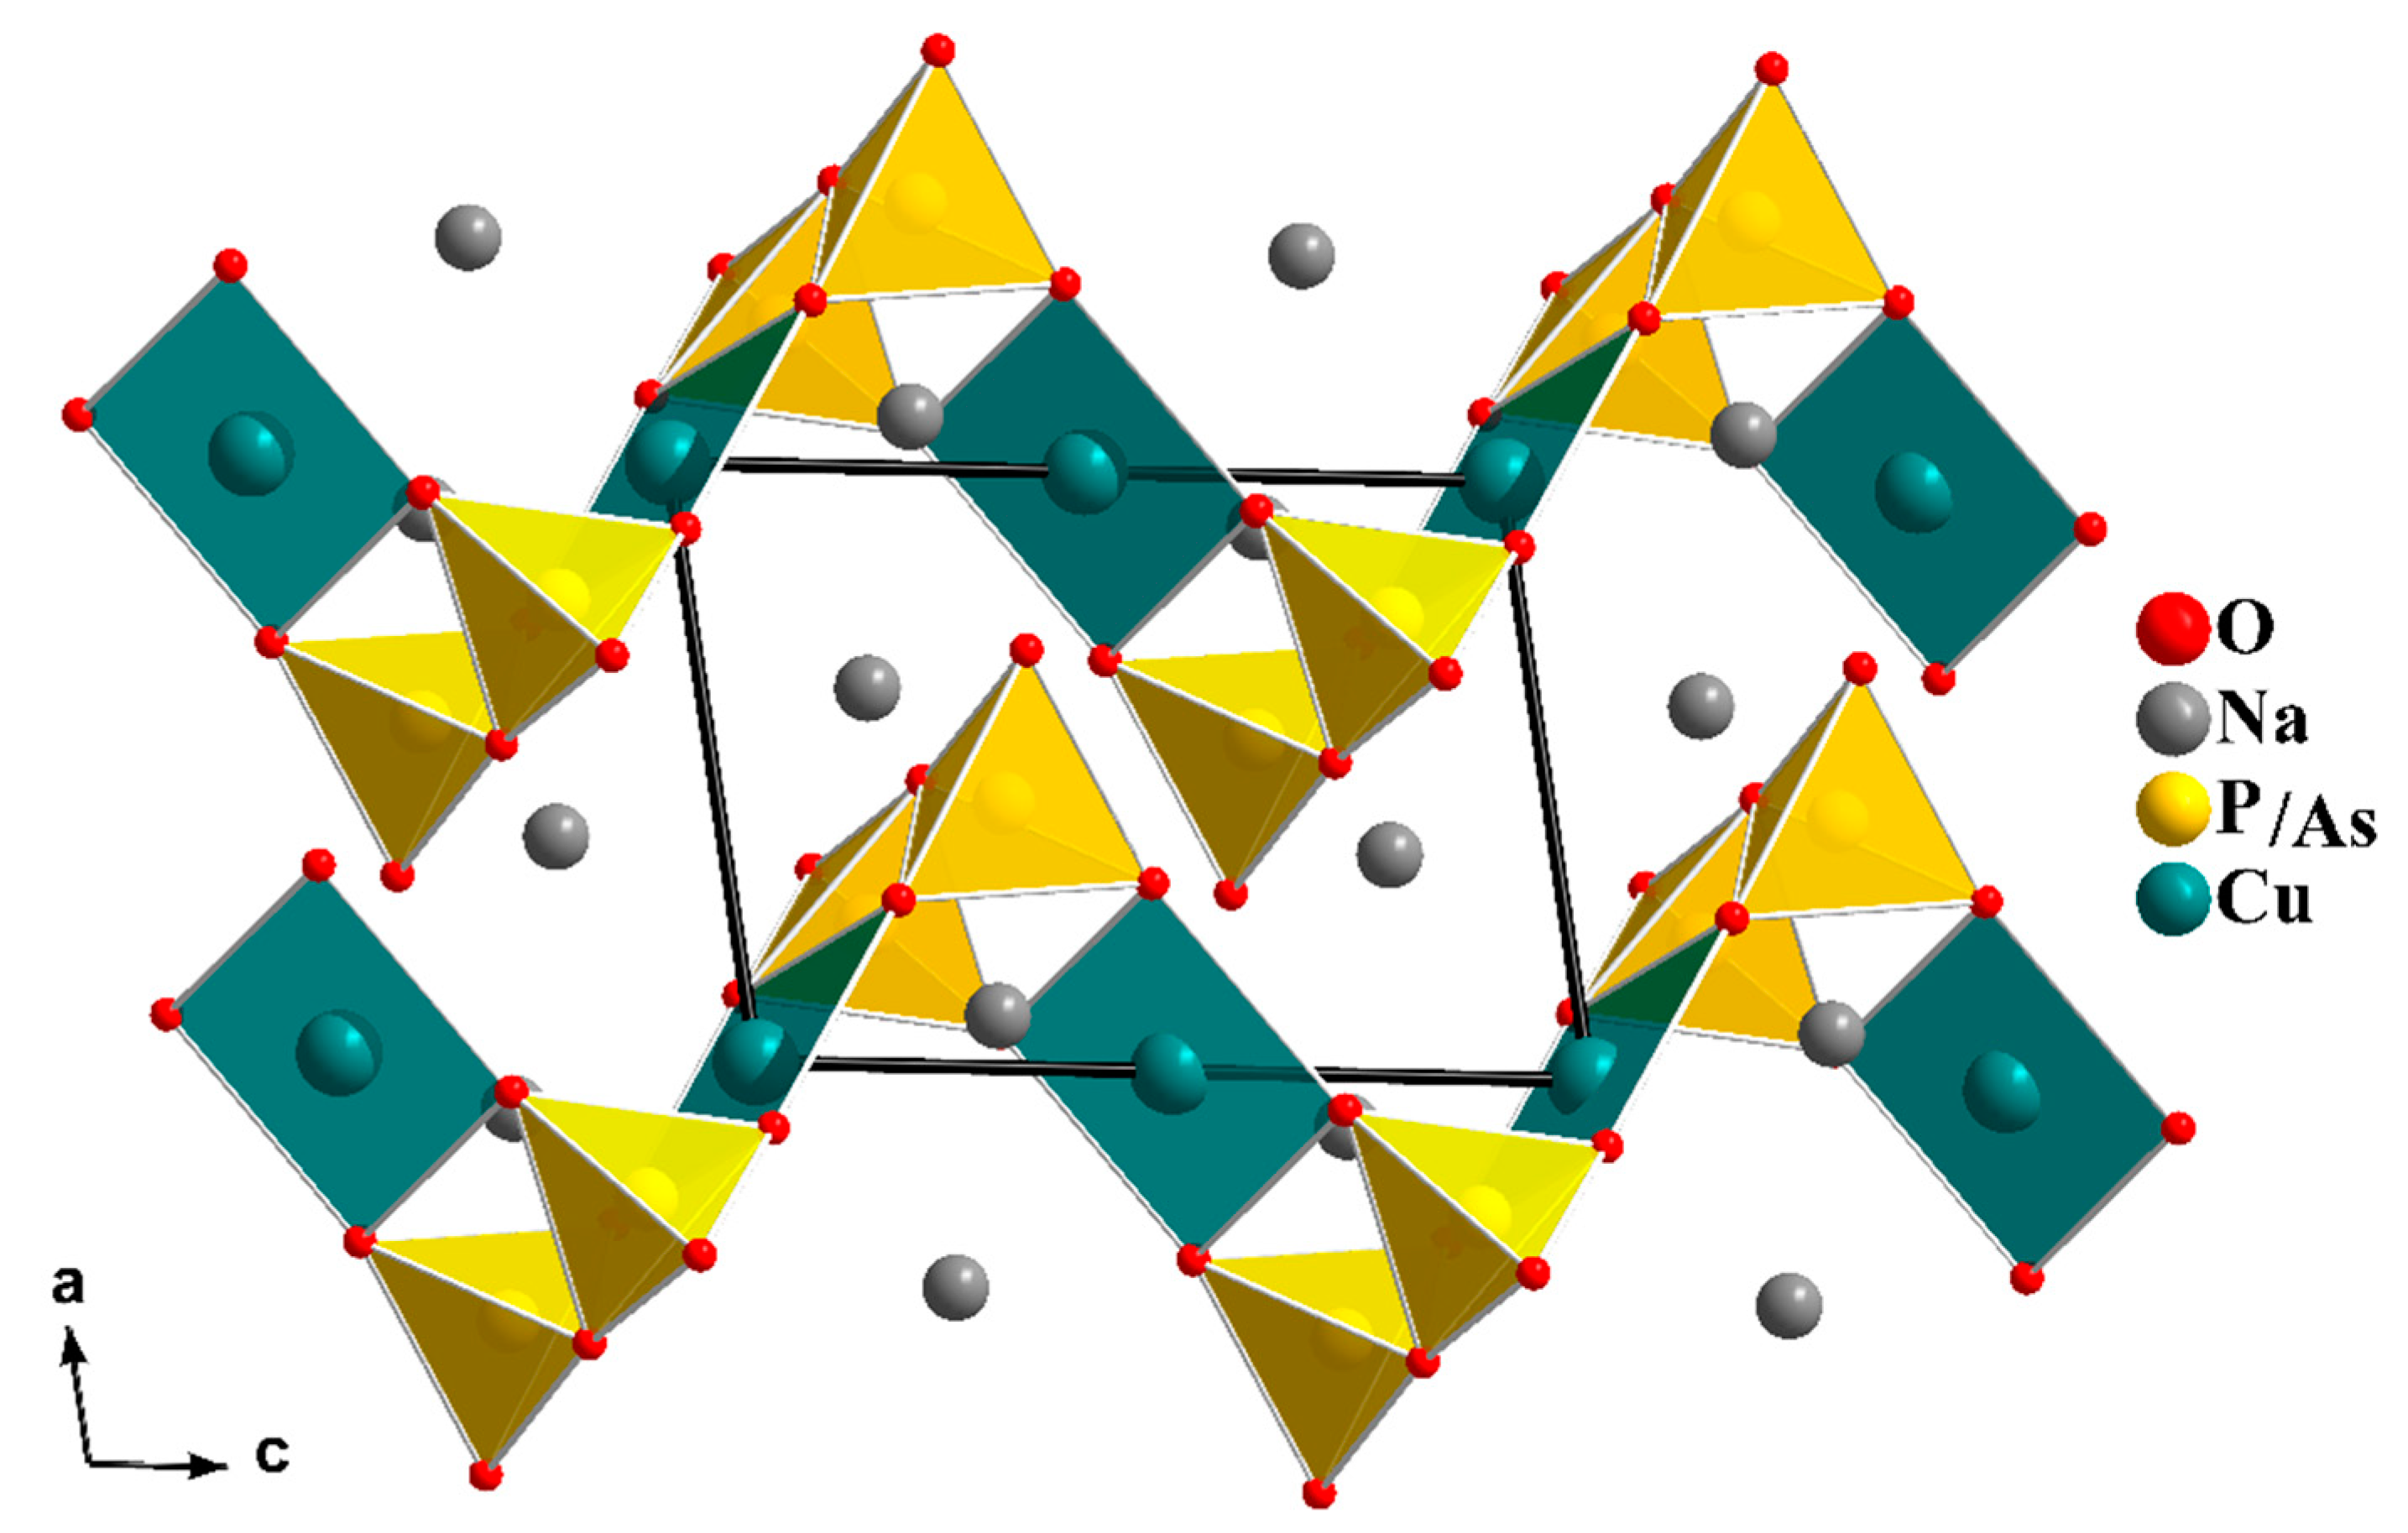
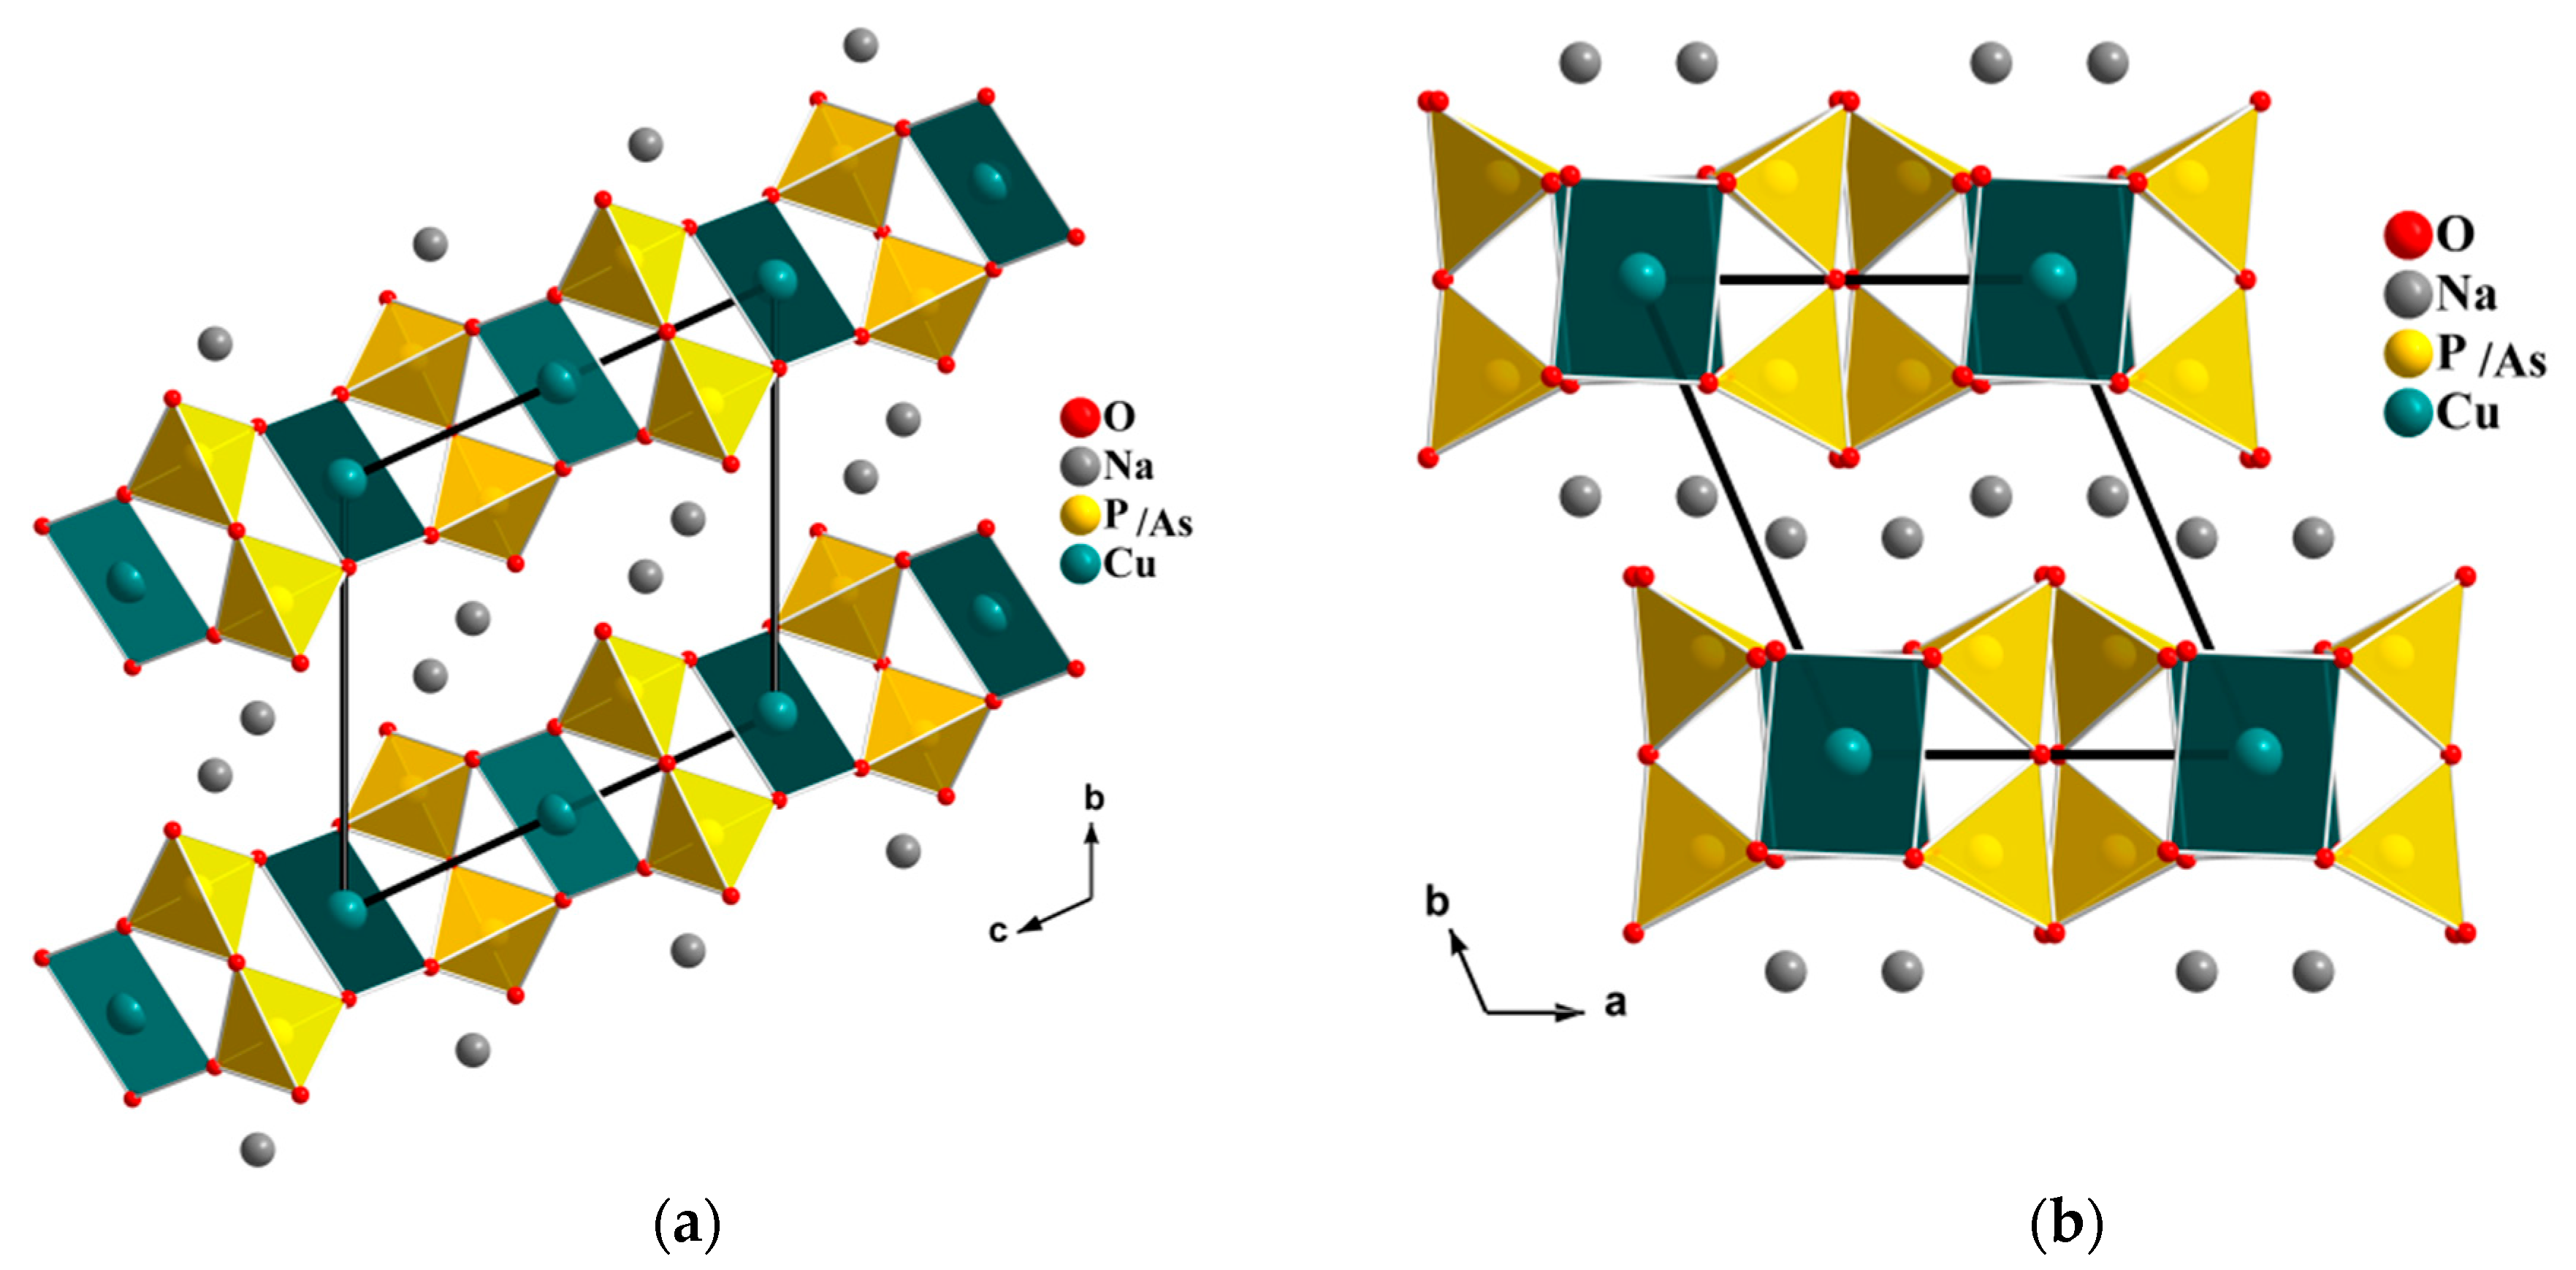
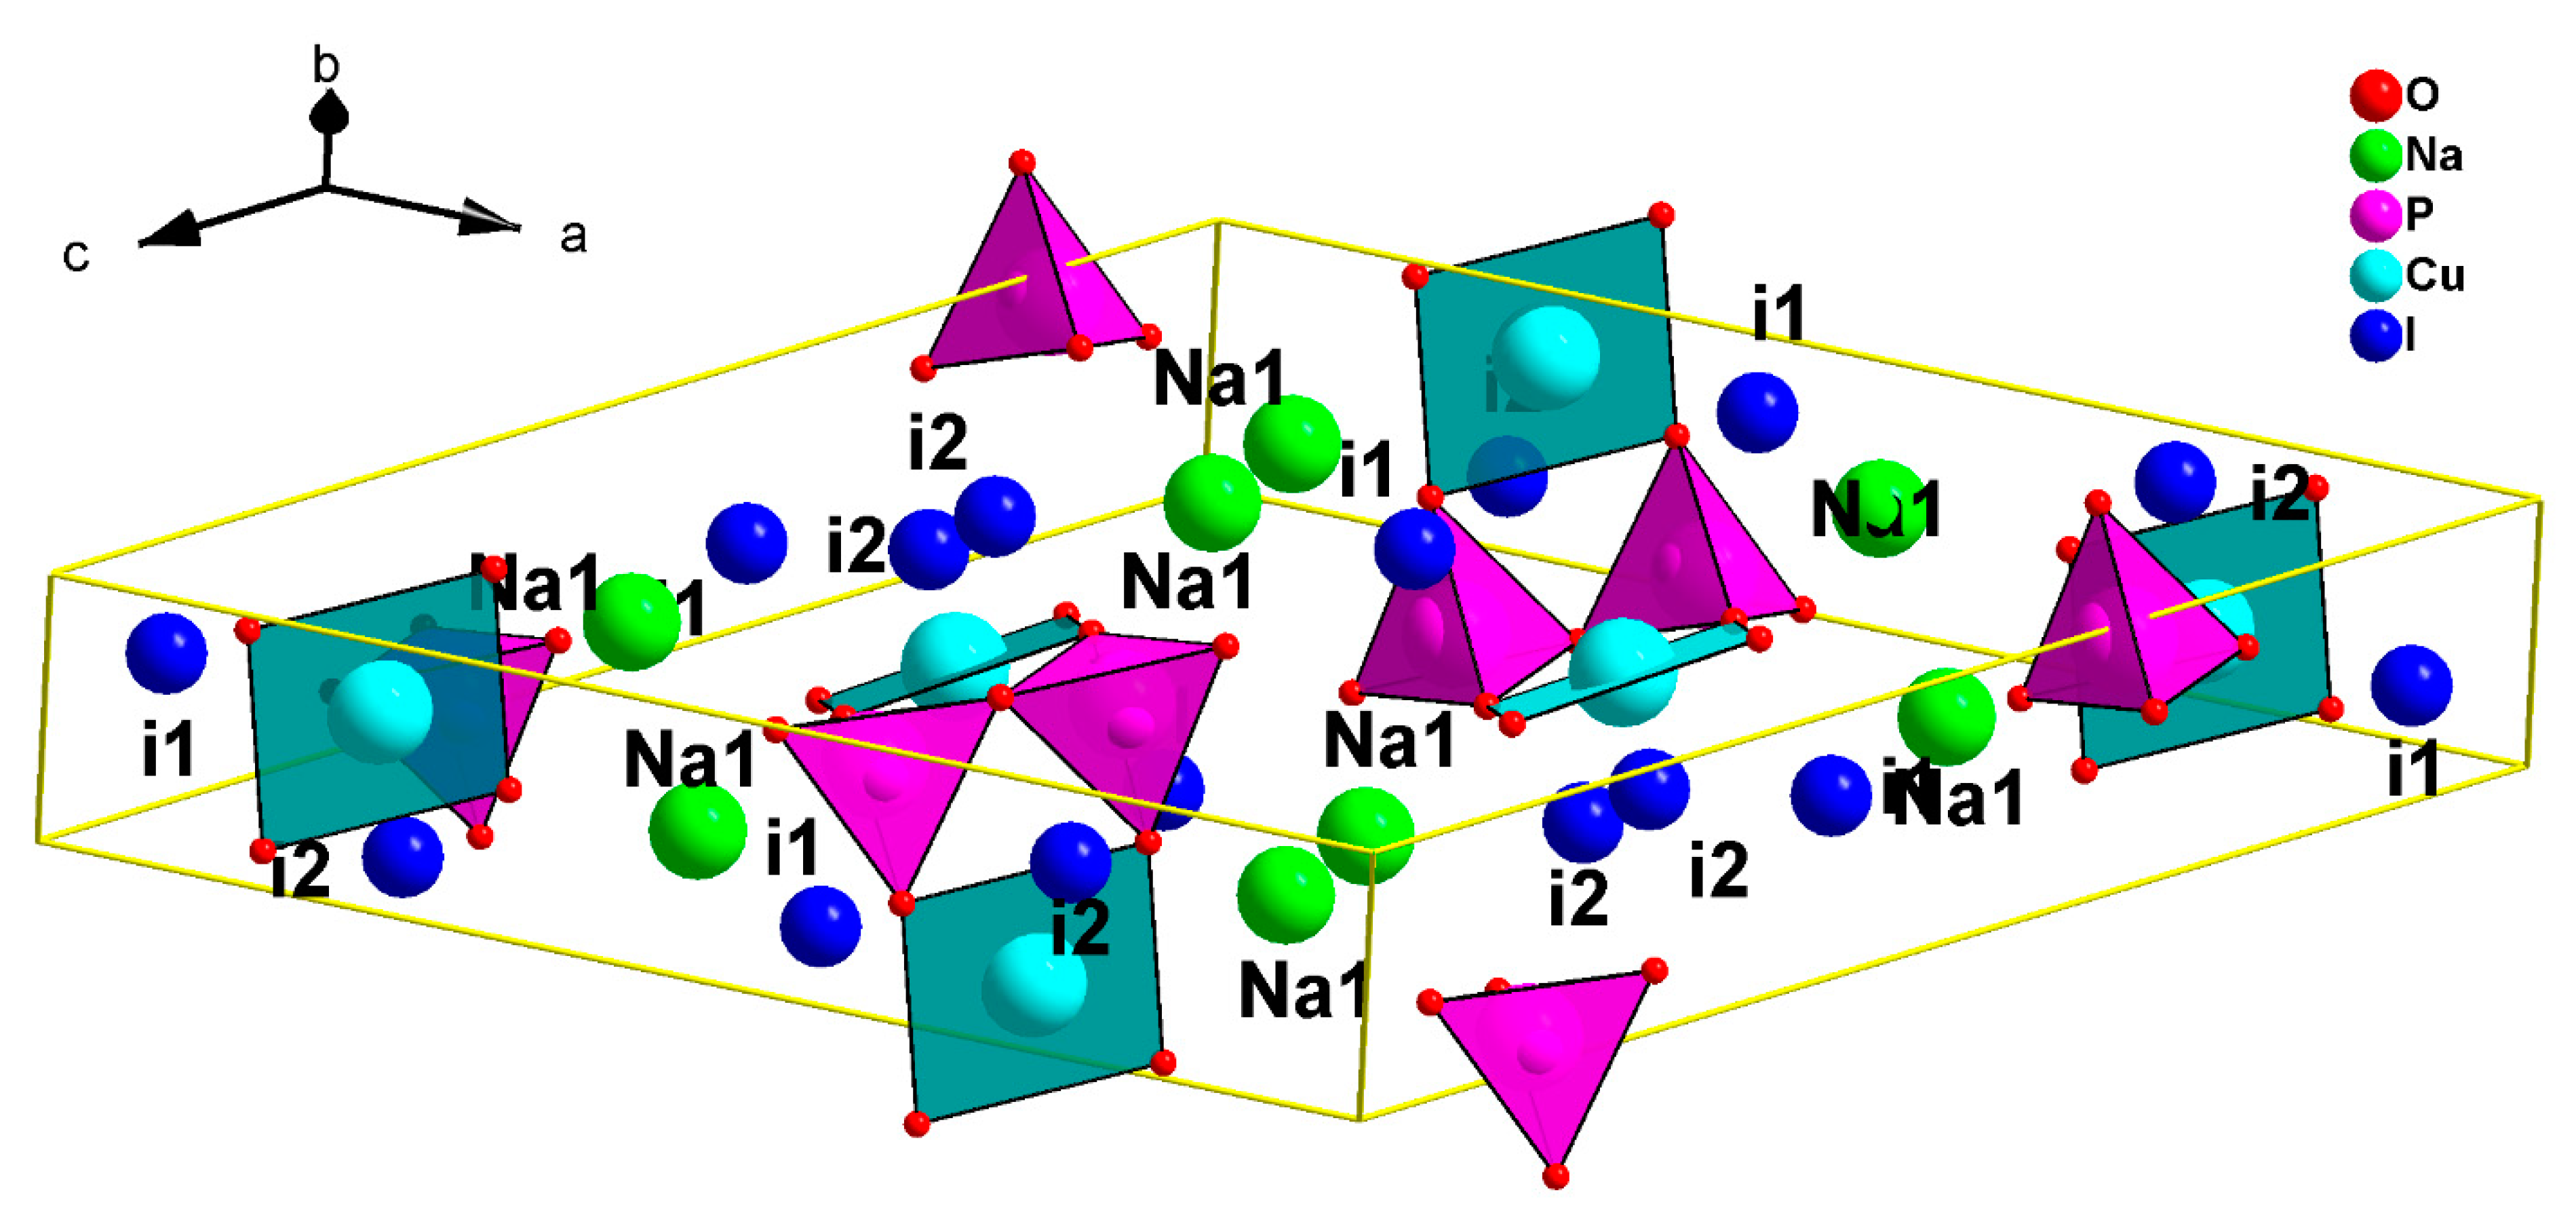
In our search for new polyanion oxides of sodium and transition metals, the exploration of the Na2O-CuO-P2O5-As2O5 crystallographic systems allowed us to isolate a new member of di-phosphate arsenates, Na2CuP1.5As0.5O7, in the polycrystalline powder form. In this paper, characterizations and physicochemical studies of the new member of sodium copper diphosphate-diarsenate material, Na2CuP1.5As0.5O7, and a comparison with other previous works encountered in the literature will be presented.

2. Materials and Methods

A mixture of Cu(NO3)2.2.5H2O, NH4H2PO4 and Na2HAsO4.7H2O in the molar ratio Na:Cu:P:As equal to 2:1:1.5:0.5 was placed in a porcelain crucible and heated to 350 °C for 24 h to eliminate the volatile products H2O, NO2, and NH3. The obtained powder was ground manually using agate mortar and shaped as cylindrical pellets by a uniaxial press. The obtained pellets were heated to 600 °C. After 72 h, the sample was cooled slowly at a rate of 10 °C/h down to room temperature. After grinding finely, a blue polycrystalline powder was obtained.
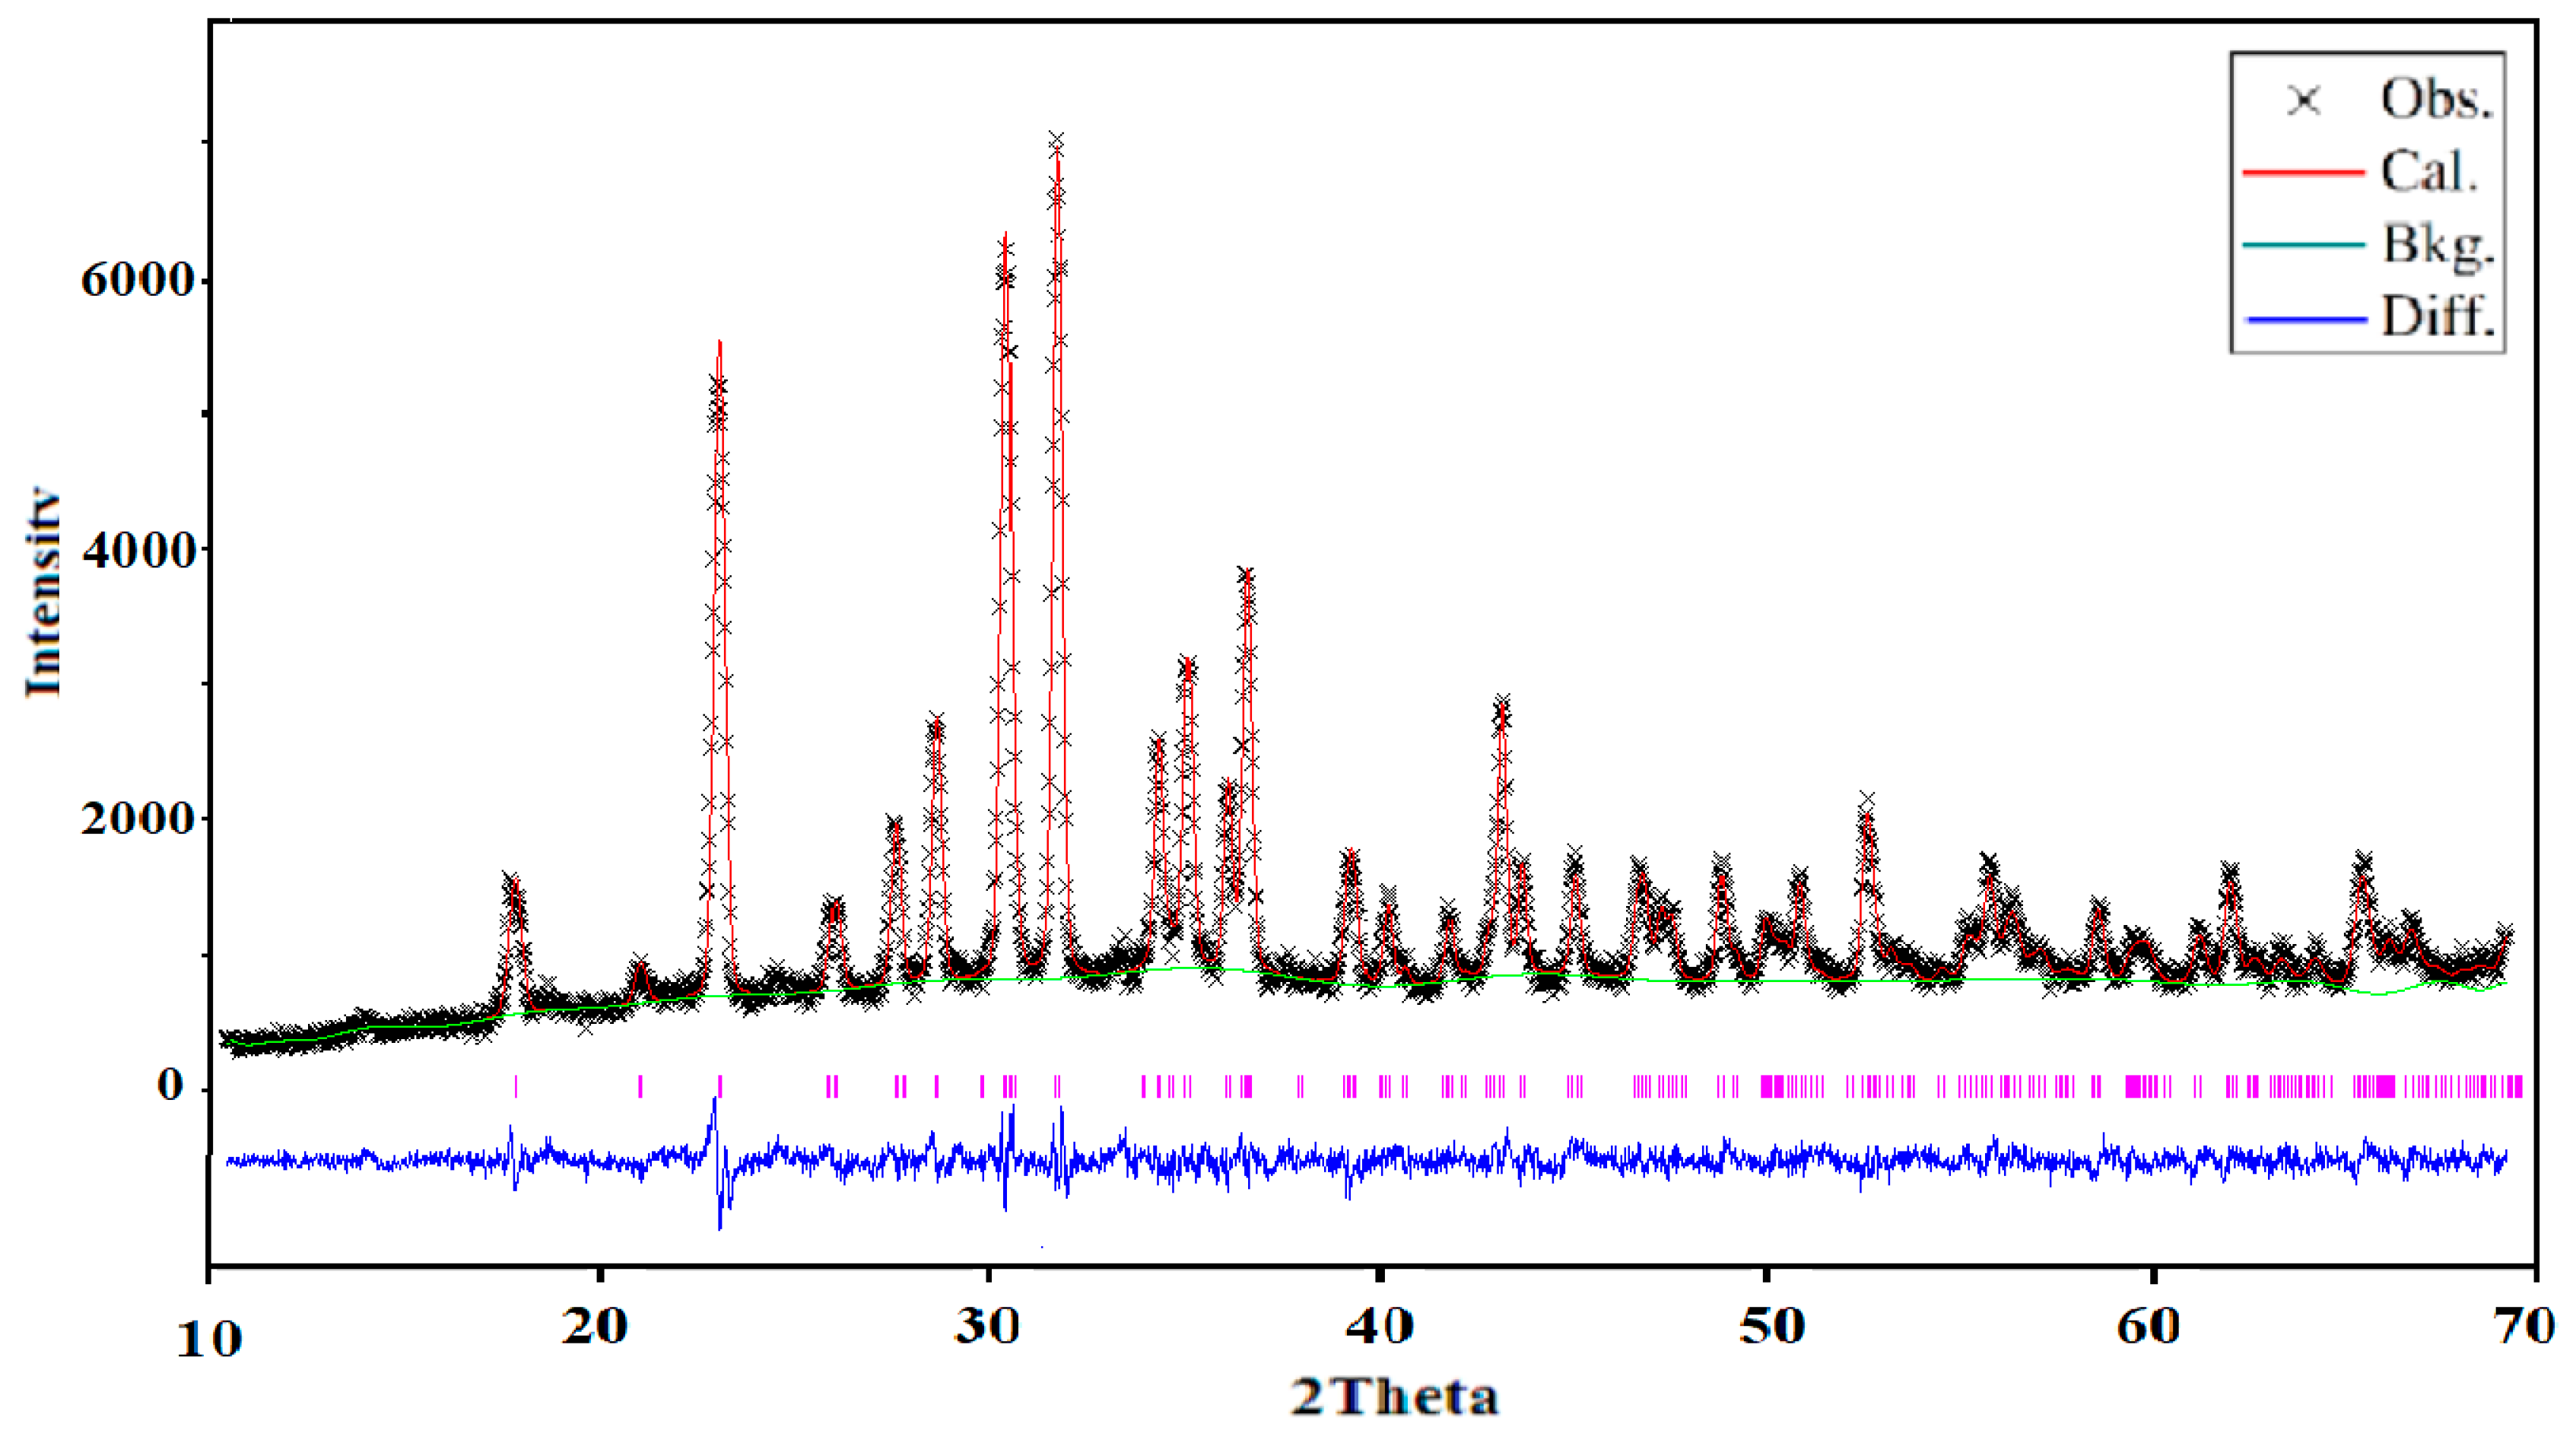
X-ray powder diffraction (XRD) was used to control and ensure the purity of the obtained powder. The analysis was carried out using XRD-6000 (Shimadzu, Japan) with graphite monochromator (Cukα, λ = 0.154178 nm) and a scan range of 2θ = 10°–70° with step of about 0.02°. The structure was refined using the Rietveld method by the means of the GSAS computer program [16] (EXPGUI, Gaithersburg, Maryland, USA). The crystallographic data of Na2CuP2O7 [17] was used as a starting set. The obtained structural model was confirmed by the Charge Distribution CHARDI model of validation. The CHARDI calculation was done by using the CHARDI2015 computer program (Nespolo, IUCR) [18].
FTIR spectrometer (Agilent Technologies Cary 630 model) was used to allow a direct indexation of the peaks on a spectral range in wave numbers ranging from (1300–400 cm−1).
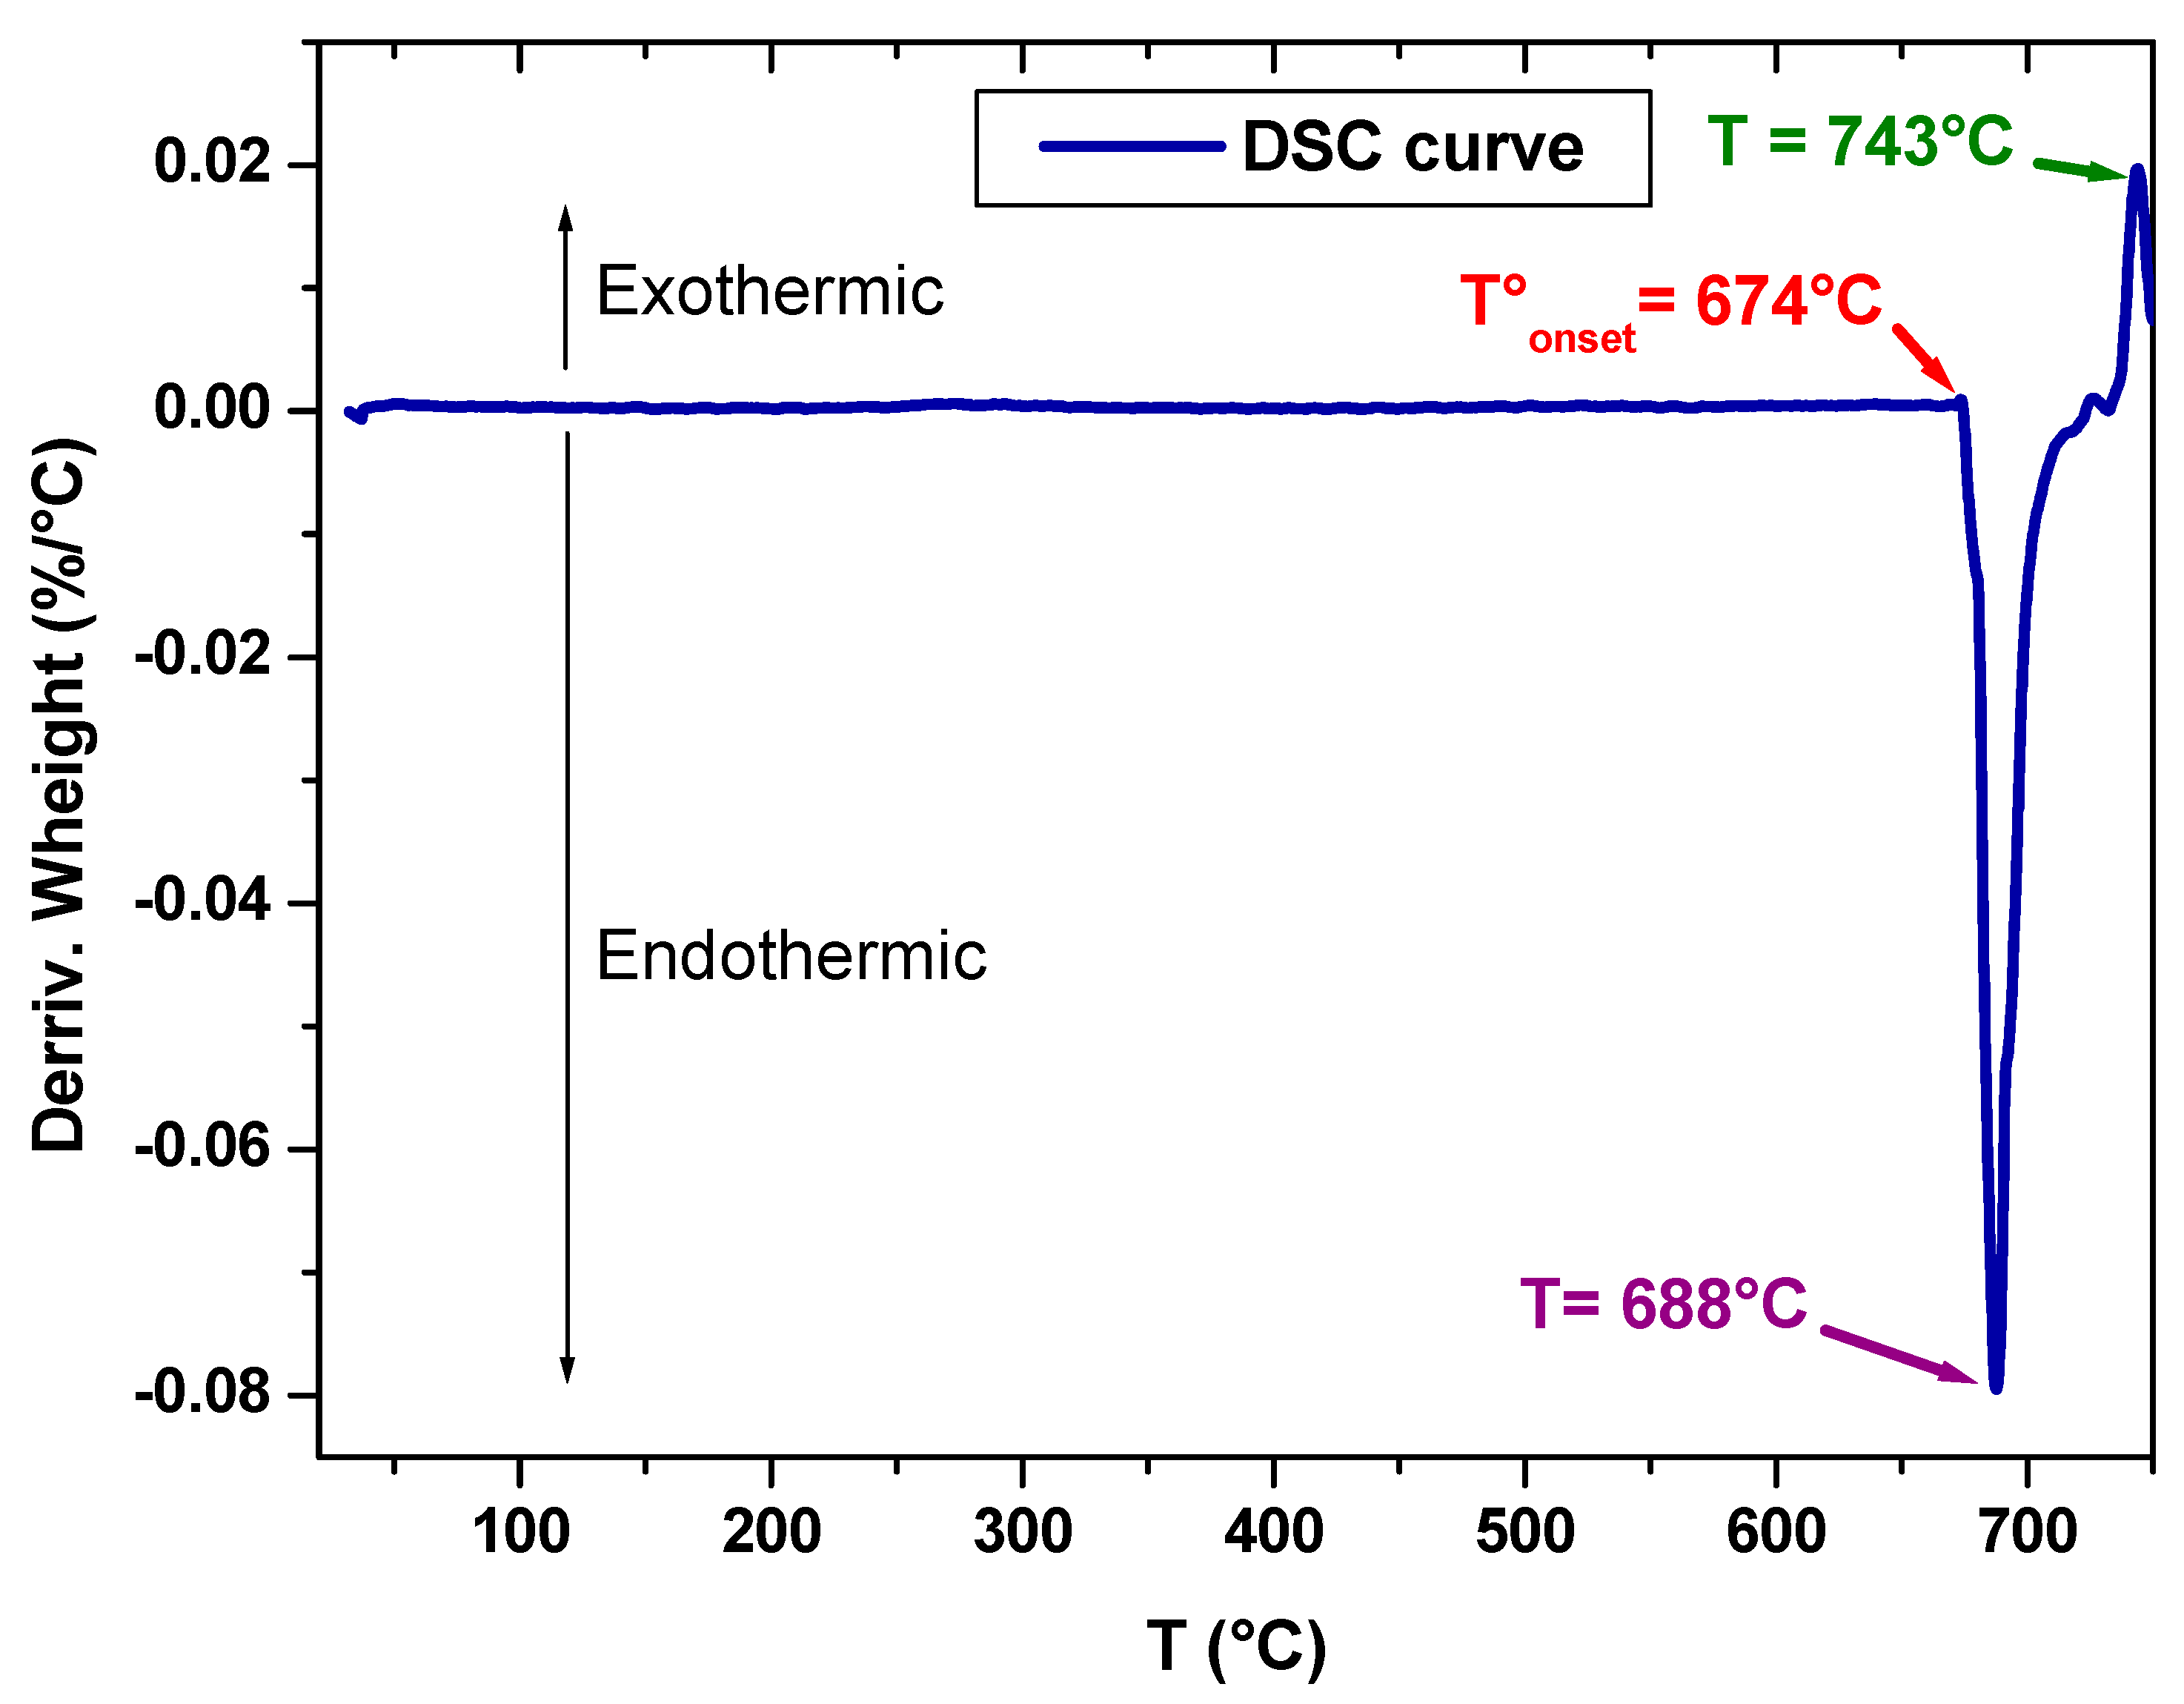
Differential scanning calorimetry (DSC), with the SDT Q600 model, was used to study the thermal behavior of the obtained and prepared sample. In fact, the device contains two crucibles, one as a reference and the other contains the sample to be analyzed. These two crucibles are heated to 750 °C at a rate of 10 °C/min. The thermal analysis was carried out under a nitrogen atmosphere to avoid the reaction of the sample with the oxygen in the air.
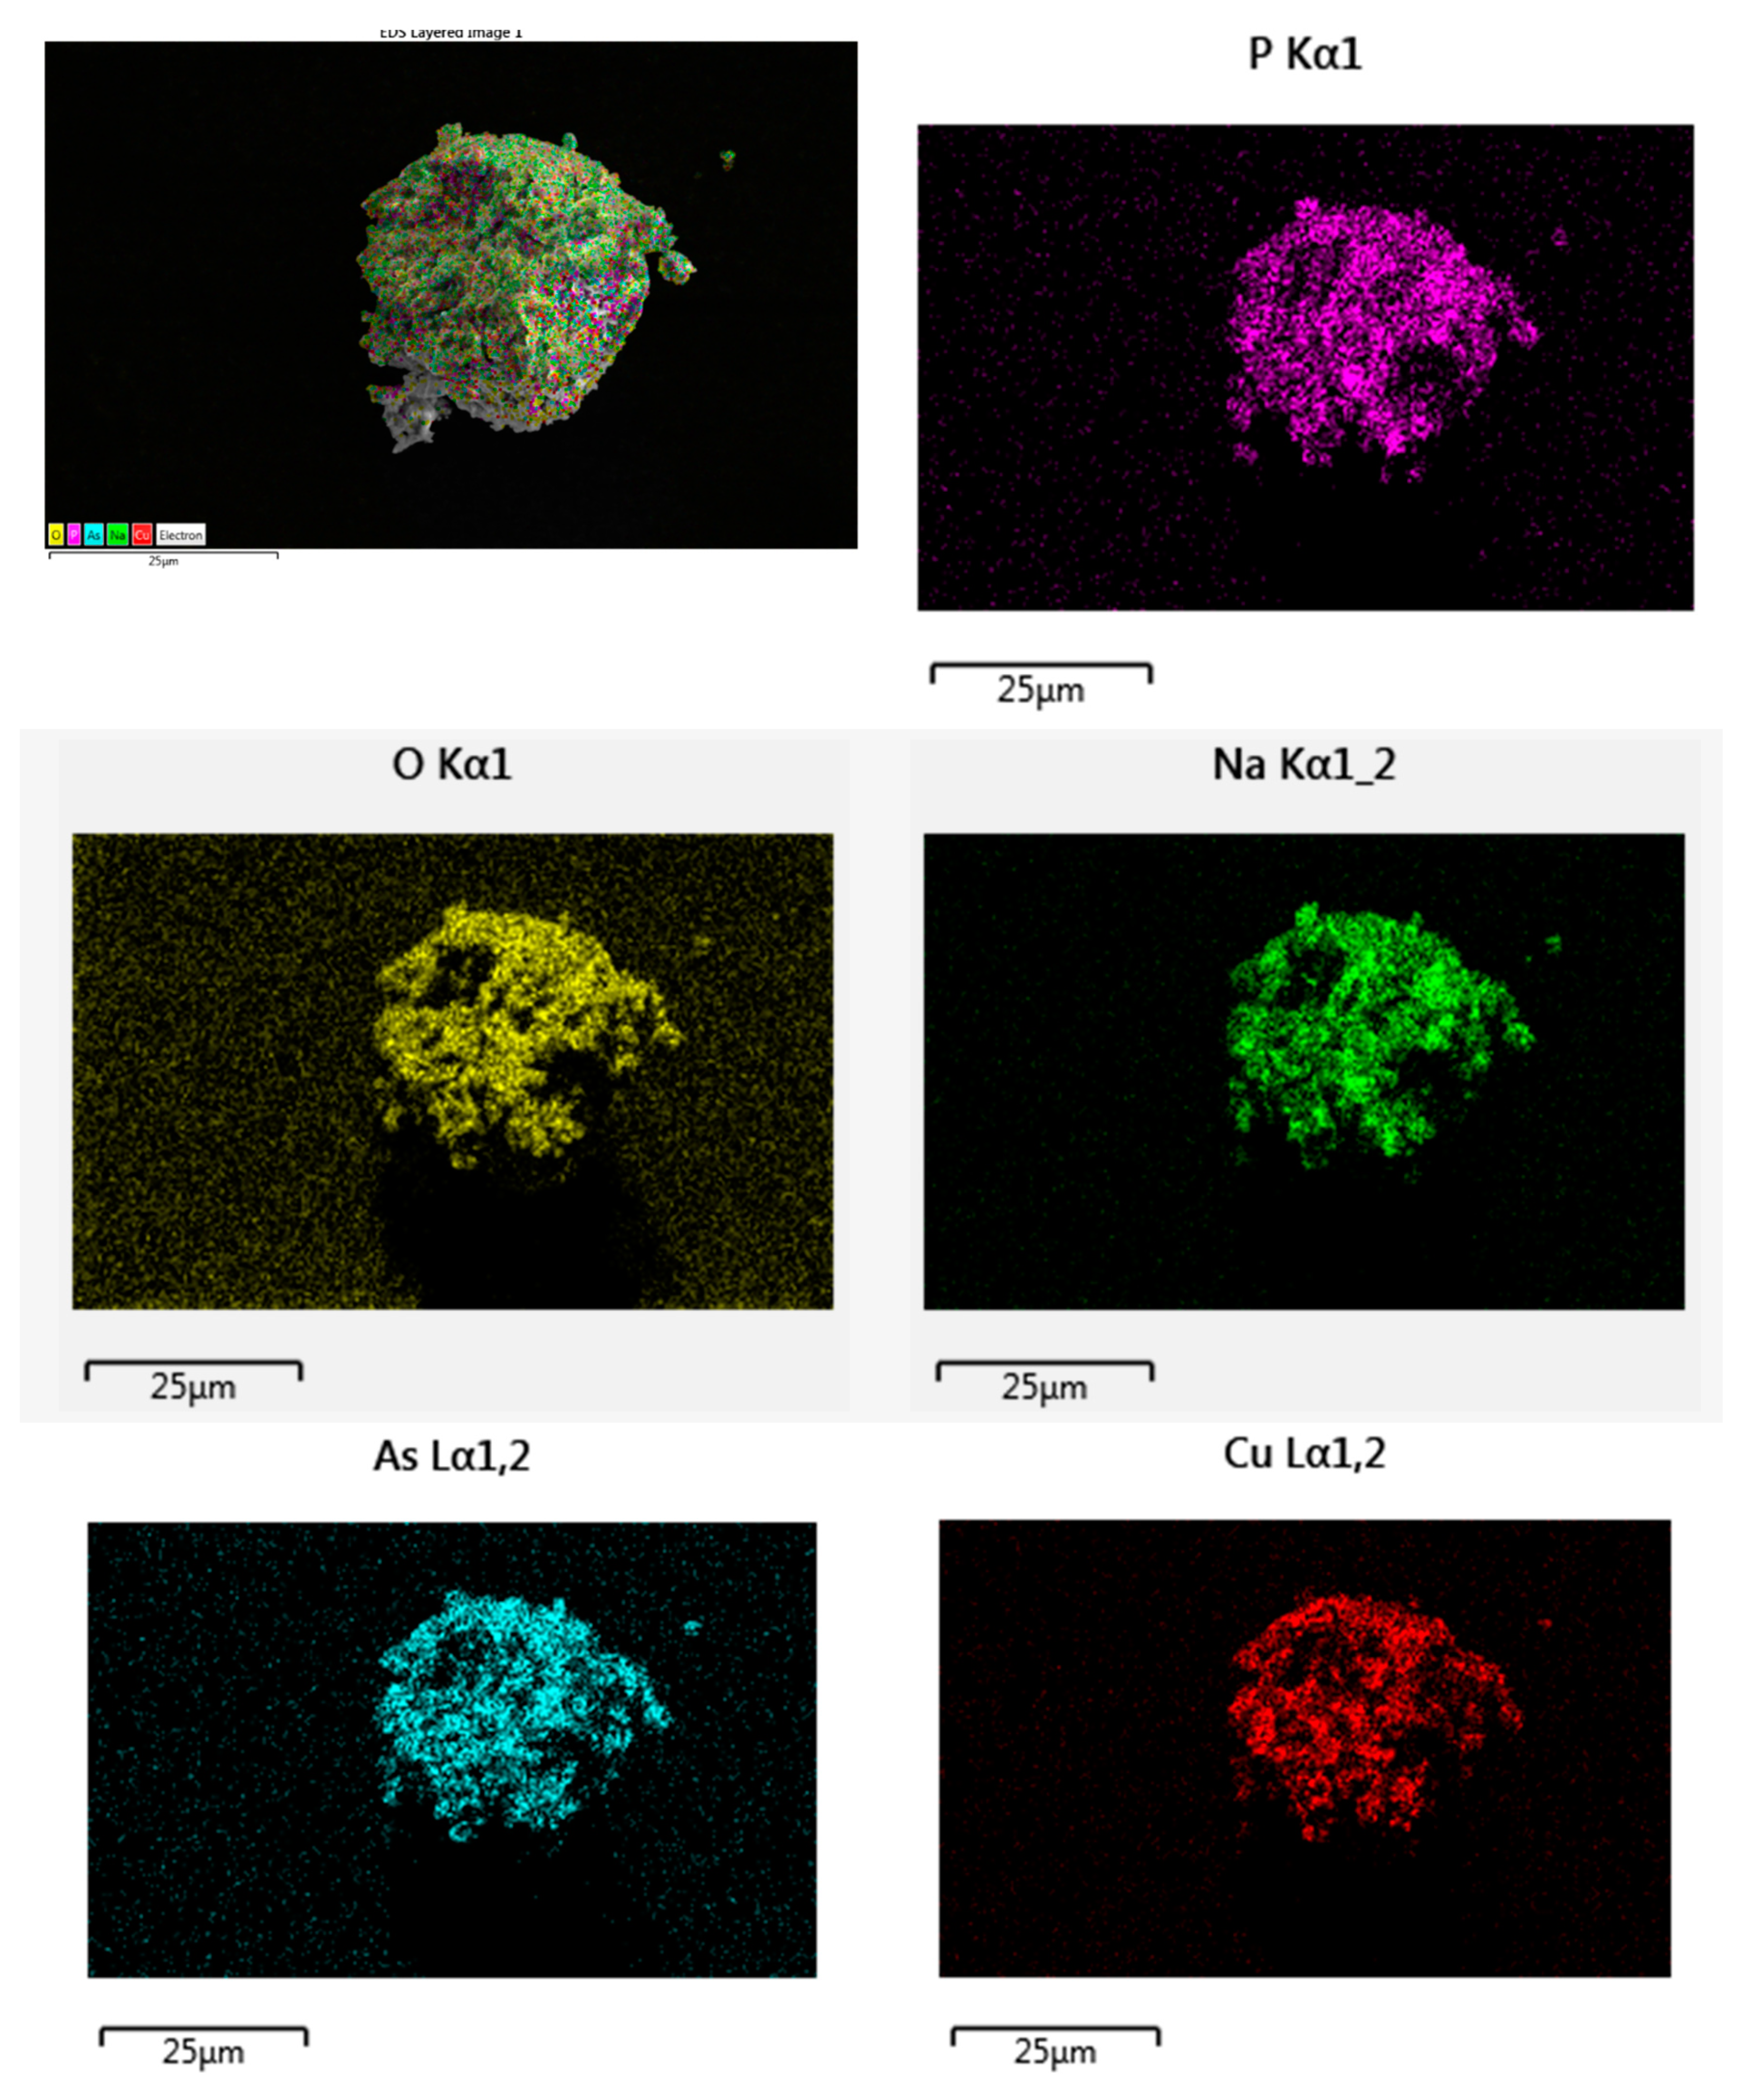
Energy-dispersive X-ray spectroscopy (EDX) and scanning electron microscopy (SEM, Thermo Fisher Scientific model), were used to identify the present elements and the microstructure of the studied material, respectively.
The electrical measurements were preceded by pretreatment of the sample in order to densify the measured sample by reducing the mean particle size of the synthesized powder. Mechanical grinding for 100 min was carried out using the FRISCH planetary micromill pulverisette 7. The polycrystalline sample was shaped as a cylindrical pellet using a uniaxial press. The pellet was sintered in air at an optimal temperature of 610 °C for 2 h with 5 °C/min heating and cooling rates. The geometric factor of the dense ceramic is g = e/S = 0.793 cm−1 where e and S are the thickness and face area of pellet, respectively. Gold metal electrodes ~36 nm thick were deposited using a SC7620 mini sputter coater. The sample was then placed between two platinum electrodes that were connected by platinum cables to the frequency response analyzer (HP 4192A) which was controlled by a microcomputer.
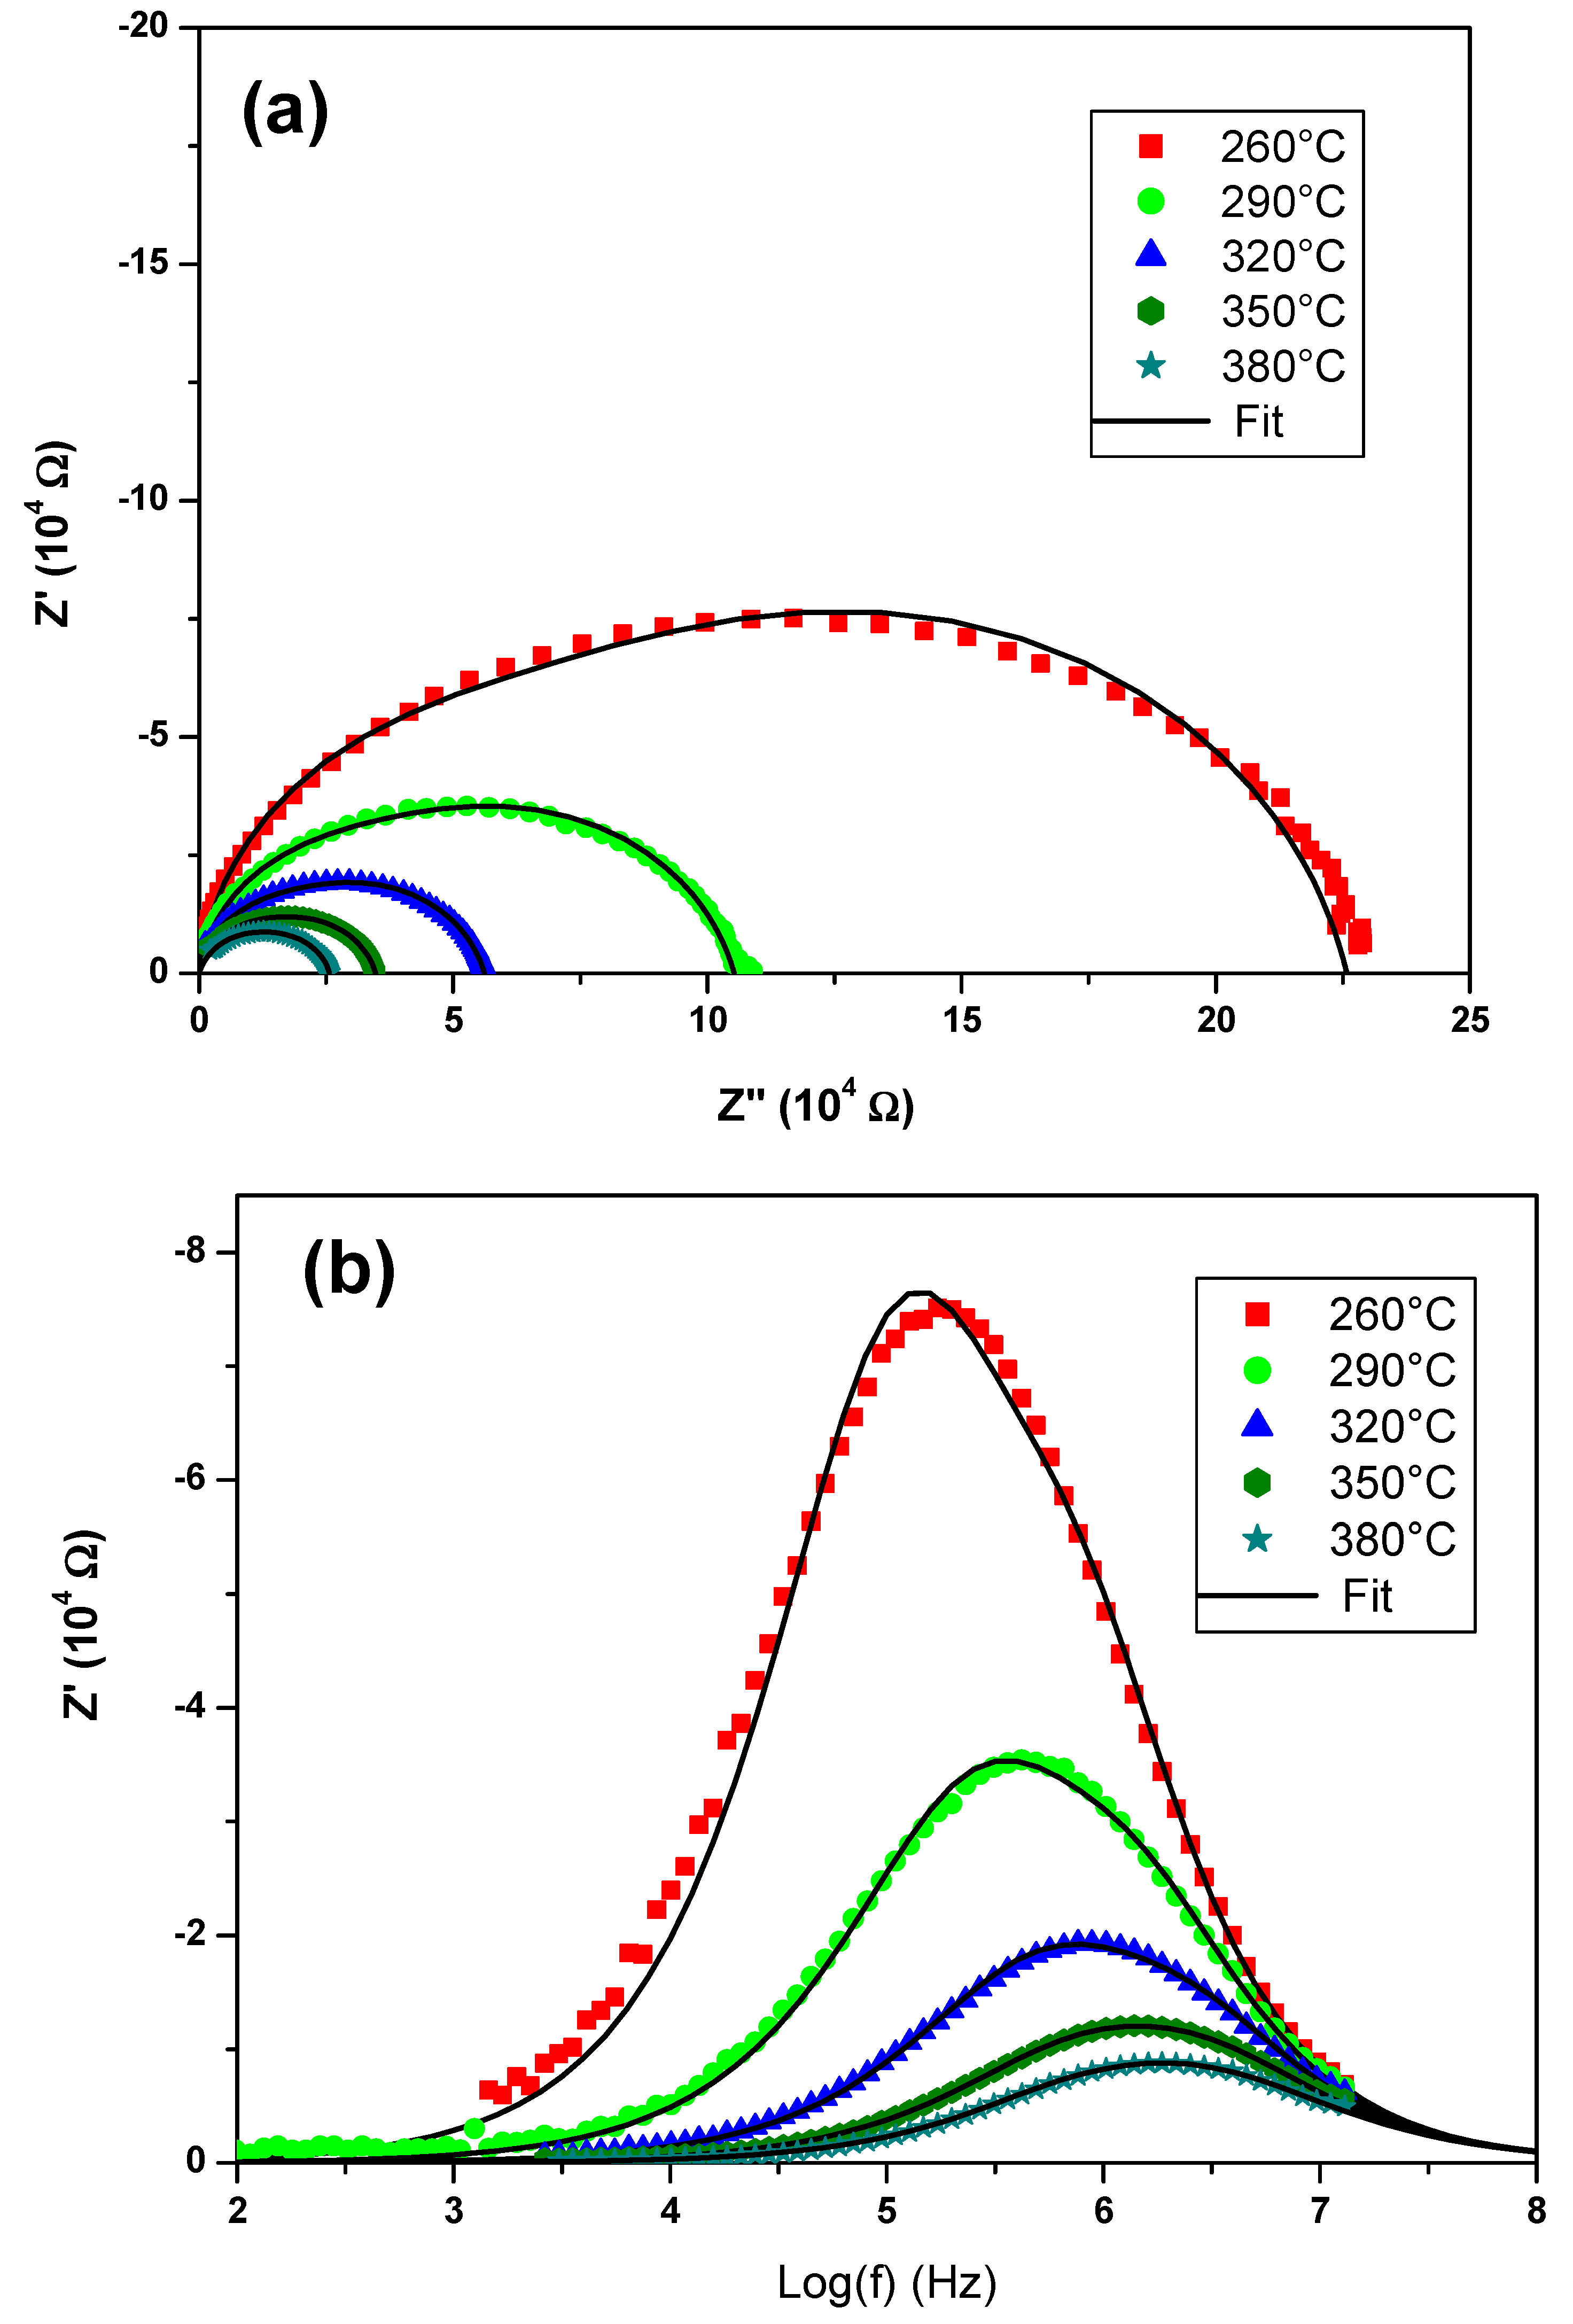
Impedance spectroscopic measurements were performed via the Hewlett-Packard 4192-A automatic bridge supervised by HP workstation. Impedance spectra were recorded with 0.5 V AC-signal in the 5 Hz–13 MHz frequency range.
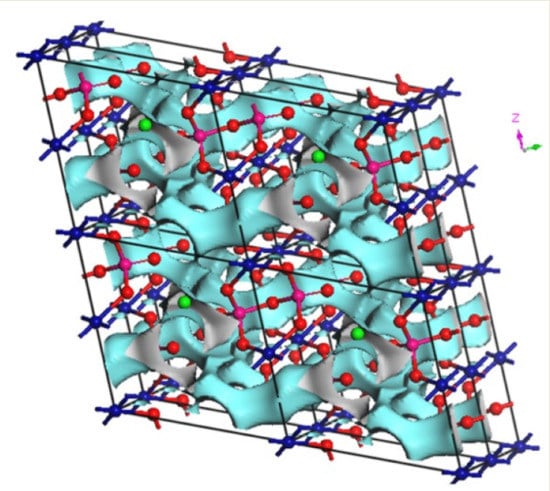
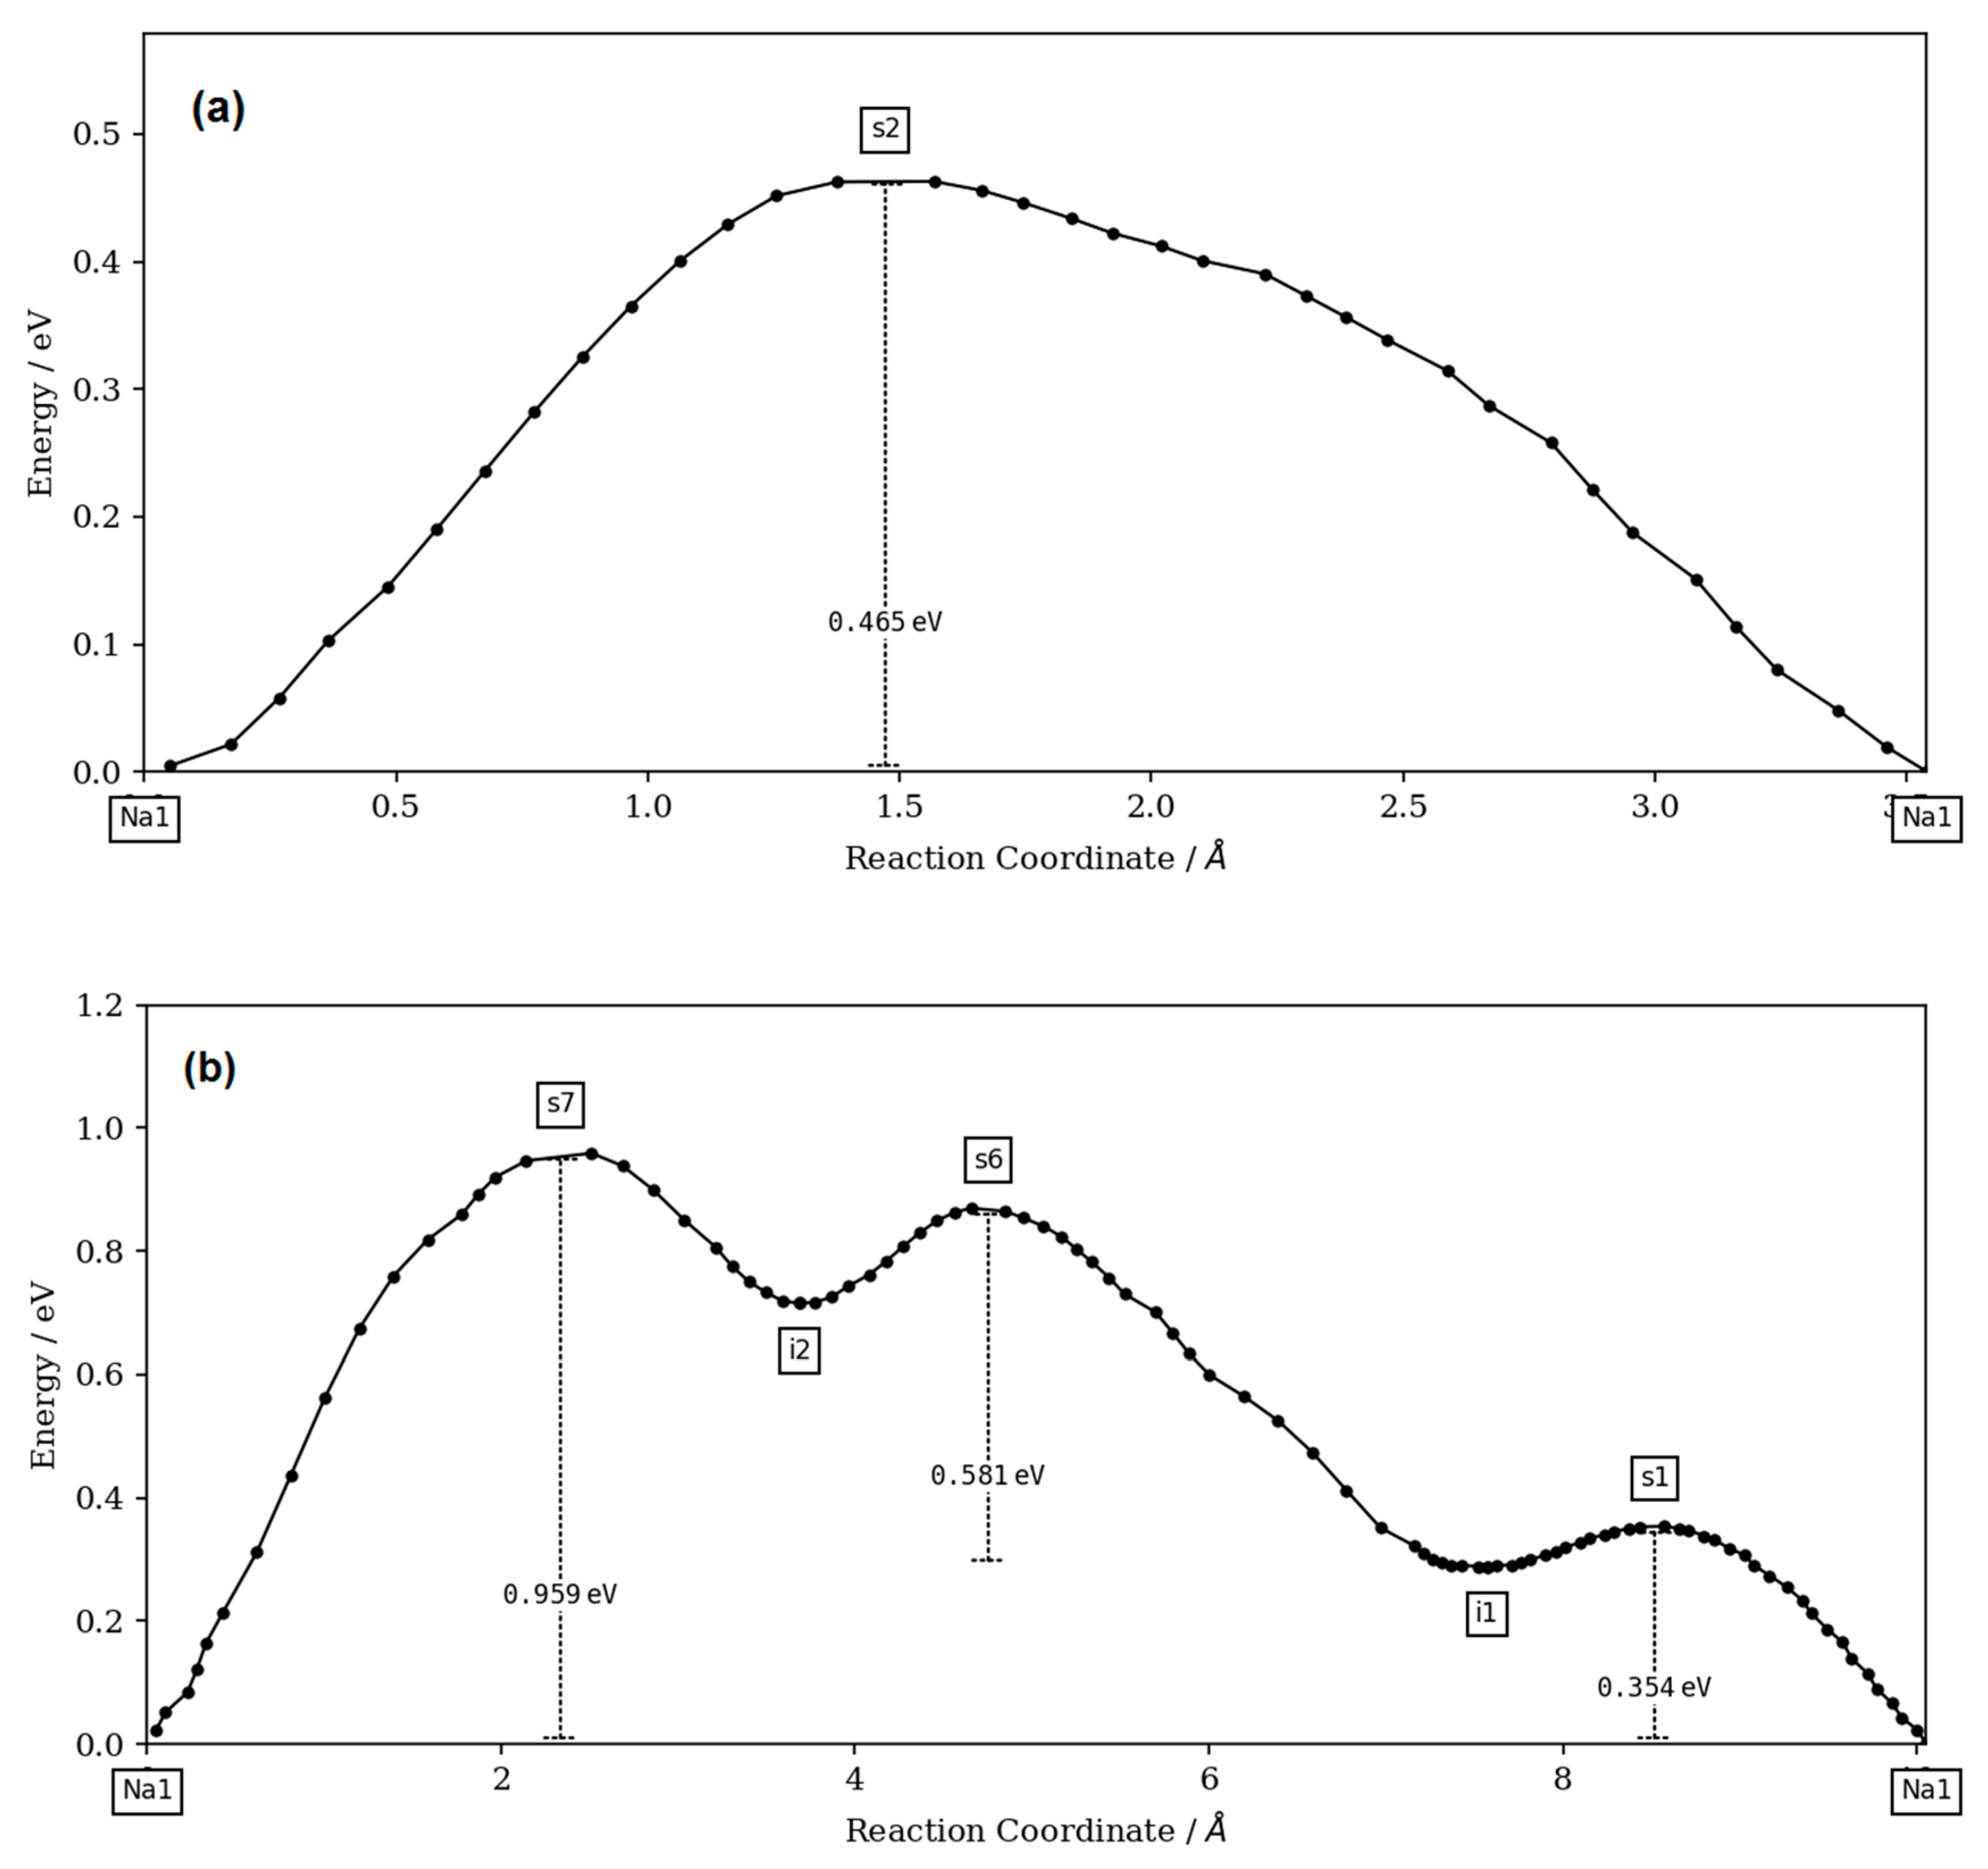
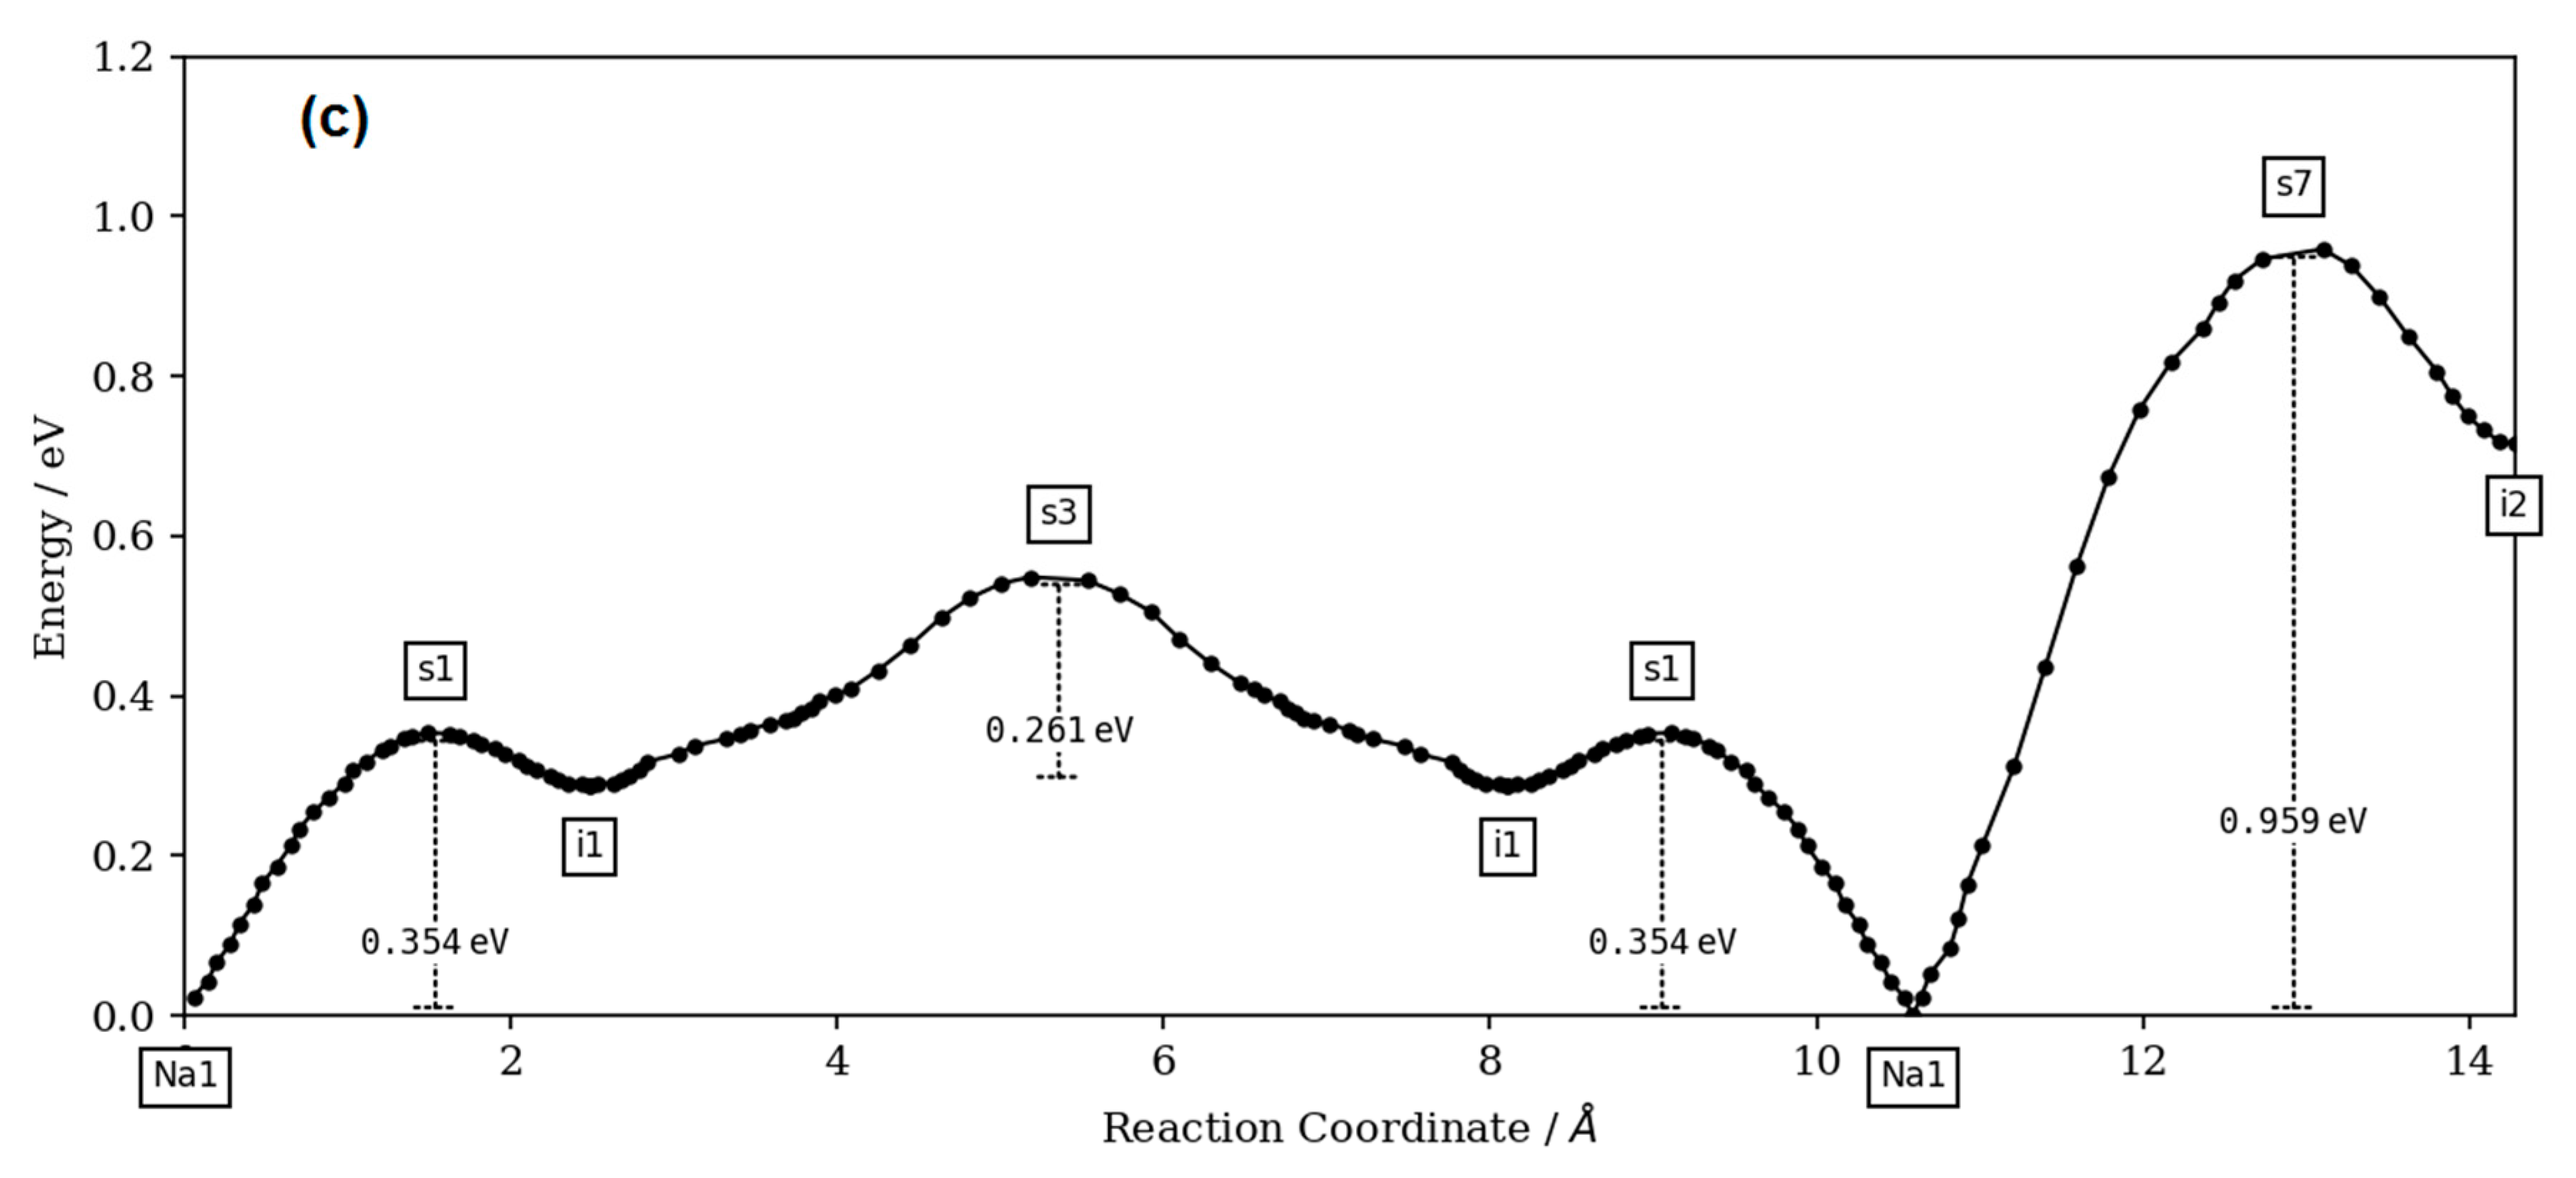
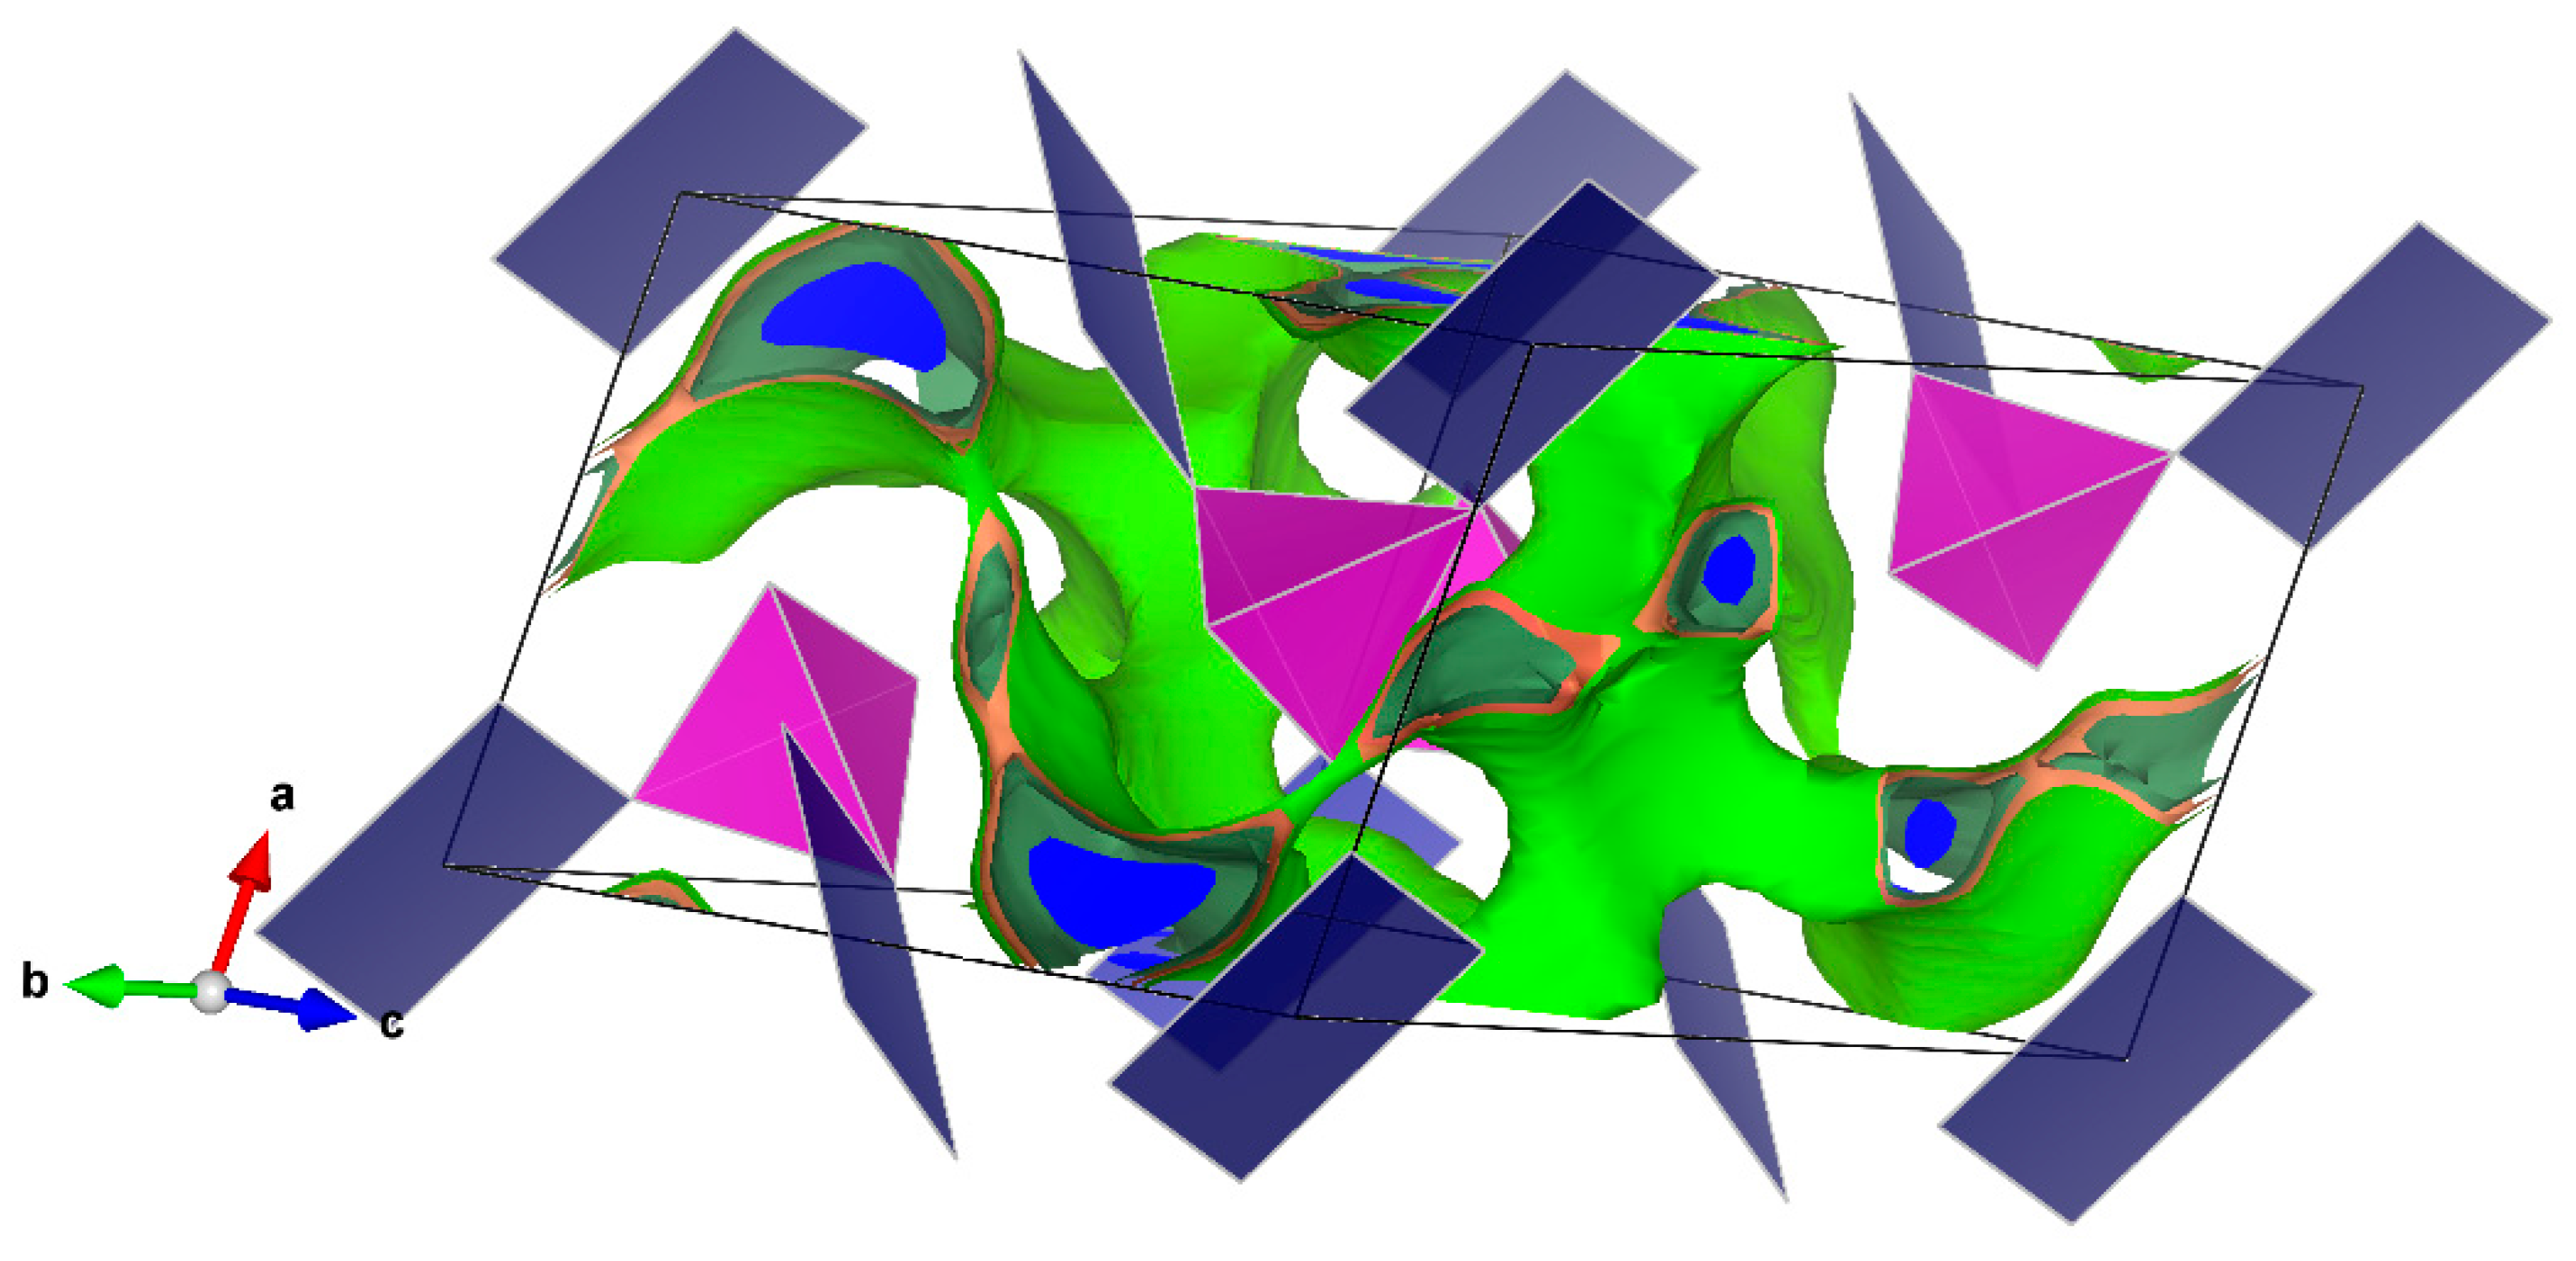
The bond-valence site energy (BVSE) model [19,20] was used to simulate the alkali migration in the 3D anionic framework. The BVSE model is the latest extension of the bond-valence sum (BVS) model developed by Pauling [21] to describe the formation of inorganic materials. The BVS model was improved by Brown & Altermatt [22] followed by Adams [23], resulting in the expression:
s A X = exp ( R 0 R A X b )
where sA-X is individual bond-valence, RA-X is the distance between counter-ions A and X, R0 and b are fitted empirical constants, and R0 is the length of a bond of unit valence.
The BVSE model was extensively used in the cation motion simulation in the anionic framework by following the valence unit as a function of migration distance [24]. The valence unit was also recently related to potential energy scale and electrostatic interactions [19,20]. The BVSE method was used with success to simulate the transport pathways of monovalent cations (Na+; K+ and Ag+) in numerous materials including Na2CoP1.5As0.5O7 [15], Na1.14K0.86CoP2O7 [25] and Ag3.68Co2(P2O7)2 [26]. The BVSE calculations were performed using the SoftBV [27] code and the visualization of isosurfaces was carried out using VESTA3 software (version 3, Koichi Momma and Fujio Izumi, 2018).

3. Results and Discussion

3.1. X-ray Powder Diffraction

The crystallographic study was started by a simple comparison between the XRD pattern of the prepared materials in the Na2O-CuO-P2O5-As2O5 system and those of the previous studies of diphosphate Na2MP2O7 [5,7,14,28,29] and Na2CoP1.5As0.5O7 [15]. In this case, only the Na2CuP1.5As0.5O7 diffractogram showed a similarity with that of the β-Na2CuP2O7 diphosphate [17]. It crystallizes in the monoclinic system of the C2/c space group. This result prompted us to make a precise refinement using the Rietveld method which was implemented into the GSAS computer software [16]. The final agreement factors are Rp = 5.4% and Rwp = 6.9%. No additional peaks were detected. The final Rietveld plot is presented in Figure 1. The unit cell parameters obtained from the Rietveld refinement are a = 14.798(2) Å; b = 5.729(3) Å; c = 8.075(2) Å; β = 115.00(3)° (Table 1). The details of the crystallographic data, data collection and final agreement factors are given in Table 2. The atomic coordinates and isotropic displacement parameters are listed in Table 3. The main bond distances are given in Table 4. The charge distribution analysis and the bond-valence computation are summarized in Table 5.
By comparing the unit cell parameters of the studied material with those of β-Na2CuP2O7, the P/As substitution effect increases the volume of the unit cell (Table 1), which is explained by the distance of As―O bonds being greater than that of P―O.

3.2. Infrared Spectroscopy

The IR absorption spectrum of the studied Na2CuP1.5As0.5O7 material is shown in Figure 2. The spectrum shows the presence of the series of distinct bands attributed to asymmetric and symmetrical valence vibrations of the P-O-P and As-O-As bridges. These bands are characteristic of the pyrophosphate (P2O7)4− and diarsenate (As2O7)4− groups (Table 6) [30] and similar to those of the Li2CuP2O7 spectrum [31].

3.3. DSC Thermal Analysis

In order to determine the thermal stability of the studied compound, the DSC analysis was used in the range from room temperature to 750 °C. The analysis result is illustrated in Figure 3. An endothermic peak was observed at 688 °C. This peak corresponds to the melting point of our compound. While, an exothermal peak is shown at 743 °C, after the fusion, probably corresponds to the oxidation of fractions of Cu2+ to Cu3+ in the obtained liquid phase. Overall, the thermal analysis via DSC shows that Na2CuP1.5As0.5O7 material is stable up to a temperature of 674 °C. The sharpness of the endothermic peak in the DSC analysis suggests good crystallinity of our synthesized powder.
Here we can also compare the thermal stability of Na2CuP1.5As0.5O7 to that of the recently studied Co analog Na2CoP1.5As0.5O7. The Cu material is stable from room temperature to the melting temperature, which is around 688 °C. In contrast, the Na2CoP1.5As0.5O7 material undergoes a phase transition at a temperature of 675 °C before melting at ~700 °C. This shows that the Na2CuP1.5As0.5O7 material is more stable than the Na2CoP1.5As0.5O7 material [15].

3.4. SEM Microstructure and EDX Analysis of Na2CuP1.5As0.5O7

Energy-dispersive X-ray spectroscopy (EDX) and scanning electron microscopy (SEM) analysis were used to confirm the chemical composition and examine polycrystalline morphology, respectively (Figure 4). The EDX analysis of the polycrystalline powder revealed the presence of the expected elements, i.e., sodium, copper, phosphorus, arsenic, and oxygen. The micrograph on SEM of the sample shows agglomeration of uniform parallelepiped crystallites. The mapping elemental analysis of Na2CuP1.5As0.5O7 confirmed the uniform distribution of the constituent elements (Figure 5).

3.5. Crystal Structure Description

The structural unit of Na2CuP1.5As0.5O7 is presented in Figure 6. It contains two P2O7 units connected by a vertex with two CuO4 of square planar geometry. The charge neutrality of the structural unit is ensured by four sodium ions (Na+).
The Cu2P4O15 groups of the structural unit are bound by oxygen peaks to result in infinite chains and are wavy saw-toothed along the [001] direction (Figure 7). The Na+ ions are located in the inter-chain space.
Other projections of the structure of Na2CuP1.5As0.5O7 according to the [100] and [001] directions are shown in Figure 8.
The structure of our material differs from that of the allotropic form α-Na2CuP2O7 [17], which has a two-dimensional anionic framework formed by the connection of vertices of PO4 tetrahedra, and CuO5 polyhedra.
Compared to the sodium cobalt diphosphate-diarsenate Na2CoP1.5As0.5O7 investigated recently by Marzouki et al. [15], we notice that despite a similar composition, Na2CuP1.5As0.5O7 crystallizes in a different structure type. Indeed, the cobalt material crystallizes in the tetragonal system of the P42/mnm space group with the unit cell parameters a = 7.764(3) Å, c = 10.385(3) Å. In contrast, the studied material Na2CuP1.5As0.5O7, crystallizes in the monoclinic system of the C2/c space group with the unit cell parameters a = 14.798(2) Å; b = 5.729(3) Å; c = 8.075(2) Å; β = 115.00(3)°. The difference is undoubtedly determined by the preference of the Jahn–Teller active d9 Cu2+ to adopt square coordination (Figure 6).

3.6. Electrical Properties: Effect of P/As Doping

The prepared pellet of the Na2CuP1.5As0.5O7 compound was sintered at 550 °C for 2 h with a 5 °C/min heating and cooling rate. The relative density of the obtained pellet is D = 88%. The thickness and surface of the pellet are e = 0.36 cm and S = 0.454 cm2, respectively. The electrical measurements of the obtained sample were carried out using complex impedance spectroscopy in the temperature range of 260–380 °C. The recorded spectra are shown in Figure 9.
The best fits of impedance spectra were obtained when using a conventional electrical circuit Rg//CPEg-Rgb//CPEgb, where CPE are constant phase elements (Figure 9a) and subscripts g and gb indicate bulk grain and grain boundary contribution, respectively:
Z C P E = 1 A ( j ɷ ) ) p
The true capacitance was calculated from the pseudo-capacitance according to the following relationships:
ɷ 0 = ( R A ) 1 / p = ( R C ) 1
(where ω0 is the relaxation frequency, A is the pseudo-capacitance obtained from the CPE, and C is the true capacitance.
The electrical parameter values calculated at different temperatures are shown in Table 4. The values of the capacities Cgk and Cgbk are approximately 10−11 and 10−10 Fcm−1 for the bulk and grain boundaries, respectively [15]. In fact, with a relative density of D = 88%, the conductivity of the prepared sample (Table 7) increases from 0.35 10−5 Scm−1 at 260 °C to 3.13 10−5 Scm−1 at 380 °C. On the other hand, the 12% porosity of our sample prompted us to estimate the conductivity values of the fully dense sample of Na2CuP1.5As0.5O7 using the empirical formula proposed by Langlois and Coeuret [32]:
σ = ( 1 P ) 4 σ d
where σ and σd are the electrical conductivity of porous and dense samples, respectively. P is the porosity of the sample.
This correction has been used in previous works such as Na2CoP1.5As0.5O7 [15]. Taking into account the porosity factor P = 0.12, the conductivity value of dense material will be σd = (4σ/0.88). The conductivity values of dense sample calculated at different temperatures are summarized in Table 7. In this case, the experimental conductivity of 3.5 10−6 Scm−1 corresponds to the corrected value of 1.59 10−5 Scm−1 at 260 °C.
The curve Ln (σ × T) = f (1000/T) is linear (Figure 10), satisfying the Arrhenius law LnσT = Lnσ0 − Ea/kT (k = Boltzmann constant). The activation energy calculated from the slope of this curve is Ea = 0.60 eV.
The electrical investigation of the studied material shows that the activation energy, which is unaffected by porosity and thus easier to use for comparison, decreases for Na2CuP1.5As0.5O7 compared to that of Na2CuP2O7 [33], i.e., 0.60 eV and 0.89 eV, respectively. Consequently, the effect of P/As substitution increases the electrical conductivity of the parent material Na2CuP2O7 at lower temperatures [33]. Overall, a comparison of the conductivity values of the studied material Na2CuP1.5As0.5O7 (at T = 350 °C, σD = 88% = 2.28 × 10⁻⁵ Scm−1; σd = 2.28 × 10⁻⁴ Scm−1 and Ea = 0.60 eV) with those found in the literature shows that our material can be classified among the fast ionic conductors as shown in Table 8.

3.7. BVSE Simulation: Na+ Migration Pathways in Na2CuP1.5As0.5O7

The BVSE calculation revealed in addition to the equilibrium site Na1, the presence of two interstitials sites (i1 to i2) and ten saddle points (s1 to s10) (Table 9). Thus, there are ten local pathways as shown in Table 10. Figure 11 shows the position of equilibrium sites and interstitial sites in the unit cell.
Figure 11 shows that the migration along the b direction does not involve any interstitial sites, and the diffusion occurs from the equilibrium site Na1 to its symmetry image, with a jump distance of approximately 3.119 Å and with an activation energy of approximately 0.466 eV (Figure 12a).
Along the c direction, Figure 11 shows that the sodium moves from the Na1 position to the interstitial sites i2 then to i1 to reach the equivalent Na1 site (Figure 12b) with an activation energy along this direction of approximately 0.96 eV (Figure 12b).
Along the a direction, the sodium atoms pass through the following sites: Na1-i1-i1-Na1-i2. The activation energy along this direction is approximately 0.96 eV (Figure 12c). Thus, the activation energy of the title compound for 1D and 3D ionic conductivity is approximately 0.466 eV and 0.96 eV, respectively. Figure 13 shows the isosufaces of conduction pathways.
Consequently, based on the BVSE calculations, the fast ionic conductivity observed for the material can be explained by the three-dimensional mobility of Na+ ions in the inter-ribbon space, likely with more favorable diffusion along the b-axis.

4. Conclusions

A new quaternary oxide Na2CuP1.5As0.5O7 was identified in the Na2O-CuO-P2O5-As2O5 system. It crystallizes in the monoclinic C2/c space group and is isostructural to β-Na2CuP2O7. The partial substitution of P appears to be beneficial for ionic conductivity as the material exhibits lower activation energy of 0.6 eV vs. 0.89 eV for the parent β-Na2CuP2O7. According to the impedance spectroscopy performed on the 88% dense pellet, the bulk ionic conductivity reaches the value of 2.28 10−5 Scm−1, which allows Na2CuP1.5As0.5O7 to classify as a fast ion conductor. The bond-valence site energy calculations suggest that the Na+ diffusion is three-dimensional with some preference for transport along the b axis.

Author Contributions

Investigation, O.S.A.A., M.M.A. and M.A.; methodology, R.M.; software, Y.B.S.; supervision, R.M. and R.B.T.; validation, M.F.Z.; visualization, M.M.A.; writing—original draft, O.S.A.A. and R.M.; writing—review and editing, Y.B.S., M.A., R.B.T. and M.F.Z. All authors have read and agreed to the published version of the manuscript.

Funding

This research was funded by the Deanship of Scientific Research at King Khalid University, grant number R.G.P.1/150/40.

Acknowledgments

The authors extend their appreciation to the Deanship of Scientific Research at King Khalid University for funding this work through the research group program under grant number R.G.P.1/150/40.

Conflicts of Interest

The authors declare no conflict of interest.

References

  1. Nagpure, M.; Shinde, K.N.; Kumar, V.; Ntwaeaborwa, O.M.; Dhoble, S.J.; Swart, H.C. Combustion synthesis and luminescence investigation of Na3Al2(PO4)3: RE (RE = Ce3+, Eu3+ and Mn2+) phosphor. J. Alloys Compd. 2010, 492, 384–388. [Google Scholar] [CrossRef]
  2. Chen, J.G.; Ang, L.; Wang, C.; Wei, Y. Sol-Gel Preparation and Electrochemical Properties of Na3V2(PO4)2F3 Composite Cathode Material for Lithium Ion Batteries. J. Alloys Compd. 2009, 478, 604–607. [Google Scholar]
  3. Kanazawa, T. Inorganic Phosphate Materials, Materials Science Monographs 52; Elsevier: Amsterdam, The Netherlands, 1989. [Google Scholar]
  4. Hong, S.Y.P. Crystal structures and crystal chemistry in the system Na1+xZr2SixP3−xO12. Mater. Res. Bull. 1976, 11, 173. [Google Scholar] [CrossRef]
  5. Erragh, F.; Boukhari, A.; Elouadi, B.; Holt, E.M. Crystal Structures of Two Allotropic Forms of Na2CoP2O7. J. Cryst. Spectrosc. 1991, 21, 321–326. [Google Scholar] [CrossRef]
  6. Padhi, A.K.; Nanjundaswamy, K.S.; Goodenough, J.B. Phospho-olivines as Positive-Electrode Materials for Rechargeable Lithium Batteries. J. Electrochem. Soc. 1997, 144, 1188–1194. [Google Scholar] [CrossRef]
  7. Goodenough, J.B.; Hong, H.Y.-P.; Kafalas, J.A. Fast Na+-ion transport in skeleton structures. Mater. Res. Bull. 1976, 11, 203–220. [Google Scholar] [CrossRef]
  8. Kobashi, D.; Kohara, S.; Yamakawa, J.; Kawahara, A. Un Monophosphate Synthétique de Sodium et de Cobalt: Na4Co7(PO4)6. Acta Cryst. 1998, C54, 7–9. [Google Scholar] [CrossRef]
  9. Marzouki, R.; Frigui, W.; Guesmi, A.; Zid, M.F.; Driss, A. β-Xenophyllite-type Na4Li0.62Co5.67Al0.71(AsO4)6. Acta Cryst. 2013, E69, i65–i66. [Google Scholar] [CrossRef] [Green Version]
  10. Arroyo-de Dompablo, M.E.; Amadora, U.; Alvareza, M.; Gallardo, J.M.; García-Alvarado, F. Novel olivine and spinel LiMAsO4 (M = 3d-metal) as positive electrode materials in lithium cells. Solid State Ion. 2006, 177, 2625–2628. [Google Scholar] [CrossRef]
  11. Prabu, S.M.; Selvasekarapandian, M.V.; Reddy, B.V.R. Chowdari. Impedance studies on the 5-V cathode material, LiCoPO4. J. Solid State Electrochem. 2012, 16, 1833–1839. [Google Scholar] [CrossRef]
  12. Reddy, M.V.; Rao, G.V.S.; Chowdari, B.V.R. Metal Oxides and Oxysalts as Anode Materials for Li Ion Batteries. Chem. Rev. 2013, 113, 5364–5457. [Google Scholar] [CrossRef] [PubMed]
  13. Sanz, F.; Parada, C.; Rojo, J.M.; Ruiz-Valero, C.; Saez-Puche, R. Studies on Tetragonal Na2CoP2O7, a Novel Ionic Conductor. J. Solid State Chem. 1999, 145, 604–611. [Google Scholar] [CrossRef]
  14. Chouaib, S.; Ben Rhaiem, A.; Guidara, K. Dielectric relaxation and ionic conductivity studies of Na2ZnP2O7. Bull. Mater. Sci. 2011, 34, 915–920. [Google Scholar] [CrossRef]
  15. Marzouki, R.; Ben Smida, Y.; Sonni, M.; Avdeev, M.; Zid, M.F. Synthesis, structure, electrical properties and Na+ migration pathways of Na2CoP1.5As0.5O7. J. Solid State Chem. 2019, in press. [Google Scholar] [CrossRef]
  16. Toby, B.J. EXPGUI, a graphical user interface for GSAS. J. Appl. Crystallogr. 2001, 34, 210–213. [Google Scholar] [CrossRef] [Green Version]
  17. Erragh, F.; Boukhari, A.; Abraham, F.; Elouadi, B. The crystal structure of α- and β-Na2CuP2O7. J. Solid State Chem. 1995, 120, 23–31. [Google Scholar] [CrossRef]
  18. Nespolo, M.; Guillot, B. CHARDI2015: charge distribution analysis of non-molecular structures. J. Appl. Cryst. 2016, 49, 317–321. [Google Scholar] [CrossRef]
  19. Adams, S.; Rao, R.P. Transport pathways for mobile ions in disordered solids from the analysis of energy-scaled bond-valence mismatch landscapes. Phys. Chem. Chem. Phys. 2009, 11, 3210–3216. [Google Scholar] [CrossRef]
  20. Adams, S.; Rao, R.P. High power lithium ion battery materials by computational design. Phys. Status Solidi 2011, A208, 1746–1753. [Google Scholar] [CrossRef]
  21. Pauling, L. The principles determining the structure of complex ionic crystals. J. Am. Chem. Soc. 1929, 51, 1010–1026. [Google Scholar] [CrossRef]
  22. Brown, I.D.; Altermatt, D. Bond-valence parameters obtained from a systematic analysis of the Inorganic Crystal Structure Database. Acta Cryst. 1985, B41, 244–247. [Google Scholar] [CrossRef] [Green Version]
  23. Adams, S. Relationship between bond valence and bond softness of alkali halides and chalcogenides. Acta Cryst. 2001, B57, 278–287. [Google Scholar] [CrossRef] [PubMed]
  24. Mazza, D. Modeling ionic conductivity in Nasicon structures. J. Solid State Chem. 2001, 156, 154–160. [Google Scholar] [CrossRef]
  25. Marzouki, R.; Ben Smida, Y.; Guesmi, A.; Georges, S.; Ali, I.H.; Adams, S.; Zid, M.F. Structural and Electrical Investigation of New Melilite Compound K0.86Na1.14CoP2O7. Int. J. Electrochem. Sci. 2018, 13, 11648–11662. [Google Scholar] [CrossRef]
  26. Ben Moussa, M.A.; Marzouki, R.; Brahmia, A.; Georges, S.; Obbade, S.; Zid, M.F. Synthesis and Structure of New Mixed Silver Cobalt (II)/(III) Diphosphate-Ag3. 68Co2(P2O7)2. Silver (I) Transport in the Crystal. Int. J. Electrochem. Sci. 2019, 14, 1500–1515. [Google Scholar] [CrossRef]
  27. Chen, H.; Wong, L.L.; Adams, S. SoftBV–a software tool for screening the materials genome of inorganic fast ion conductors. Acta Cryst. 2019, B75, 18–33. [Google Scholar] [CrossRef]
  28. Ben Said, R.; Louati, B.; Guidara, K. Electrical properties and conduction mechanism in the sodium-nickel diphosphate. Ionics 2014, 20, 703–711. [Google Scholar] [CrossRef]
  29. Li, H.; Zhang, Z.; Xu, M.; Bao, W.; Lai, Y.; Zhang, K.; Li, J. Triclinic Off-stoichiometric Na3.12Mn2.44(P2O7)2/C Cathode Materials for High Energy/Power Sodium-ion Batteries. Appl. Mater. Interfaces 2018, 10, 24564–24572. [Google Scholar] [CrossRef]
  30. Nakamoto, K. Infrared and Raman Spectra of Inorganic and Coordination Compounds, 3rd ed.; Wiley-Inter-Science: New York, NY, USA, 1978. [Google Scholar]
  31. Krichen, M.; Gargouri, M.; Guidara, K.; Megdiche, M. Phase transition and electrical investigation in lithium copper pyrophosphate compound Li2CuP2O7 using impedance spectroscopy. Ionics 2017, 23, 3309–3322. [Google Scholar] [CrossRef]
  32. Langlois, S.; Couret, F. Flow-through and flow-by porous electrodes of nickel foam. I. Material characterization. J. Appl. Electrochem. 1989, 19, 43. [Google Scholar] [CrossRef]
  33. Hafidi, E.; El Omari, M.; El Omari, M.; Bentayeb, A.; Bennazha, J.; El Maadi, A.; Chehbouni, M. Conductivity studies of some diphosphates with the general formula AI2BIIP2O7 by impedance spectroscopy. Arab. J. Chem. 2013, 6, 253–263. [Google Scholar] [CrossRef] [Green Version]
  34. Marzouki, R.; Guesmi, A.; Zid, M.F.; Driss, A. Synthesis, Crystal Structure and Electrical Properties of a New Mixed Compound (Na0.71Ag0.29)2CoP2O7. Cryst. Struct. Theory Appl. 2013, 1, 68–73. [Google Scholar] [CrossRef] [Green Version]
  35. Ben Smida, Y.; Marzouki, R.; Guesmi, A.; Georges, S.; Zid, M.F. Synthesis, structural and electrical properties of a new cobalt arsenate NaCo2As3O10. J. Solid State Chem. 2015, 221, 132–139. [Google Scholar] [CrossRef]
  36. Marzouki, R.; Guesmi, A.; Zid, M.F.; Driss, A. Etude physico-chimiques du monoarséniate mixte Na4Co5,63Al0,91(AsO4)6 et simulation des chemins de conduction. Ann. Chim. Sci. Mat. 2013, 38, 117. [Google Scholar] [CrossRef]
  37. Nasri, R.; Marzouki, R.; Georges, S.; Obbade, S.; Zid, M.F. Synthesis, sintering, electrical properties, and sodium migration pathways of new lyonsite Na2Co2(MoO4)3. Turk. J. Chem. 2018, 42, 1251. [Google Scholar] [CrossRef]
Figure 1. Results of the Rietveld refinement of the powder of Na2CuP1.5As0.5O7 based on XRD data.
Processes 08 00305 g001
Figure 2. FT-IR spectrum (1300–500 cm−1) of Na2CuP1.5As0.5O7.
Processes 08 00305 g002
Figure 3. DSC curve of the Na2CuP1.5As0.5O7 compound.
Processes 08 00305 g003
Figure 4. (a) EDX analysis and (b) SEM micrograph of the Na2CuP1.5As0.5O7 sample.
Processes 08 00305 g004
Figure 5. The mapping elemental analysis of the Na2CuP1.5As0.5O7 sample.
Processes 08 00305 g005
Figure 6. The structural unit of Na2CuP1.5As0.5O7.
Processes 08 00305 g006
Figure 7. View of the structure of Na2CuP1.5As0.5O7 in the ac plane showing the arrangement of the chains.
Processes 08 00305 g007
Figure 8. Projections of the Na2CuP1.5As0.5O7 structure along the (a) [100] and (b) [001] directions.
Processes 08 00305 g008
Figure 9. Impedance spectra of Na2CuP1.5As0.5O7 recorded in a temperature range of 240–360 °C in air. The refined calculated model is shown in (a) the Nyquist and (b) Bode planes.
Processes 08 00305 g009
Figure 10. Arrhenius plot of the conductivity of the Na2CuP1.5As0.5O7 sample.
Processes 08 00305 g010
Figure 11. Unit cell of the title compound showing the position of the equilibrium site Na1 and the interstitial sites (i1 and i2).
Processes 08 00305 g011
Figure 12. Variation of energy as a function of the reaction coordinate along the (a) b-direction, (b) c-direction and (c) a-direction.
Processes 08 00305 g012aProcesses 08 00305 g012b
Figure 13. Isosurfaces of conduction showing the polyhedral of coordination and the 3D ionic conductivity pathways transport of sodium in Na2CuP1.5As0.5O7.
Processes 08 00305 g013
Table 1. Unit cell parameters of the β-Na2CuP2O7 and Na2CuP1.5As0.5O7 materials.
ParameterNa2CuP1.5As0.5O7 (Current Work)β-Na2CuP2O7 [30]
a (Å)14.798(2)14.728(3)
b (Å)5.729(3)5.698(1)
c (Å)8.075(2)8.067(1)
β (º)115.00(3)115.15(1)
V (Å3)620.43(3)612.80(2)
Table 2. Structure refinement results of the Na2CuP1.5As0.5O7 compound.
Crystallographic Data
Empirical FormulaNa2CuP1.5As0.5O7
Formula Weight; ρcal305.44 g mol−1; 3.220 g cm−1
Crystalline System; Space GroupMonoclinic, C2/c
Unit Cell Dimensionsa = 14.8688 (8), b = 5.7591 (3), c = 13.5957 (7) β = 147.2406 (12)
Volume; ZV = 629.97 (6) Å3; 4
Data Collection
DiffractometerBruker D8 ADVANCE
Wavelength λCu Kα = 1.54056 Å
Temperature298 (2) K
Angle Range 4.91°–69.91°
Step Scan Increment (°2θ) 0.02°
Counting Time 2 s
Refinement
Angle Range4.91°–69.91°
Rp0.054
Rwp0.069
Rexp0.043
R(F2)0.05117
Goodness of Fit χ22.592
No. of Data Points 3251
No. of Restraints 18
Profile Function Pseudo-Voigt
BackgroundChebyshev function with 20 terms
Table 3. Fractional atomic coordinates and equivalent isotropic displacement parameters (Å2).
xyzUisoOcc. (<1)
Cu1¼¼ ½ 0.0123 (12)
P1/As10.5112 (2)0.5884 (5)0.6563 (3)0.0065 (14)0.75/0.25
Na10.3211 (5)0.8919 (9)0.2991 (5)0.004 (2)
O10.6590 (6)0.4179 (9)0.7999 (6)0.006 (2)
O20.5389 (4)0.7622 (10)0.6011 (6)0.006 (2)
O30.8432 (6)0.0371 (12)0.9916 (5)0.041 (5)
O4½ 0.7267 (9)¾ 0.018 (5)
Table 4. Main bond distances (Å) in the coordination polyhedra for Na2CuP1.5As0.5O7.
Cu1O4(P1/As1)O4
Cu1—O1iii1.9938 (3)(P1/As1)—O11.5457 (3)
Cu1—O1x1.9938 (3)(P1/As1)—O21.5015 (3)
Cu1—O3iii1.9247 (3)(P1/As1)—O3x1.5387 (3)
Cu1—O3x1.9247 (3)(P1/As1)—O41.6248 (3)
Na1O6
Na1—O1i 2.3985 (4)Na1—O2iv2.3220 (4)
Na1—O1vi2.6566 (4)Na1—O2vi2.5780 (4)
Na1—O22.3541 (4)Na1—O3i2.3485 (4)
Symmetry codes: (i) −x + 1, −y + 1, −z + 1; (ii) x−1/2, −y + 1/2, z + 1/2; (iii) −x + 1, y, −z + 3/2; (iv) −x + 1, −y + 2, −z + 1; (v) x−1/2, −y−1/2, z + 1/2; (vi) x−3/2, −y + 1/2, z−1/2; (vii) −x + 1/2, y−1/2, −z + 1/2; (viii) −x + 1/2, y + 1/2, −z + 1/2; (ix) x, −y + 1, z−1/2; (x) x−3/2, −y−1/2, z−1.
Table 5. Charge distribution analysis of cation polyhedra in Na2CuP1.5As0.5O7.
Cationq(i).sof(i)Q(i)CN(i)ECoN(i)dar(i)dmed(i)
Cu12.0001.9643.961.9551.959
M15.0005.0343.881.5441.552
Na11.0000.9865.472.4002.443
q(i), formal oxidation number; Q(i), computed charge; sof(i), site occupation factor; dar(i), arithmetic average distance; dmed(i), weighted average distance; CN, coordination number; ECoN(i), effective coordination number. M1 = (0.75P + 0.25As=).
Table 6. Proposed assignment of the vibration bands of Na2CuP1.5As0.5O7.
AttributionWave Number (cm−1)
νas (PO3)1188
1164
νas (AsO3)1100
νs (PO3)1064
1025
νs (AsO3)994
νas (POP) Stretching Vibrations901
νas (AsOAs) Stretching Vibrations841
νs (POP) Stretching Vibrations814
772
721
νs (AsOAs) Stretching Vibrations694
653
δas (PO3) Deformation Modes629
595
δs (PO3) Deformation Modes544
Table 7. Electrical parameters values of equivalent circuits of Na2CuP1.5As0.5O7 determined by impedance spectroscopy at 260–380 °C.
T (°C)T (K)Rg (104 Ω)Ag (10−10 F sp−1)Cgk (10−11 Fcm−1)Rgb (104 Ω)Agb (10−10 F sp−1)Cgbk (10−10 Fcm−1)Rt (104 Ω)ρt (104 Ω cm)σ (10−5 S cm−1)σd (10−5 S cm−1)
2605335.542.12.017.041.71.722.5828.580.351.59
2905632.703.43.37.821.81.7010.5213.320.753.41
3205931.433.43.34.181.51.55.617.101.416.41
3506231.213.43.32.261.41.33.474.392.2810.36
3806531.018.48.01.511.21.22.523.193.1314.23
Table 8. Activation energies of ionic conductivity for some sodium-ion materials.
MaterialActivation Energy (eV)Temperature Range (°C)Ref.
Na2CuP1.5As0.5O70.60260–380current work
Na2CoP1.5As0.5O70.56240–360[15]
Na1.14K0.86CoP2O71.34360–480[24]
Na2.84Ag1.16Co2(P2O7)21.36510–630[34]
NaCo2As3O100.48160–410[35]
Na4Co5.63Al0.91(AsO4)60.56400–550[36]
Na2Co2(MoO4)31.20180–513[37]
Table 9. Bond-valence sites energies and positions of equilibrium site (Na1), interstitial sites (i1 and i2) and saddle points (s1 to s10).
Site xyzEnergy (eV)
Na10.1850.6110.7010.000
i10.5240.8750.4240.288
i20.2620.1940.9860.715
s10.5600.1250.6320.354
s20.2260.0830.2150.466
s30.0060.3890.2500.550
s40.1250.5280.0690.602
s50.2500.2500.0000.749
s60.1730.4310.9580.870
s70.7140.2080.5830.960
s80.8210.7080.3751.260
s90.1900.3330.6531.289
s100.1670.3610.8331.643
Table 10. Local transport pathways in the anionic framework, energetic barrier (eV) and hop distance (Å).
Local PathSite 1SaddleSite 2Barrier (eV)Hop Distance (Å)
1i1s1Na10.3541.904
2Na1s2Na10.4663.119
3i1s3i10.2614.145
4i1s4Na10.6022.593
5i2s5i20.0330.955
6i2s6i10.5822.922
7i2s7Na10.9603.282
8i1s8Na11.2603.168
9Na1s9i11.2893.168
10i2s10i11.3553.956

