Article

Evolution of Phase Composition and Antibacterial Activity of Zr–C Thin Films

1
Faculty of Mechanical Engineering, Koszalin University of Technology (KUT), Śniadeckich 2, 75-453 Koszalin, Poland
2
Centre for Engineering Materials, Mechanical Engineering Sciences, University of Surrey, Surrey, Guildford GU2 7XH, UK
*
Author to whom correspondence should be addressed.
Processes 2020, 8(3), 260; https://doi.org/10.3390/pr8030260
Submission received: 26 January 2020 / Revised: 12 February 2020 / Accepted: 20 February 2020 / Published: 25 February 2020
(This article belongs to the Special Issue Synthesis and Characterization of Biomedical Materials)

Abstract

:
The research presented in this article concerns Zr–C coatings which were deposited on 304L steel by reactive magnetron sputtering from the Zr target in an Ar–C2H2 atmosphere at various acetylene flow rates, resulting in various atomic carbon concentrations in the coating. The article describes research covering the change in the antibacterial and anticorrosive properties of these coatings due to the change in their chemical and phase composition. The concentration of C in the coatings varied from 21 to 79 at.%. The coating morphology and the elemental distribution in individual coatings were characterized using field emission scanning electron microscopy with an energy-dispersive X-ray analytical system. X-ray diffraction and Raman spectroscopy were used to analyze their microstructure and phase composition. Parallel changes in the mechanical properties of the coatings were analyzed. Based on the obtained results, it was concluded that the wide possibility of shaping the mechanical properties of Zr–C coatings in combination with relatively good antibacterial properties after exceeding 50 at.% of carbon concentration in coatings and high protective potential of these coatings make them a good candidate for medical applications. In particular, corrosion tests showed the high anti-pitting potential of Zr–C coatings in the environment of artificial saliva.

1. Introduction

Metals and alloys are widely used in the production of medical implants for use in dentistry, cardiology, orthopedic fractures, etc. Titanium alloys, austenitic stainless steel and chromium–cobalt–nickel alloys are mainly used for implants. First of all, these materials must have adequate biocompatibility, i.e., they must not be irritating, toxic, allergic, inflammatory, mutagenic or carcinogenic to surrounding tissues [1,2]. For example, in the case of dental and orthodontic implants, some studies show that biofilms caused by attachment of bacteria are responsible for about 65% of infections such as periodontal disease and peri-implant diseases [3]. To prevent these adverse effects, surface treatments are used, among which the deposition of coatings by PVD and CVD methods are one of the ways to improve their mechanical and biological properties [4,5,6,7,8]. In particular, the coatings should fulfill a number of functions, such as bacterial resistance, i.e., resistance to adhesion and colonization of bacteria [9,10]. They should be biocompatible [11], have adequate thrombogenicity [12,13] in cardiac surgery applications and create a suitable diffusion barrier for elements causing allergic reactions in the case of deposition of coatings on medical steels [4,14]. Simultaneously, the coatings should have pitting corrosion resistance, a low coefficient of friction and wear resistance, high hardness and low Young’s modulus [15,16,17]. The aforementioned range of properties by which coatings should be characterized is a function of many factors, the most important of which is the chemical composition of coatings and their structure (monolayers, multilayers, nanocomposites, gradient coatings, etc. [18]). In the case of antibacterial properties, due to the fact that the interaction of the material with bacteria is adhesive, the chemical activity is important (contact angle, free surface energy, etc.) and depends primarily on the chemical composition and type of bonds in the surface layer of coatings deposited on implants. The roughness of the surface is also taken into account.
Promising candidates meeting these requirements are thin coatings made of transition metal carbides. Among them, zirconium-carbide-based coatings are interesting due to their chemical, mechanical and electrical properties [19,20,21,22]. The microstructure and phase composition of these coatings are mainly influenced by the atomic concentration of carbon as well as the parameters of the coating deposition process [23,24]. Relatively significant possibilities of controlling properties are obtained due to the formation of free carbon in the amorphous form surrounding the grains of nanocrystalline carbide [25], although comparing to coatings based on transition metal nitrides, carbide coatings with higher carbon concentrations are characterized with lower hardness, however, production of coatings with a lower coefficient of friction is possible. Hence, by appropriately changing the phase composition and using the potential of carbon to combine into various structures, there are wide possibilities of shaping the properties of coatings based on Zr–C, which also inspire research on the perspectives of their application on medical implants [4,26,27]. In particular, in the studies presented in [4], ZrC coatings were deposited at different substrate temperatures (25, 200 and 400 °C) on substrates of 316L steel. It has been shown that the surface energy, hydrophobicity and surface roughness have the greatest influence on the hemocompatibility of these coatings. The authors of [28] present research on the analysis of antibacterial activity and cell proliferation activity of Zr–C–N coating with different C concentration deposited on titanium (Ti). Coatings with the highest C concentration (22 at.%) have been shown to increase the antibacterial ability against Staphylococcus aureus, but also meet the requirement for HGF (human gingival fibroblasts) biocompatibility. Tests of CNx-doped W, Ti and Zr coatings for antibacterial activity and wear are presented in [6]. It was shown that the CNx-Zr coating, whose surface had the highest hydrophilicity, provided the best antibacterial effect. However, the CNx-Zr coating showed lower wear resistance than the CNx-W and CNx-Ti coatings.
The research presented in this article concerns Zr–C coatings which were deposited on 304L steel by reactive magnetron sputtering from the Zr target in an Ar-C2H2 atmosphere at various mass acetylene flow rates conditioning a specific carbon concentration in the coating. The evolution of phase composition of coatings was studied with increasing carbon concentration and the composition correlated with mechanical, antibacterial and corrosive properties. For comparison, these properties were also tested for 304L steel without a coating. In particular, the correspondence between chemical and phase composition of coatings and biological properties was studied. Corrosion properties and contact angle were tested in an environment that simulates the oral cavity, i.e., artificial saliva, taking into account the possible application of Zr–C coatings on orthodontic wires.

2. Materials and Methods

2.1. Coating Deposition

Zr–C coatings deposited by pulsed, reactive magnetron sputtering on high-speed steel substrates were the object of research previously described by the authors in [17]. Coatings considered in this paper were deposited on 304L medical steel substrates in the form of discs with a diameter of 32 mm and a thickness of 4 mm in the same deposition processes, methodology which has been described in detail in previous work [17]. The objects of research in this work are Zr–C coatings with different carbon concentrations obtained at various acetylene mass flow rates during the deposition process. In addition, zirconium coatings deposited without carbon-carrier gas in the working chamber were tested for comparative purposes.

2.2. Structural and Compositional Characterisation

The surface morphology and the elemental distribution in individual coatings were characterized using field emission scanning electron microscopy (FESEM, JEOL, JSM-7100F) with an energy-dispersive X-ray analytical system (Thermo Fisher SEM-EDX).
The concentration of the individual elements in the deposited coatings was determined by wavelength-dispersive X-ray spectroscopy (WDX) using a Thermo Scientific’s Magnaray system with an X-ray microprobe working in a wave mode.
The microstructure of Zr–C coatings was analyzed by means of X-ray diffraction (XRD) using the conventional symmetrical Bragg–Brentano configuration (θ/2θ) with the Co-Kα radiation source on a DRON device. Further data processing was performed by HighScore Plus with ICDD PDF-4+ database software.
The analysis of the structure (type of bonds) of the carbon phase in Zr–C coatings was carried out by Raman spectroscopy using Renishaw in Via with laser excitation of the 534 nm wavelength.
Chemical and phase composition of the coatings was determined by means of X-ray photoelectron spectroscopy (XPS) using a Kratos Axis Supra system with monochromatic Al Kα1,2 radiation of energy 1486.6 eV. The calibration of the photoelectron spectrum was carried out with use of carbon C 1s (284.8 eV). The deconvolution of the XPS spectrum was performed through the fitting of peaks with the GL(30) function (Gauss and Lorenz functions at a ratio 30:70) and sigmoidal asymmetric function.

2.3. Mechanical Evaluation

Hardness measurements were performed by nanoindentation using the Fisherscope HM2000 nanoindenter equipped with the diamond Berkovich indenter. The load–depth indentation curves were obtained in the mode of the linear load increase up to 50 mN. The values of the hardness and the Young’s modulus were determined based on the indentation curves using the Oliver–Pharr model [29].

2.4. Microbiological Tests

Four different species of microorganisms from the American Pure Culture Collection (Candida albicans ATCC 2091, Escherichia coli ATCC 25922, Staphylococcus aureus ATCC 25923 and Streptococcus mutans ATCC 35668) were used. The antimicrobial activity of the coatings was assessed by direct method based on the (BPR-ECHA-EU) regulation criteria (SN 195920–ASTM E2922), while the evaluation of antifungal activity was performed based on the SN 195921 standard. The fungus culture was carried out on Sabouraud medium, while the bacteria culture was on TSA medium. Test microorganisms were inoculated on the surface of the medium with a suspension concentration of 108 cfu/mL (0.5 Mc Farland); the test samples faced with coatings were placed into the medium after 20 min and incubated at 37 °C for 48 h. After incubation, the growth inhibition zone of the tested microorganisms was evaluated. The criterion for the assessment of fungicidal and bactericidal properties was the presence and size of the zone inhibiting the growth of the tested microorganisms. The tests were carried out in three repetitions for each tested sample and each tested microorganism.
To test the susceptibility of the surface of the coatings to microbial adhesion, a bacterial suspension with a density of 0.5 McFarland was applied to the test specimens and incubated at 37 °C for 24 h. After culturing, the samples were washed three times with distilled water to remove nonadherent cells and then shaken for 15 min in distilled water. Afterwards, the coatings were dried and the 0.5 cm3 of benzidine bis (for observation of live cells) was applied to the surface and incubated for 120 s. After rinsing in distilled water, 0.3 cm3 of propidium iodide (dead cell observation) was placed on the surface of the coatings for 120 s and again washed with water. After drying, the surfaces of the samples were observed using a fluorescence microscope (Motic BA 410 E M, MOTIC ASIA, Hong Kong). For each coating and the observed microorganism, two series of measurements were made and the final total number of microorganisms was the average of ten 1 cm2 fields of view calculated using the Motic Live Imaging (MOTIC ASIA, Hong Kong) module.
The results of microbial adhesion to the coatings were calculated in relation to the control sample (304L sample without coating) using the formula:
η = ((N0-N)/N0) × 100%,
where N represents the number of living/dead cells on the sample in cfu/cm2 and N0 represents the number of living/dead cells on the uncoated 304L reference sample.

2.5. The Wettability of Coating Surface and Corrosion Behavior

The wettability of the coating surface was determined by measuring the static contact angles through the sessile drop method using F4 Goniometer by Rame-Hart Instrumental Co. Drops with a volume of approximately 4 μL were deposited onto the investigated surfaces using a microsyringe. Fusayama-Meyer’s artificial saliva, with the composition given in Table 1, was used as a test liquid. The contact angles were measured at 3–5 different points at the surface of each sample. The images were recorded over 300 s and analyzed using the DROPimage CA (Rame-Hart Instrumental Co) program.
The corrosion behavior of substrate/coating systems was evaluated by potentiodynamic polarization tests, which were carried out using an ATLAS 0531 Electrochemical Unit (Atlas-Sollich, Poland). Conventional electrochemical three-electrode cell was used with a sample with the active area of 0.292 cm2 as the working electrode, saturated calomel electrode (SCE, Hg/Hg2Cl2/KCl) as the reference electrode and a platinum sheet as counter electrode. The electrolyte was Fusayama-Meyer artificial saliva. Polarization tests were carried out in a temperature of 25 ± 1 °C at the scan rate of 0.001 V/s. Prior to polarization, the samples were kept in contact with the electrolyte for 1 h at open circuit conditions. Measurements were repeated until obtaining three similar results (polarization curves). Corrosion potential (Ecorr), corrosion current density (icorr) and polarization resistance (Rpol—a value inversely proportional to icorr) were estimated by the Tafel extrapolation method. Since the anodic curves were influenced by passivation reactions, only the cathodic curves were used to determine icorr, according to [30].

3. Results

3.1. Chemical Composition

To determine the effect of acetylene mass flow rate on the chemical composition of the deposited coating, wavelength-dispersive X-ray spectroscopy (WDX) tests were carried out. Table 2 summarizes the results of the tests, i.e., the average concentrations of elements in individual coatings.
It has been proven that in coatings deposited using volumetric flow rates between 1.5–6.5 sccm, the carbon concentration increases linearly from around 20 to 80 at.%.
In order to determine the chemical composition (chemical bonds) of the surface layer of deposited coatings, important from the point of view of biological properties, an XPS test was performed.
As expected, among the atoms identified on the surface of the coatings, the main share is zirconium and carbon. As mentioned above, the samples after the deposition process were in the ambient atmosphere, and therefore a significant amount of oxygen atoms is also observed on their surface. Figure 1 shows high resolution Zr 3d, O 1s and C 1s spectra. The positions of individual peaks in the spectra obtained as a result of their deconvolution with Gaussian curves are given in Table 3. The Zr 3d spectrum for each coating (Figure 1a) can be deconvolved into four main peaks of about 180, 182, 183 and 185 eV. The first two refer to Zr-C bonds, while the others are derived from Zr-O bonds in connection with spin-orbit doublets (i.e., Zr 3d5/2 and Zr 3d3/2) separated by energy difference [31]. For coatings with a higher carbon concentration (63 and 79 at.%), zirconium carbide is by far the dominant phase. According to the literature [32], binding energy of metallic zirconium is typically around 178.5 eV. The location of the maximum main peak in the Zr 3d spectrum for the coating at 21 at.% C between energies typical for Zr-C bond and Zr-Zr as well as the shift of the peak assigned to Zr-C in the C 1s spectrum for this coating towards lower binding energies suggests the presence of some kind of intermediate phase, not metallic zirconium itself. At lower carbon concentrations (21 and 53 at.%), a relatively high proportion of zirconium oxide is observed. This is due to the high reactivity of zirconium, which in contact with air is oxidized to form stable, compact oxides on the surface of the material. In the O 1s (Figure 1b) spectrum, the dominant peak for all coatings is a peak of about 530.5 eV identified as Zr-O bond. Other peaks come from oxygen adsorbed on the surface and contamination by organic compounds.
In the case of spectrum C 1s (Figure 1c) for coatings from 53 at.% C inclusive, four peaks can be distinguished. The peak at about 284.8 eV is characteristic for C-C bonds. The peak at about 286.5 eV, of lower intensity, originates from C-O bonds in the alcohol and ester group (surface impurities). The ~282 eV peak is characteristic for Zr-C binding. An additional peak of 283 eV is also present for these three coatings. The presence of an additional peak between the peaks derived from Me-C and C-C bonds has been observed earlier in Zr, Ti and Nb carbide coatings [33]. It is attributed to the occurrence of a phase in which carbon atoms are partially bonded to metal and carbon simultaneously (atoms on the border of metal carbide and amorphous carbon phases) and therefore is marked with a symbor Me-C*. For the two coatings with the highest carbon concentrations (63 and 79 at.%), this peak becomes dominant over Zr-C. In addition, with increasing carbon concentration in the coating, the peak from Zr-C shifts towards higher binding energies. This may indicate an increase in the proportion of the amorphous carbon phase and that the system is transformed into the MeC/a-C nanocomposite [34].

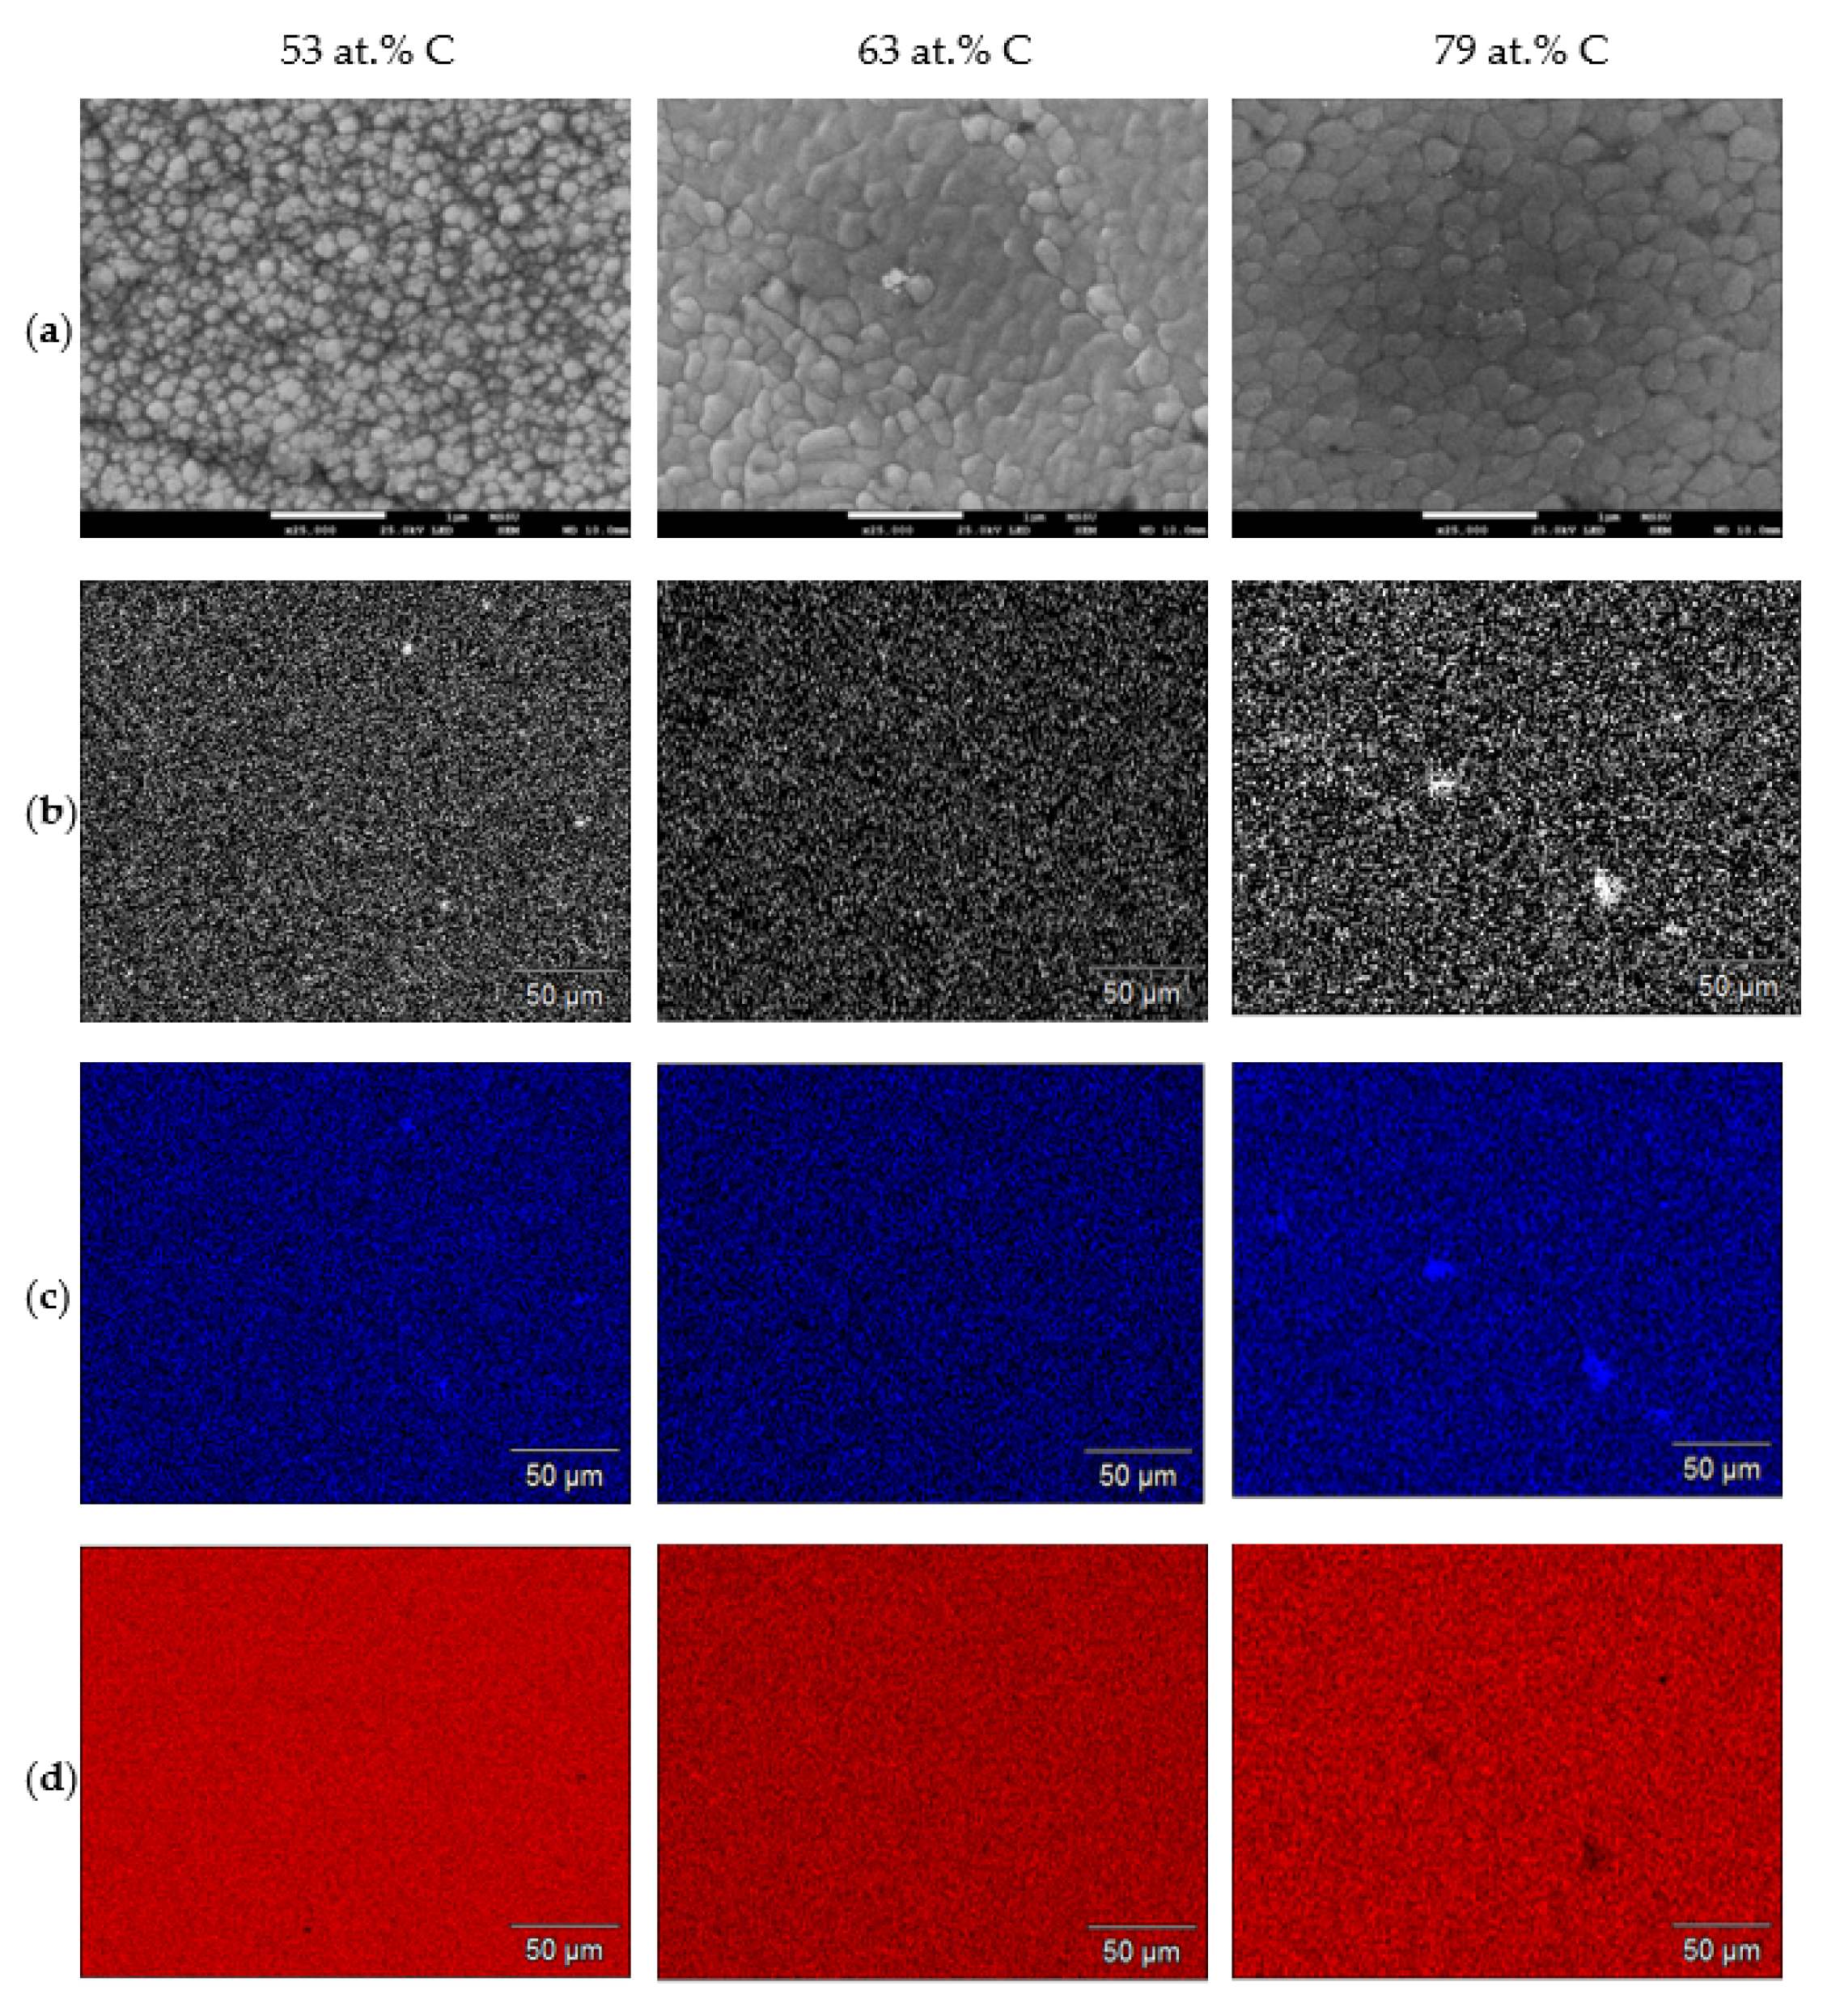
3.2. Coating Morphology

The effect of C concentration on the microstructure of chosen coatings is illustrated in Figure 2a. In addition, Figure 2b–d shows the results of EDX mapping, which aimed to examine the degree of uniformity in the distribution of elements on the coating surface. It can be seen that the grain boundaries are clearly observed in the SEM micrographs (Figure 2a). Maps clearly show that Zr, C and O are evenly distributed on the surface of each coating. As mentioned in Section 3.1, the presence of oxygen is associated with the oxidation of the surface of the coatings stored in the ambient atmosphere after the deposition process or with the process conditions themselves.
Based on the results of the EDX mapping analysis taken from the cross section of the samples, two layers can be distinguished (Figure 3 and Figure 4). The first layer in direct contact with stainless steel (Zr adhesive layer) consistently has 300 nm thickness. The next (specific layer) is a mixture of Zr and C, in which both elements are evenly distributed in its volume.

3.3. Phase Composition

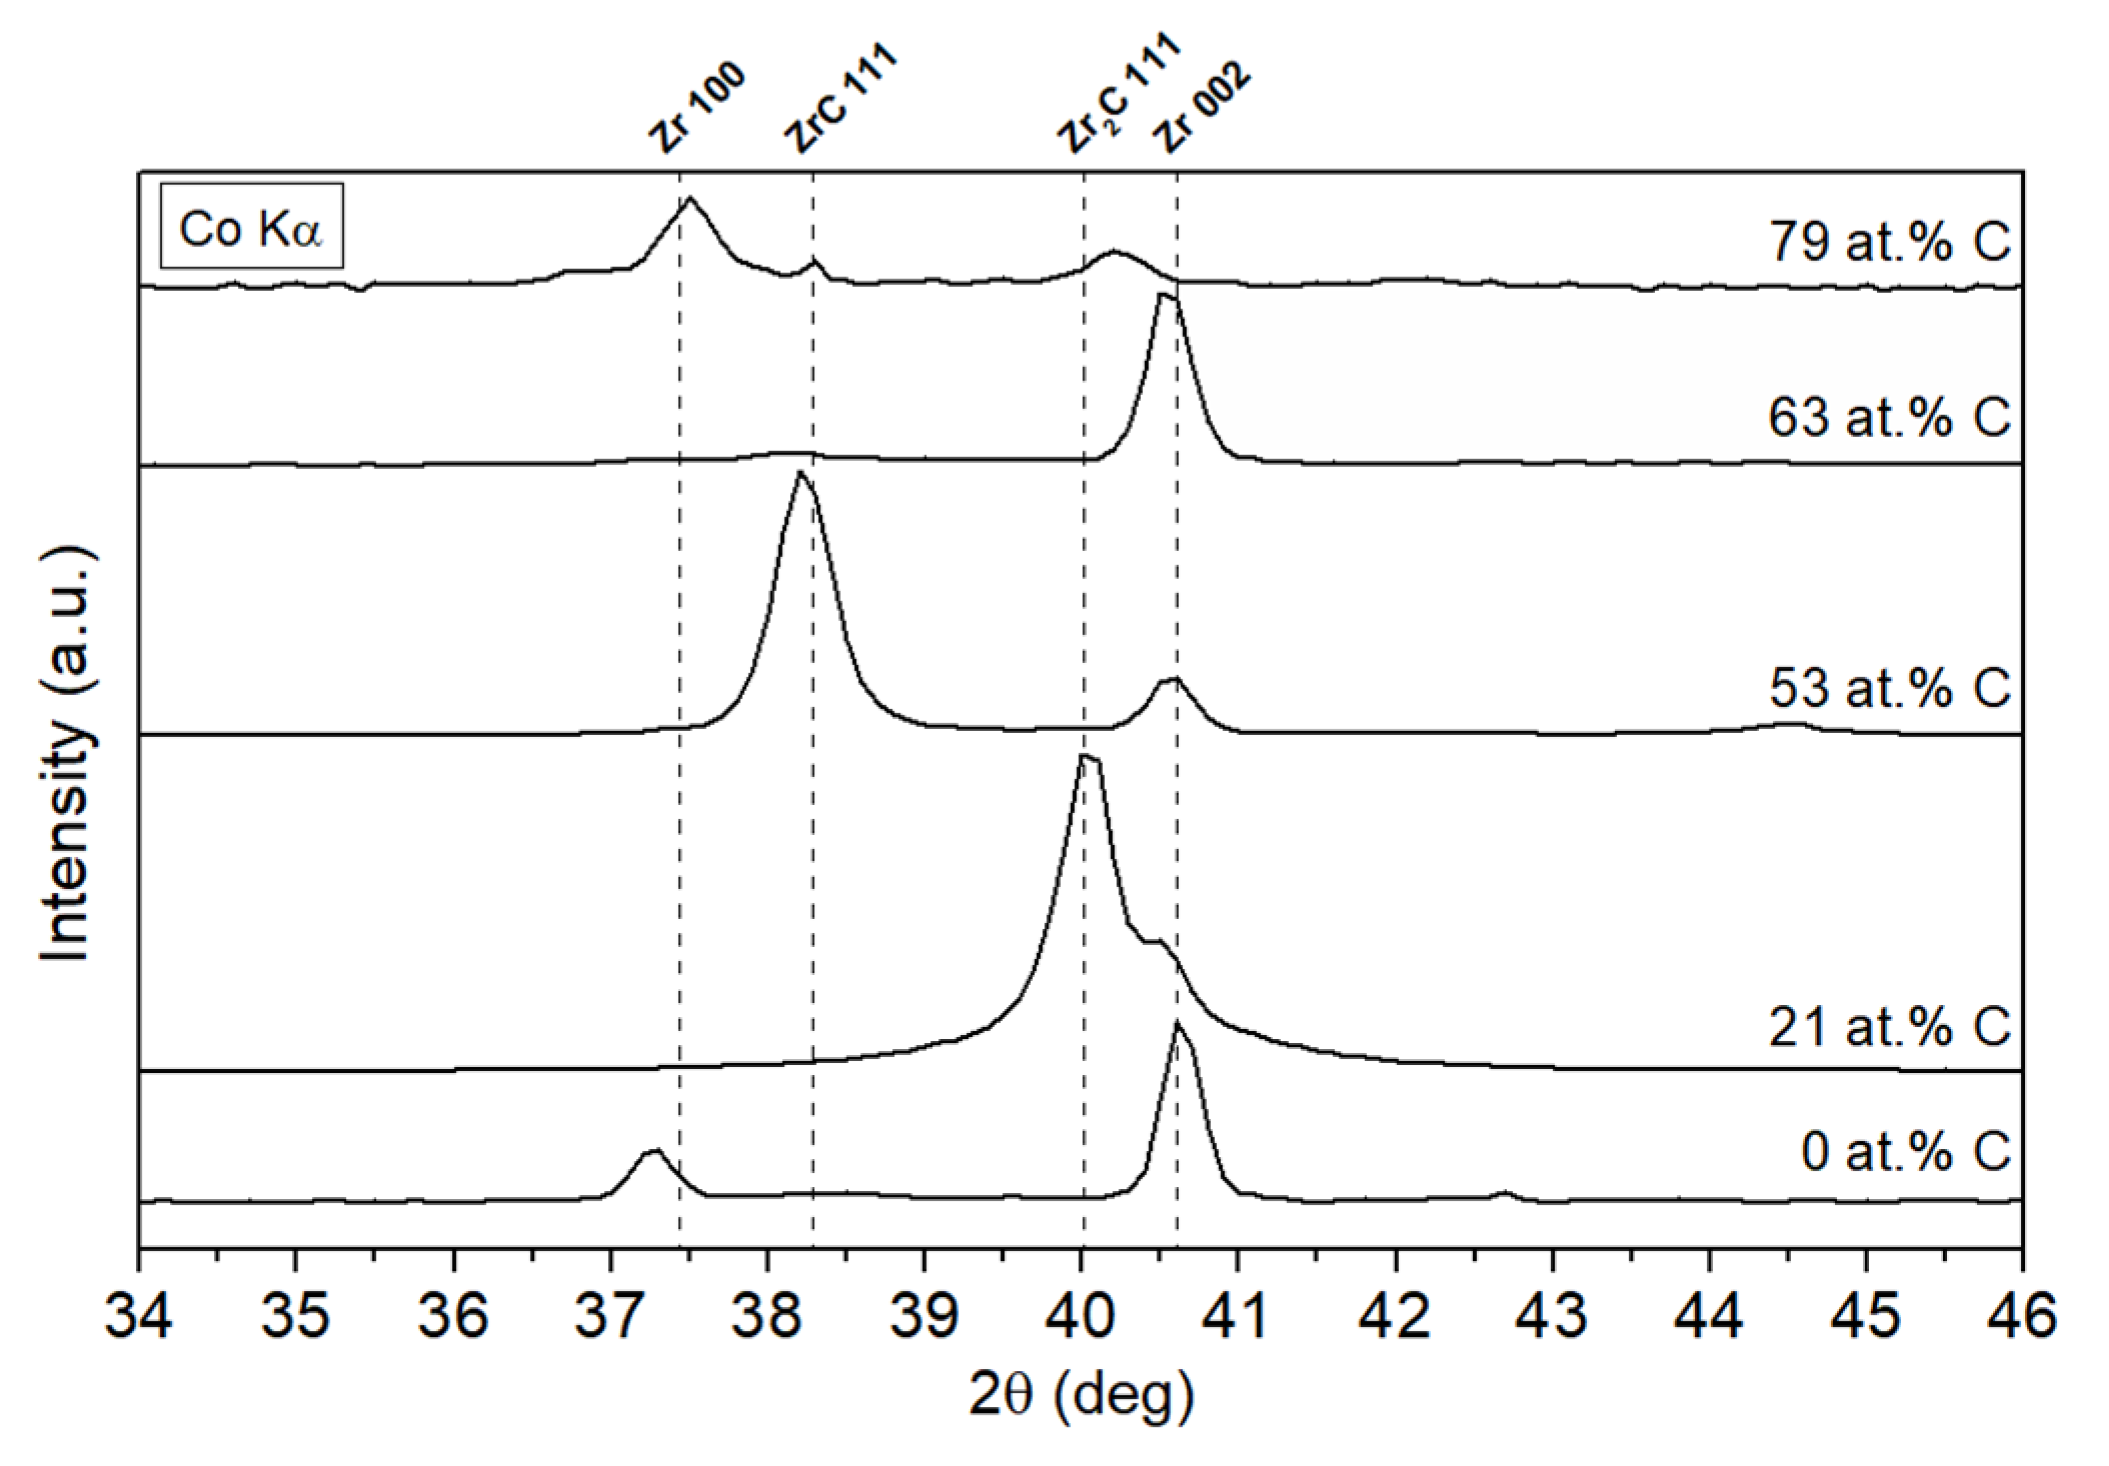
3.3.1. X-ray Diffraction

Based on the analysis of X-ray diffraction patterns (Figure 5), obtained using conventional Bragg–Brentano geometry, it appears that the phase composition of the coatings changes radically with increasing carbon concentration, similarly to Ti-C coatings [35]: from the coating dominated by Zr for low carbon concentration (21 at.%) through the intermediate Zr-ZrC phases to the nanocomposite coating composed of zirconium carbide in an amorphous hydrogenated carbon matrix for the highest carbon concentration (79 at.%).
These conclusions resulting from the analysis of registered X-ray diffractograms correspond with coating tests using XPS (Section 3.1). In particular, according to the PDF-4+ ICDD database, for a coating with a carbon concentration of 21 at.%, the peak with the highest intensity comes from the ZrC phase (Ref. No. 04-019-3519) or from the ZrC0.2 phase (Ref. No. 04-002-0154). At carbon concentrations of 63 and 79 at.%., the intensity of the main diffraction peak ZrC (111) decreases. At the same time, the width of the peak increases. This is due to the reduction of the ZrC phase content in the coating with simultaneous reduction of the ZrC crystallite size. In turn, the diffraction peaks from the Zr phase visible on the diffraction pattern, in the case of the coating with the highest carbon concentration, are derived from the Zr adhesive layer [17].

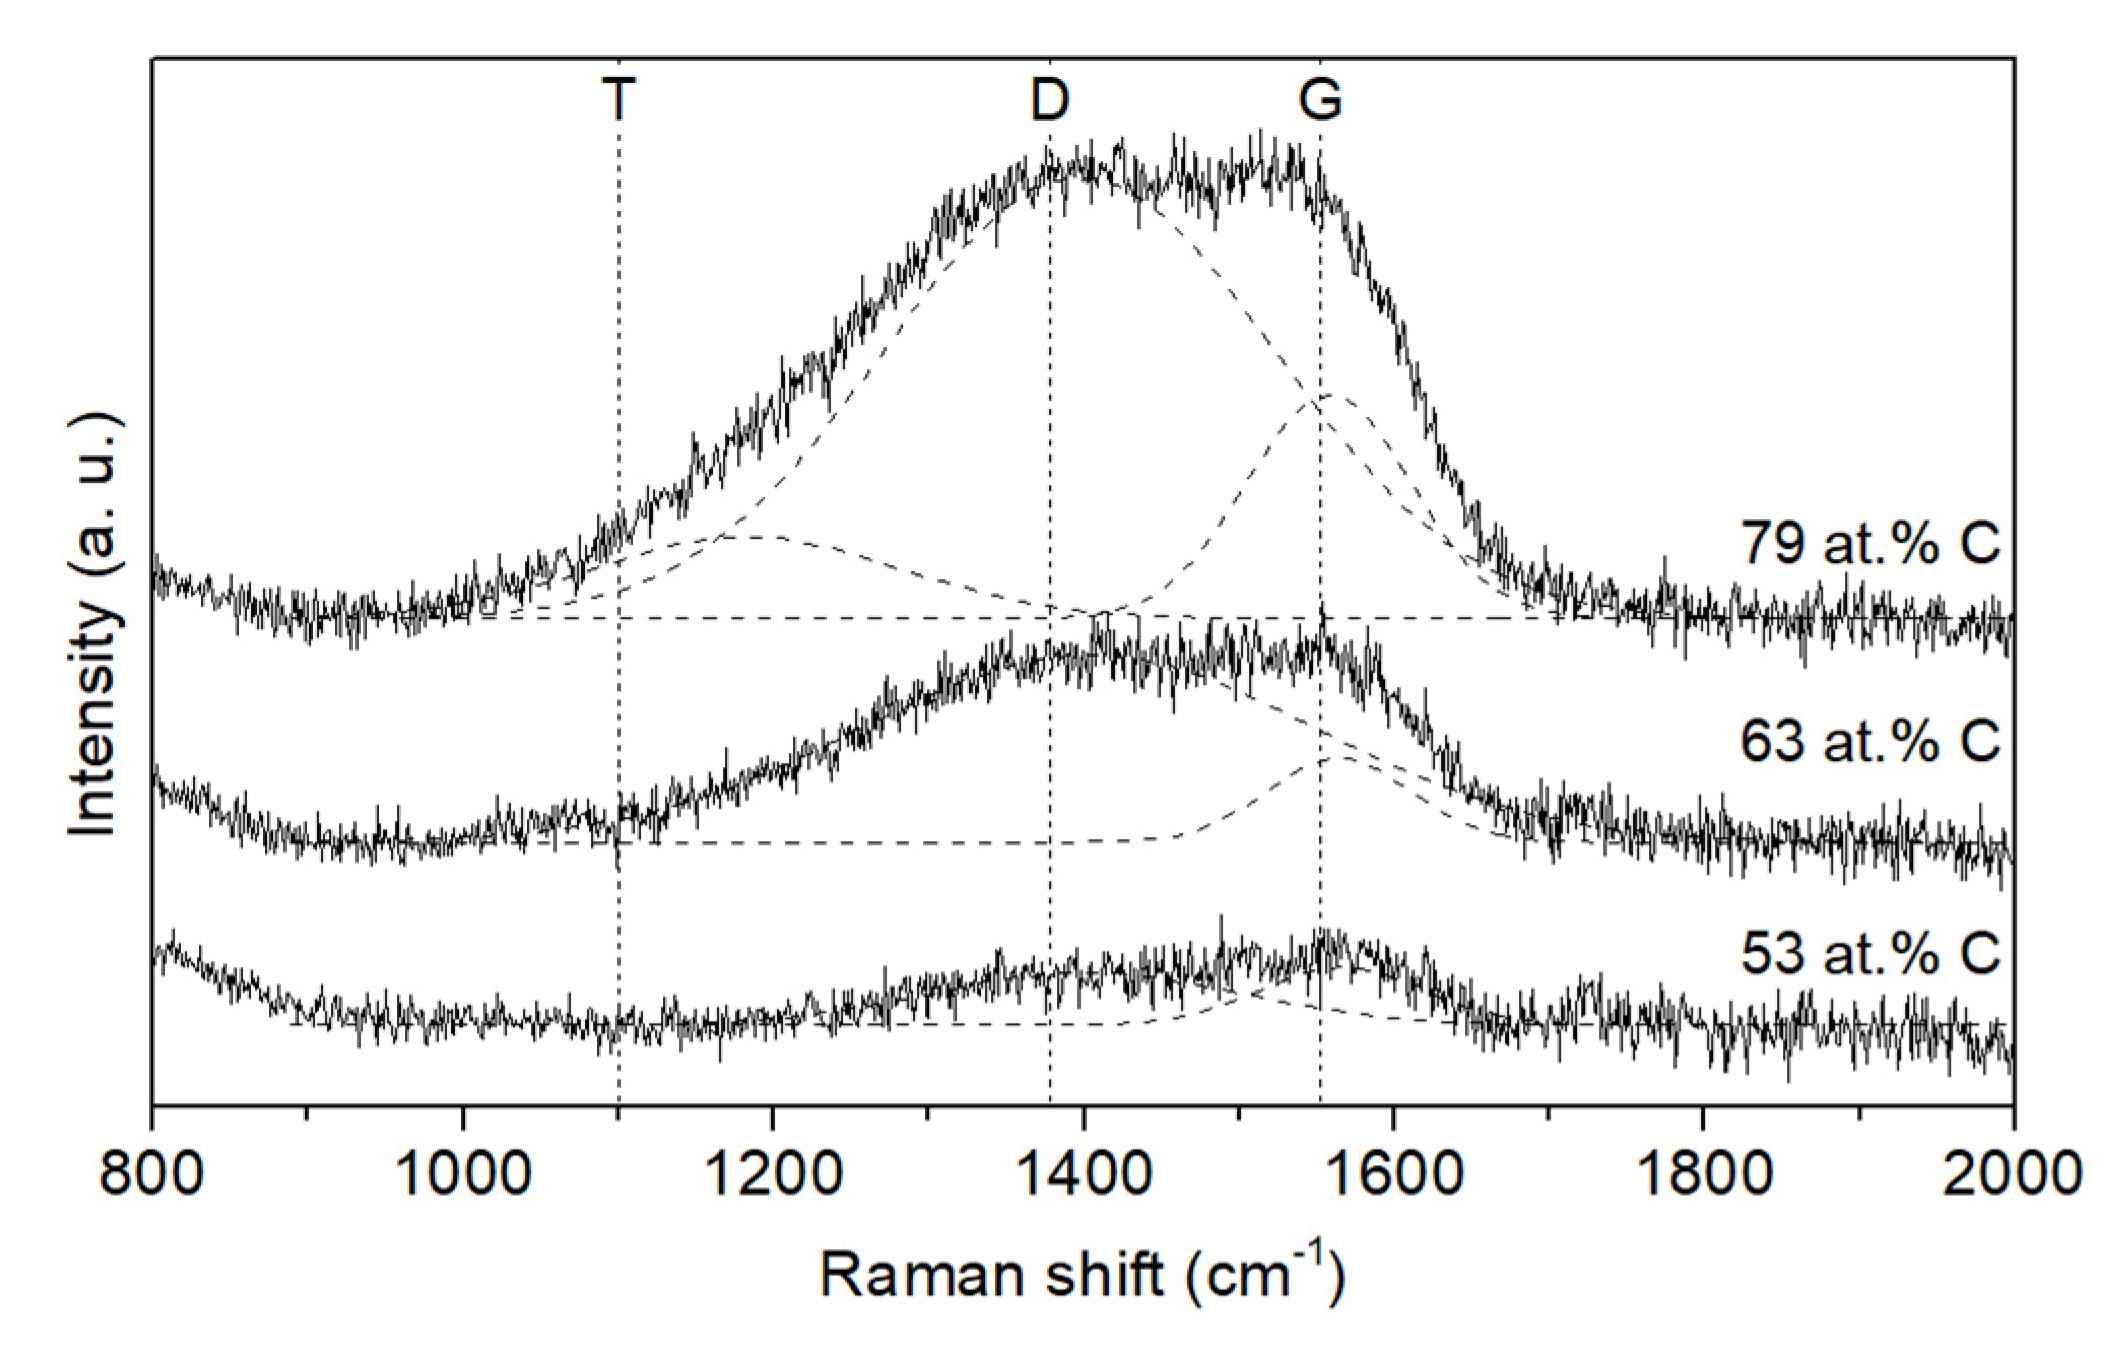
3.3.2. Raman Spectroscopy

Raman spectroscopy was used to determine the carbon structure (sp2 and sp3 bond ratio) in the coatings. For this purpose, Raman spectra were deconvolved with two Gaussian curves, as shown in Figure 6. Peaks were obtained with maximum positions of ~1580 cm−1 and ~1350 cm−1, referred to as peak G and peak D, respectively [36].
A so-called T peak (about 1100 cm−1) also appears for coatings with the highest carbon concentration. According to [37], this peak corresponds to the C–C sp3 vibration density of states (VDOS). Table 4 summarizes the calculated I(D)/I(G) ratios (integrated intensities of D and G peaks) as well as the location of the maximum of G peak for each coating. According to the model proposed in [37], it can be stated that the coatings do not have a graphite structure, as evidenced by the location of the G peak below 1580 cm−1, which is typical for polycrystalline graphite. This location, together with values of I(D)/I(G) ratio above 3.0, indicate that carbon is in amorphous form with a predominant share of sp2 hybridization bonds [17,37]. The maximum of this ratio for the coating by 63 at.% C, with the unchanged position of peak G, may indicate the largest share of sp2 bonds in the carbon phase of this coating.

3.4. Mechanical Properties

In Figure 7a, the hardness of the coatings depending on the concentration of carbon atoms is shown. It can be seen that the hardness of coatings changes dynamically as the concentration of carbon increases. At 21 at.% C, the hardness is 8 GPa, and it increases to almost 23 GPa near the stoichiometric composition. After exceeding 50 at.% C, it gradually decreases, and at a concentration of 79 at.% C it reaches 15 GPa. The Young’s modulus is characterized by the analogous nature of the changes (Figure 7b). According to the interpretation in [17] regarding Ti-C coatings, the increase in hardness is caused by a higher content of the carbide phase in the hard coating and increased concentration of carbon diffused into the interstitial sites of the carbide lattice [17]. Then, based on the analysis of X-ray diffraction patterns (Figure 5), it can be seen that after exceeding the concentration of 50 at.% C in Zr–C coatings, the participation of zirconium carbide phase decreases, which corresponds to a decrease in hardness and Young’s modulus.

3.5. Antibacterial Properties

3.5.1. Static Zone of Inhibition

Four species of microorganisms from the American Pure Culture Collection (Candida albicans ATCC 2091, Escherichia coli ATCC 25922, Staphylococcus aureus ATCC 25923 and Streptococcus mutans ATCC 35668) were used. The selected strains are representative of the peri-implant environment. The criterion for the assessment of fungicidal and bactericidal properties was the presence and size of the zone inhibiting the growth of microorganisms used for research.
According to the results presented in Figure 8 and Figure 9, a 304L steel sample without coating does not create a zone of inhibition for all tested bacterial strains. This zone also does not form on samples with a Zr coating and a Zr–C coating with a carbon concentration of 21 at.% for Candida albicans. For all other bacteria, zones of inhibition are formed for the samples regardless of the carbon concentration in the coating.

3.5.2. Numbers of Live and Dead Cells

In the case of living cells (Figure 10), the number of Candida albicans cells on the Zr coating and the coating with 21 at.% C exceeds the amount of these cells on a 304L steel sample without a coating. The same applies to the Zr coating in the case of Escherichia coli bacterial cells. On coatings with a carbon concentration of 53 at.% and higher, a lower relative number of live cells (Equation (1)) is observed relative to the uncoated sample. Among the tested coatings differing in the carbon concentration, there is a coating with a concentration of ~63 at.% on which a relatively small number of living cells is observed for all bacteria used in the study (according to Equation (1), the higher the bar, the smaller the number of cells).
In the case of dead cells, a similar tendency is observed regarding the number of cells as in the case of living cells (Figure 11). That is, for coatings with a carbon concentration exceeding 53 at.%, the number of dead cells for all the bacteria used in the experiment is significantly reduced compared to the uncoated sample. This effect was demonstrated by calculating the average antibacterial efficiency of the tested coatings in relation to all considered strains (Figure 12).

3.5.3. Contact Angle

Microbial adhesion to the surface of the biomaterial depends on the surface properties of the microbial cell, the properties of the liquid surrounding the material and the surface properties of the material such as hydrophobicity/hydrophilicity and free surface energy. It has been shown in the literature that the formation of dental plaque in the human mouth is significantly reduced on hydrophobic surfaces relative to hydrophilic surfaces [38,39]. One of the reasons may be the fact that hydrophilic bacteria inhabiting the oral cavity tend to be surrounded by an aqueous medium such as saliva, which easily breaks away from the more hydrophobic surface of the biomaterial [39]. For this reason, an important factor in assessing the potential antibacterial properties of the coating is to study its hydrophobic properties by determining the contact angle. The results of measuring the contact angle of coatings and uncoated steel with the artificial saliva solution are shown in Table 5.
Coatings deposited at a acetylene flow rate of 3.5 sccm and above showed a higher contact angle than uncoated 304L steel. Given that the contact angle is a measure of hydrophobicity, it can be concluded that surfaces coated with Zr–C coatings above 50 at.% C are more hydrophobic than surfaces of uncoated 304L steel. The highest contact angle was observed for the surface of the coating with a concentration above 60 at.% C (99.2°).

3.6. Corrosion Properties

In order to determine the protective properties of Zr–C coatings, potentiodynamic tests were carried out in the solution of artificial saliva. Potentiodynamic curves for the substrate/Zr–C coating systems with different concentrations of carbon and for the uncoated substrate are shown in Figure 13. Values of determined corrosion current density (icorr), corrosion potential (Ecorr), polarization resistance (Rpol), breakdown potential (Rb) and the slope of the cathodic curve (-bc) are shown in Table 6.
The lowest corrosion potential among all tested samples (lower than steel) shows a sample with a zirconium coating. This is due to the greater reactivity of zirconium to alloying steel components resulting in rapid surface oxidation. The passive layer formed on the surface is very compact and provides effective protection against electrolytes (a clear passive area, the lowest corrosive current among the tested). The passive layer remains stable until reaching the breakdown potential of 1.175 V. The tests also showed active-passive behavior of the uncoated 304L substrate and the substrate with the coatings with 21 and 53 at.% C. Increasing the carbon concentration in the coating changes the shape of the polarization curves, i.e., there is no visible passive area in the anodic range. It can therefore be concluded that in the case of the coating with the ZrC nanocomposite structure in the amorphous hydrogenated carbon matrix, the oxidation of metallic system components is difficult. For coatings above 53 at.% C, on polarization curves, there is no clear pitting initiation zone (no breakdown potential was determined). This indicates a high protective potential of these coatings against pitting corrosion in an artificial saliva environment.
All of the Zr–C coatings were characterized by a reduction in the corrosion current by an order of magnitude, as well as a slight increase in corrosion potential in relation to the uncoated substrate. Corrosion potential increased with increasing concentration of carbon in the coating. Based on the value of the corrosion current density, the protective performance of the coatings was estimated, which is shown in Table 6. The protective capacity of all coatings is over 95%. The highest yield among Zr–C coatings (97.7%) is characterized by the coating with the highest carbon concentration. This property, in conjunction with the absence of a pitting initiation zone on the polarization curve, makes this coating a good candidate for anticorrosive protection of medical grade 304L in the environment of human saliva.

4. Discussion

On the basis of hydrophobicity and microbiological properties, i.e., bacteriostatic tests and resistance to bacterial adhesion and colonization, it is clear that the antibacterial properties of the Zr–C coatings studied grow in accordance with the sequence:
304L steel → 304L/Zr coating → 304L/Zr–C coating (<50 at.% C) → 304L/Zr–C coating (>50 at.% C).
As demonstrated in the assessment of the antibacterial properties of the Zr–C coatings tested, their hydrophobicity plays an important role by determining the contact angle. All tested coatings with C concentration above 50 at.% showed a higher contact angle than uncoated 304L steel. Considering the contact angle as a measure of hydrophobicity and at the same time as an assessment of potential antibacterial properties, it can be generally observed that surfaces with Zr–C coatings have better antibacterial properties than surfaces of uncoated 304L steel and that coated with Zr. In particular, a rapid increase in antibacterial properties is observed when the carbon concentration in Zr–C coatings exceeds 50 at.%, while practically no significant differences occur in the bacteriostatic tests as well as resistance to bacterial adhesion and colonization. In this context, it is interesting to compare the results of the chemical and phase composition of the coatings carried out using the XPS method and the participation in coatings sp2 and sp3 bonds determined by Raman spectroscopy. First of all, the results of these tests indicate low or no participation of phases with graphite and diamond carbon bonds in coatings with a carbon concentration below 50 at.%. In turn, in coatings with a carbon concentration above 50 at.%, based on the analysis of Raman spectra it can be concluded that the carbon has an amorphous form with a dominance of sp2 bonds.
In [40], hydrogenated amorphous carbon (α-C:H) coatings were produced on PET in an acetylene atmosphere at different working pressures. Coatings differing in the share of sp3/sp2 bonds were obtained. On the basis of the conducted research it was shown that the adhesion of bacteria to the coatings depends on the structure of the coatings and decreases with decreasing sp3/sp2 ratio, i.e., an increase in the share of sp2 bonds. Additionally, in [41] it has been proved that the sp3/sp2 ratio is an important factor affecting the biological response of carbon coatings. As already mentioned, in the test results presented in this article, the coatings produced above 50 at.% C have the observed advantage of sp2 bonds over sp3 bonds, and these relationships, i.e., the ratio of sp3/sp2 bonds, do not change with increasing carbon concentration; the antibacterial properties also do not change. These results correspond to the results presented in the cited papers [40,41].
In the context of the obtained results characterizing antibacterial properties, it should also be taken into account that in the tested coatings there is a specific hydrogen concentration due to the fact that Zr–C coatings are produced in the C2H2 atmosphere. In [5], it is stated that the presence of hydrogen in carbon coatings deteriorates their antibacterial activity compared to a coating containing no hydrogen. Bacterial adhesion is an interfacial process and therefore electrostatic and van der Waals forces are most likely responsible for the interaction between material and bacterial surfaces. Due to the presence of hydrogen in the carbon layer, polarized C-H bonds are formed, which are promoters of Lifshitz van de Waals forces between the microorganism and the polarized surface of the material [42]. Thus, on the one hand, the advantage of sp2 bonds in the coating promotes its antibacterial effect, while on the other hand, the presence of hydrogen may slightly worsen this effect.
The antibacterial properties of the tested coatings were also examined by analyzing the number of cells attached to the coatings. Both live and dead cells were considered. In these studies, it was found that the number of adsorbed cells, both dead and living, decreases significantly after exceeding 50 at.% C compared to uncoated 304L steel and that coated with Zr, i.e., as in other tests, the antibacterial properties of coatings increase significantly after exceeding 50 at.%. In the case of dead cells, studies described in [43,44,45] suggest that the main mechanism for the death of bacteria is the physical interaction with carbon-based coatings. Carbon aggregates can cause irreversible destruction of the outer cell membrane of bacteria that results in the release of cell contents [43]. The smallest wettability of the coating with a carbon concentration of ~63% and the smallest roughness observed in SEM images may be the reason for the weakest adhesion, i.e., the highest antibacterial effectiveness, of this coating in relation to some bacterial strains.
In summary, due to biological properties, the tested coatings after exceeding 50 at.% C are characterized by higher antibacterial properties both compared to uncoated 304L steel and to coatings with a lower carbon concentration. Taking into account the possibility of shaping a wide range of mechanical properties of these coatings, especially for coatings with a carbon concentration above 50 at.%, it can be concluded that these coatings are a good candidate for orthodontic applications. An additional argument strengthening this conclusion is the result of corrosion tests. In particular, increasing the carbon concentration in the coating above the stoichiometry results in hindered oxidation of the metallic components of the systems. For these coatings, there is also no clear pitting initiation area on the polarization curves (no breakdown potential was determined). This indicates a high protective potential of these coatings against pitting in the environment of artificial saliva.

5. Conclusions

The research presented in the article demonstrates the impact of changing the concentration of carbon in Zr–C coatings and related structure changes on the protective potential of these coatings against bacteria and corrosion in the human saliva environment. In particular, based on the results obtained, the following conclusions were drawn:
  • It has been shown that as the concentration of carbon atoms in the coating increases, the content of the phase of carbon unbound to zirconium increases. Raman spectroscopy showed that carbon phase has an amorphous structure with a predominance of bonds with sp2 hybridization.
  • Coatings with carbon concentrations close to 50 at.% show the highest hardness and Young’s modulus. At higher and lower concentrations, there is a sharp decrease in these values.
  • Considering the contact angle as a measure of hydrophobicity and at the same time as an indirect assessment of potential antibacterial properties, it can be generally stated that surfaces coated with Zr–C coatings have better antibacterial properties than surfaces of uncoated 304L steel.
  • There is a rapid increase in antibacterial properties when the carbon concentration in Zr–C coatings exceeds 50 at.%. Above this carbon concentration in the coatings, practically no significant differences occur in the bacteriostatic tests as well as resistance to bacterial adhesion and colonization.
  • Corrosion tests showed the high anti-pitting potential of Zr–C coatings in the environment of artificial saliva.
  • The wide possibility of shaping the mechanical properties of Zr–C coatings in combination with relatively good antibacterial properties after exceeding 50 at.% C concentration in coatings and high protective potential of these coatings makes them a good candidate for orthodontic applications.

Author Contributions

Conceptualization, E.C., Ł.S., E.J., K.M. and J.R.; methodology, E.C., E.D., E.J.; validation, A.G., E.D., E.C., P.C. and K.M.; formal analysis, J.R., K.M., E.C.; investigation, E.C., E.D., A.G. and E.J.; data curation, A.G., K.M., E.C., E.D., E.J.; writing—original draft preparation, J.R., K.M., E.C.; writing—review and editing, K.M., J.R., E.J.; visualization, E.J., K.M., P.C.; supervision, J.R., Ł.S.; project administration, A.G.; funding acquisition, A.G., J.R. All authors have read and agreed to the published version of the manuscript.

Funding

This research was funded by the National Science Center, Poland [grant: Opus 11, No. 2016/21/B/ST8/01738] and grant of KUT No. 504.38.05/19.

Conflicts of Interest

The authors declare no conflict of interest.

References

  1. Sharan, D. The problem of corrosion in orthopaedic implant materials. Orthop. Update (India) 1999, 9, 1–5. [Google Scholar]
  2. Shih, C.C.; Shih, C.M.; Su, Y.Y.; Su, L.H.J.; Chang, M.S.; Lin, S.J. Effect of surface oxide properties on corrosion resistance of 316L stainless steel for biomedical applications. Corros. Sci. 2004, 46, 427–441. [Google Scholar] [CrossRef]
  3. Becker, W.; Becker, B.E.; Newman, M.G.; Nyman, S. Clinical and microbiologic findings that may contribute to dental implant failure. Int. J. Oral Maxillofac. Implant. 1990, 5, 1–17. [Google Scholar]
  4. Ding, M.H.; Zhang, H.S.; Zhang, C.; Jin, X. Characterization of ZrC coatings deposited on biomedical 316L stainless steel by magnetron sputtering method. Surf. Coat. Tech. 2013, 224, 34–41. [Google Scholar] [CrossRef]
  5. Zhou, H.; Xu, L.; Ogino, A.; Nagatsu, M. Investigation into the antibacterial property of carbon films. Diam. Relat. Mater. 2008, 17, 1416–1419. [Google Scholar] [CrossRef]
  6. Yao, S.H.; Su, Y.L.; Lai, Y.C. Antibacterial and tribological performance of carbonitride coatings doped with W, Ti, Zr, or Cr deposited on AISI 316L stainless steel. Materials 2017, 10, 1189. [Google Scholar] [CrossRef] [Green Version]
  7. Größner-Schreiber, B.; Herzog, M.; Hedderich, J.; Dück, A.; Hannig, M.; Griepentrog, M. Focal adhesion contact formation by fibroblasts cultured on surface-modified dental implants: An in vitro study. Clin. Oral Implant. Res. 2006, 17, 736–745. [Google Scholar] [CrossRef]
  8. Groessner-Schreiber, B.; Hannig, M.; Dück, A.; Griepentrog, M.; Wenderoth, D.F. Do different implant surfaces exposed in the oral cavity of humans show different biofilm compositions and activities? Eur. J. Oral Sci. 2004, 112, 516–522. [Google Scholar] [CrossRef]
  9. Muzio, G.; Miola, M.; Perero, S.; Oraldi, M.; Maggiora, M.; Ferraris, S.; Vernè, E.; Festa, V.; Festa, F.; Canuto, R.A.; et al. Polypropylene prostheses coated with silver nanoclusters/silica coating obtained by sputtering: Biocompatibility and antibacterial properties. Surf. Coat. Tech. 2017, 319, 326–334. [Google Scholar] [CrossRef]
  10. Marciano, F.R.; Bonetti, L.F.; Mangolin, J.F.; Da-Silva, N.S.; Corat, E.J.; Trava-Airoldi, V.J. Investigation into the antibacterial property and bacterial adhesion of diamond-like carbon films. Vacuum 2011, 85, 662–666. [Google Scholar] [CrossRef]
  11. Lai, C.H.; Chang, Y.Y.; Huang, H.L.; Kao, H.Y. Characterization and antibacterial performance of ZrCN/amorphous carbon coatings deposited on titanium implants. Thin Solid Films 2011, 520, 1525–1531. [Google Scholar] [CrossRef]
  12. Janvier, G.; Baquey, C.; Roth, C.; Benillan, N.; Belisle, S.; Hardy, J.F. Extracorporeal circulation, hemocompatibility, and biomaterials. Ann. Thorac. Surg. 1996, 62, 1926–1934. [Google Scholar] [CrossRef]
  13. Huang, N.; Yang, P.; Leng, Y.X.; Chen, J.Y.; Sun, H.; Wang, J.; Wang, G.J.; Ding, P.D.; Xi, T.F.; Leng, Y. Hemocompatibility of titanium oxide films. Biomaterials 2003, 24, 2177–2187. [Google Scholar] [CrossRef]
  14. Liu, C.; Lin, G.; Yang, D.; Qi, M. In vitro corrosion behavior of multilayered Ti/TiN coating on biomedical AISI 316L stainless steel. Surf. Coat. Tech. 2006, 200, 4011–4016. [Google Scholar] [CrossRef]
  15. Hauert, R. An overview on the tribological behavior of diamond-like carbon in technical and medical applications. Tribol. Int. 2004, 37, 991–1003. [Google Scholar] [CrossRef]
  16. Geetha, M.; Singh, A.K.; Asokamani, R.A.; Gogia, A.K. Ti based biomaterials, the ultimate choice for orthopaedic implants–a review. Prog. Mater. Sci. 2009, 54, 397–425. [Google Scholar] [CrossRef]
  17. Gilewicz, A.; Mydłowska, K.; Ratajski, J.; Szparaga, Ł.; Bartosik, P.; Kochmański, P.; Jędrzejewski, R. Structural, mechanical and tribological properties of ZrC thin films deposited by magnetron sputtering. Vacuum 2019, 169, 108909. [Google Scholar] [CrossRef]
  18. Szparaga, Ł.; Mydłowska, K.; Gilewicz, A.; Ratajski, J. Mechanical and anti-wear properties of multi-module Cr/CrN coatings. Int. J. Surf. Sci. Eng. 2019, 13, 37–49. [Google Scholar] [CrossRef]
  19. Lewin, E.; Wilhelmsson, O.; Jansson, U. Nanocomposite nc-TiC∕a-C thin films for electrical contact applications. J. Appl. Phys. 2006, 100, 054303. [Google Scholar] [CrossRef]
  20. Chen, C.S.; Liu, C.P. Diffusion barrier properties of amorphous ZrCN films for copper metallization. J. Non-Cryst. Solids 2005, 351, 3725–3729. [Google Scholar] [CrossRef]
  21. Sasaki, M.; Kozukue, Y.; Hashimoto, K.; Takayama, K.; Nakamura, I.; Takano, I.; Sawada, Y. Properties of carbon films with a dose of titanium or zirconium prepared by magnetron sputtering. Surf. Coat. Tech. 2005, 196, 236–240. [Google Scholar] [CrossRef]
  22. Martínez-Martínez, D.; López-Cartes, C.; Fernández, A.; Sánchez-López, J.C. Influence of the microstructure on the mechanical and tribological behavior of TiC/aC nanocomposite coatings. Thin Solid Films 2009, 517, 1662–1671. [Google Scholar] [CrossRef]
  23. Liu, B.; Liu, C.; Shao, Y.; Zhu, J.; Yang, B.; Tang, C. Deposition of ZrC-coated particle for HTR with ZrCl4 powder. Nucl. Eng. Des. 2012, 251, 349–353. [Google Scholar] [CrossRef]
  24. Jansson, U.; Lewin, E. Sputter deposition of transition-metal carbide films—A critical review from a chemical perspective. Thin Solid Films 2013, 536, 1–24. [Google Scholar] [CrossRef]
  25. Andersson, M.; Urbonaite, S.; Lewin, E.; Jansson, U. Magnetron sputtering of Zr–Si–C thin films. Thin Solid Films 2012, 520, 6375–6381. [Google Scholar] [CrossRef]
  26. Zheng, Y.F.; Liu, X.L.; Zhang, H.F. Properties of Zr–ZrC–ZrC/DLC gradient films on TiNi alloy by the PIIID technique combined with PECVD. Surf. Coat. Tech. 2008, 202, 3011–3016. [Google Scholar] [CrossRef]
  27. Chu, C.L.; Ji, H.L.; Yin, L.H.; Pu, Y.P.; Lin, P.H.; Chu, P.K. Fabrication, properties, and cytocompatibility of ZrC film on electropolished NiTi shape memory alloy. Mat. Sci. Eng. C 2011, 31, 423–427. [Google Scholar] [CrossRef]
  28. Chang, Y.Y.; Huang, H.L.; Lai, C.H.; Hsu, J.T.; Shieh, T.M.; Wu, A.Y.J.; Chen, C.L. Analyses of antibacterial activity and cell compatibility of titanium coated with a Zr–C–N film. PLoS ONE 2013, 8, e56771. [Google Scholar] [CrossRef]
  29. Oliver, W.C.; Pharr, G.M. An improved technique for determining hardness and elastic modulus using load and displacement sensing indentation experiments. J. Mater. Res. 1992, 7, 1564–1583. [Google Scholar] [CrossRef]
  30. McCafferty, E. Validation of corrosion rates measured by the Tafel extrapolation method. Corros. Sci. 2005, 47, 3202–3215. [Google Scholar] [CrossRef]
  31. Long, Y.; Javed, A.; Chen, J.; Chen, Z.K.; Xiong, X. Phase composition, microstructure and mechanical properties of ZrC coatings produced by chemical vapor deposition. Ceram. Int. 2014, 40, 707–713. [Google Scholar] [CrossRef]
  32. Balaceanu, M.; Braic, M.; Braic, V.; Vladescu, A.; Negrila, C.C. Surface chemistry of plasma deposited ZrC hard coatings. J. Optoelectron. Adv. Mater. 2005, 7, 2557–2560. [Google Scholar]
  33. Lewin, E.; Persson, P.A.; Lattemann, M.; Stüber, M.; Gorgoi, M.; Sandell, A.; Ziebert, C.; Schäfers, F.; Braun, W.; Halbritter, J.; et al. On the origin of a third spectral component of C1s XPS-spectra for nc-TiC/a-C nanocomposite thin films. Surf. Coat. Technol. 2008, 202, 3563–3570. [Google Scholar]
  34. Meng, Q.N.; Wen, M.; Mao, F.; Nedfors, N.; Jansson, U.; Zheng, W.T. Deposition and characterization of reactive magnetron sputtered zirconium carbide films. Surf. Coat. Technol. 2013, 232, 876–883. [Google Scholar] [CrossRef]
  35. Voevodin, A.A.; Capano, M.A.; Laube, S.J.P.; Donley, M.S.; Zabinski, J.S. Design of a Ti/TiC/DLC functionally gradient coating based on studies of structural transitions in Ti–C thin films. Thin Solid Films 1997, 298, 107–115. [Google Scholar] [CrossRef]
  36. Ferrari, A.C.; Robertson, J. Interpretation of Raman spectra of disordered and amorphous carbon. Phys. Rev. B 2000, 61, 14095. [Google Scholar] [CrossRef] [Green Version]
  37. Ferrari, A.C.; Robertson, J. Raman spectroscopy of amorphous, nanostructured, diamond–like carbon, and nanodiamond. Philos. Trans. R. Soc. A 2004, 362, 2477–2512. [Google Scholar] [CrossRef]
  38. Quirynen, M.; Marechal, M.; Busscher, H.J.; Weerkamp, A.H.; Arends, J.; Darius, P.L.; van Steenberghe, D. The influence of surface free-energy on planimetric plaque growth in man. J. Dent. Res. 1989, 68, 796–799. [Google Scholar] [CrossRef] [Green Version]
  39. Bruinsma, G.M.; Van der Mei, H.C.; Busscher, H.J. Bacterial adhesion to surface hydrophilic and hydrophobic contact lenses. Biomaterials 2001, 22, 3217–3224. [Google Scholar] [CrossRef]
  40. Wang, J.; Huang, N.; Pan, C.J.; Kwok, S.C.H.; Yang, P.; Leng, Y.X.; Chen, J.Y.; Sun, H.; Wan, G.J.; Liu, Z.Y.; et al. Bacterial repellence from polyethylene terephthalate surface modified by acetylene plasma immersion ion implantation–deposition. Surf. Coat. Tech. 2004, 186, 299–304. [Google Scholar] [CrossRef]
  41. Liao, T.T.; Zhang, T.F.; Li, S.S.; Deng, Q.Y.; Wu, B.J.; Zhang, Y.Z.; Zhou, Y.J.; Guo, Y.B.; Leng, Y.X.; Huang, N. Biological responses of diamond-like carbon (DLC) films with different structures in biomedical application. Mat. Sci. Eng. C 2016, 69, 751–759. [Google Scholar] [CrossRef] [PubMed]
  42. Gottenbos, B.; Van der Mei, H.C.; Busscher, H.J. Models for studying initial adhesion and surface growth in biofilm formation on surfaces. Method Enzymol. 1999, 310, 523–534. [Google Scholar]
  43. Kang, S.; Pinault, M.; Pfefferle, L.D.; Elimelech, M. Single-walled carbon nanotubes exhibit strong antimicrobial activity. Langmuir 2007, 23, 8670–8673. [Google Scholar] [CrossRef] [PubMed]
  44. Ali, S.S.; Hardt, J.I.; Quick, K.L.; Kim-Han, J.S.; Erlanger, B.F.; Huang, T.T.; Epstein, C.J.; Dugan, L.L. A biologically effective fullerene (C60) derivative with superoxide dismutase mimetic properties. Free Radic. Bio. Med. 2004, 37, 1191–1202. [Google Scholar] [CrossRef] [PubMed]
  45. Tang, Y.J.; Ashcroft, J.M.; Chen, D.; Min, G.; Kim, C.H.; Murkhejee, B.; Larabell, C.; Keasling, J.D.; Chen, F.F. Charge-associated effects of fullerene derivatives on microbial structural integrity and central metabolism. Nano Lett. 2007, 7, 754–760. [Google Scholar] [CrossRef] [PubMed]
Figure 1. XPS spectra of Zr–C coatings of various carbon concentrations (a) Zr 3d, (b) O 1s, (c) C 1s.
Processes 08 00260 g001
Figure 2. (a) SEM micrographs of the surfaces of coatings. (bd) SEM-EDX mapping with a visible element distribution on the surface of samples: (b) O, (c) C, (d) Zr.
Processes 08 00260 g002
Figure 3. Backscattered electron (BSE) cross-sectional micrograph of samples (a) Zr–C with 53 at.% C, (b) Zr–C with 63 at.% C, (c) Zr–C with 79 at.% C.
Processes 08 00260 g003
Figure 4. (a) Cross-sectional micrograph for sample with 53 at.% C, with (b) an example of mapping distribution of C and (c) an example of mapping distribution of Zr.
Processes 08 00260 g004
Figure 5. X-ray diffractograms of Zr–C coatings at various concentrations of carbon.
Processes 08 00260 g005
Figure 6. Raman spectra for tested coatings.
Processes 08 00260 g006
Figure 7. (a) Hardness, (b) Young’s modulus of deposited coatings depending on carbon concentration.
Processes 08 00260 g007
Figure 8. Antibacterial activity of the sample coated with Zr–C (63 at.% C) coating against bacterial strains based on the inhibition zone test.
Processes 08 00260 g008
Figure 9. Growth inhibition zones of the bacterial strains in presence of the Zr–C coated samples.
Processes 08 00260 g009
Figure 10. The relative number (cfu/cm2) of living bacterial cells on the Zr–C coated samples relative to the number of living bacterial cells on the uncoated 304L sample.
Processes 08 00260 g010
Figure 11. The relative number (cfu/cm2) of dead bacterial cells on the Zr–C coated samples relative to the number of dead bacterial cells on the uncoated 304L sample.
Processes 08 00260 g011
Figure 12. The relative average number (cfu/cm2) of living and dead bacterial cells for all bacterial strains on the Zr–C coated samples relative to the number of bacterial cells on control sample.
Processes 08 00260 g012
Figure 13. Polarization curves obtained for 304L steel substrate and substrate-coating systems in Fusayama-Meyer’s artificial saliva.
Processes 08 00260 g013
Table 1. Chemical composition of Fusayama-Meyer’s artificial saliva, pH 5.3.
CompoundKClNaClCaCl2 × 2H2ONaH2PO4 × 2H2ONa2S × 9H2OUrea
Concentration (g/L)0.4000.4000.9060.6900.0051.000
Table 2. Chemical composition of the Zr–C coatings.
C2H2 Volumetric Flow Rate, sccmC, at.%Zr, at.%O, H and Others, at.%
0~0.091.88.2
1.520.771.67.7
3.552.943.73.4
4.563.333.03.7
6.579.018.92.1
Table 3. Binding energies calculated from the deconvolved XPS spectra.
Zr (3d)O (1s)C (1s)
Type of CoatingPhaseat.%B.E. (eV)Phaseat.%B.E. (eV)Phaseat.%B.E. (eV)
21 at.% CZrC45179.4 (3d5/2)ZrO283.3530.5ZrC39.72281.6
181.6 (3d3/2)O ads.16.7532.2C-C32.16285.1
ZrO255182.3 (3d5/2) C-O-C, C-OH28.12286.7
184.5 (3d3/2)
53 at.% CZrC52.5180.1 (3d3/2)ZrO273.6530.7ZrC24.64282.1
182.0 (3d5/2)O ads.18.3532.2ZrC *14.6283
ZrO247.5182.6 (3d3/2) 8.1533.4C-C33.18284.9
184.6 (3d5/2) C-O-C, C-OH27.57286.8
289.6
63 at.% CZrC84.2180.3 (3d5/2)ZrO270.1531ZrC19.95282.43
182.5 (3d3/2)O ads.20.2532.3ZrC *31.94283.34
ZrO215.8183.1 (3d5/2) 6.1533.3C-C39.55284.83
184.8 (3d3/2) 3.6534.6C-O-C, C-OH8.56286.61
79 at.% CZrC79.2179.9 (3d5/2)ZrO268.5530.3ZrC31.7282.7
182.1 (3d3/2)O ads.19.2531.7ZrC *53.2284.2
ZrO220.8182.6 (3d5/2) 9.1532.9C-C10285.4
184.5 (3d3/2) 3.2534.2C-O-C, C-OH5.1286.6
Table 4. Analysis of Raman spectra for tested coatings.
C (at.%)I(D)/I(G)G Peak Position (cm−1)
533.08 ± 0.131577.1 ± 0.42
634.5 ± 0.081575.4 ± 0.35
793.91 ± 0.091575.1 ± 0.33
Table 5. Contact angle of 304L steel substrate, bare and coated with Zr–C, with Fusayama-Meyer’s artificial saliva.
SampleContact Angle After 30 sContact Angle After 300 s
(°)(°)
304L87.0 ± 0.780.0 ± 0.8
304L/Zr69.1 ± 0.356.0 ± 1.7
304L/Zr–C-21 at.% C73.2 ± 1.459.8 ± 1.3
304L/Zr–C-53 at.% C94.3 ± 0.386.7 ± 0.5
304L/Zr–C-63 at.% C99.2 ± 0.492.7 ± 0.8
304L/Zr–C-79 at.% C97.1 ± 0.489.5 ± 1.7
Table 6. Electrochemical parameters characterizing corrosion processes of 304L steel substrate, bare and coated, in Fusayama-Meyer’s artificial saliva.
SampleEcorricorr-bcRpolEbProtective Efficiency [%]
(V)(A/cm2)(V/dec)(Wcm2)(V)
304L0.191 ± 0.019(827 ± 40) × 10−90.187 ± 0.012(98 ± 3) × 1030.350 ± 0.022
304L/Zr0.430 ± 0.049(7.80 ± 1.73 × 10−90.097 ± 0.011(4.45 ± 0.86) × 1061.175 ± 0.18999.1
304L/Zr–C-21 at.% C0.162 ± 0.016(27.76 ± 7.25) × 10−90.115 ± 0.031(1.93 ± 0.52) × 1061.403 ± 0.03396.6
304L/Zr–C-53 at.% C0.161 ± 0.010(20.41 ± 0.81) × 10−90.115 ± 0.004(1.82 ± 0.55) × 1061.219 ± 0.15497.5
304L/Zr–C-63 at.% C0.157 ± 0.007(41.29 ± 5.07) × 10−90.161 ± 0.017(1.11 ± 0.09) × 106-95.0
304L/Zr–C-79 at.% C0.085 ± 0.016(19.12 ± 2.00) × 10−90.137 ± 0.009(2.18 ± 0.22) × 106-97.7

