Article

Effects of Wall Ventilation on the Shock-wave/Viscous-Layer Interactions in a Mach 2.2 Intake

Department of Aerospace Engineering, Indian Institute of Technology, Kharagpur 721302, India
*
Author to whom correspondence should be addressed.
Processes 2020, 8(2), 208; https://doi.org/10.3390/pr8020208
Submission received: 29 December 2019 / Revised: 27 January 2020 / Accepted: 6 February 2020 / Published: 8 February 2020
(This article belongs to the Section Advanced Digital and Other Processes)

Abstract

:
In order to achieve proficient combustion with the present technologies, the flow through an aircraft intake operating at supersonic and hypersonic Mach numbers must be decelerated to a low-subsonic level before entering the combustion chamber. High-speed intakes are generally designed to act as a flow compressor even in the absence of mechanical compressors. The reduction in flow velocity is essentially achieved by generating a series of oblique as well as normal shock waves in the external ramp region and also in the internal isolator region of the intake. Thus, these intakes are also referred to as mixed-compression intakes. Nevertheless, the benefits of shock-generated compression do not arise independently but with enormous losses because of the shockwave and boundary layer interactions (SBLIs). These interactions should be manipulated to minimize or alleviate the losses. In the present investigation a wall ventilation using a new cavity configuration (having a cross-section similar to a truncated rectangle with the top wall covered by a thin perforated surface is deployed underneath the cowl-shock impinging point of the Mach 2.2 mixed-compression intake. The intake is tested for four different contraction ratios of 1.16, 1.19, 1.22, and 1.25, with emphasis on the effect of porosity, which is varied at 10.6%, 15.7%, 18.8%, and 22.5%. The introduction of porosity on the surface covering the cavity has been proved to be beneficial in decreasing the wall static pressure substantially as compared to the plain intake. A maximum of approximately 24.2% in the reduction in pressure at the upstream proximal location of 0.48 L is achieved in the case of the wall-ventilated intake with 18.8% porosity, at the contraction ratio of 1.19. The Schlieren density field images confirm the efficacy of the 18.8% ventilation in stretching the shock trains and in decreasing the separation length. At the contraction ratios of 1.19, 1.22, and 1.25 (‘dual-mode’ contraction ratios), the controlled intakes with higher porosity reduce the pressure gradients across the shockwaves and thereby yields an ‘intake-start’ condition. However, for the uncontrolled intake, the ‘unstart’ condition emerges due to the formation of a normal shock at the cowl lip. Additionally, the cowl shock in the ‘unstart’ intake is shifted upstream because of higher downstream pressure.

Highlights

  • Cavity ventilation with truncated angle is utilized in controlling the shock-wave and boundary-layer interactions (SBLIs) in a double-ramp mixed compression supersonic intake.
  • Both ‘start’ and ‘unstart’ conditions of the plain and controlled intakes are analyzed.
  • The efficacy of porous cavity in controlling the SBLIs is ascertained using both quantitative and qualitative techniques.
  • Recirculation of fluid inside the cavity significantly improved the control efficiency.

1. Introduction

Conceptualizing and understanding the shock/boundary-layer interaction (SBLI) phenomena has been a challenging task for the scientific community since the dawn of supersonic flights, due to their effects on the performance of the vehicle and its parts. The diverse consequences of SBLIs are not restricted to excessive viscous dissipation, boundary layer degradation, and frequently to flow separation. The most apparent way for the SBLIs to occur is for an externally-produced shockwave to intrude on a boundary layer, formed over a surface. However, the interactions of shockwaves with the boundary layer can also be frequently observed in the supersonic/hypersonic flow past a compression corner created by changing the slope of the surface adjacent to the flow. For instance, at the leading edge of a fin or in front of an isolated object attached to a surface, e.g., a vertical fin. This type of compression corner generally creates a compression wave or a shockwave which has its root inside the boundary layer. Essentially, it has the same effect to an interaction where a shock originates from an external object and impinges upon the boundary layer. The property of the shockwave to increase the static pressure in the flow past it is utilized in supersonic and hypersonic intakes. In other words, the incoming high-speed air is compressed to a suitable combustor-friendly subsonic speed. However, even in these intentional-shock-utilization scenarios, the higher shock strength and their uncontrolled interactions with the viscous boundary layer might produce large drag. Subsequently, this incurs a higher cost to the propulsive efficiency. One of the vital reasons why the only supersonic passenger aircraft in history, the Concorde, was retired is due to its higher cost to propulsive efficiency.
In addition to the above briefed counter-productive characteristics, the SBLIs may even disturb the flow at the entrance into the compressor [1,2]. These interactions may cause noticeable changes in the shock system which may lead to the smearing or the splitting of the shock [3,4]. Additionally, the most important result of SBLI is the expansion of the pressure gradient caused because of shockwaves, so the impact of a sudden pressure change is experienced well upstream. When a sufficiently strong shock impinges on a surface to separate the boundary layer, there is a significant outcome on the advancement of the boundary layer and the adjoining inviscid flow field. Evidently, the impact of an SBLI taking place inside a flow is various and their outcomes are almost enduringly adverse in some respect. These undesired phenomena are the unsteady flow field, separation of flow, total pressure loss, and severe localized heating, which eventually results in engine failure [5,6,7]. Hence, for a smooth and efficient operation of a high-speed intake, the necessary criteriona is to control SBLIs. Here, “control” signifies the modification of flow behavior, either previously or amid the interaction phenomena [8]. Essentially, a control technique either modifies the structure of the shockwave that occurs naturally or suppresses the shock-induced separation. Accordingly, the SBLI control techniques are broadly classified into two types: the shock controls and the boundary layer controls. The SBLI control techniques can also be classified into active and passive controls. The active control methods require external energy input and a sensor to measure and respond to real-time flow characteristics in a feedback loop. Some examples of the established active control techniques are: fluid injection into the boundary layer, boundary layer bleed, and plasma actuators, etc. The importance of active control techniques such as suction, bleed jet actuators, and their role in controlling the SBLIs in supersonic and hypersonic flows has explored by several researchers [9,10]. Souverein and Debiève (2010) experimentally investigated the effect of upstream injection by means of continuous air-jet vortex generators (AJVGs) in shock boundary layer interactions. From the stereoscopic particle image velocimetry (SPIV) and hot wire anemometry (HWA) investigations to study the unsteady characteristics of the reflected shock, it is shown that the AJVGs cause a reduction of the separation bubble length and height [11]. Furthermore, Sriram and Jagadeesh (2014) recently studied the ability of surface blowing and suction in controlling SBLIs inside the shock tunnel. In both cases, the separation length was found to decrease significantly [
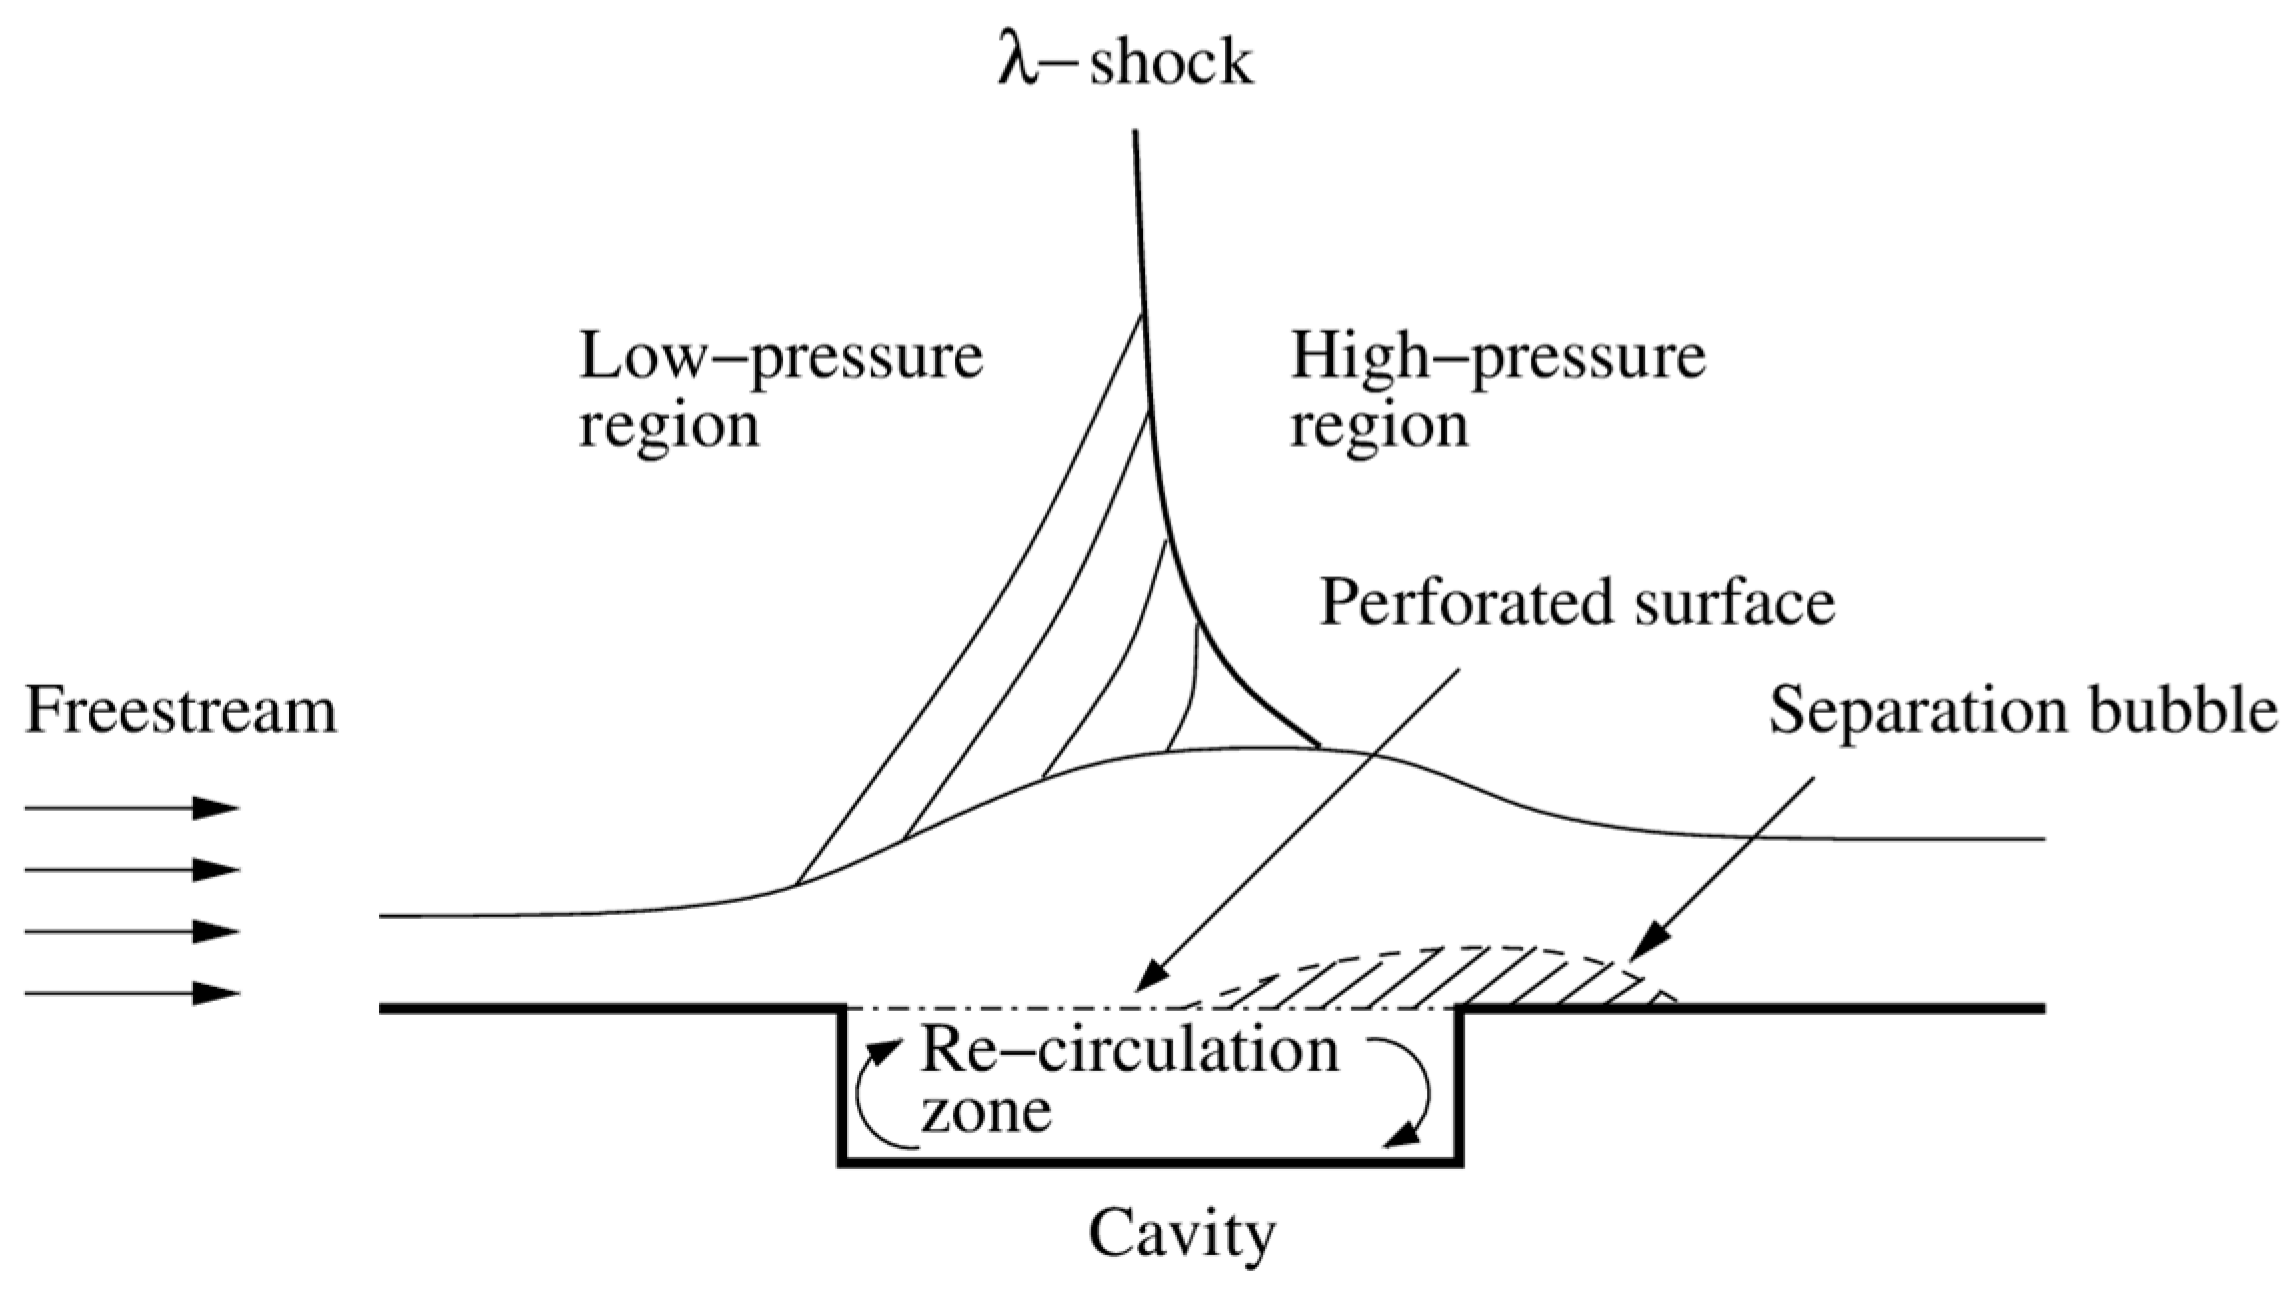
12]. It is important to note that these methods come with extravagant costs and, also, due to the requirement of additional components, the overall weight of the component increases. However, influencing the shock structure using carefully-configured passive shock controls has gained prominence in recent times. Indeed, the principal aim of a shock control is to reduce the stagnation pressure loss due to interactions by increasing the size of the smeared region and stretching the flow domain. Instead of attempting to generate a large smeared shock foot with continuous compression waves it is generally easier to aim for a large λ-shock which replaces the shock foot with an oblique shock followed by a near-normal shock, similar to the image illustrated in Figure 1. It is proved that the flow downstream of control generated λ-shock exhibits a significant stagnation pressure recovery. Shock control through wall-ventilation promises to be one of the most fail-proof techniques for practical application in high flights. Here, a cavity covered with a porous surface is placed underneath the shock location [13]. A natural flow circulation occurring inside the cavity from the downstream high-pressure region to the upstream low-pressure region produces a suction effect in the upper boundary layer. Thus, the strong interacting shock is split into a weak λ-shock (Figure 1). In subsequent studies, the effectiveness of the cavity covered with perforated surface in controlling the interactions were tested in supersonic and hypersonic flow regimes [14,15]. The dependency of the control effectiveness on the dimensions of the cavity (length, depth) and porosity over a flat plate at Mach 1.3 has been studied by Roy et al. (2017) [16]. It is observed that, at this Mach number, the cavity length had a strong influence on the drag reduction compared to the other tested parameters. This result was in accordance with Doerffer and Bohning (2003), who suggested that a shallow cavity of aspect ratio greater than 2.0, covered with a porous wall, is quite efficient in controlling the SBLI over a flat plate. This study was further extended by to test the active as well as hybrid control techniques [17]. Here, when the suction was applied by external means along the cavity, it becomes a hybrid control, whereas, if the suction was applied on the cavity itself then the configuration was considered to be active-controlled. Various passive devices including conventional porous plate, micro-porous plate, streamwise slots, and flaps were studied in a Mach 1.42 flow [18]. However, in all the slot and flap controlled cases, the flow fields downstream of the SBLIs were found to have high levels of turbulence compared to the predominantly two-dimensional flow over the conventional porous surfaces. Szulc et al. (2018) also found that in the presence of surface ventilation, the normal shock transforms into a new structure. This type of shock structure is based on the relative length of the cavity which might either lead to a large lambda-foot structure (classical cavity), or to a sequence of oblique waves (extended cavity with larger aspect ratios), or to a gradual compression [19]. It was also proposed by Szulc et al. (2016), that the transformation of this normal shock forced by an extended cavity of large aspect ratio leads to noise reduction for high-speed impulsive helicopter rotors [20]. Compared to the other SBLI shock control techniques, the wall-ventilation through a shallow cavity has shown a considerable increase in losses due to boundary layer thickening. However, the shock strength was significantly reduced due to the formation of a recirculation zone inside the cavity. Indeed, the passive cavity placed beneath the interaction region establishes a re-circulation zone by injecting the flow upstream of the shock through the cavity. As a consequence, the pressure difference across the shock becomes more uniform and the flow experiences nearly an isentropic compression, leading to a greater pressure recovery downstream of the shock [21].
From the above discussion, it is clear that an extensive amount of research on wall ventilation has been carried out using simple idealized configurations, such as a 2D and 3D flat plate or aircraft wing. The porous cavity is a well-established drag reduction technique for an airfoil, however, in the present study it is deployed in the supersonic intake to smear and manipulate the shock structure for a minimal total pressure loss. In the literature, the researchers have investigated the ‘boundary-layer-bleed’ for a long time to suppress the separation bubble and minimize the total pressure loss. However, this technique causes a decrease in the effective mass flow rate. Thus, this study explores the cavity covered with porous surface which creates a natural recirculation by extracting the high-pressure fluid from the downstream and injecting it into the upstream low-pressure region. This phenomena extends the interaction zone, thereby transforming a single strong shock into several weak shocks. In addition, the flow structures and characteristics observed in simple geometries, such as the flat plate and aircraft wings cannot be easily extended to complex vehicle components, e.g., the intake.
In most of the previous studies, a supersonic intake is modeled as a flat surface or a single-compression ramp. A single-ramp intake, however, experiences a large amount of drag due to an oblique shock of considerable strength, produced at the concave corner of the ramp. Thus, one method of drag reduction could be to generate another oblique shock downstream of the first one, using a double-ramp configuration. The compressed flow exiting the double-ramp would be made to pass through the intake-isolator, which, in turn, is designed to generate a series of weak shocks and expansion waves. This further compresses the flow with minimal pressure losses and, hence, contributing to less wave drag. Thus, cavity ventilation with a truncated angle was deployed in the present study to manipulate the shockwave/boundary layer interactions in a double-ramp mixed-compression supersonic intake, where the shock, generated at the cowl-lip, is located near the convex corner of the ramp. In order to provide significant recirculation, the porous cavity should be deployed right at the shock impinging point. In a series of experiments, it was observed that, with a Mach 2.2 ‘intake-start’ condition, the interaction of shock wave and the boundary layer takes place near the convex corner of the ramp. Due to the typical nature of the intake geometry, a truncated cavity is being used at the cowl shock impingement location.
Interestingly, the cavity covered with a porous upper surface demonstrates two entirely distinct flow characteristics. It inflicts a significant reduction in the shock strength by causing the formation of a lambda shock. However, this advantage is not stand alone and comes with a penalty of boundary layer degradation. Our objective is to optimize the porosity level at different contraction ratios to maximize the benefit in controlling the SBLIs.
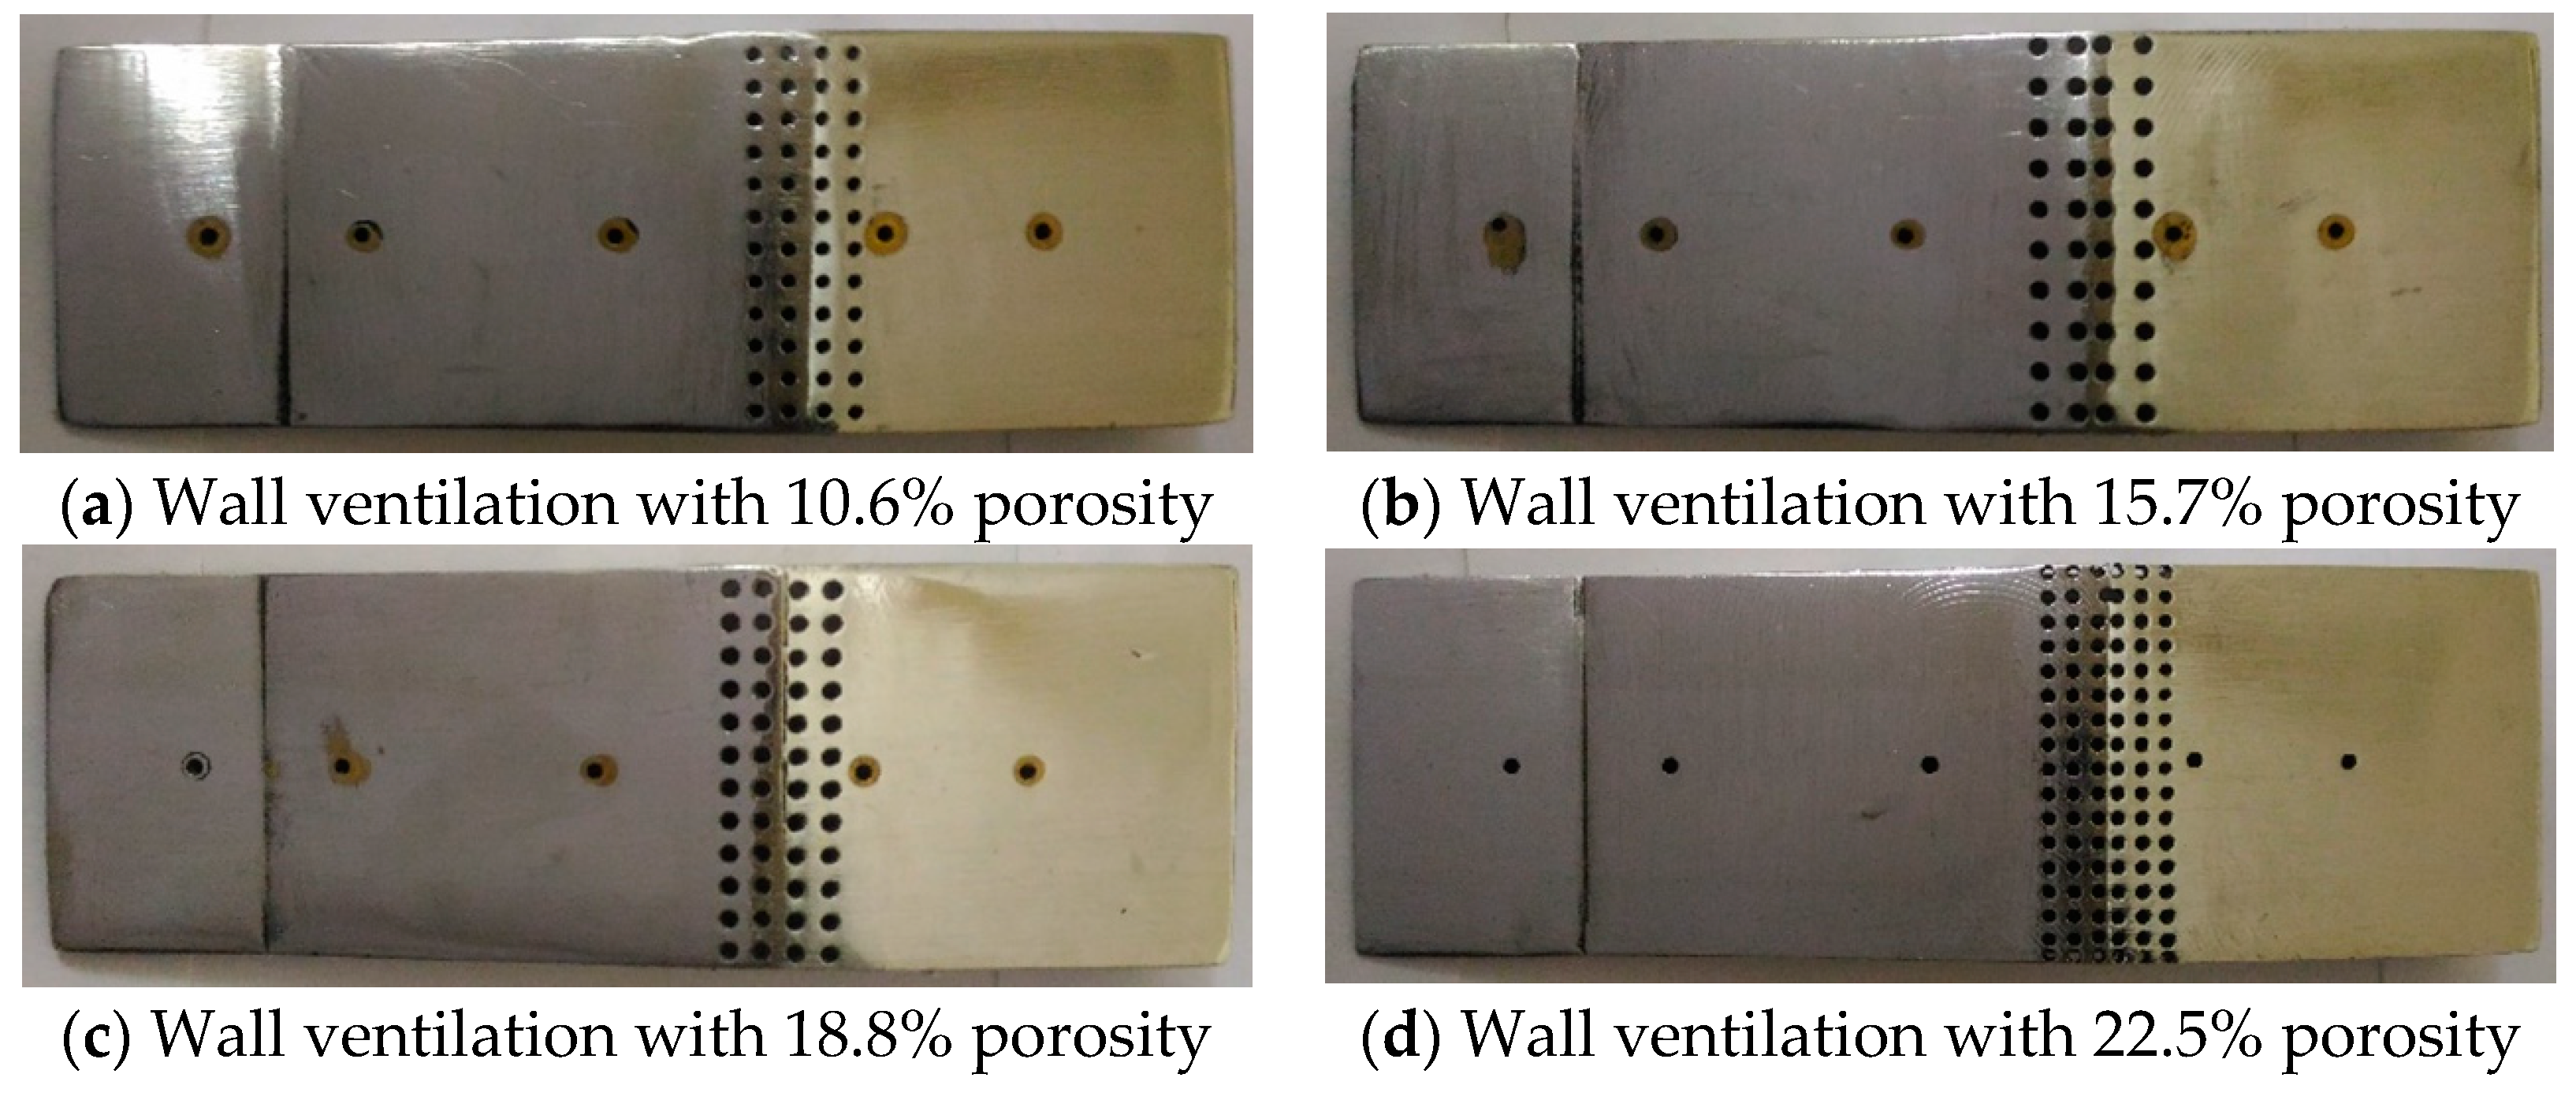
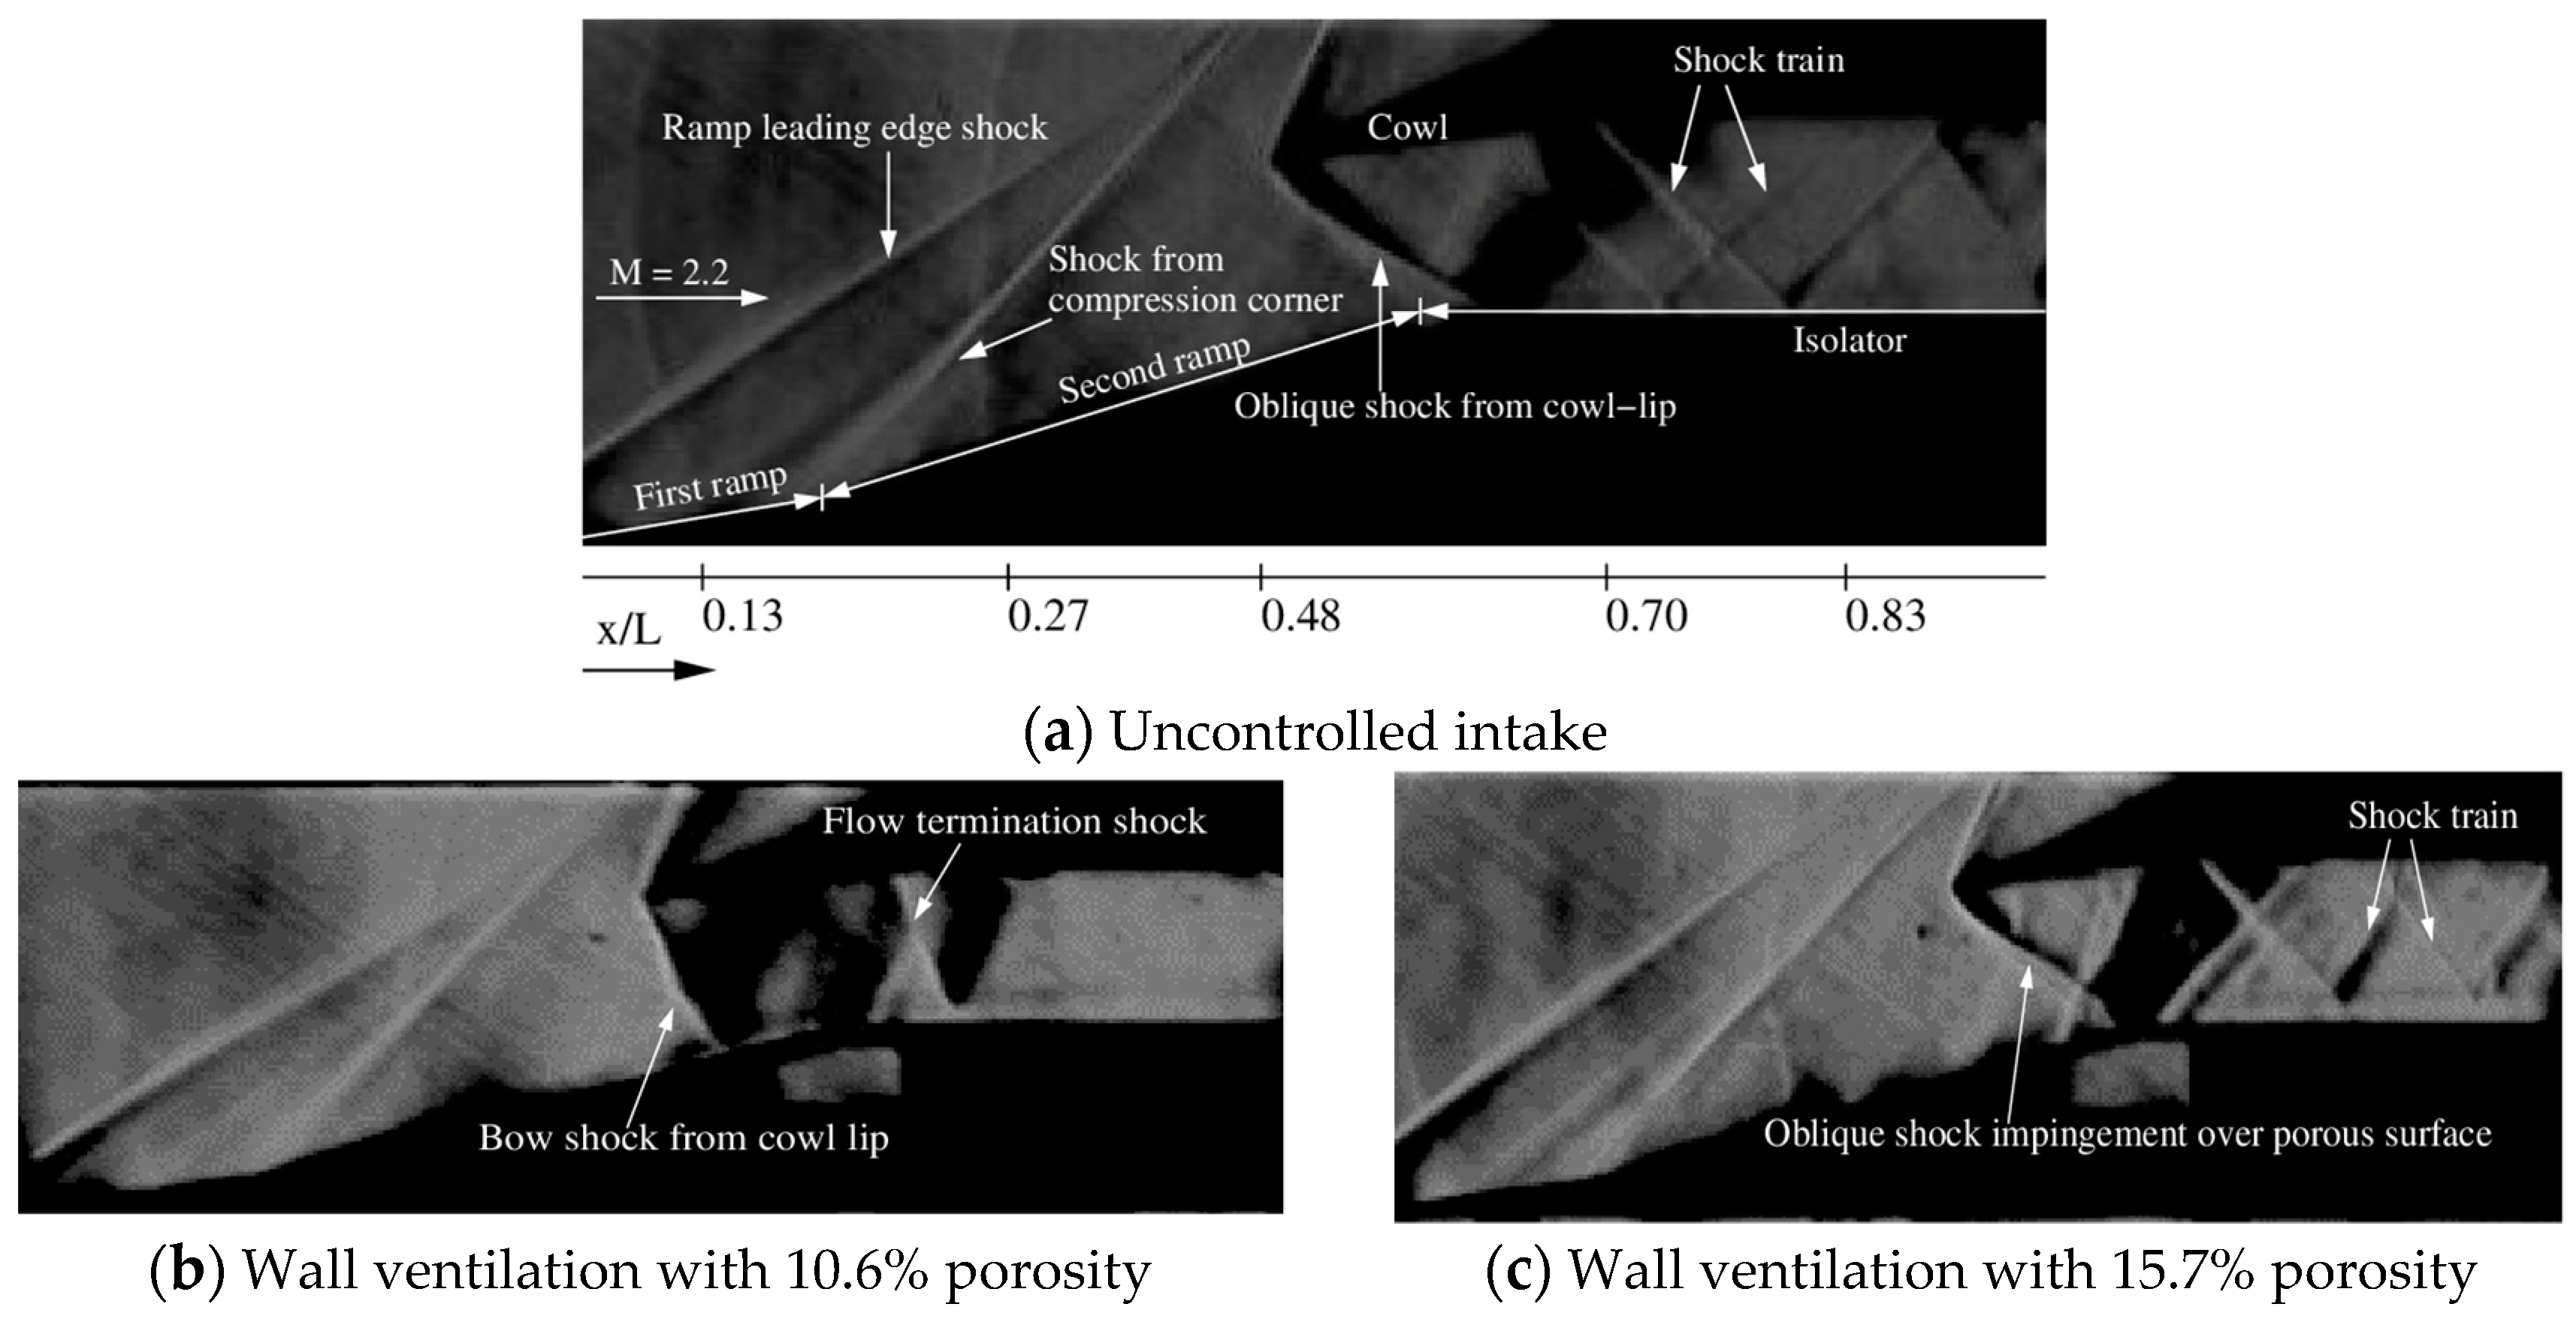
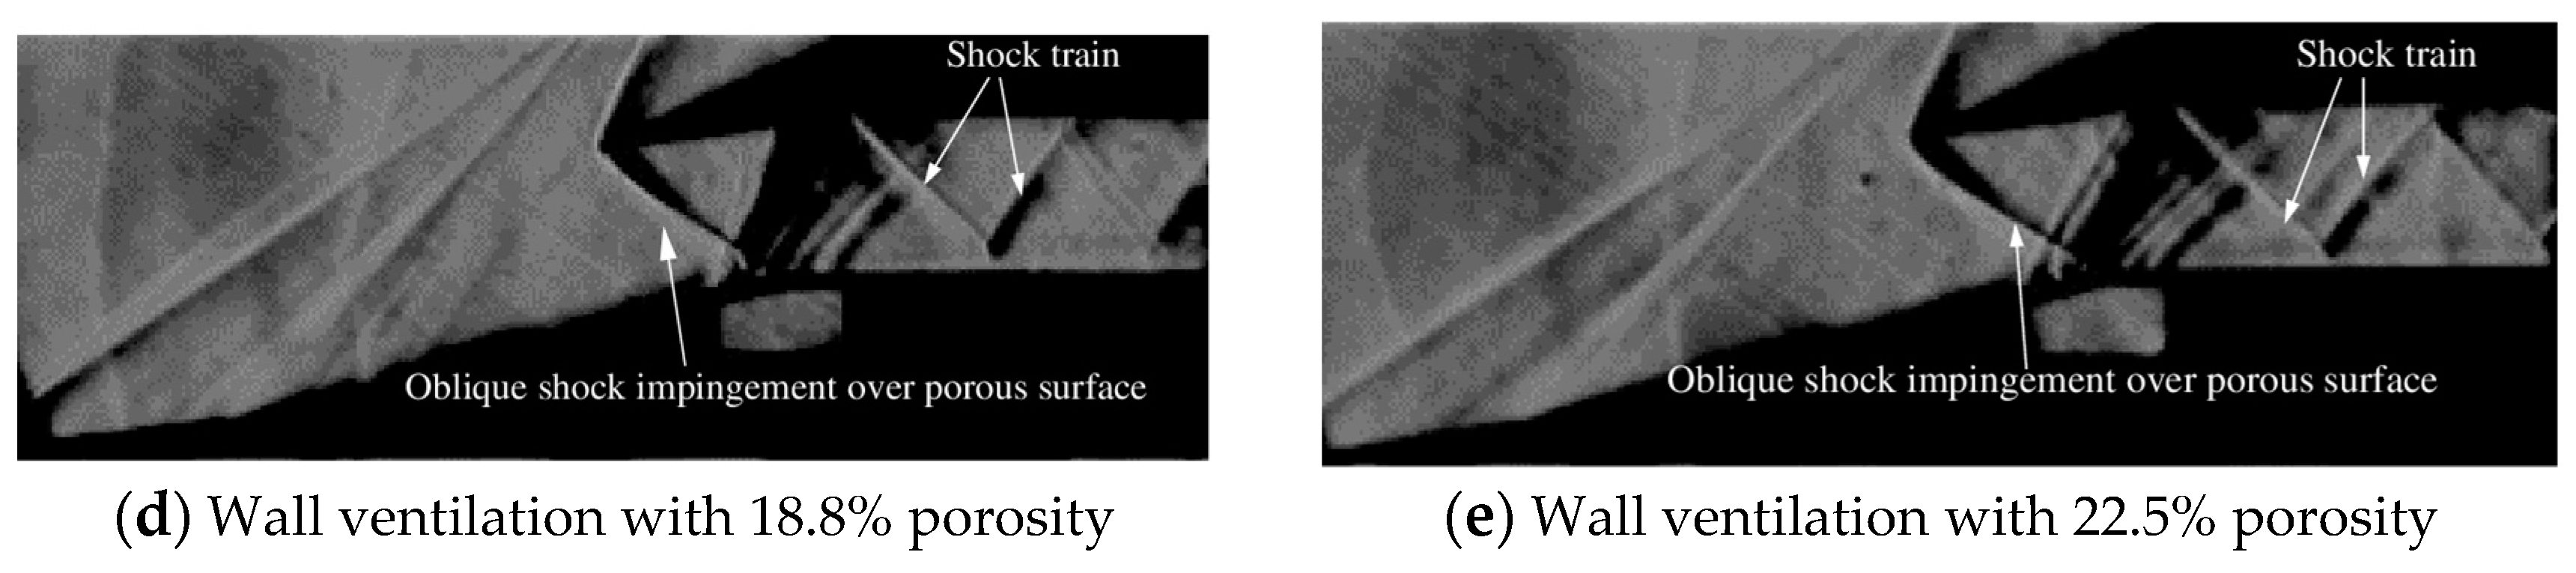
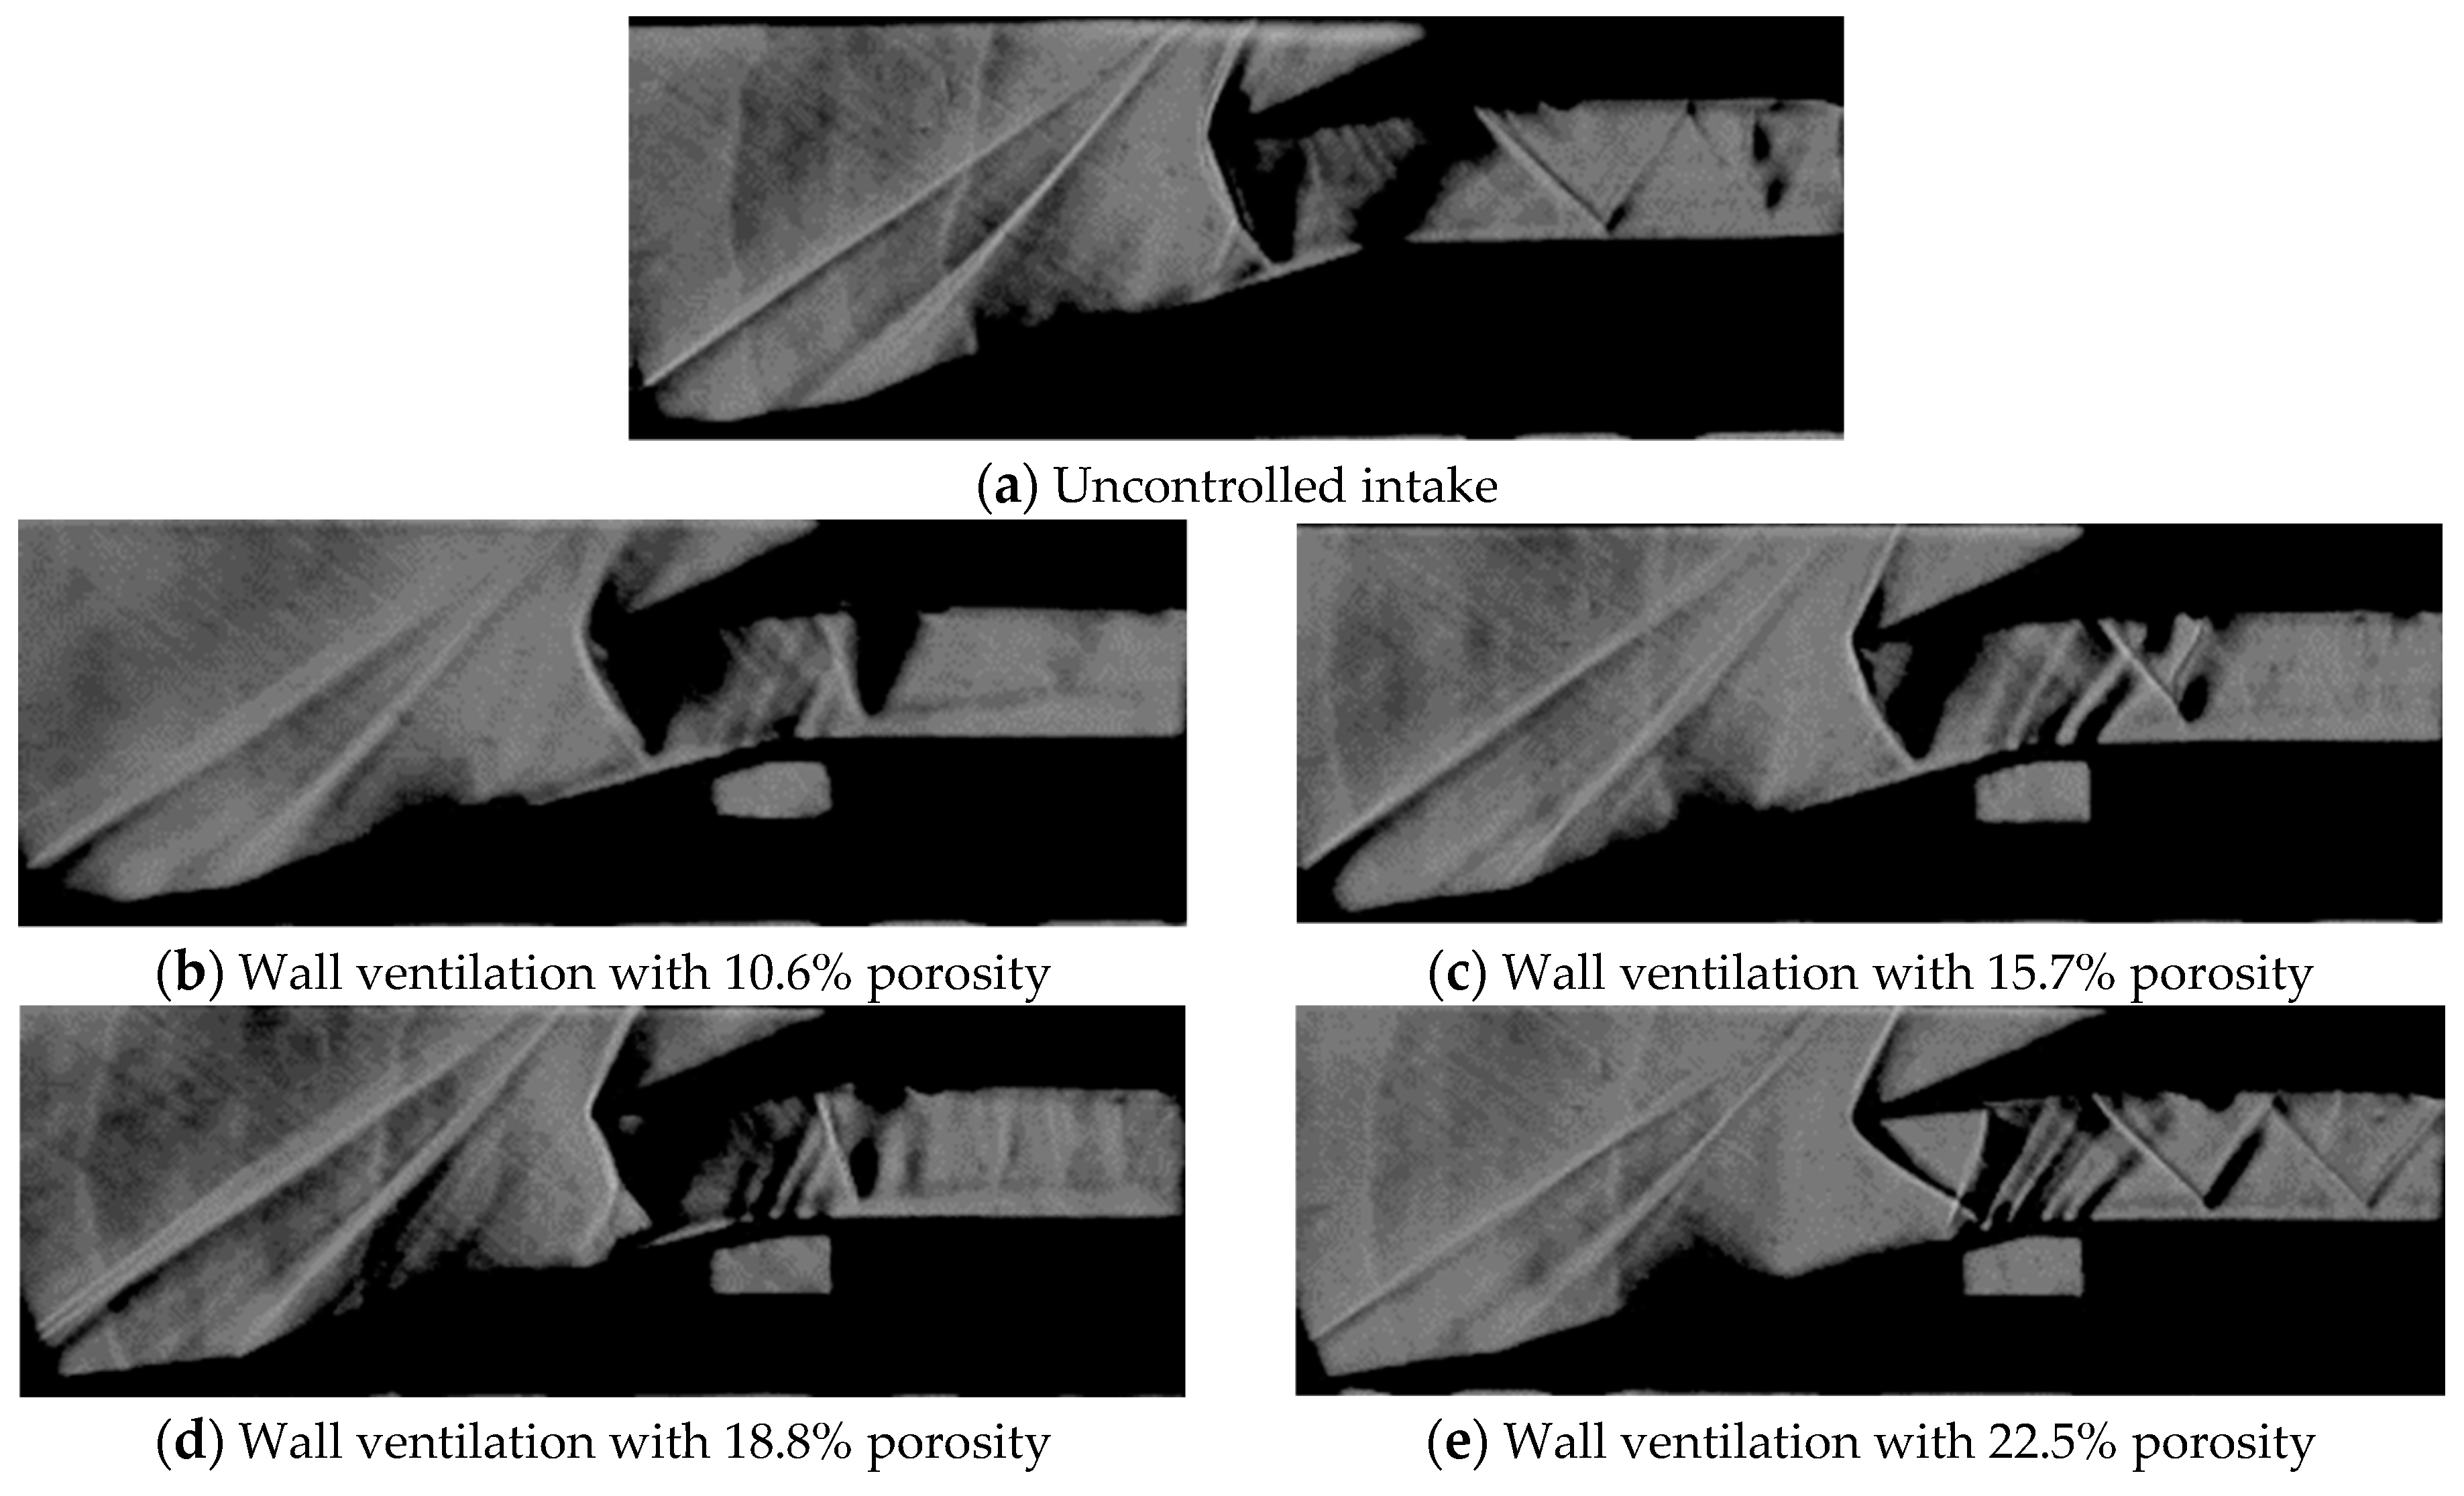
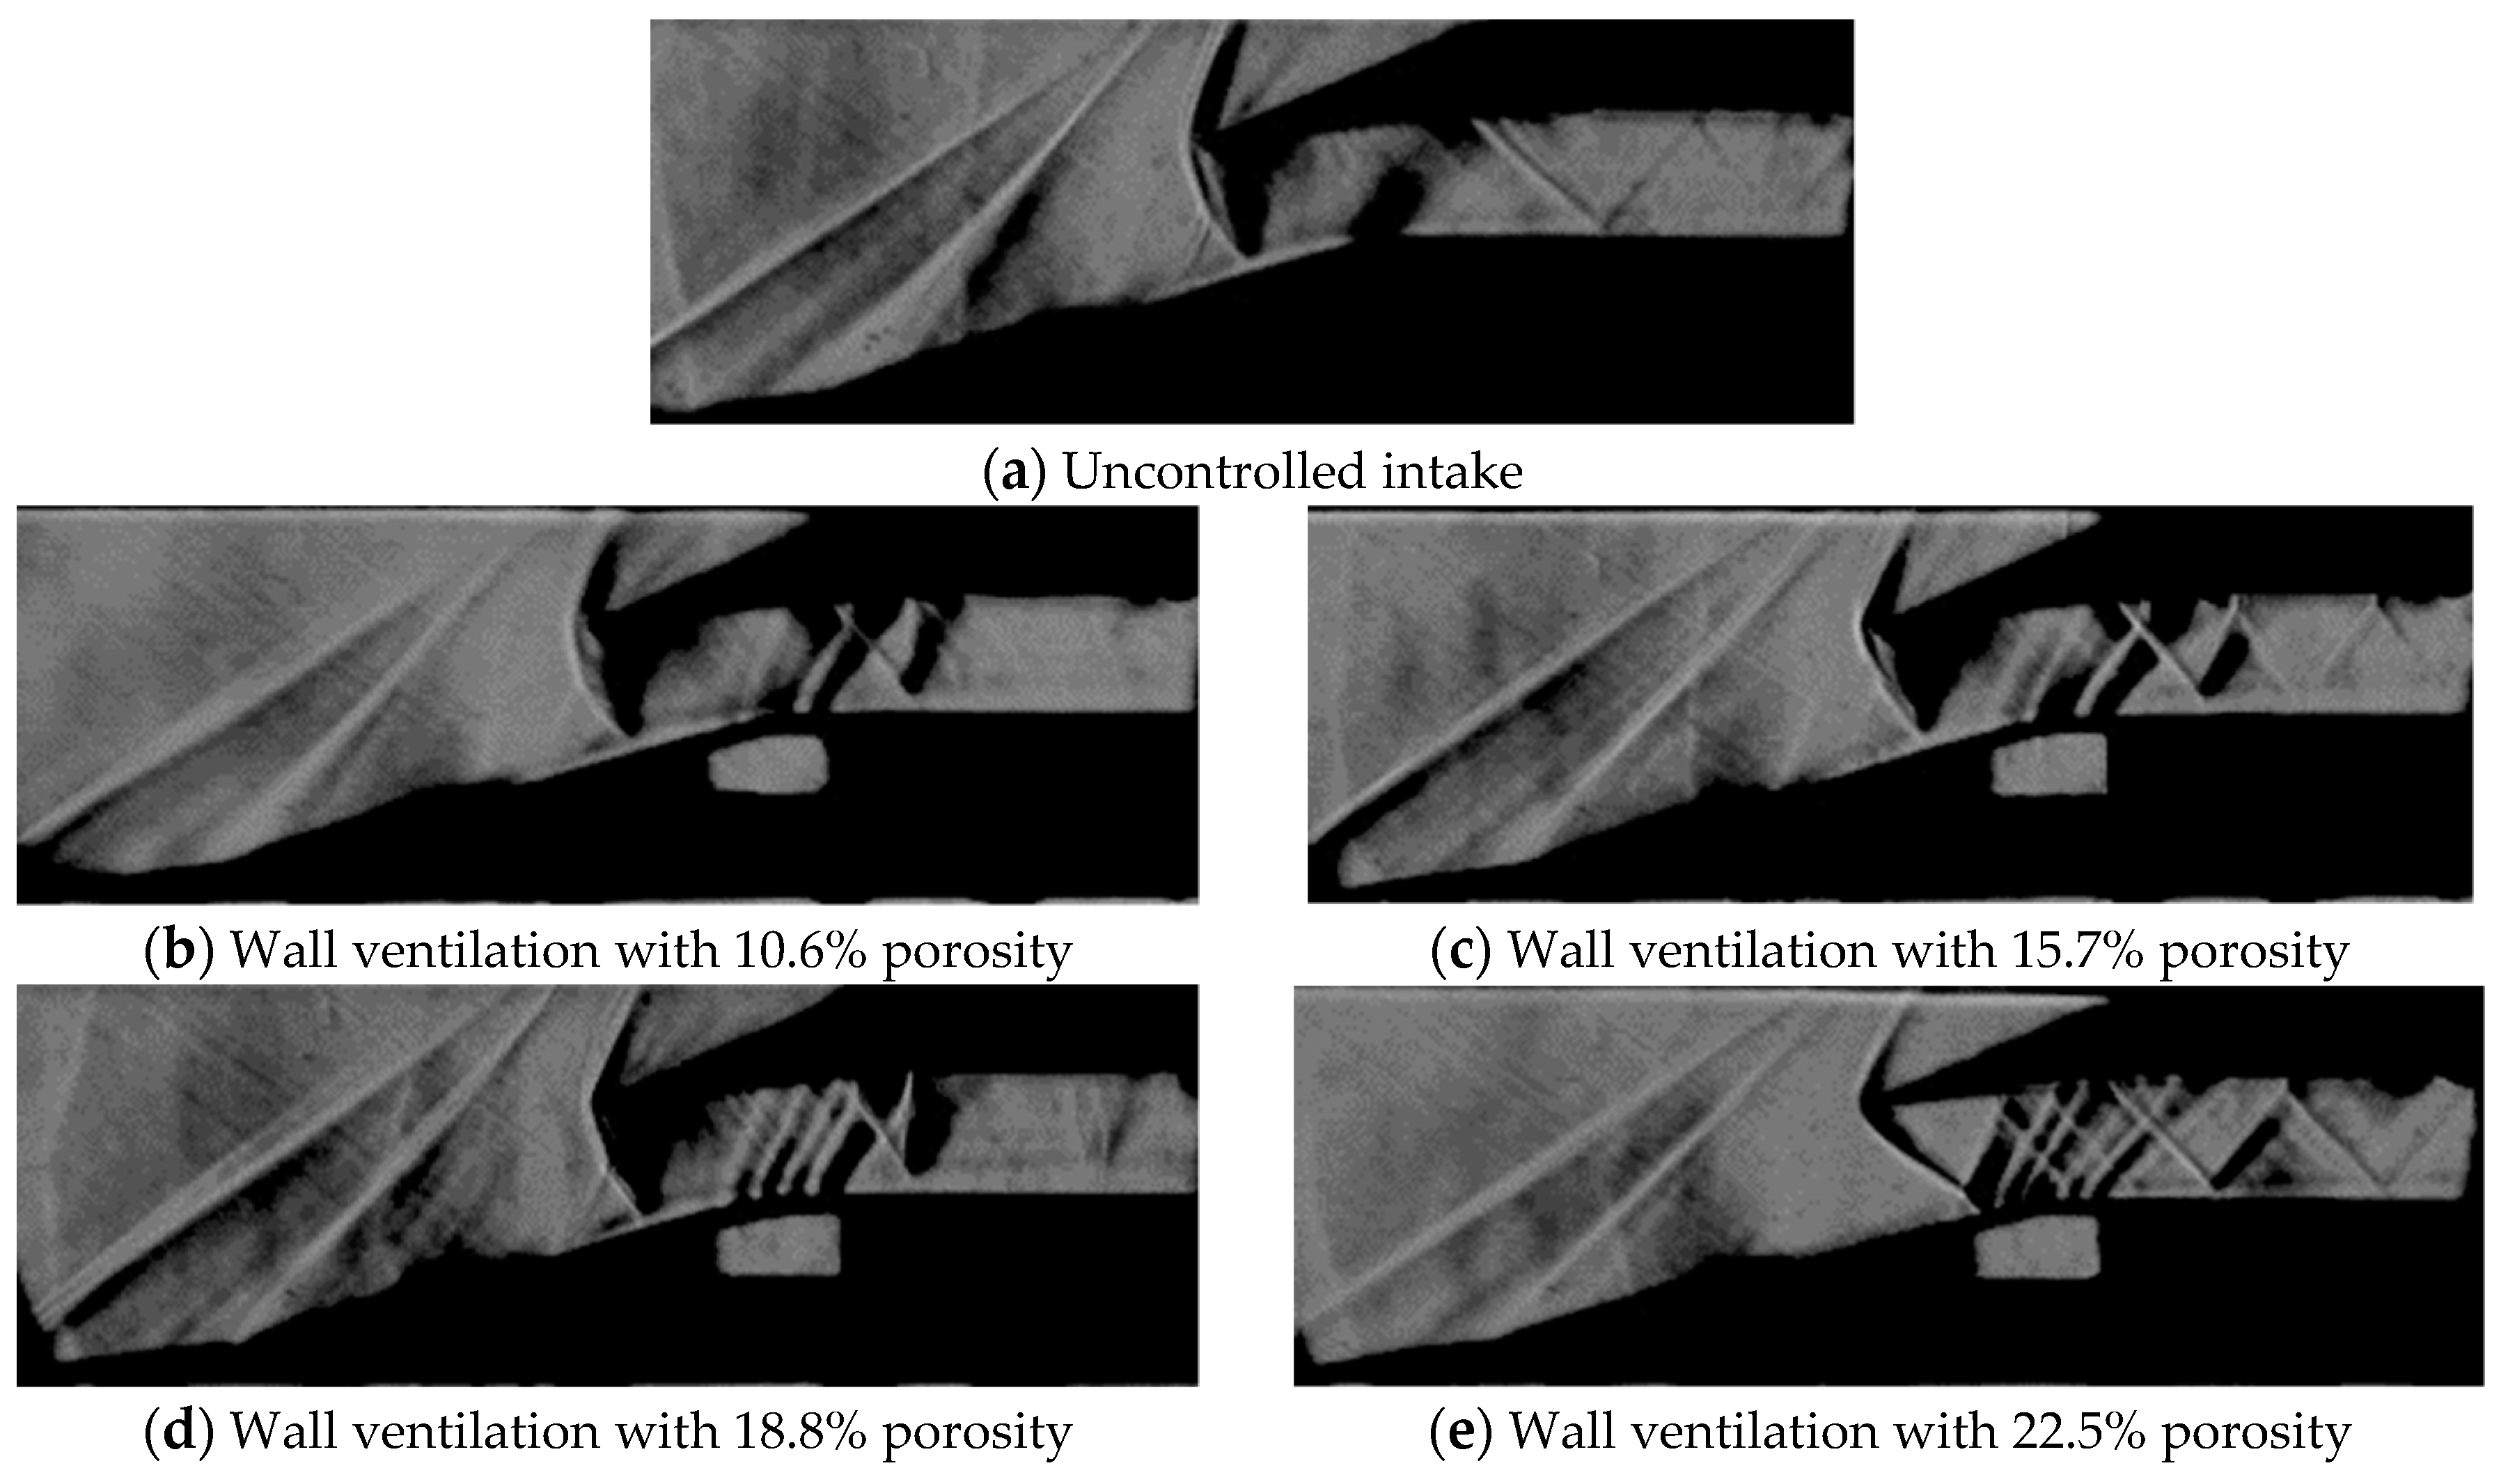
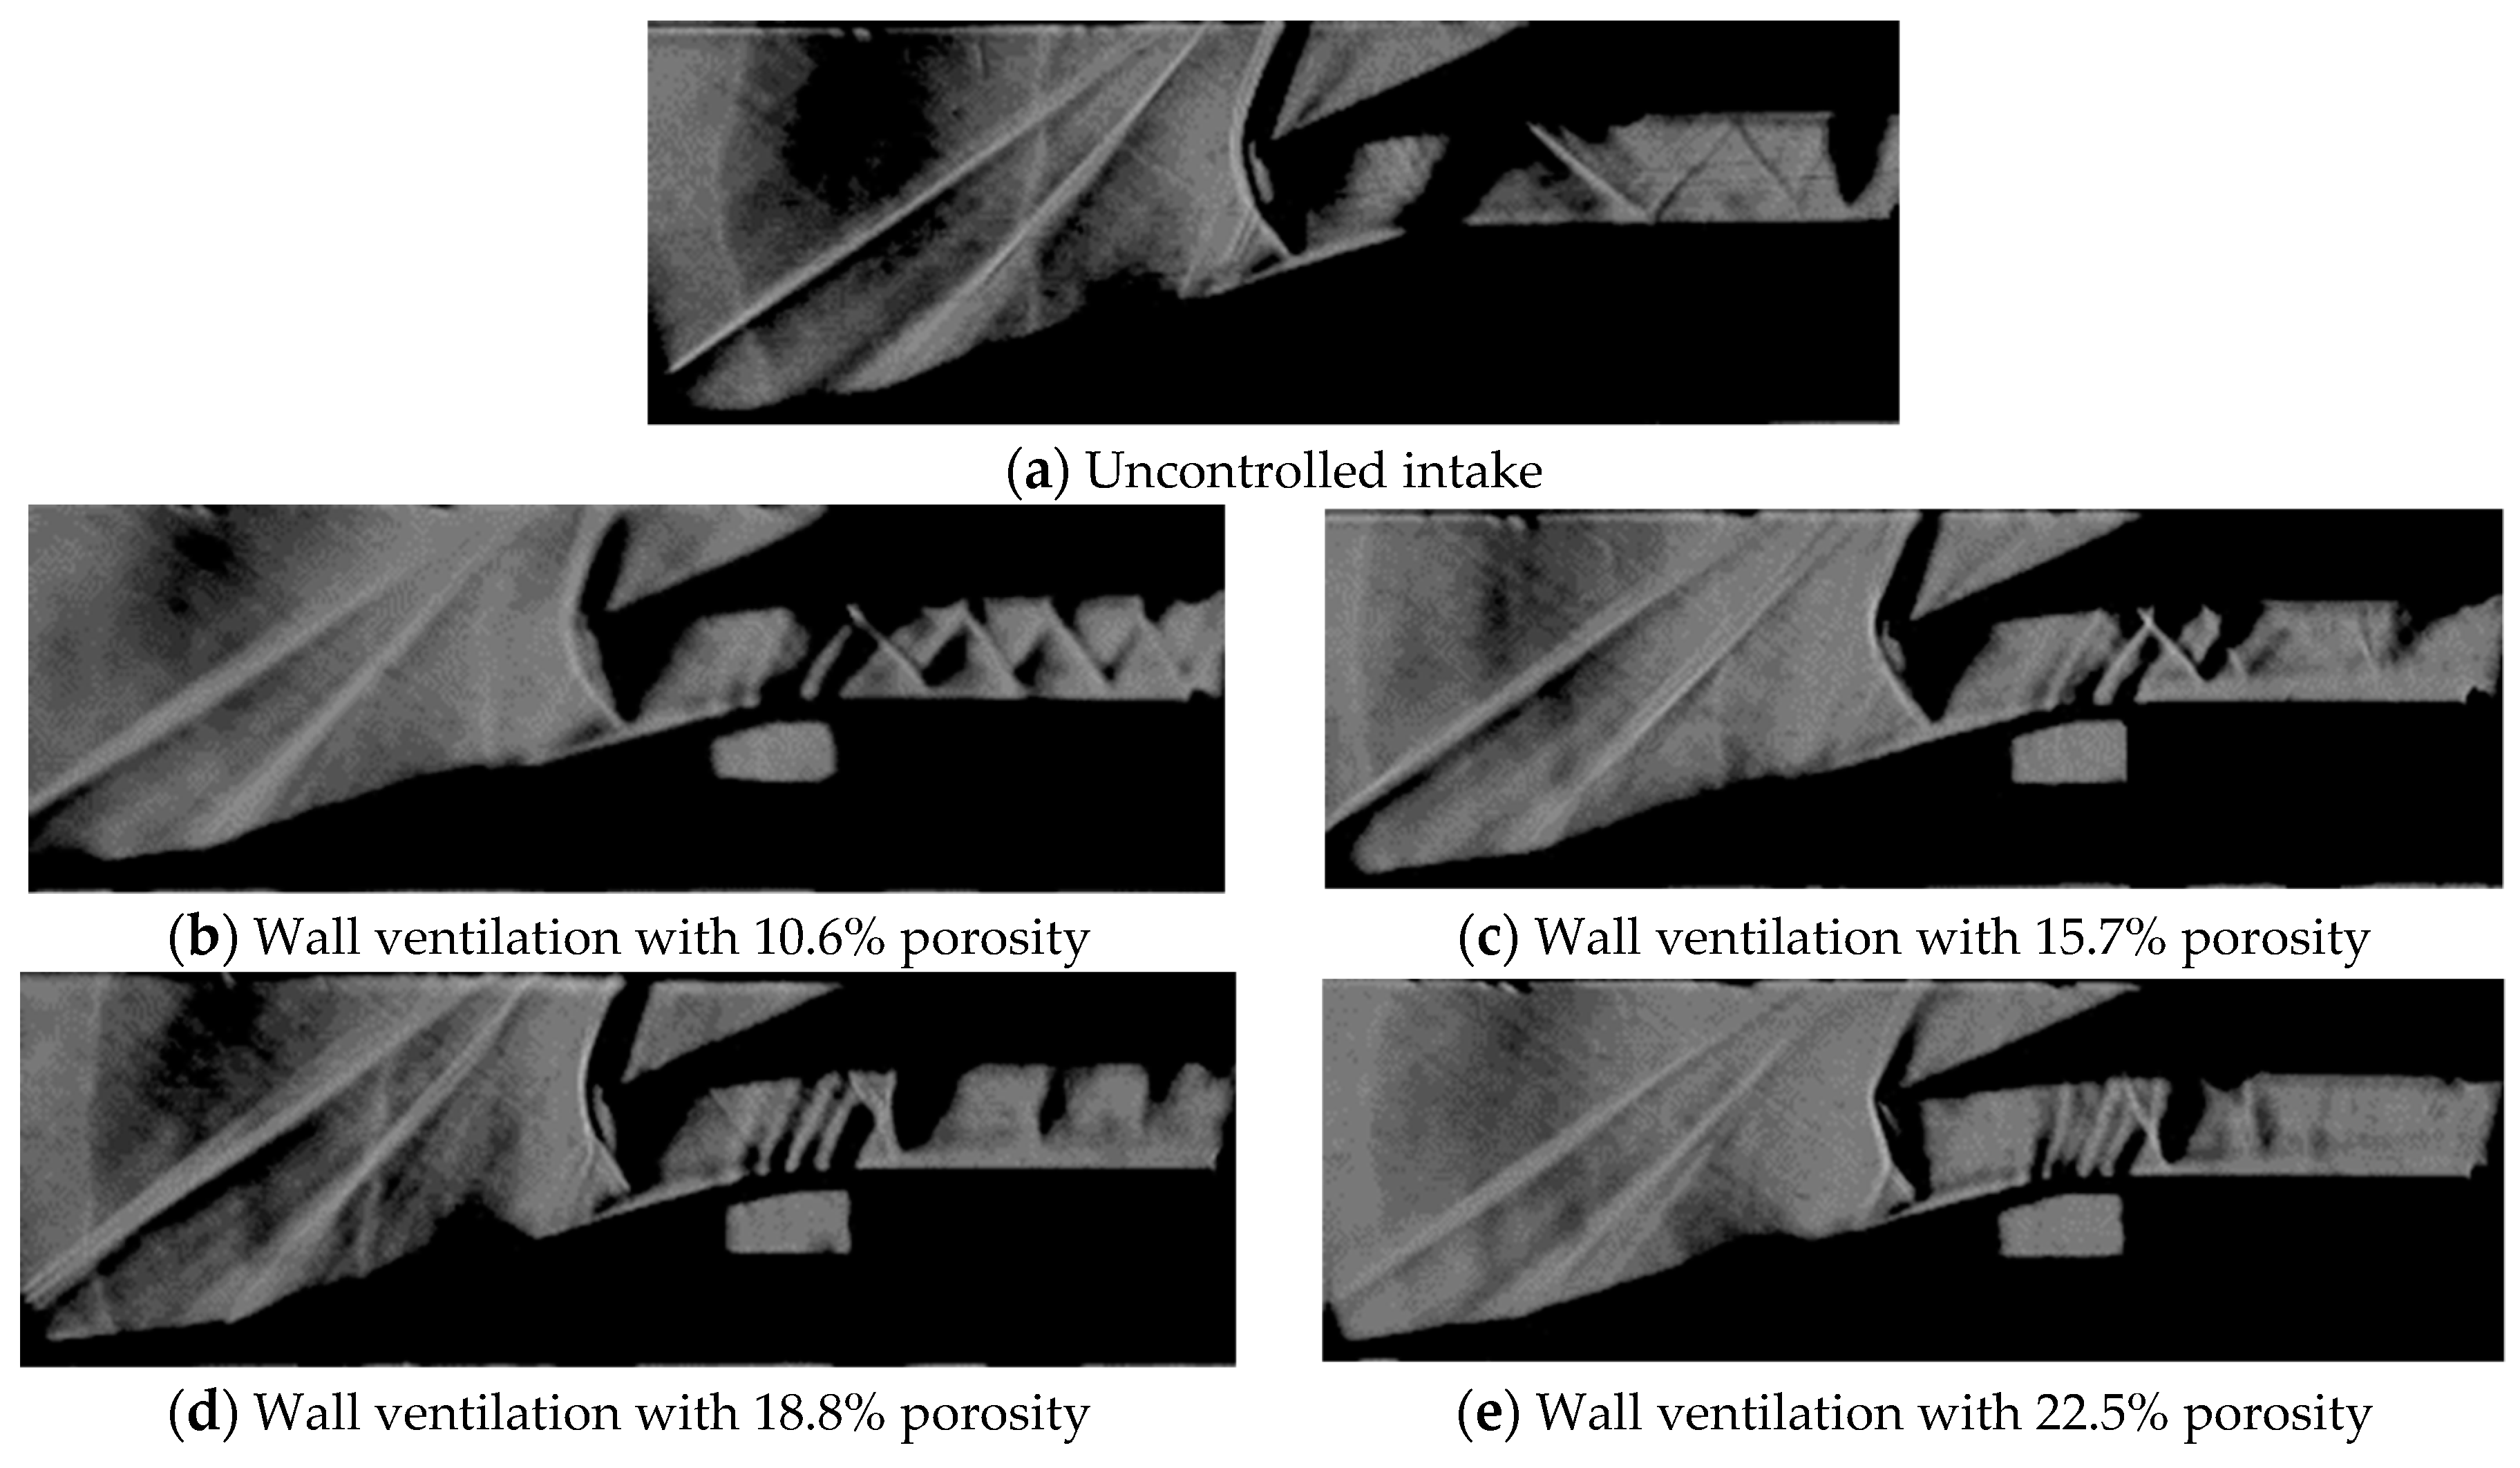
Keeping these observations in mind, an attempt is made in the present study to evaluate the efficacy of wall ventilation deployed at the intake-core at the region of shock impingement. The wall ventilation, on the whole, can be explained as a combination of two parts: a shallow cavity with a truncated-rectangular cross-section and a porous plate enveloping the cavity. This wall ventilation technique is deployed in our test model, which is a Mach 2.2 double-ramp mixed-compression intake. The porosity the ventilated wall is varied (by changing the diameter and pitch of the pores) as 10.6%, 15.7%, 18.8%, and 22.5%. A major focus of this work is dedicated to analyzing the effect of porosity in the control of SBLIs at various intake contraction ratios. The analysis is carried out based on two types of flow measurements. One is by measuring the static pressures for both uncontrolled and controlled intakes, using pressure ports mounted along the length of the intake-core. Another is by capturing the shock and expansion waves prevailing in the intakes using a Schlieren density field.

2. Experimental Methodology

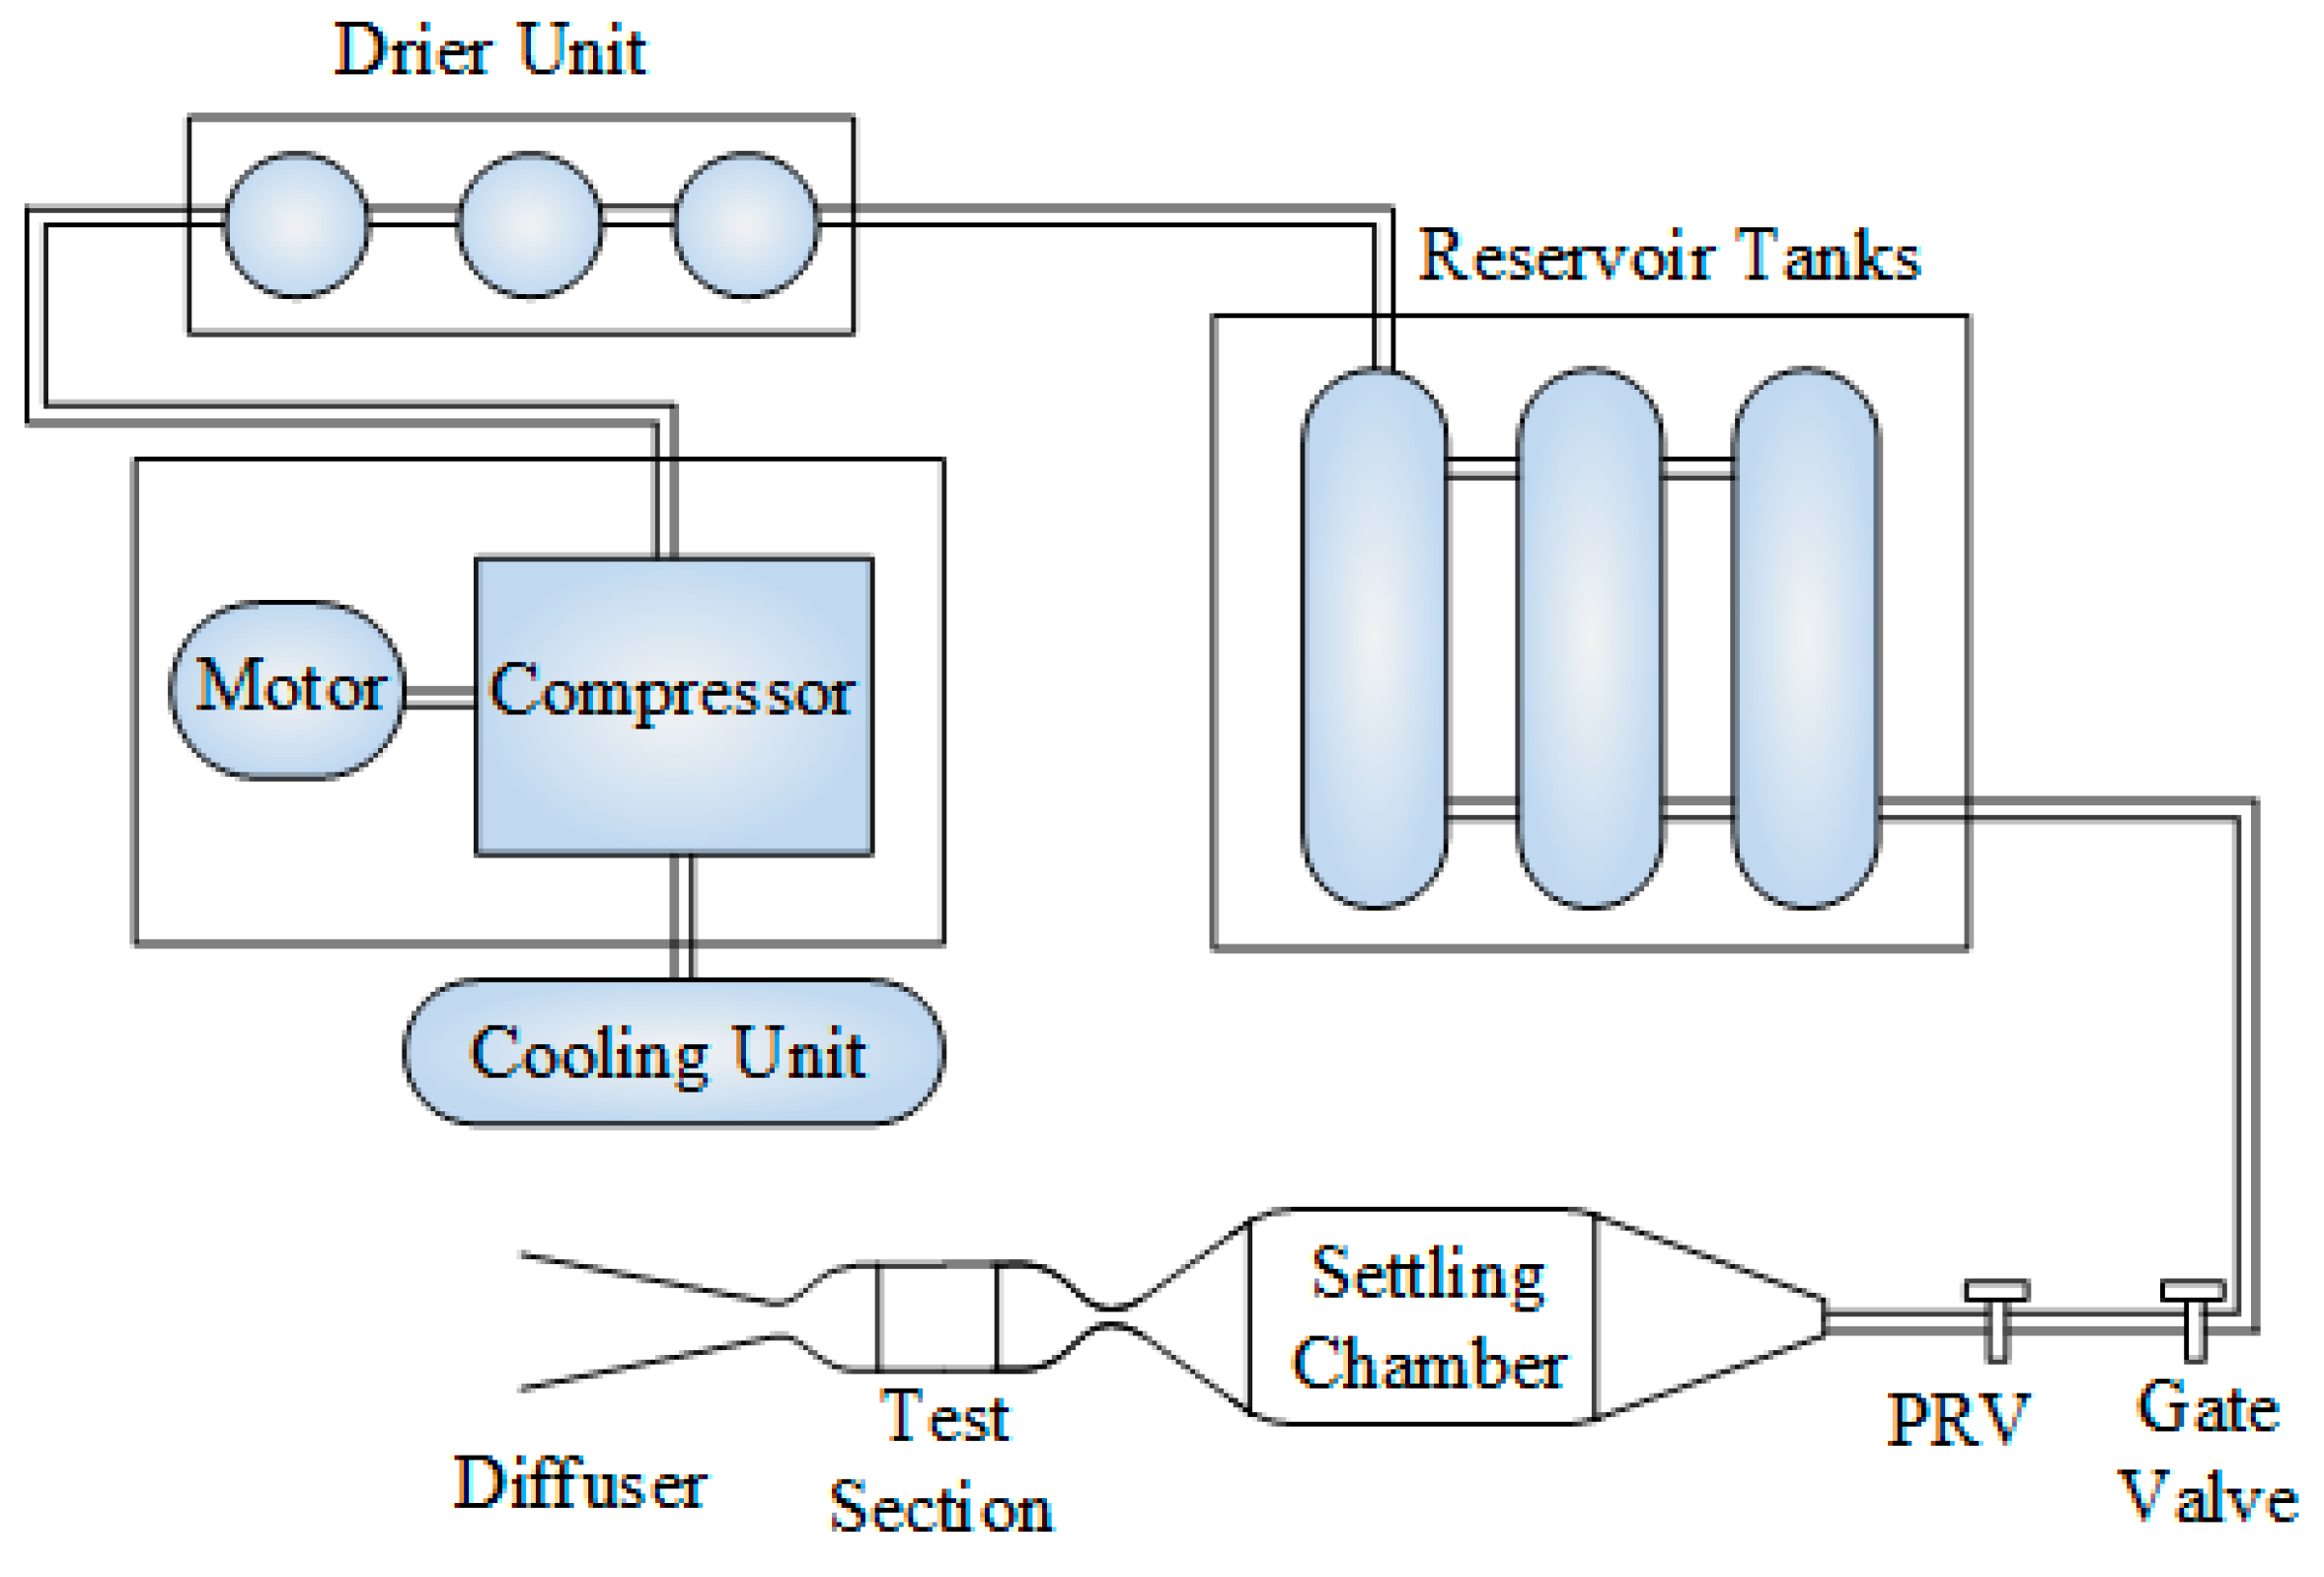
In the present investigation, the experiments were carried out in the supersonic blow-down wind tunnel facility situated at the Indian Institute of Technology Madras, India. The experimental facility is sketched schematically with important notations in Figure 2. In the experimental facility, the pressurized air is used as the operating fluid. The compressed air is filtered, dried, and heated to remove the moisture and impurities before entering the tunnel section.
During each test run, the stagnation pressure ( P 0 ) and the stagnation temperature ( T 0 ) in the settling chamber were held constant around at 340 kPa and 27 °C, respectively. The fluctuation in stagnation temperature throughout the current study was about ±0.5 °C. The measurement of static pressure ( P ts ) at the intake model was conducted at different ports, located along the intake-core wall using piezo-resistive pressure transducers (GE DRUCK PMP-4110, New York City, New York, USA). The accuracy in the pressure measurement was estimated as ±0.1%. LabView was used to collect the output from the pressure sensors. The Schlieren setup was arranged with a monochromatic halogen light source with a wavelength of 580 nm. Three concave mirrors of focal length 1.4 m, 2 m, and 1.4 m were used along with a bi-convex lens of focal length 0.48 m. The parallel rays passing through the test section were focused at the knife-edge location by means of a concave mirror. Here, the amount of light blocked by the knife-edge essentially governs the sensitivity of the Schlieren images. The images were captured using an IDT NX4-S3 high frame rate camera equipped with a 100 mm f/2 lens, and having a sampling rate of 300 fps. The camera is focused to capture the flow development in the mid-plane of the model with a focal plane thickness of around 1 mm. From the measured test-section static pressure ( P ts ) (without the presence of model or the mounting mechanisms and, hence, with an unobstructed flow field in the test section) and the settling chamber stagnation pressure ( P 0 ), the calibrated test section Mach number ( M 0 ) using the isentropic relation (Equation (1)) was found to be 2.2. Further, the Reynolds number of the flow was estimated to be 4.6 × 10⁷ per unit length, which is much higher than the troublesome Reynolds number of 500 [22], thus, in this study, the viscous effects on the pressure measurements were almost insignificant.
P ts P 0 = [ 1 + ( γ 1 ) 2 M 2 ] γ ( γ 1 )
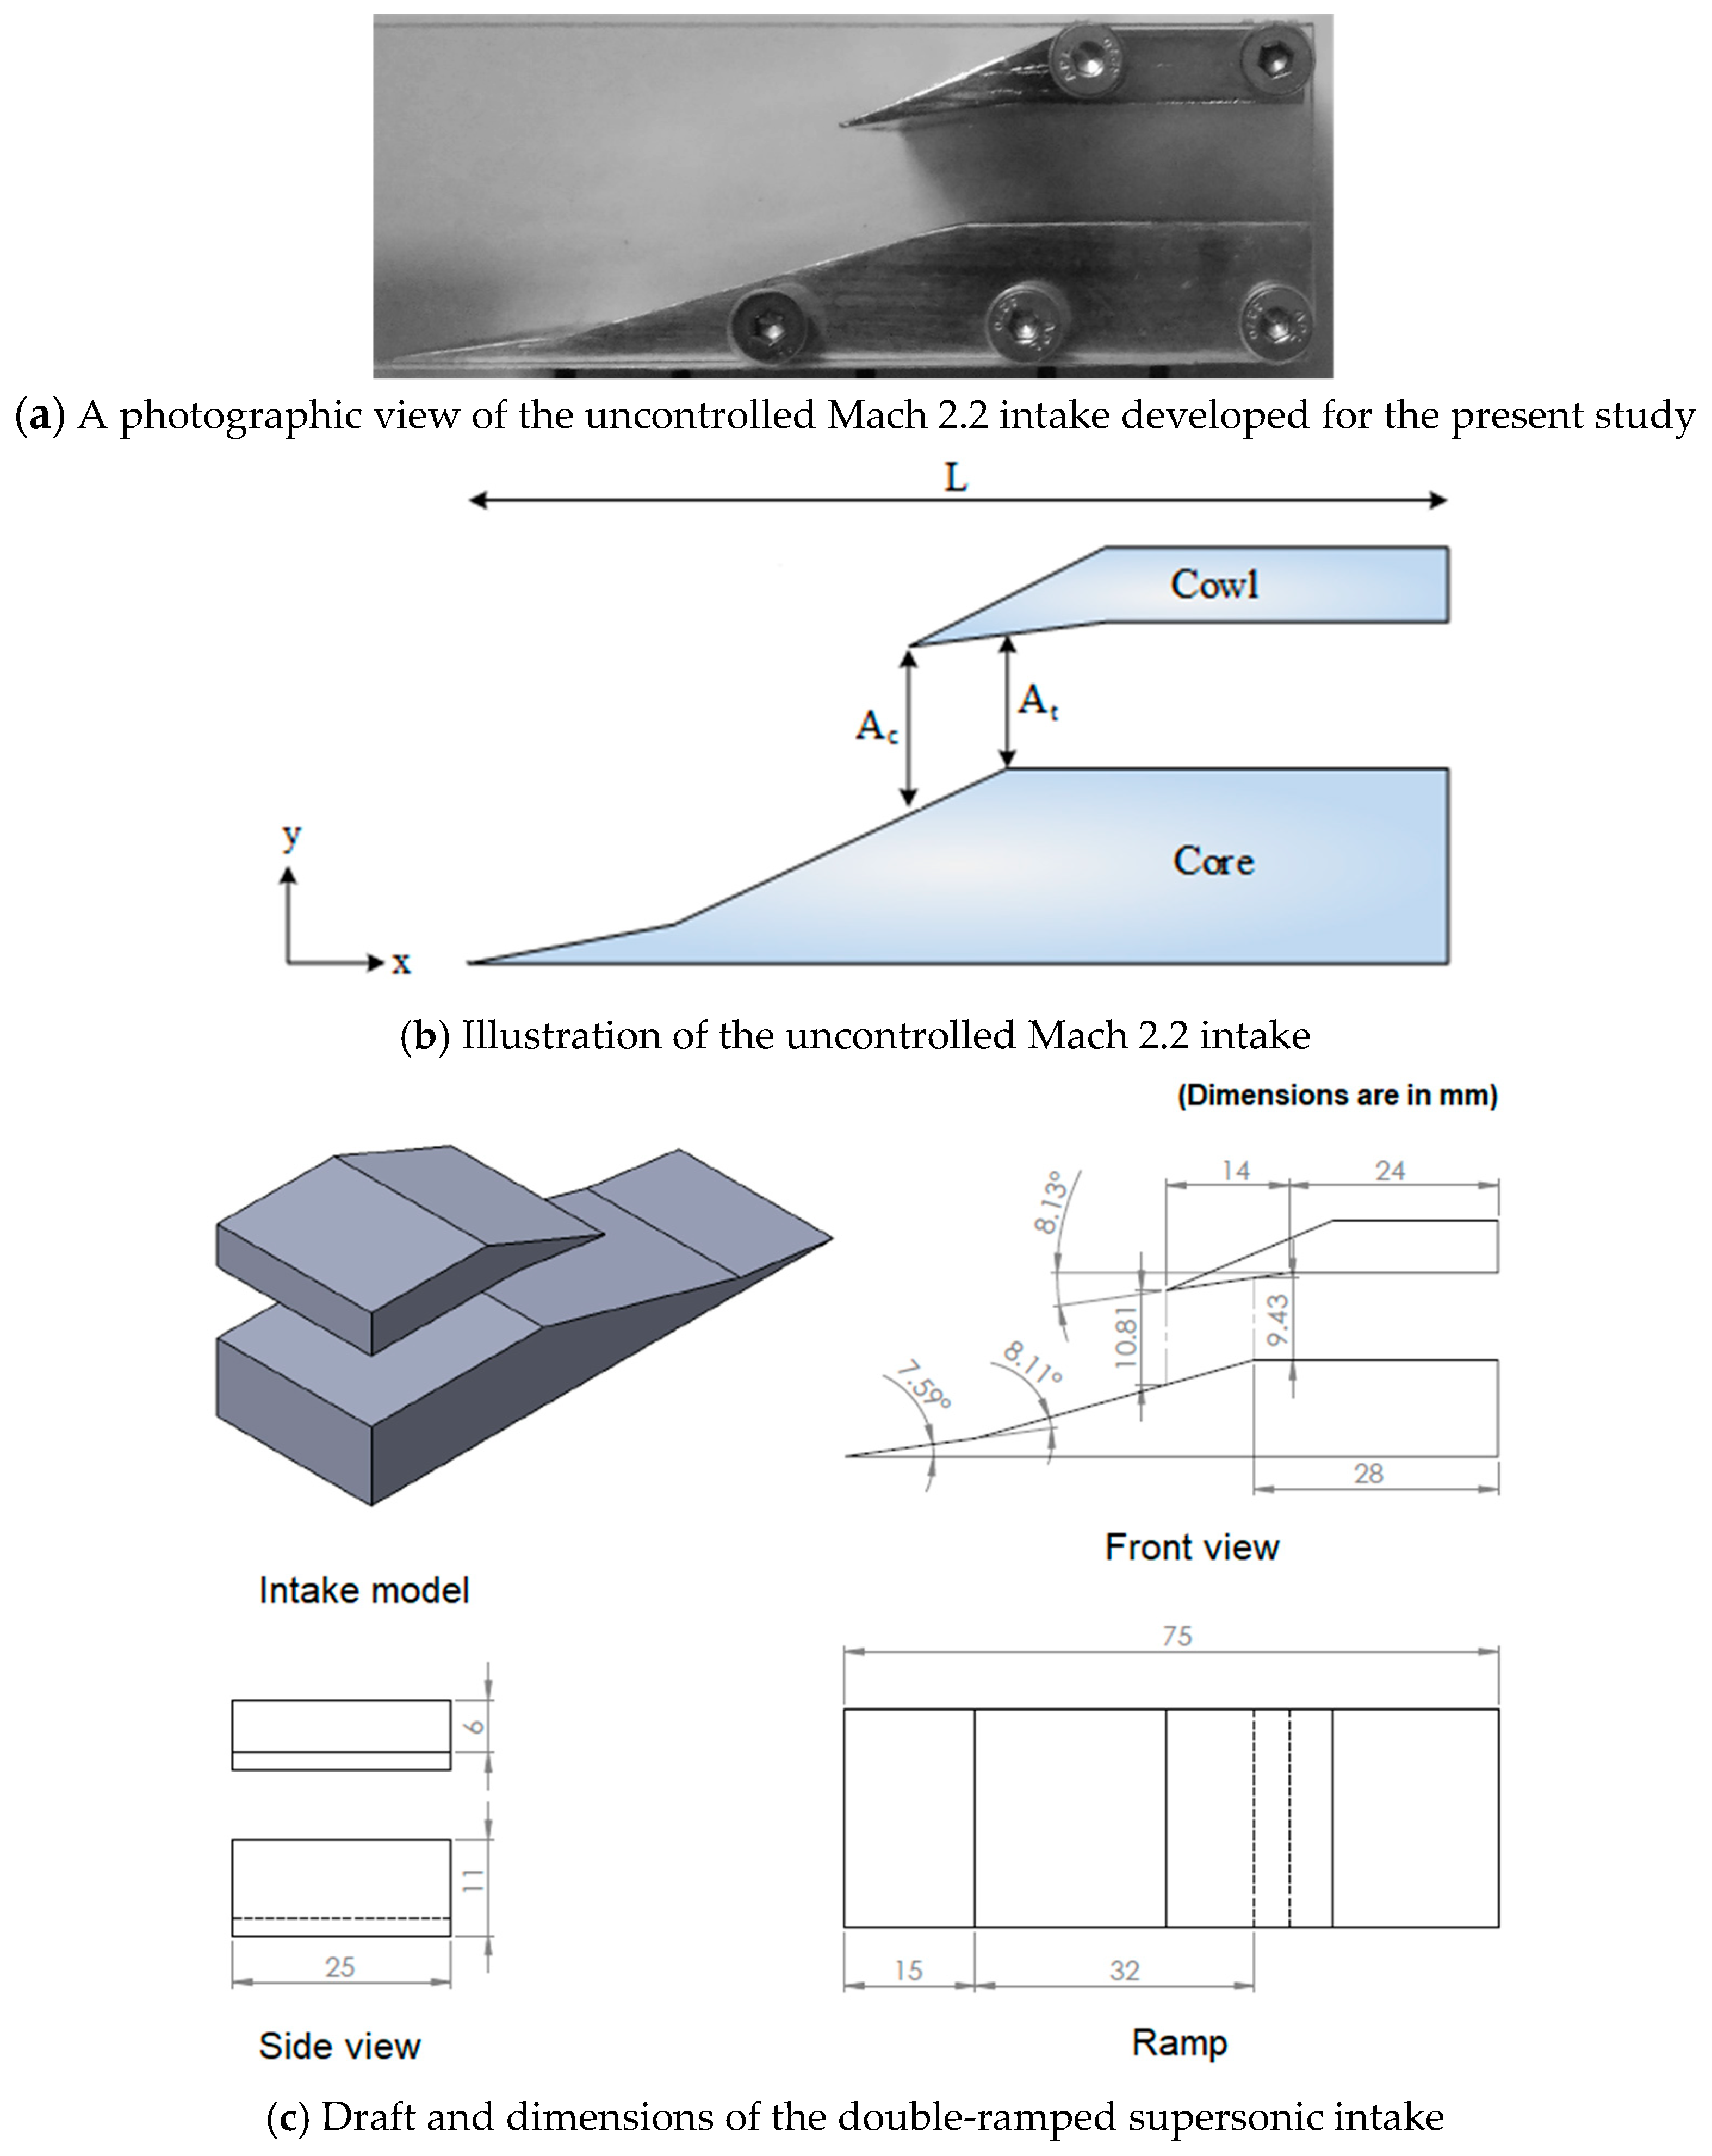
Generic two-dimensional mixed-compression intake models at Mach 2.2 (at five different contraction ratios) with dual-compression ramps and a constant area isolator, has been designed and experimentally investigated. The contraction ratio ( R c ) of the intake, defined as the ratio of the flow capture area (Ac) to the throat area (At), has been varied as 1.16, 1.19, 1.22, and 1.25. The photographic and schematic views of the intake model are shown in Figure 3a,b, respectively. In addition, the typical specifications of the intake model are shown in Figure 3c. The Mach 2.2 intake is designed such that the incoming air is compressed by means of both internal and external shocks with the minimum total pressure loss. According to Oswatitsch (1947), Equation (2) shows the maximum pressure recovery condition in two-dimensions for a system of (n − 1) oblique shocks [23]. Further, Ran and Mavris (2005) [24] have shown that, for a freestream Mach number M 0 = 2.2 and the specific heat ratio of γ = 1.4, the Mach numbers at each downstream location can be found using the oblique shock relations, given by Equations (3) and (4).
M 0 sin β 1 = M 1 sin β 2 = M 2 sin β 3
M i 2 = [ ( γ + 1 ) 2 M i 1 4 sin β i 4 ( M i 1 2 sin 2 β i 1 ) ( γ M i 1 2 sin 2 β i + 1 ) ] [ 2 γ M i 1 2 sin 2 β i ( γ 1 ) ] [ ( γ 1 ) M i 1 2 sin 2 β i + 2 ]
tan θ i = 2 cot θ i ( M i 1 2 sin 2 β i 1 ) [ 2 + M i 1 2 ( γ + 1 2 sin 2 β i ) ]
The contraction ratio ( R c   =   A c A t ) , has a crucial aspect in regulating the flow behavior in the intake-isolator and the limit is set to this ratio ( R Limit ) by the Kantrowitz condition (Equation (5)) [25]. It depicts that the intake unstart phenomenon might be observed if the value of the contraction ratio for an intake is higher than R Limit .
R Limit = ( A c A t ) Limit = [ γ 1 γ + 1 + 2 ( γ + 1 ) M 0 2 ] 1 2 [ 2 γ γ + 1 γ 1 ( γ + 1 ) M 0 2 ] ( 1 γ 1 )
At the freestream condition of M 0 = 2.2 , the limiting contraction ratio from Equation (5) is R Limit = 1.187 (i.e., R Limit 1     0.842 
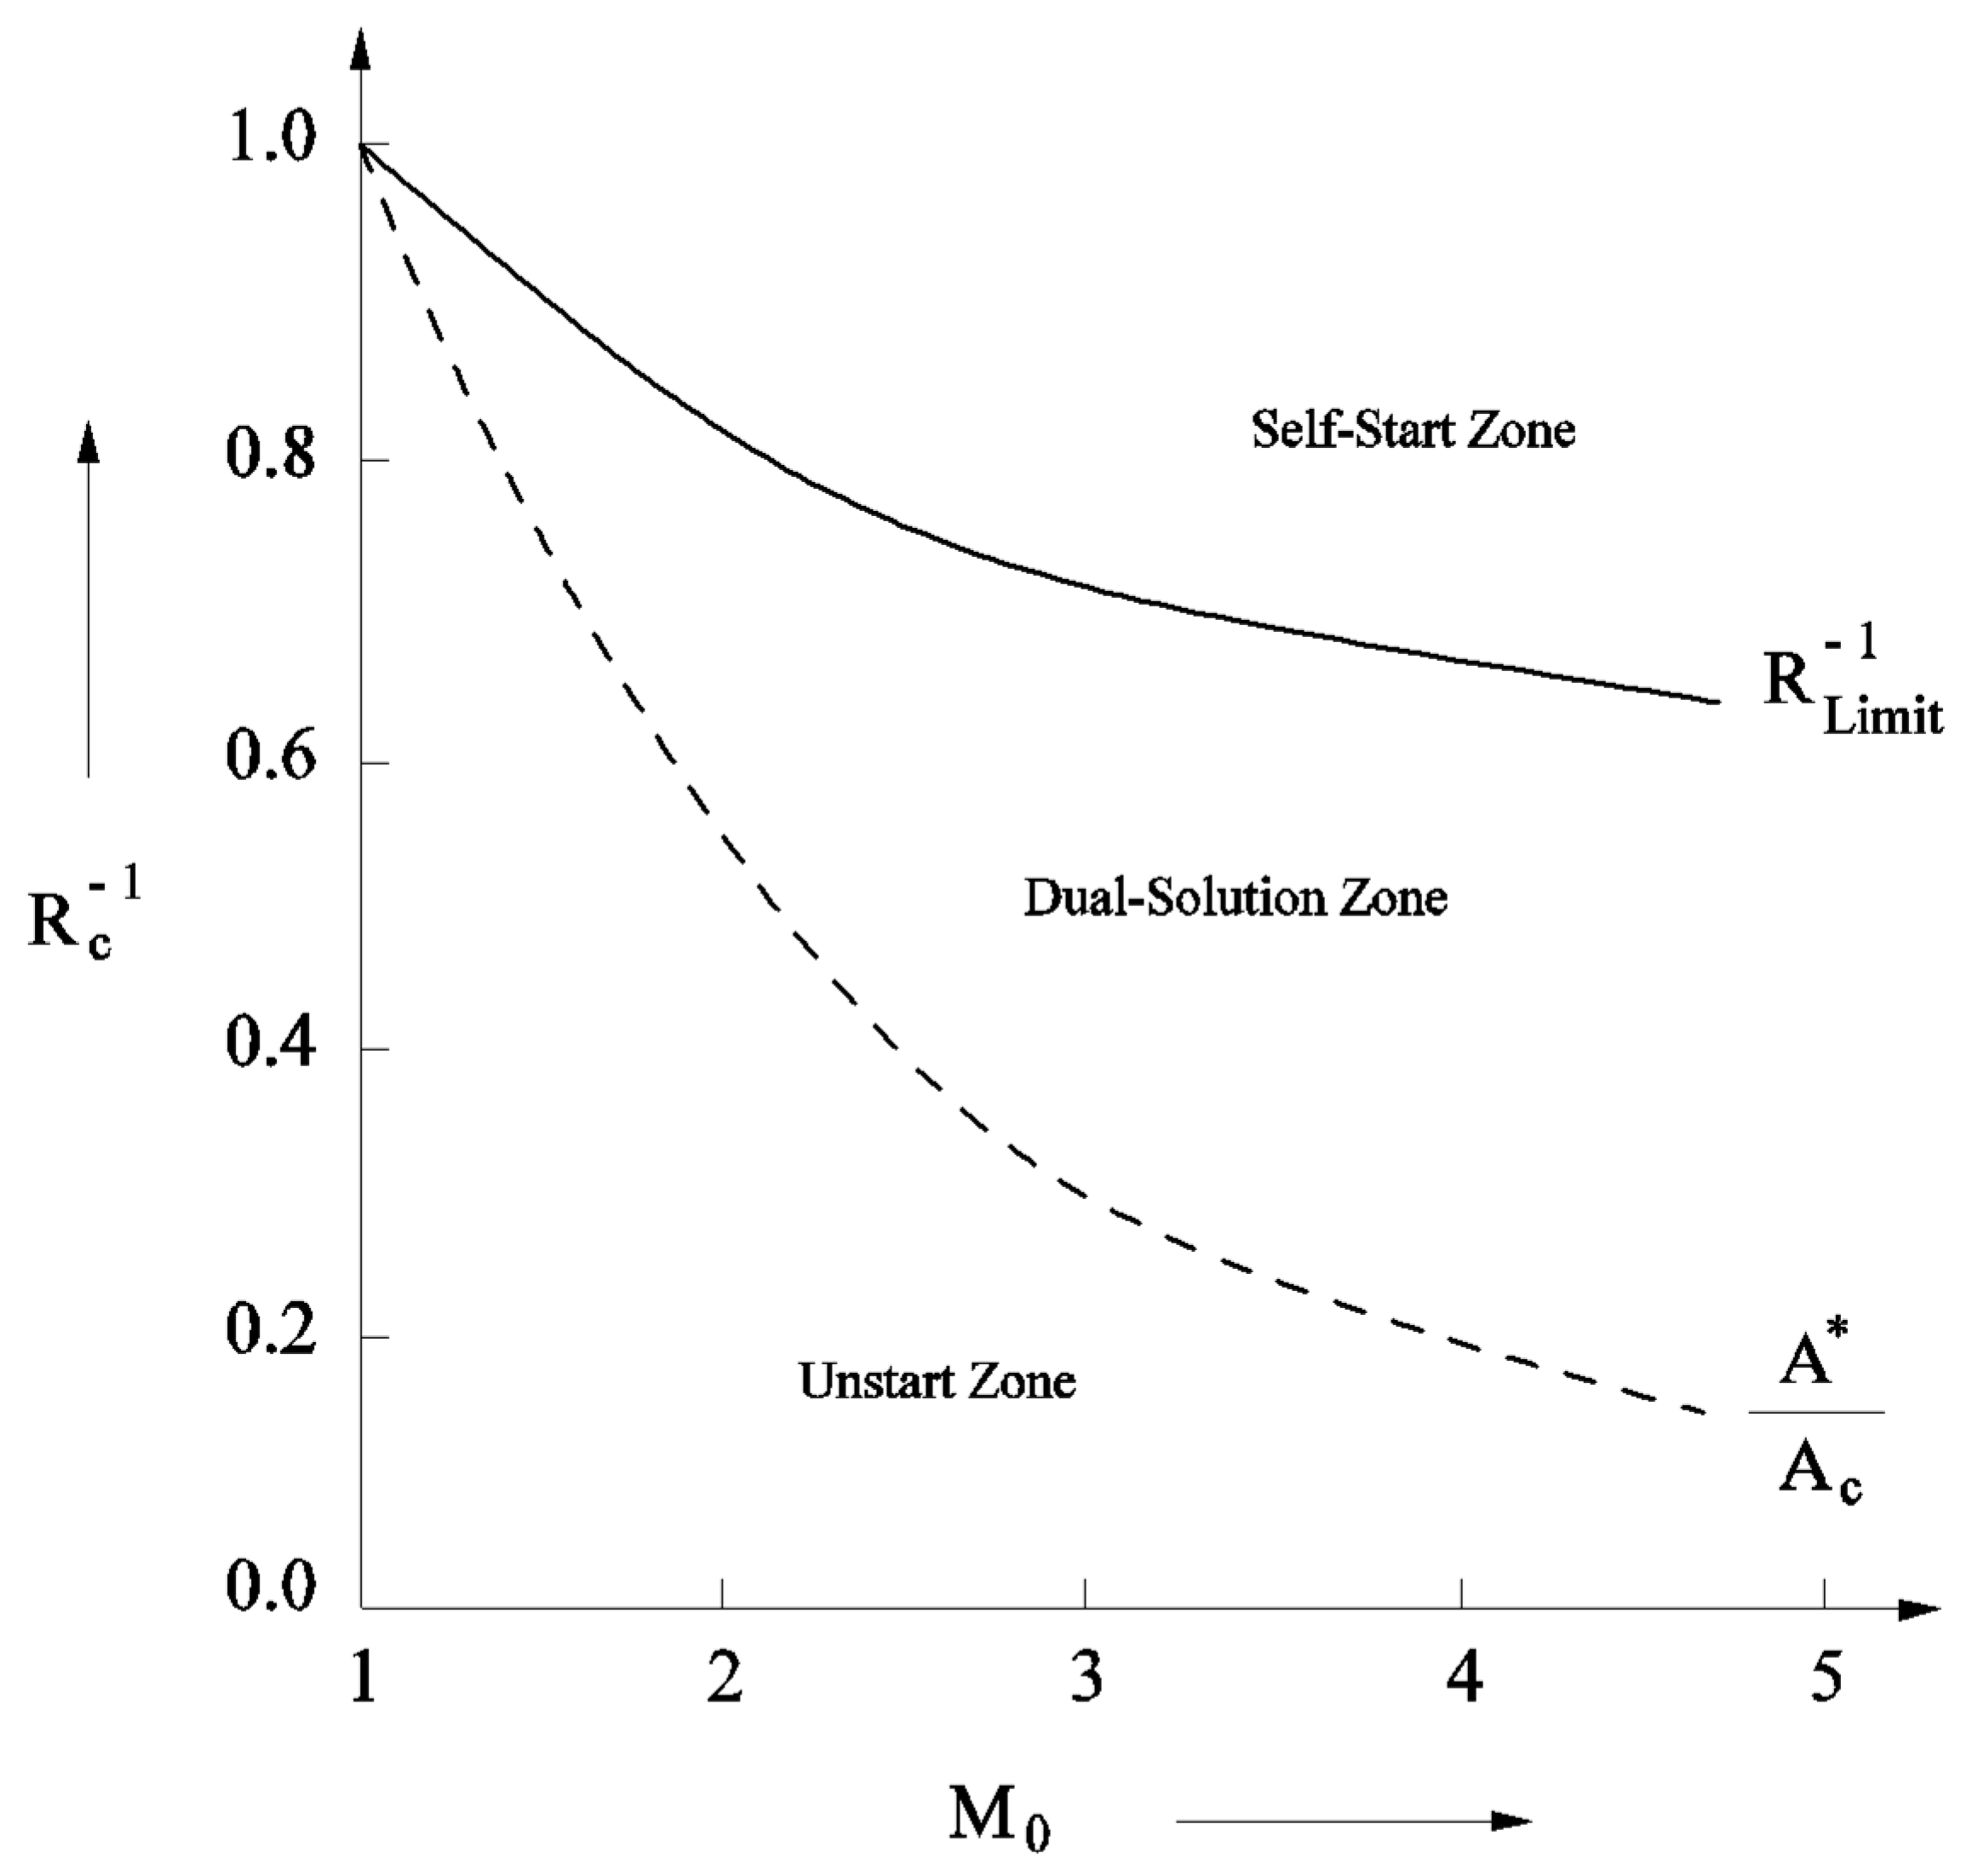
). Further, the variation of R c with respect to M 0 is plotted in Figure 3, which shows the ideal intake-start and unstart zones for a specific M 0 . The RLimit variation is estimated by using the quasi-one-dimensional theory proposed by Kantrowitz, and is depicted as a thick line. Further, the variation of the sonic area ratio ( A * A c ) , which corresponds to the minimum contraction ratio to start the intake, is obtained through isentropic relations (Equation (6)). The area between these two curves represents the dual solution zone where the intake might exhibit either start or unstart characteristics.
A * A c = 1 M 0 [ 2 ( γ + 1 ) ( 1 + γ 1 2 M 0 2 ) ] ( γ + 1 ) 2 ( γ 1 )
Since the objective of the present study is to evaluate the intake models at both intake-start and unstart conditions, the contraction ratios of R c = 1.16, 1.19, 1.22, and 1.25 are chosen from the self-start zone and the dual-solution zone of Figure 4. Here, the flow capture area ( A c ) and the throat area ( A t ) were varied by altering the throat height, between the cowl and intake-core (Figure 3b), which, in turn, changes the contraction ratio of the intake. In Table 1, for the mixed compression intake at Mach 2.2, the intake contraction ratios and their corresponding inverse values are shown. Note that the geometric flow blockage at the test-section, offered by the intake models at these contraction ratios were found to be in the range of 7.51% to 7.99%. The flow blockage was estimated by using Equation (7), which is essentially a ratio of the projected area of intake ( A m ) to the cross-sectional area of the test section ( A ts ).
Geometric   blockage   ( in   % )   = A m A ts × 100
In the literature, it is a well-known fact that the blockage generated by the model should be less than 10% for a smooth operation in supersonic flow. Therefore, in the present study, along with the side plate, the maximum blockage generated by the model (made of polycarbonates sheets) was maintained at approximately 8%. Additionally, the intake models were mounted in the test section with a gap of about 38.5 mm from the top wall, 37.5 mm from the bottom wall and 31.5 mm from both the side walls of the test section.
Figure 3 shows that the intake with contraction ratio, R c = 1.16 falls in the self-start region since its corresponding inverse value R c 1 = 0.862 is higher than the value of R Limit 1 . However, the intake with contraction ratios R c = 1.19, 1.22, and 1.25 fall in the dual-solution zone since the corresponding inverse values associated with them (i.e., R c 1 = 0.84, 0.819 and 0.8) are lower than R Limit 1 but higher than A * A c = 0.57 for M 0 = 2.2.
The preliminary experiments are conducted to identify the regions of the adverse pressure gradient and also the location of the impinging shock generated by the intake-cowl. As a shock control technique, wall ventilation through a shallow cavity is deployed at the region of the adverse pressure gradient (Figure 3a). The cavity under the porous wall (the ventilated region of the intake-core wall) is not a regular rectangular cavity but is designed to have an angular cut at one of the corners. This cut angle is equal to the angle subtended by the second ramp of the intake with respect to the horizontal axis. A parametric study is conducted by varying the porosity of the ventilated wall. The diameter and the pitch of the uniformly distributed pores are varied (as shown in Table 2) such that the corresponding porosity of the surface is varied as well at 10.6%, 15.7%, 18.8%, and 22.5%. These cavities are tested for their effectiveness in controlling the SBLI due to the impinging shock at varied intake contraction ratios as given in Table 1. It can be seen that, in both uncontrolled and wall-ventilated intakes, the geometric blockage is essentially constant, i.e., the cavity with a porous upper surface contributes to no additional blockage to the flow through the intake. Photographic views of the intake-cores deployed with wall ventilation through the shallow cavity are shown in 
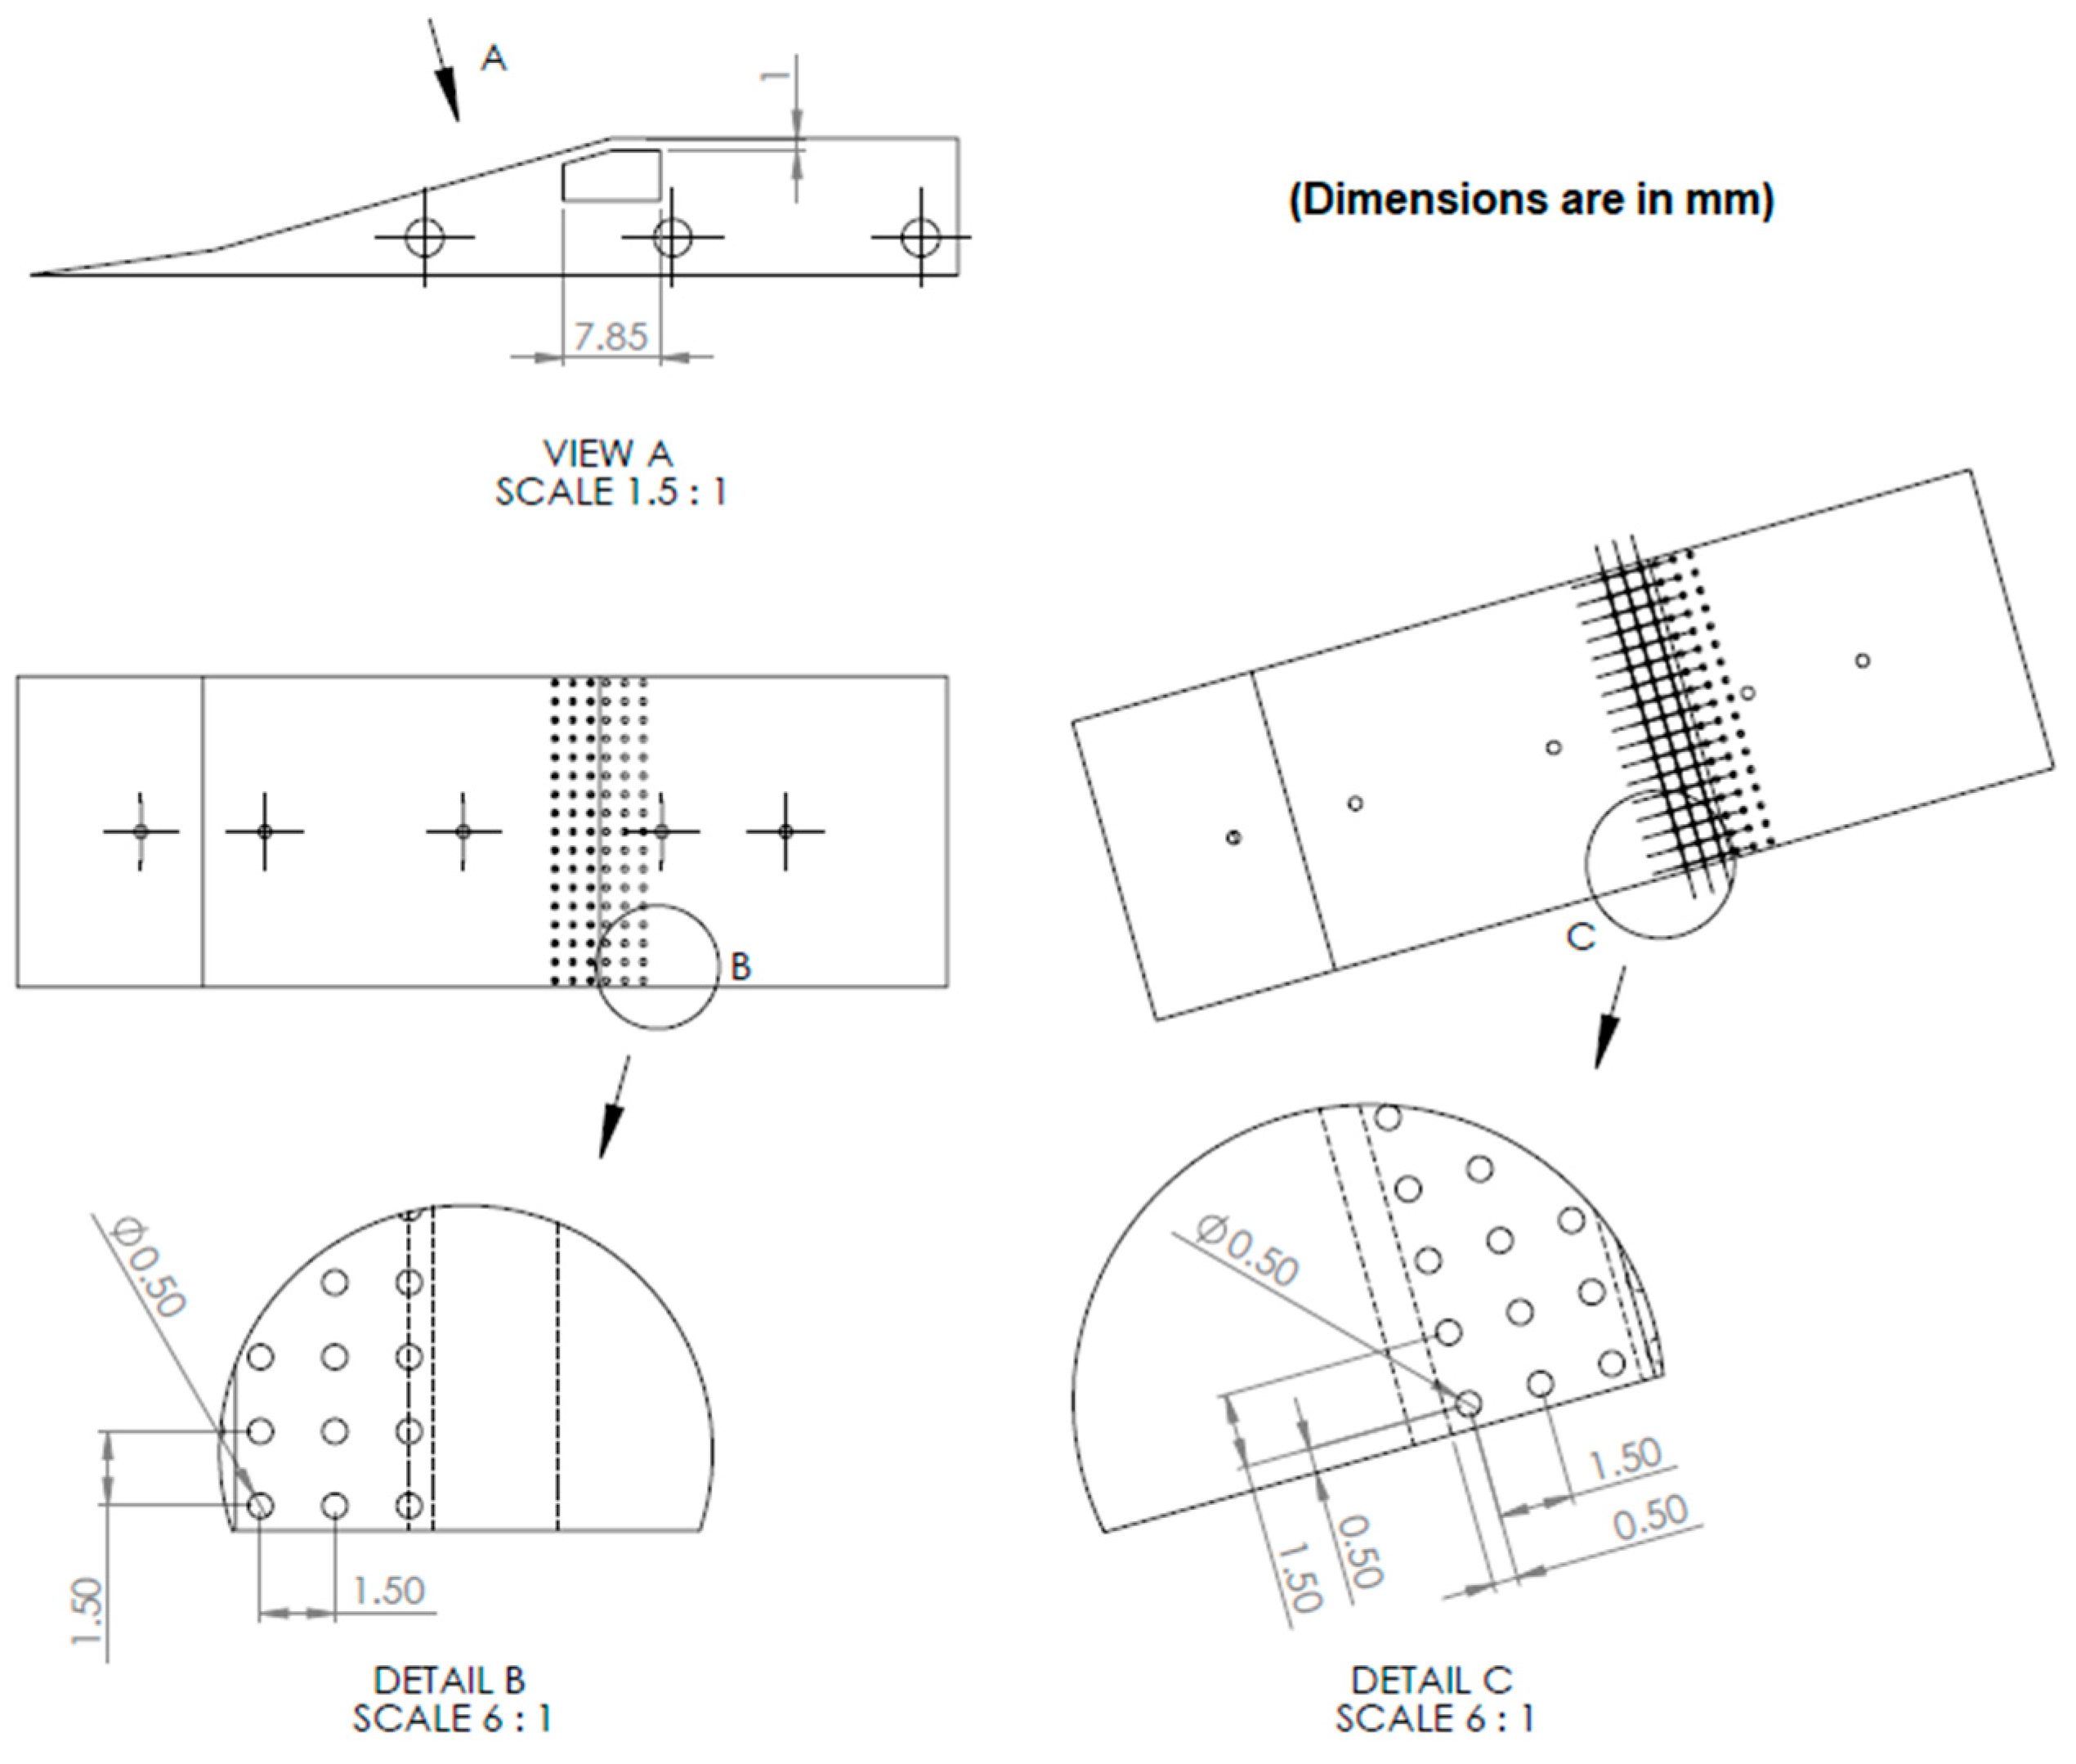
Figure 5 with different porous surfaces. In addition, the specifications of the cavity covered with the 10.6% porous surface placed on the intake-core is sketched in Figure 6.

3. Results and Discussion

3.1. Flow Visualization: Schlieren Density Field

In The investigation of shock-structures and the flow development in both uncontrolled and controlled intakes have been carried out using the Schlieren flow visualization technique. A high-speed camera is used to capture the first derivative of density in the flow field, which is visualized through the Schlieren setup. The wave structure prevailing in the flow field of the mixed-compression intake at the contraction ratio of 1.16 is shown in Figure 7a. The port locations are sketched from the leading edge onwards.
The flow field images for both the uncontrolled and wall ventilated intake with 10.6%, 15.7%, 18.8%, and 22.5% perforated surfaces, operating at the contraction ratio of 1.16 are shown in Figure 7. The oblique shockwaves produced at the leading edge of the first ramp and the concave corner (where the first and second ramps meet) are seen as bright lines emanating from left to right. The waves prevailing in the uncontrolled intake at Rc = 1.16 are given in Figure 7a.
Here, the oblique shock from the cowl-lip impinges upon the shoulder of the second ramp and interacts with the boundary layer developed on the ramp surface. Due to this interaction, the boundary layer (visible as a faint black line) grows in thickness downstream along the core of the intake. A shallow cavity covered with a porous surface, placed in the region of interaction on the intake-core, acts as a shock control technique which attempts to reduce the shock strength and decreases the boundary layer thickness by means of boundary layer suction. Here, note that the wall ventilation does not offer any blockage to the flow through the intake. From Figure 7, it can be seen that the uncontrolled intake starts at the contraction ratio of 1.16. Similarly, with an exception of the 10.6% porosity case, all the wall ventilated intakes exhibit ‘start’ condition at Rc = 1.16. The flow visualization image for the 10.6% porosity case, shown in Figure 7b, reveals that the intake becomes unstart with the formation of a normal shock at the cowl-lip. This may be due to the configuration of the pores, which potentially increases the boundary layer thickness. Further, for the 15.7% and 22.5% porosity cases (Figure 7c,e), the shock-cell structures are contracted to a greater extent, compared to the plain intake. This is because an increase in boundary layer thickness essentially reduces the internal flow area which, in turn, produces stronger shockwaves (since mass is conserved) of the increased wave angles. Nevertheless, in the intake controlled by 18.8% wall ventilation at Rc = 1.16, the size of the separation bubble is suppressed significantly, which is direct evidence of reduced separation losses. Additionally, the boundary layer on the intake-core progressively becomes thin for the 18.8% surface porosity when compared to other porosity cases. This is due to an increased suction effect created by the 18.8% perforated surface, which eventually decreases the boundary layer thickness and stretches the shock-structure in the isolator region.
At the increased contraction ratio of 1.19, the Schlieren pictures for the uncontrolled and wall-ventilated intakes are shown in Figure 8. Notice that the uncontrolled intake in itself is “unstart” with an attached λ-shock at the entry to the isolator, as shown in Figure 8a. The subsonic flow at the downstream region of the shock, produced at the cowl-lip, is accelerated to supersonic Mach numbers due to the intake geometry, eventually leading to the shock-cell structure in the isolator region. However, in the uncontrolled intake, this shock-cell train is terminated with a normal shock. Further, in the case of 10.6% surface porosity, the formation of a detached bow-shock at the cowl-lip can be seen in Figure 8b. Additionally, the formation of a separation bubble is also seen at the location where the bow-shock interacts with the boundary layer. This bubble is indeed responsible for reducing the internal flow area, which may sometimes lead to intake unstart. Furthermore, the 15.7% and 18.8% porosity cases can be seen to produce an attached normal shock (Figure 8c) and a λ-shock (Figure 8d), respectively, at the isolator entrance. Additionally, Figure 8d reveals that the interaction of cowl shock with boundary layer on the core of the intake controlled with 18.8% surface porosity reduces the separation bubble length, and thereby reduces the separation losses. In contrast to the previous test case, when the intake is controlled by the 22.5% porous surface, the separation bubble starts growing again (Figure 8e). This is due to the injection of more fluid upstream through the cavity which thickens the boundary layer ahead of the shock and promotes the SBLI. Consequently, the intake controlled with the 22.5% perforated surface experiences an inferior performance in controlling the interactions, compared to the lower porosity cases.
The flow visualization images of the uncontrolled and the cavity controlled intakes operating at the contraction ratio of 1.22 are shown in Figure 9. The waves prevailing in the uncontrolled intake are shown in Figure 9a. The figure shows that due to the formation of the bow-shock at the detached condition at the entrance of the isolator, the uncontrolled intake does not start. Similarly, the intakes controlled with 10.6% and 15.7% porous surfaces are also ‘unstart’ as evident in Figure 9b,c, respectively. Moreover, they exhibit almost similar wave characteristics as plain intake. Further, in the intake with wall ventilation of 18.8%, the formation of λ-shock can be seen at the isolator entry; the separation bubble in intake-isolator becomes small and, thus, reduces the separation losses. Consequently, the intake controlled with 18.8% surface porosity shows superior performance in controlling the interactions.
At the highest tested contraction ratio of the present study corresponding to 1.25, the flow visualization images of all the intake configurations are given in Figure 10. Likewise, in the previous case, Figure 10a also shows that the uncontrolled intake does not start at this contraction ratio. The subsonic flow downstream of the bow-shock accelerates to supersonic levels in the isolator (to satisfy the law of mass conservation), resulting in the formation of shock-cell structures which are terminated by a normal shockwave (Figure 10a). Further, the intake controlled by 10.6% porous surfaces, as seen in Figure 10b, exhibits the flow characteristics the same as the uncontrolled intake. However, a large number of shock-cells are generated in the isolator section which contributes to excessive losses. Further, in the intakes controlled with 15.7% and 18.8% porous surfaces, the formations of the shock-train structures in the isolator region are clearly observed. For the 18.8% porosity case, due to the generation of λ-shock at the entrance of the isolator, the size of the separation bubble is significantly decreased. Moreover, the strength of the entry shock is also reduced from the originally detached bow-shock (as in uncontrolled intake) to the attached λ-shock (Figure 10d). These observations once again establish the superiority of the 18.8% porous surface in controlling the interactions, compared to the lower porosity cases. However, when the surface porosity is further increased to 22.5%, as seen in Figure 10e, the intake becomes ‘unstart’ and experiences a thickened boundary layer in the isolator region. Although the generation of a λ-shock at the entrance of the isolator can be seen for the 22.5% porosity case as well, its performance in controlling the interaction is inferior to the lower porosity cases. This is because of the formation of a large number of compression waves at a relatively higher number of pores in the 22.5% porous surface, which essentially compromises the advantages of the increased surface porosity.
From the above discussion on the waves prevailing in the intake configurations, it is evident that there is a specific trend with respect to surface porosity in controlling the SBLIs. At all the tested contraction ratios, the wall ventilation with 18.8% porosity is found to be the most efficient in controlling the SBLIs.

3.2. Wall Static Pressure Variation

In the SBLI literature, it is a usual practice to use the measured wall static pressure distribution in its non-dimensional form to evaluate the efficacy of the shock controls. The non-dimensional form of the measured static pressures is P/P0, and the non-dimensional form of the axial location is X/L. Here, P0 is the total pressure maintained at the settling chamber and L is the total length of the intake model. Figure 11 shows the location of static pressure ports at the centerline of the intake-core. The first two ports at the locations of X = 0.13 L and 0.27 L measures the static pressure behind the ramp-generated oblique shockwaves. The third and fourth ports at X = 0.48 L and 0.7 L, are constructed in locations convenient for measuring the proximal effects of the shock control technique. Finally, to study the effects of the shock control at the far-downstream location, the fifth pressure port was placed at 0.83 L. The maximum uncertainty in the measurement of static pressure is calculated to be ±1.46%.
With the measured static pressure data, comparison plots are generated for different intake compression ratio (as shown in Figure 12, Figure 13, Figure 14 and Figure 15). The pressure characteristics of the wall-ventilated intake at different porosities are compared with the uncontrolled intake. Note that the rise in static pressure at the first port located at X = 0.13 L is constant for all the intakes. This implies that the introduction of porosity on the surface covering the cavity has no significant effect on the wall static pressure variation at far-upstream locations.
At the self-starting condition (Rc =1.16) (Figure 12), at X = 0.27 L, a marginal increase in the pressure is observed in the intake installed with 10.6% porous surface. However, the intakes with 15.7% and 18.8% porous surfaces show a marginal drop in pressure. Further, the 22.5% ventilated surface demonstrates a better control efficiency by significantly decreasing the wall static pressure. At the upstream proximity of the control surface (X = 0.48 L), the decrease in pressure is directly proportional to the increase in porosity of the control surface, with the 18.8% porous surface exhibiting a maximum pressure drop. This decrease in pressure can be correlated to the strong upstream effect of the cavity. A similar trend between the third and fourth pressure ports is observed, where the 15.7% and 18.8% porosity cases cause a significant decrease in the wall static pressure,; with 15.7% porous surface showing the higher pressure drop. These favorable outcomes at the proximal locations can be credited to the higher boundary layer suction created by the corresponding porous surfaces. At the farthest downstream port location (X = 0.83 L), the wall static pressures for 10.6% and 18.8% porous surfaces are significantly increased, whereas, for 15.7% and 22.5% porosity cases, the pressure values are marginally decreased. This curious behavior exhibited by the different porosity cases may also be due to the pore configuration, in addition to the percentage of porosity, which requires further study.
At the increased contraction ratio of 1.19, it can be seen from Figure 13 that the overall trend in the pressure variation for each porosity case is similar, with an exception of the 10.6% porous surface, where the intake now becomes unstart. Further, the static pressure at the near-upstream location of 0.48 L reduces for all the tested porosity cases, with the 18.8% porous surface exhibiting a maximum decrease. Though the 18.8% porous surface exhibits a favorable upstream influence, it causes a rise in static pressures at both the downstream locations of 0.7 L and 0.83 L, compared to other porosity cases. The same trend follows in all other tested porosity cases, except at 15.7% surface porosity, where a subtle decrease in static pressure is recorded at the downstream location of 0.7 L.
The wall static pressure variations for both uncontrolled and controlled intakes operating at Rc = 1.22 are shown in Figure 14. At the second port (X = 0.27 L), the large pressure amplitudes are observed for all the tested porosity cases, except for the 22.5% surface porosity, where a noticeable decrease in pressure is witnessed. Here, the uncontrolled and wall-ventilated intakes (with an exception of 22.5% porosity) become unstart with the formation of either an attached normal shock or a detached bow-shock at the isolator-entry. In fact, the 22.5% perforated surface produces enough suction, which subsequently leads to a reduced boundary layer height. This, in turn, controls the interactions efficiently and starts the intake. However, for this porosity case, the static pressure measured at the downstream location of 0.7 L is found to be more than that of the plain intake due to secondary shock formation at the pores of relatively large size (due to higher surface porosity). Further, in case of the 15.7% and 18.8% wall ventilation, the static pressures at the upstream proximity (X = 0.48 L) and at the downstream proximity (X = 0.7 L) decrease significantly; with 18.8% surface porosity having the maximum pressure drop at the location of 0.48 L. Furthermore, the 10.6% wall ventilation shows its inferior performance at both the downstream locations (X = 0.7 L and 0.83 L) at Rc = 1.22.
At the highest contraction ratio of the present study corresponding to 1.25, the static pressure variations for the uncontrolled and controlled configurations are shown in Figure 15. Note that the performance of all the intake configurations are almost similar to the previous contraction ratio of 1.22. At the first and second pressure ports, respectively, located at 0.13 L and 0.27 L, the rise in static pressures for the controlled intakes are the same as the plain intake. However, at the third pressure port (X = 0.48 L), all the tested intake configurations (except the 22.5% porosity case) show a significant decrease in pressure, with the 18.8% porosity case causing a maximum decrease. Further, at the fourth and fifth pressure ports, the rise in static pressures for all the intake configurations are almost the same, with an exception of the 10.6% porosity case where a significant increase in pressure, particularly at 0.83 L, is observed.
From the above discussion, it is clear that the efficiency of the cavity in reducing the wall static pressure strongly depends on the porosity of the surface (covering the cavity) and the contraction ratio of the intake. Thus, an optimized combination of the porosity level and the contraction ratio form a suitable environment at specific locations in the flow field, which efficiently controls the SBLI. For example, wall ventilation of 18.8% porosity is seen to be the most effective in reducing the wall static pressure at X = 0.48 L (downstream proximity of the shock control) for all the intake contraction ratios. However, the same case is not true at other locations.

3.3. Effects of Wall Ventilation at the Proximal Regions

The percentage variations in wall static pressure (Pwall) at the upstream proximity (X = 0.48 L) and at the downstream proximity (X = 0.7 L) at all the contraction ratios, for both uncontrolled and wall-ventilated intakes, are calculated by using Equation (8). The results, at the proximal locations of the porous surface, are tabulated in Table 3 and Table 4, respectively.
%   variation   in   P wall =   [ ( P wall )   Controlled   intake ( P wall )   Uncontrolled   intake ] ( P wall )   Uncontrolled   intake × 100
Figure 16 shows the bar chart which compares the variations in the wall static pressure percentages at the upstream proximity (X = 0.48 L) for the intake with the wall ventilation at various tested porosities. On a general note, it can be seen that perforated surfaces have a favorable upstream influence in reducing the wall static pressure at the different intake contraction ratios investigated. Interestingly, the percentage reduction in static pressures is found to be almost proportional to the percentage rise in the surface porosity, except for the 22.5% porosity case where an insignificant decrease in pressures is observed at all the tested contraction ratios. The inferior performance of the 22.5% perforated surface is due to the generation of a relatively large number of compression waves at the pores, compared to the lower porosity cases. Although the individual strength of these waves is low, their combined strength becomes sufficiently high that it compromises the advantages of the increased surface porosity. Further, it can be seen that the intake with a wall ventilation of 18.8% has shown a profound upstream influence with the reduction of wall static pressure to a maximum of about 24% at Rc = 1.19.
Furthermore, at the near downstream location of 0.7 L, the percentage variation in wall static pressures for the controlled intakes with the cavity at different contraction ratios are shown in Figure 17 and tabulated in Table 4. Note that, unlike Figure 16, where all the bars are showing only the reduction in static pressures, Figure 17 depicts not only a pressure drop (for the 15.7% porosity case) but also the rise in static pressures (demonstrated by the 10.6%, 18.8%, and 22.5% perforated surfaces). The favorable performance of the 15.7% surface porosity at all the contraction ratios offer testimony to the higher boundary layer suction effect, with a maximum of about 15.8% reduction in static pressure at Rc = 1.22. Contrarily, a maximum of about a 57% rise in pressure with the 10.6% surface porosity (at Rc = 1.22), about a 56% rise in pressure with 18.8% surface porosity (at Rc = 1.19), and about a 36% rise in pressure with 22.5% surface porosity (at Rc = 1.25), have been obtained. Clearly, these porosity cases are not able to provide enough suction. In turn, the boundary layer is relatively thicker at the near-downstream location. As a consequence, the shockwaves are strong enough in causing the rise in static pressures.

4. Conclusions

In the present study, the efficacy of wall ventilation (a shallow cavity having a truncated rectangular cross-section deployed on the core of the intake) in controlling the SBLIs in a Mach 2.2 mixed-compression intake, has been examined experimentally. A parametric study was carried out by varying the surface porosity at 10.6%, 15.7%, 18.8% and 22.5% at four different intake contraction ratios, Rc = 1.16, 1.19, 1.22, and 1.25, comprising both intake-start and unstart conditions. The wall ventilation as a shock control technique exhibits extensive influence in reducing the wall static pressure, particularly in the upstream proximal regions. This influence is well pronounced at all the tested porosity cases and at all the tested intake contraction ratios. The intake controlled by the 18.8% porous surface shows a highly favorable performance at both on and off design conditions. In this case, at the intake contraction ratio of 1.19, as high as a 24.2% reduction in static pressure at the upstream proximity (X = 0.48 L) is obtained. This is due to the larger boundary layer suction effect created by the 18.8% surface porosity, which effectively reduces the boundary layer thickness and stretches the shock-cell structures in the intake isolator. In addition to decreasing the static pressure, the wall ventilation as a shock control is observed to be efficient in weakening the waves and decreasing the separation length.

5. Manuscript Significance

To the best of our understanding, this is a novel study where a unique shock control configuration, mounted in the supersonic intake, has been designed and experimentally investigated. Although the conventional cavity with wall ventilation mounted over a flat plate or over a transonic airfoil has been studied by several researchers, not much emphasis is established on how the same wall ventilation technique is going to influence the start-unstart characteristics of the intake. In addition, instead of wall ventilation through a flat surface placed over a rectangular cavity, a new control configuration where the cavity has a cross-section of a truncated rectangle (with an angular cut at a corner), which in turn is covered by a porous surface, has been tested for the first time in this study. Compared to previous studies, in the present work, the intake is neither assumed as a flat plate nor as a single-ramp compression corner. However, all the investigations on the effectiveness of the control surfaces are carried out in an actual intake model with a core and cowl configuration, where the intake core was taken as a dual-ramp to minimize the overall losses. This adds another point to the novelty of the present work.

Author Contributions

All the authors have contributed their efforts to complete the paper. H.G. conducted experimental work and analyzed the results. T.T. wrote the first draft. T.J. co-wrote the first draft. M.K. supervised the work and reviewed and edited the manuscript. All authors have read and agreed to the published version of the manuscript.

Funding

This research received no external funding.

Acknowledgments

The authors acknowledge the Indian Institute of Technology Madras for providing the supersonic wind tunnel facility to do the tests. The authors profoundly recognize the financial support given by the Science and Engineering Research Board (SERB), which indeed helped in completing the investigation [EMR/2016/000506].

Conflicts of Interest

The authors declare no conflict of interest.

Notations

A c Capture area of the intake
A t Throat area of the intake
A * Sonic contraction ratio
L Length of the intake
M 0 Freestream Mach number
P Static pressure at the wall
P 0 Total pressure of the settling chamber
P ts Static pressure in the test-section
R c Contraction ratio of intake
R Limit Limiting value of intake contraction ratio
T 0 Settling chamber stagnation temperature
X Distance from the intake leading edge along the x-axis
β Shockwave angle
γ Specific heat ratio
δ Boundary layer thickness
θ Flow deflection angle

References

  1. Delery, J.M. Shock-wave/turbulent boundary-layer interaction and its control. Prog. Aerosp. Sci. 1985, 22, 209–280. [Google Scholar] [CrossRef]
  2. Seddon, J.; Goldsmith, E.L. Intake Aerodynamics; AIAA Education Series: New York, NY, USA, 1985. [Google Scholar]
  3. Delery, J.M.; Marvin, J.G.; Reshotko, E. Shock-Wave Boundary Layer Interactions; AGARD-AG-280; Advisory Group for Aerospace Research and Development: Rue Ancelle, France, 1986. [Google Scholar]
  4. Hamed, A.; Shang, J.S. Survey of Validation Database for Shockwave Boundary-Layer Interactions in Supersonic Inlets. J. Propuls. Power 1991, 7, 617–625. [Google Scholar] [CrossRef]
  5. Donaldson, C.D.; Lange, R.H. Study of the Pressure Rise across Shock Waves Required to Separate Laminar and Turbulent Boundary Layers; NACA-TN-2770; National Advisory Committee for Aeronautics: Washington, DC, USA, 1952. [Google Scholar]
  6. Dolling, D.S.; Murphy, M.T. Unsteadiness of the separation shock wave structure in a supersonic compression ramp flow field. AIAA J. 1983, 21, 1628–1634. [Google Scholar] [CrossRef]
  7. Dolling, D.S. Fifty years of shock-wave/boundary-layer interaction research: What next? AIAA J. 2001, 39, 1517–1531. [Google Scholar] [CrossRef]
  8. Stanewsky, E.; Delery, J.M.; Fulker, J.; de Matteis, P. Drag Reduction by Shock and Boundary Layer Control. Results of the Project EUROSHOCK II Supported by the European Union (1996–1999); Springer: Berlin/Heidelberg, Germany, 2010. [Google Scholar]
  9. Kral, L.D. Active Flow Control Technology. In ASME Fluids Engineering Division Technical Brief; American Society of Mechanical Engineers: New York City, NY, USA, 2000; pp. 1–28. [Google Scholar]
  10. Kral, L.D.; Guo, D. Characterization of Jet Actuators for Active Flow Control. In Proceedings of the 30th AIAA Fluid Dynamics Conference and Exhibit, Norfolk, VA, USA, 28 June–1 July 1999. [Google Scholar]
  11. Souverein, L.J.; Debiève, J.F. Effect of Air Jet Vortex Generators on a Shock Wave Boundary Layer Interaction. Exp. Fluids 2010, 49, 1053–1064. [Google Scholar] [CrossRef] [Green Version]
  12. Sriram, R.; Jagadeesh, G. Shock Tunnel Experiments on Control of Shock Induced Large Separation Bubble Using Boundary Layer Bleed. Aerosp. Sci. Technol. 2014, 36, 87–93. [Google Scholar] [CrossRef]
  13. Raghunathan, S. Passive Control of Shock-Boundary Interaction. Prog. Aerosp. Sci. 1988, 25, 271–296. [Google Scholar] [CrossRef]
  14. Grasso, F.; Marini, M. Analysis of Hypersonic Shock-Wave Laminar Boundary-Layer Interaction Phenomena. Comput. Fluids 1996, 25, 561–581. [Google Scholar] [CrossRef]
  15. Doerffer, P.P.; Bohning, R. Shock Wave and Boundary Layer Interaction Control by Wall Ventilation. Aerosp. Sci. Technol. 2003, 7, 171–179. [Google Scholar] [CrossRef]
  16. Roy, S.; Subramanian, K.; Ghosh, S. Passive Control of Normal-Shock-Wave/Boundary-Layer Interaction using Porous Medium: Computational Study. In Proceedings of the 35th AIAA Applied Aerodynamics Conference, Denver, CO, USA, 5–9 June 2017. [Google Scholar]
  17. Doerffer, P.P.; Szulc, O. Shock Wave Strength Reduction by Passive Control using Perforated Plates. J. Therm. Sci. 2007, 16, 97–104. [Google Scholar] [CrossRef]
  18. Srinivasan, K.R.; Loth, E.; Dutton, J.C. Aerodynamics of Recirculating Flow Control Devices for Normal Shock/Boundary-Layer Interactions. AIAA J. 2006, 44, 751–763. [Google Scholar] [CrossRef]
  19. Szulc, O.; Doerffer, P.; Tejero, F. Passive control of rotorcraft high-speed impulsive noise. J. Phys. Conf. Ser. 2016, 760, 1–9. [Google Scholar] [CrossRef]
  20. Szulc, O.; Doerffer, P.; Flaszynski, P.; Suresh, T. Modelling of Shock Wave–Boundary Layer Interaction Control by Wall Ventilation. In Proceedings of the 10th International Conference on Computational Fluid Dynamics (ICCFD10), Barcelona, Spain, 9–13 July 2018. [Google Scholar]
  21. McCormick, D. Shock/Boundary-Layer Interaction Control with Vortex Generators and Passive Cavity. AIAA J. 1993, 31, 91–96. [Google Scholar] [CrossRef]
  22. Kaushik, M. Innovative Passive Control Techniques for Supersonic Jet Mixing; Lambert Academic Publishing: Saarbrucken, Germany, 2012. [Google Scholar]
  23. Oswatitsch, K. Pressure Recovery in Missile in Reaction Propulsion at High Supersonic Speeds; NACA TM 1140; National Advisory Committee for Aeronautics: Washington, DC, USA, 1947; (Translation). [Google Scholar]
  24. Ran, H.; Mavris, D. Preliminary Design of a 2D Supersonic Inlet to maximize Total Pressure Recovery. In Proceedings of the 5th AIAA Aviation, Technology, Integration, and Operations Conference, Arlington, VA, USA, 26–28 September 2005. [Google Scholar]
  25. Kantrowitz, A.; Donaldson, C.; Du, P. Preliminary Investigation of Supersonic Diffusers; Technical Report L5D20; National Advisory Committee for Aeronautics: Washington, DC, USA, 1945. [Google Scholar]
Figure 1. Schematic diagram of the wall ventilation placed at the interaction zone.
Processes 08 00208 g001
Figure 2. The supersonic wind tunnel facility (schematic diagram with notations).
Processes 08 00208 g002
Figure 3. Mixed-compression intake at Mach 2.2 with specifications.
Processes 08 00208 g003
Figure 4. The dependency of intake contraction ratio over the freestream Mach number.
Processes 08 00208 g004
Figure 5. Photographic views of the intake-cores controlled by wall ventilation.
Processes 08 00208 g005
Figure 6. Draft and dimensions of the 10.6% wall ventilation zone placed over the intake-core.
Processes 08 00208 g006
Figure 7. Schlieren view of uncontrolled and wall ventilated intakes at Rc = 1.16.
Processes 08 00208 g007aProcesses 08 00208 g007b
Figure 8. Schlieren view of uncontrolled and wall ventilated intakes at Rc = 1.19.
Processes 08 00208 g008
Figure 9. Schlieren view of uncontrolled and wall ventilated intakes at Rc = 1.22.
Processes 08 00208 g009
Figure 10. Schlieren view of uncontrolled and wall ventilated intakes at Rc = 1.25.
Processes 08 00208 g010
Figure 11. Pressure tapings located along the length of the intake-core.
Processes 08 00208 g011
Figure 12. Static pressure variation along the intake-core due to wall ventilation at Rc = 1.16.
Processes 08 00208 g012
Figure 13. Static pressure variation along the intake-core due to wall ventilation at Rc = 1.19.
Processes 08 00208 g013
Figure 14. Static pressure variation along the intake-core due to wall ventilation at Rc = 1.22.
Processes 08 00208 g014
Figure 15. Static pressure variation along the intake-core due to wall ventilation at Rc = 1.25.
Processes 08 00208 g015
Figure 16. Variations of wall static pressure for the controlled intakes at various contraction ratios (X = 0.48 L).
Processes 08 00208 g016
Figure 17. The controlled intakes with wall static pressure variations at different contraction ratios (X/L = 0.7).
Processes 08 00208 g017
Table 1. Different intake contraction ratio at supersonic speed.
A c   ( m m 2 ) A t   ( m m 2 ) R c R c 1
245.25210.751.160.862
220.25185.751.190.84
195.25160.751.220.819
170.25135.751.250.8
Table 2. Percentage variation of porosity with respect to the diameter and pitch of the pores.
Diameter (d) in mmPitch (p) in mmPorosity (%)
0.51.510.6
1.02.515.7
1.02.018.8
0.751.522.5
Table 3. Static pressure percentage variation due to wall ventilation at the upstream proximity (X = 0.48 L).
RCPorosity
10.6%15.7%18.8%22.5%
1.16−4.958−6.059−20.847−0.847
1.19−2.050−9.038−24.184−0.126
1.22−6.422−8.362−22.586−0.819
1.25−4.373−8.880−19.099−0.892
Table 4. Variation of wall static pressure percentage due to wall ventilation at the downstream proximity (X/L = 0.7).
RCPorosity
10.6%15.7%18.8%22.5%
1.165.263−1.9904.2370.332
1.1947.605−7.73155.9058.664
1.2256.993−15.81522.49519.718
1.2532.432−0.79934.67836.620

