Quantifying the Benefit of a Dynamic Performance Assessment of WWTP


Abstract
1. Introduction
2. Materials and Methods
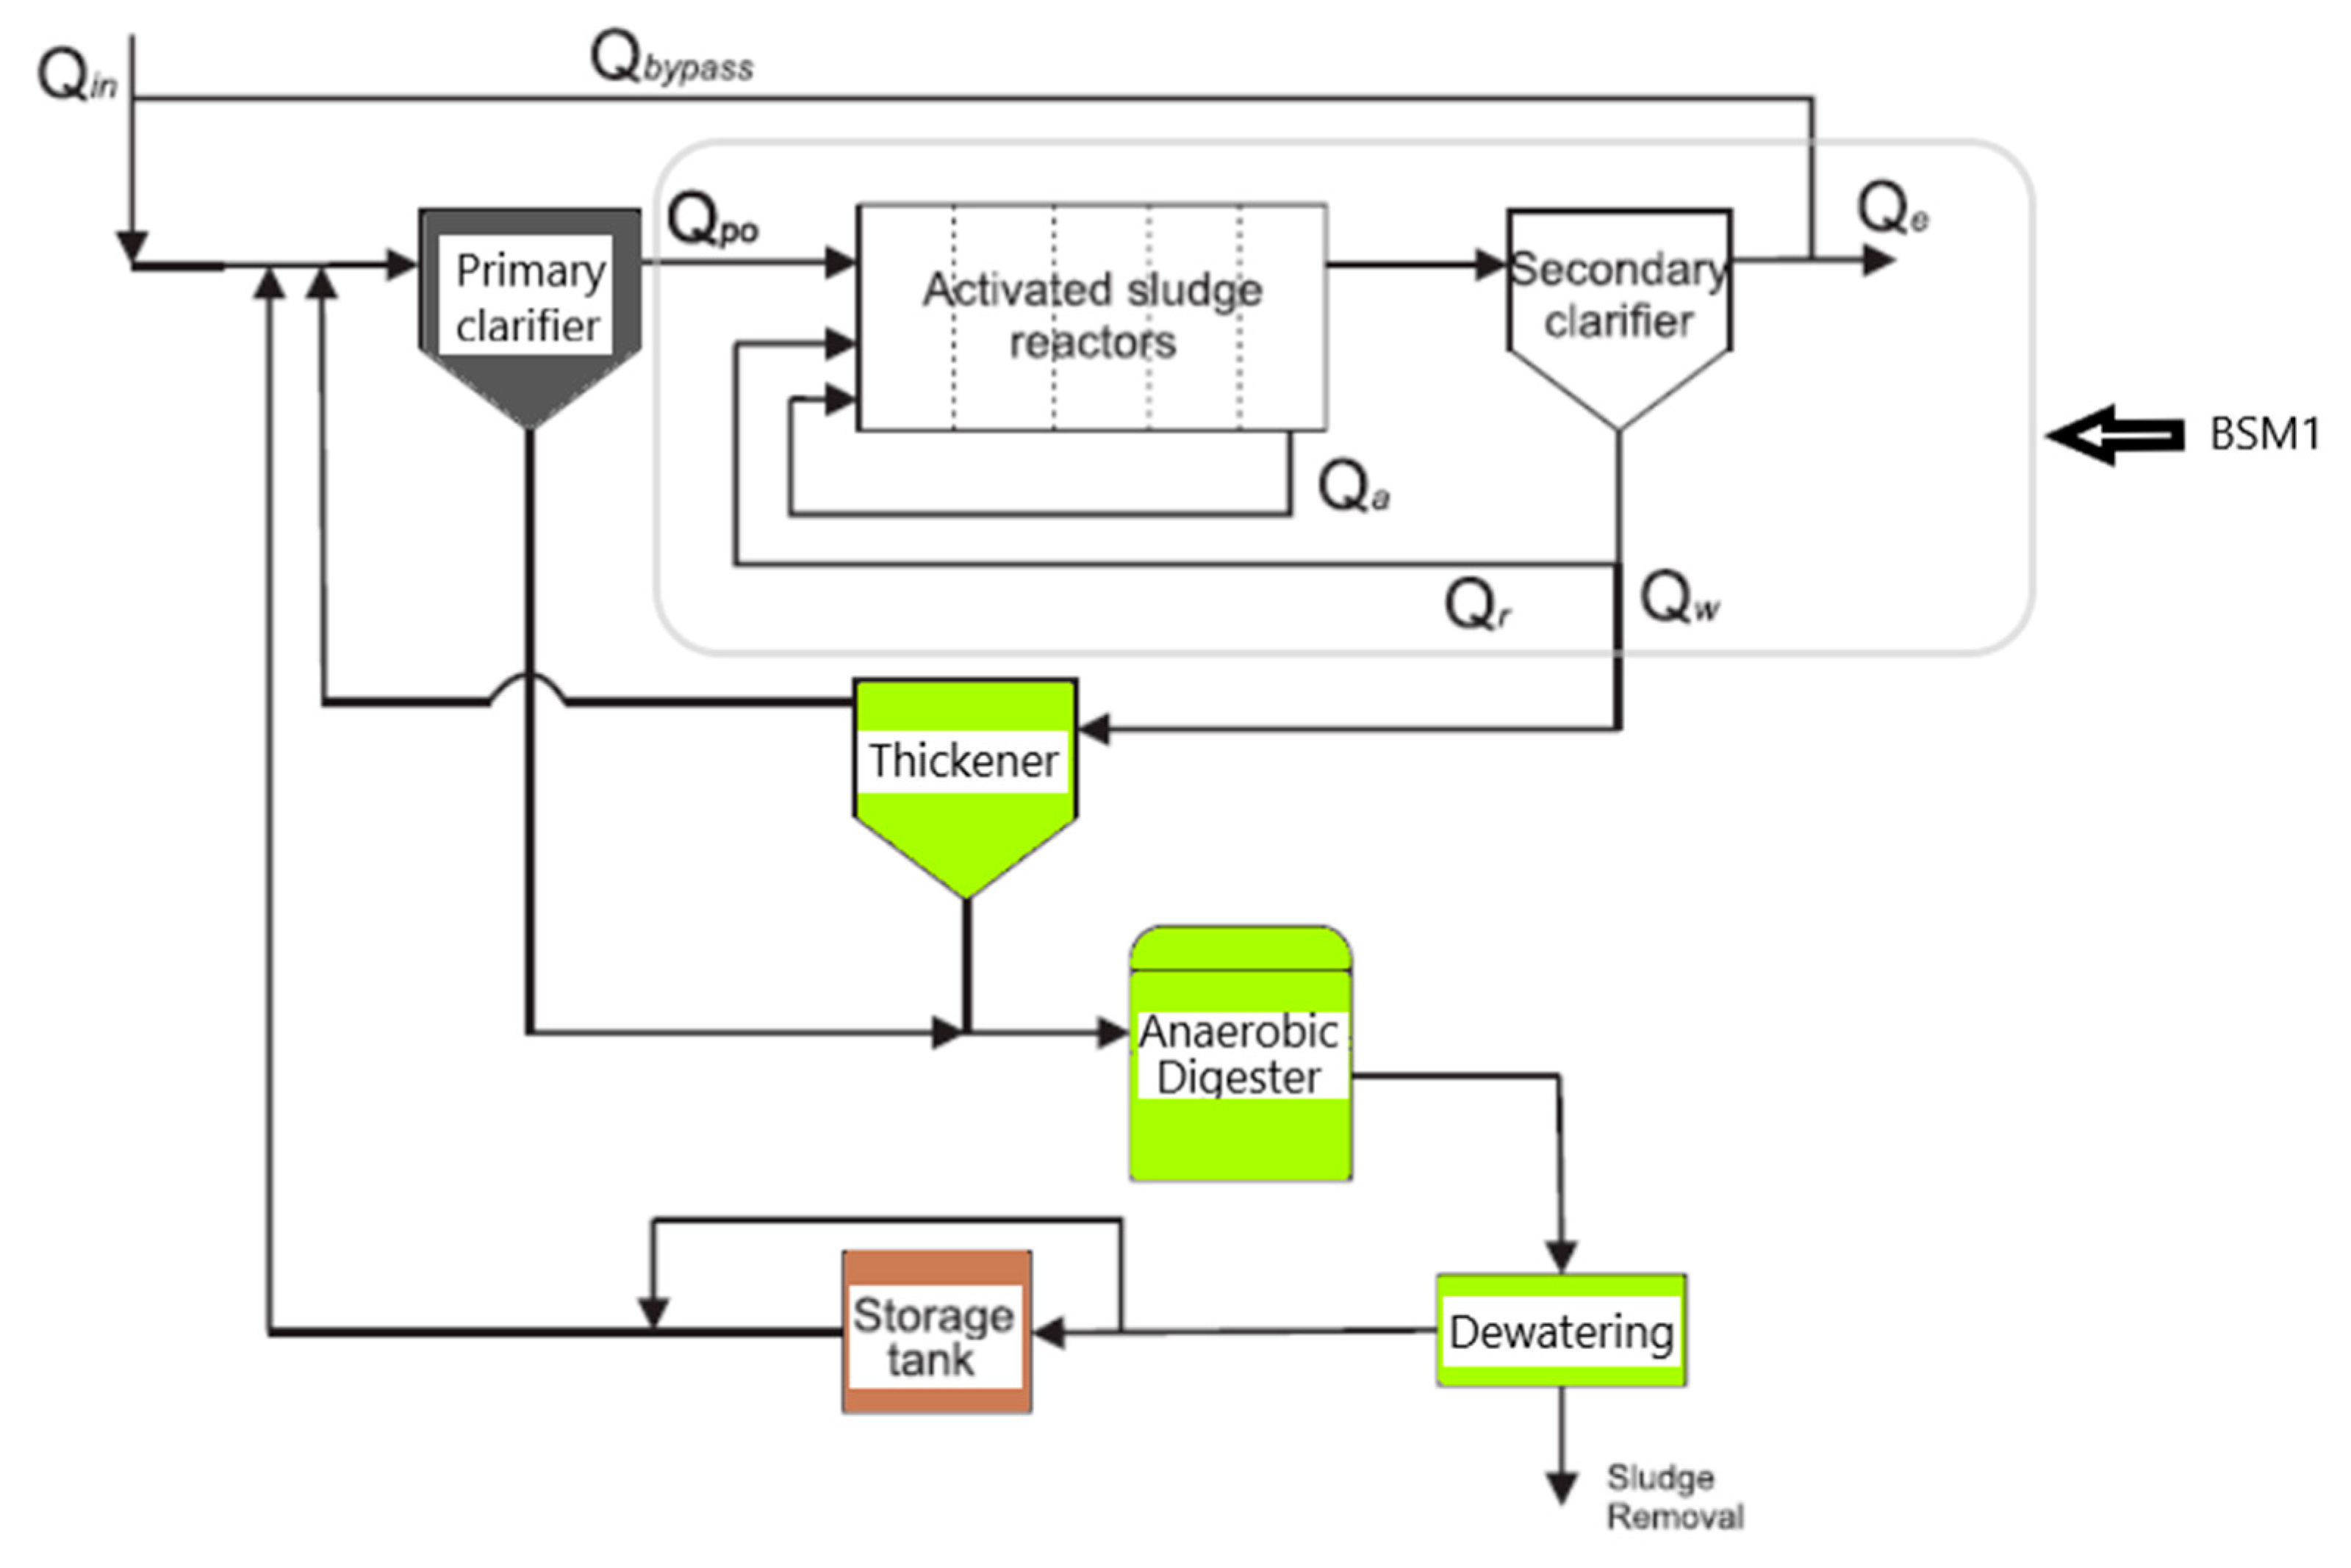
2.1. Description of the Wastewater Treatment Plant and Control Strategies. Benchmark Simulation Model No. 2 (BSM2) Platform
Significant Operating Variables and Control Strategies
- Operation strategies: BSM2 default strategy and modifications
- (a)
- manipulation of Qw that is fixed to 450 m3/d in the warmer season and changed to 300 m3/d in the colder season.
- (b)
- constant carbon dosage to the first reactor in the anoxic zone: Qcarb = 2 m3/d with a concentration of 40,000 g/m3
- (c)
- constant internal and external recirculation flowrate: Qr = 20,648 m3/d and Qa = 61,944 m3/d.
- (d)
- keeping digester temperature (T) at 35 °C by using biogas for heating.
- (e)
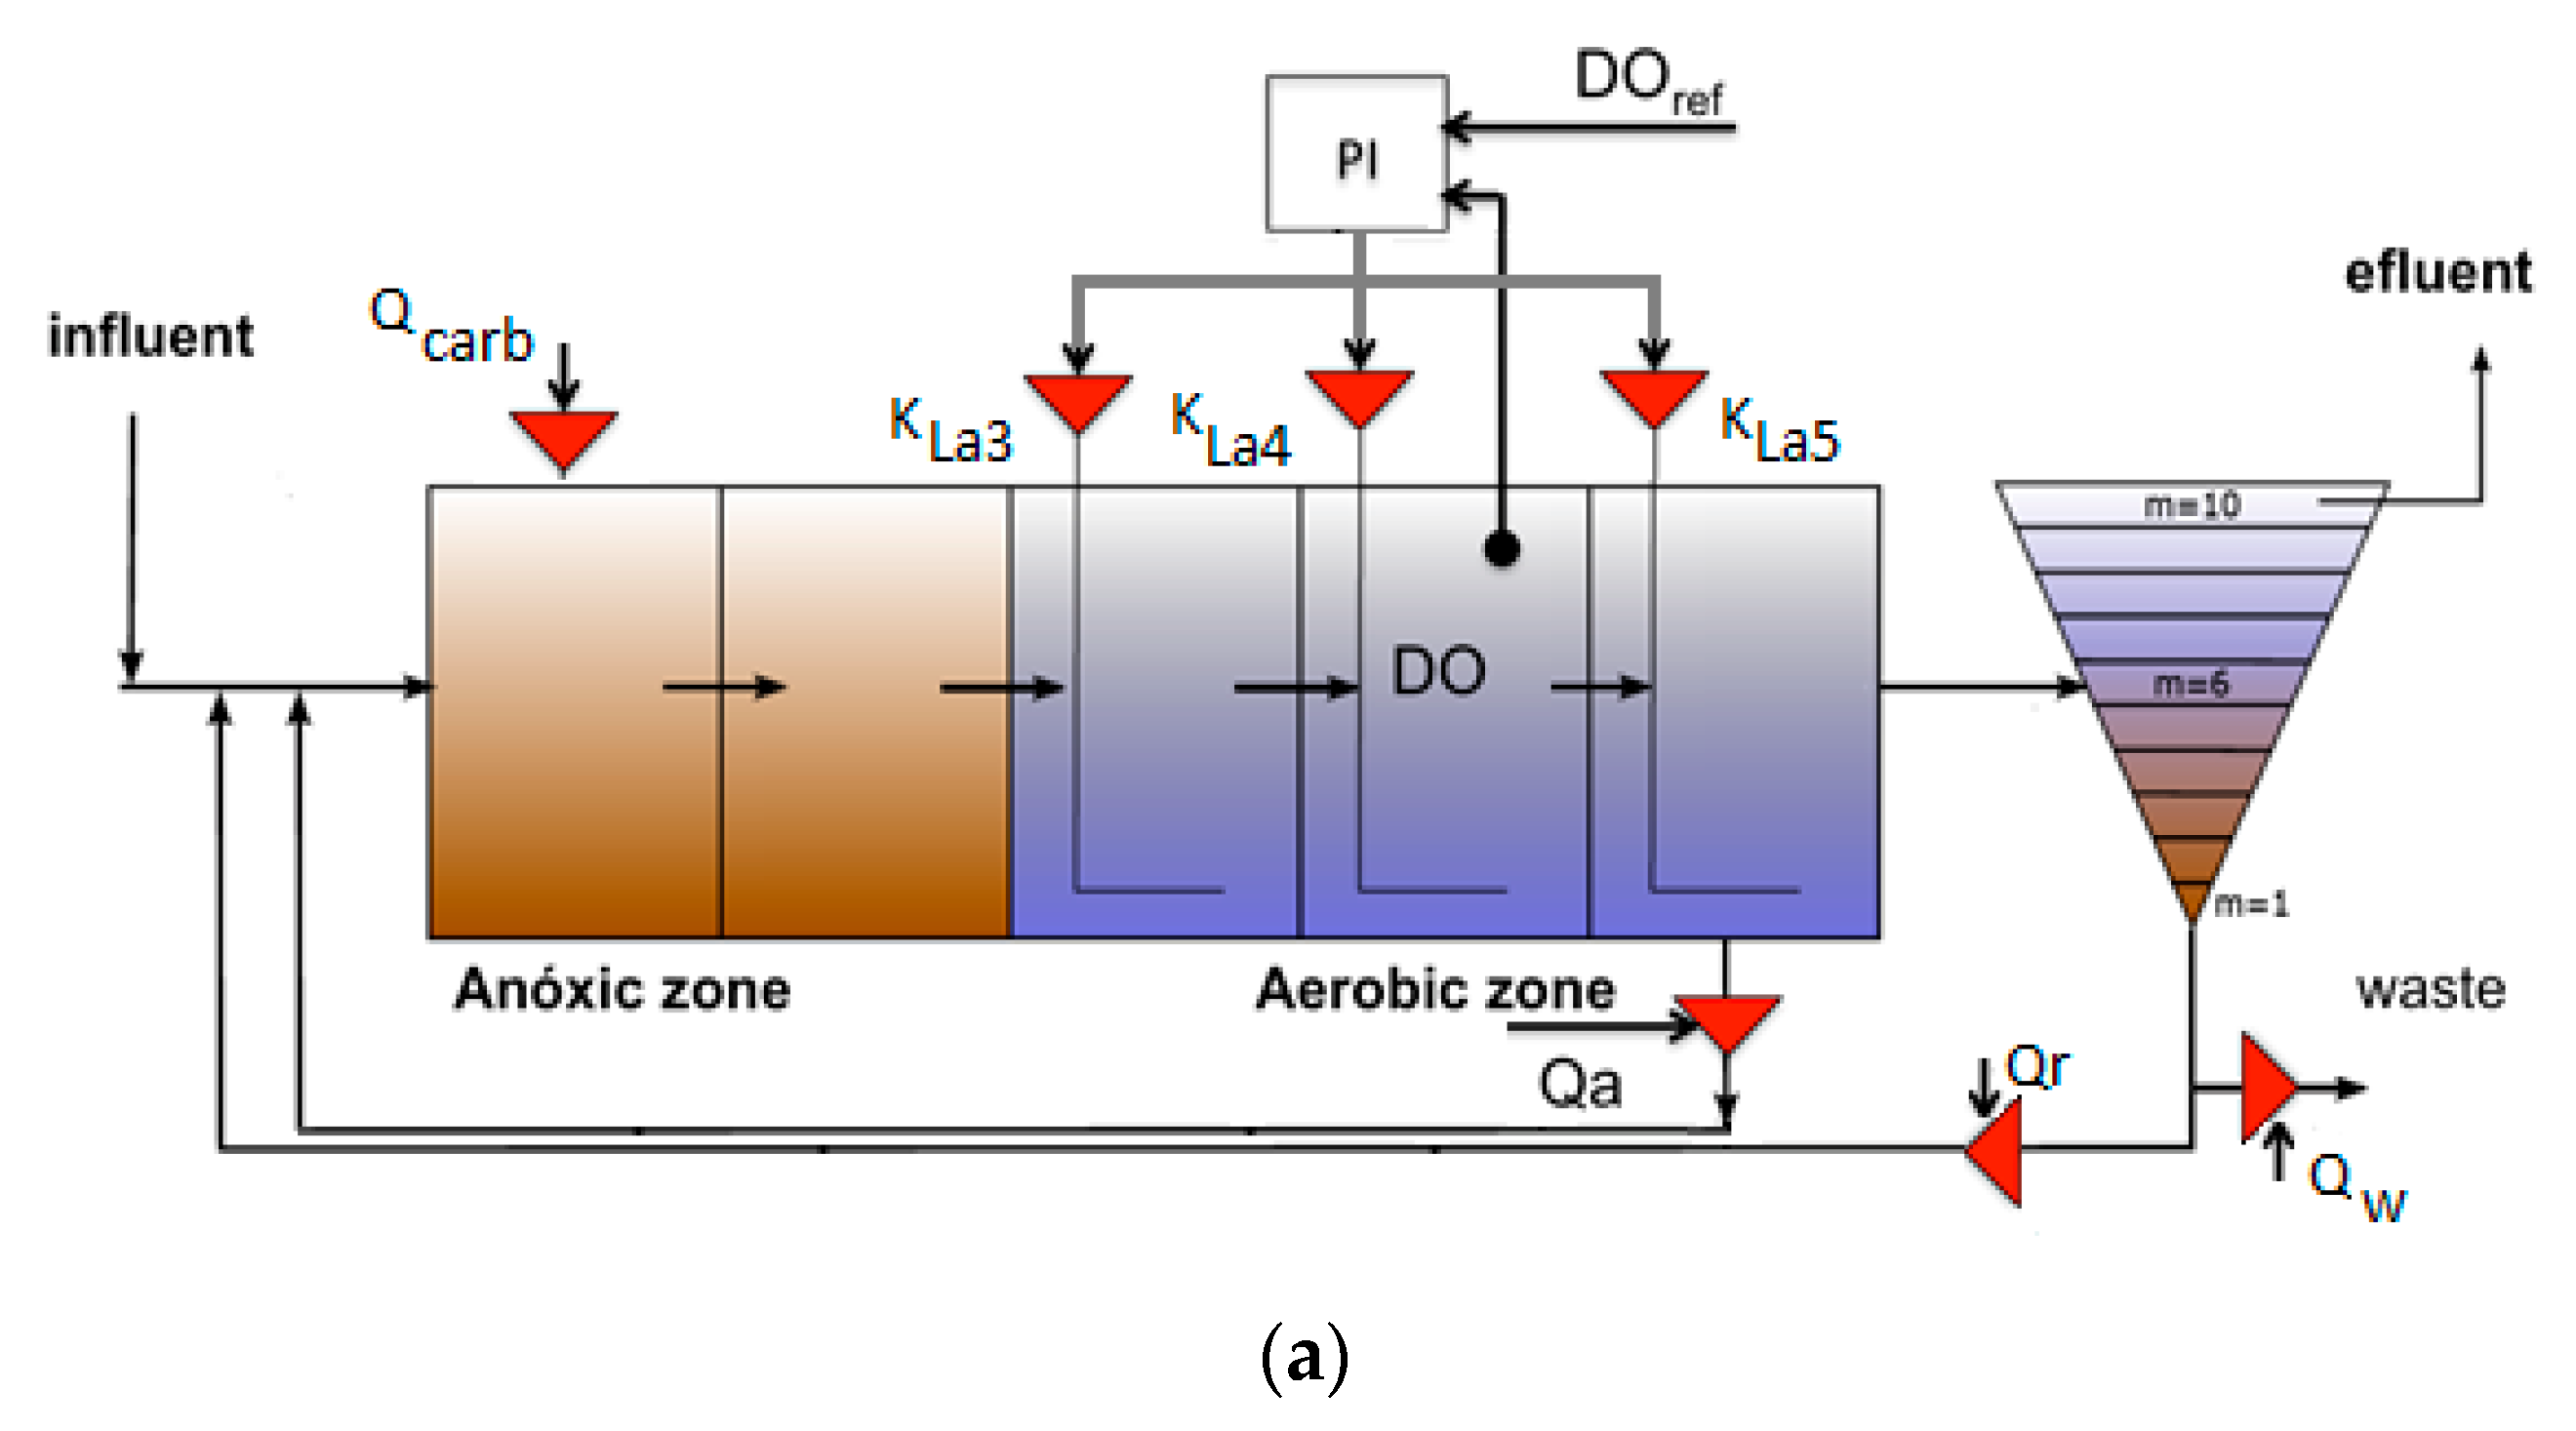
- PI feedback control of DO concentration using the oxygen transfer coefficient (KLa) as manipulated variable instead of a basic control loop to regulate airflow rate. DO concentration in the fourth aeration tank (SO4) is regulated to a constant set-point of 2 g r/m3 manipulating the oxygen transfer coefficient of the fourth reactor (KLa4), while the transfer coefficients of the third and fifth reactors (KLa3 and KLa5) are computed considering a gain of 1 and 0.5 (Figure 2a). This scheme is named the DO default control.
- -
- The addition of a closed loop for the control of nitrates concentration at the end of the anoxic zone using the internal recycle (Qa). The combination of both loops, DO default and nitrates control, is similar to the default control strategy of BSM1 platform [13]. Here, it is named DO + NO control.
- -
- Substituting direct DO control by ammonium-based control including an external PI controller to compute the DO set-point for the internal controller. The ammonium concentration in the fifth reactor (SNH5) is the measured variable. This scheme is named Cascade SNHSP.
- Performance evaluation protocol
2.2. Evaluation of the Impact of Dynamic Behavior Actions on Environmental and Operating Costs
- The objective of a WWTP is to minimize the emissions to water; however, wastewater treatment implies environmental impacts associated with energy consumption, use of chemicals and emissions to soil and air (solids and greenhouse gases). The control actions carried out to ensure the desired elimination of water pollutants (i.e., emissions to water) affect those environmental costs as well as the operation costs. Then, for a sustainable operation of WWTPs control systems should lead to operating conditions that satisfy the compromise between environmental costs, operating costs and appropriated plant performance.
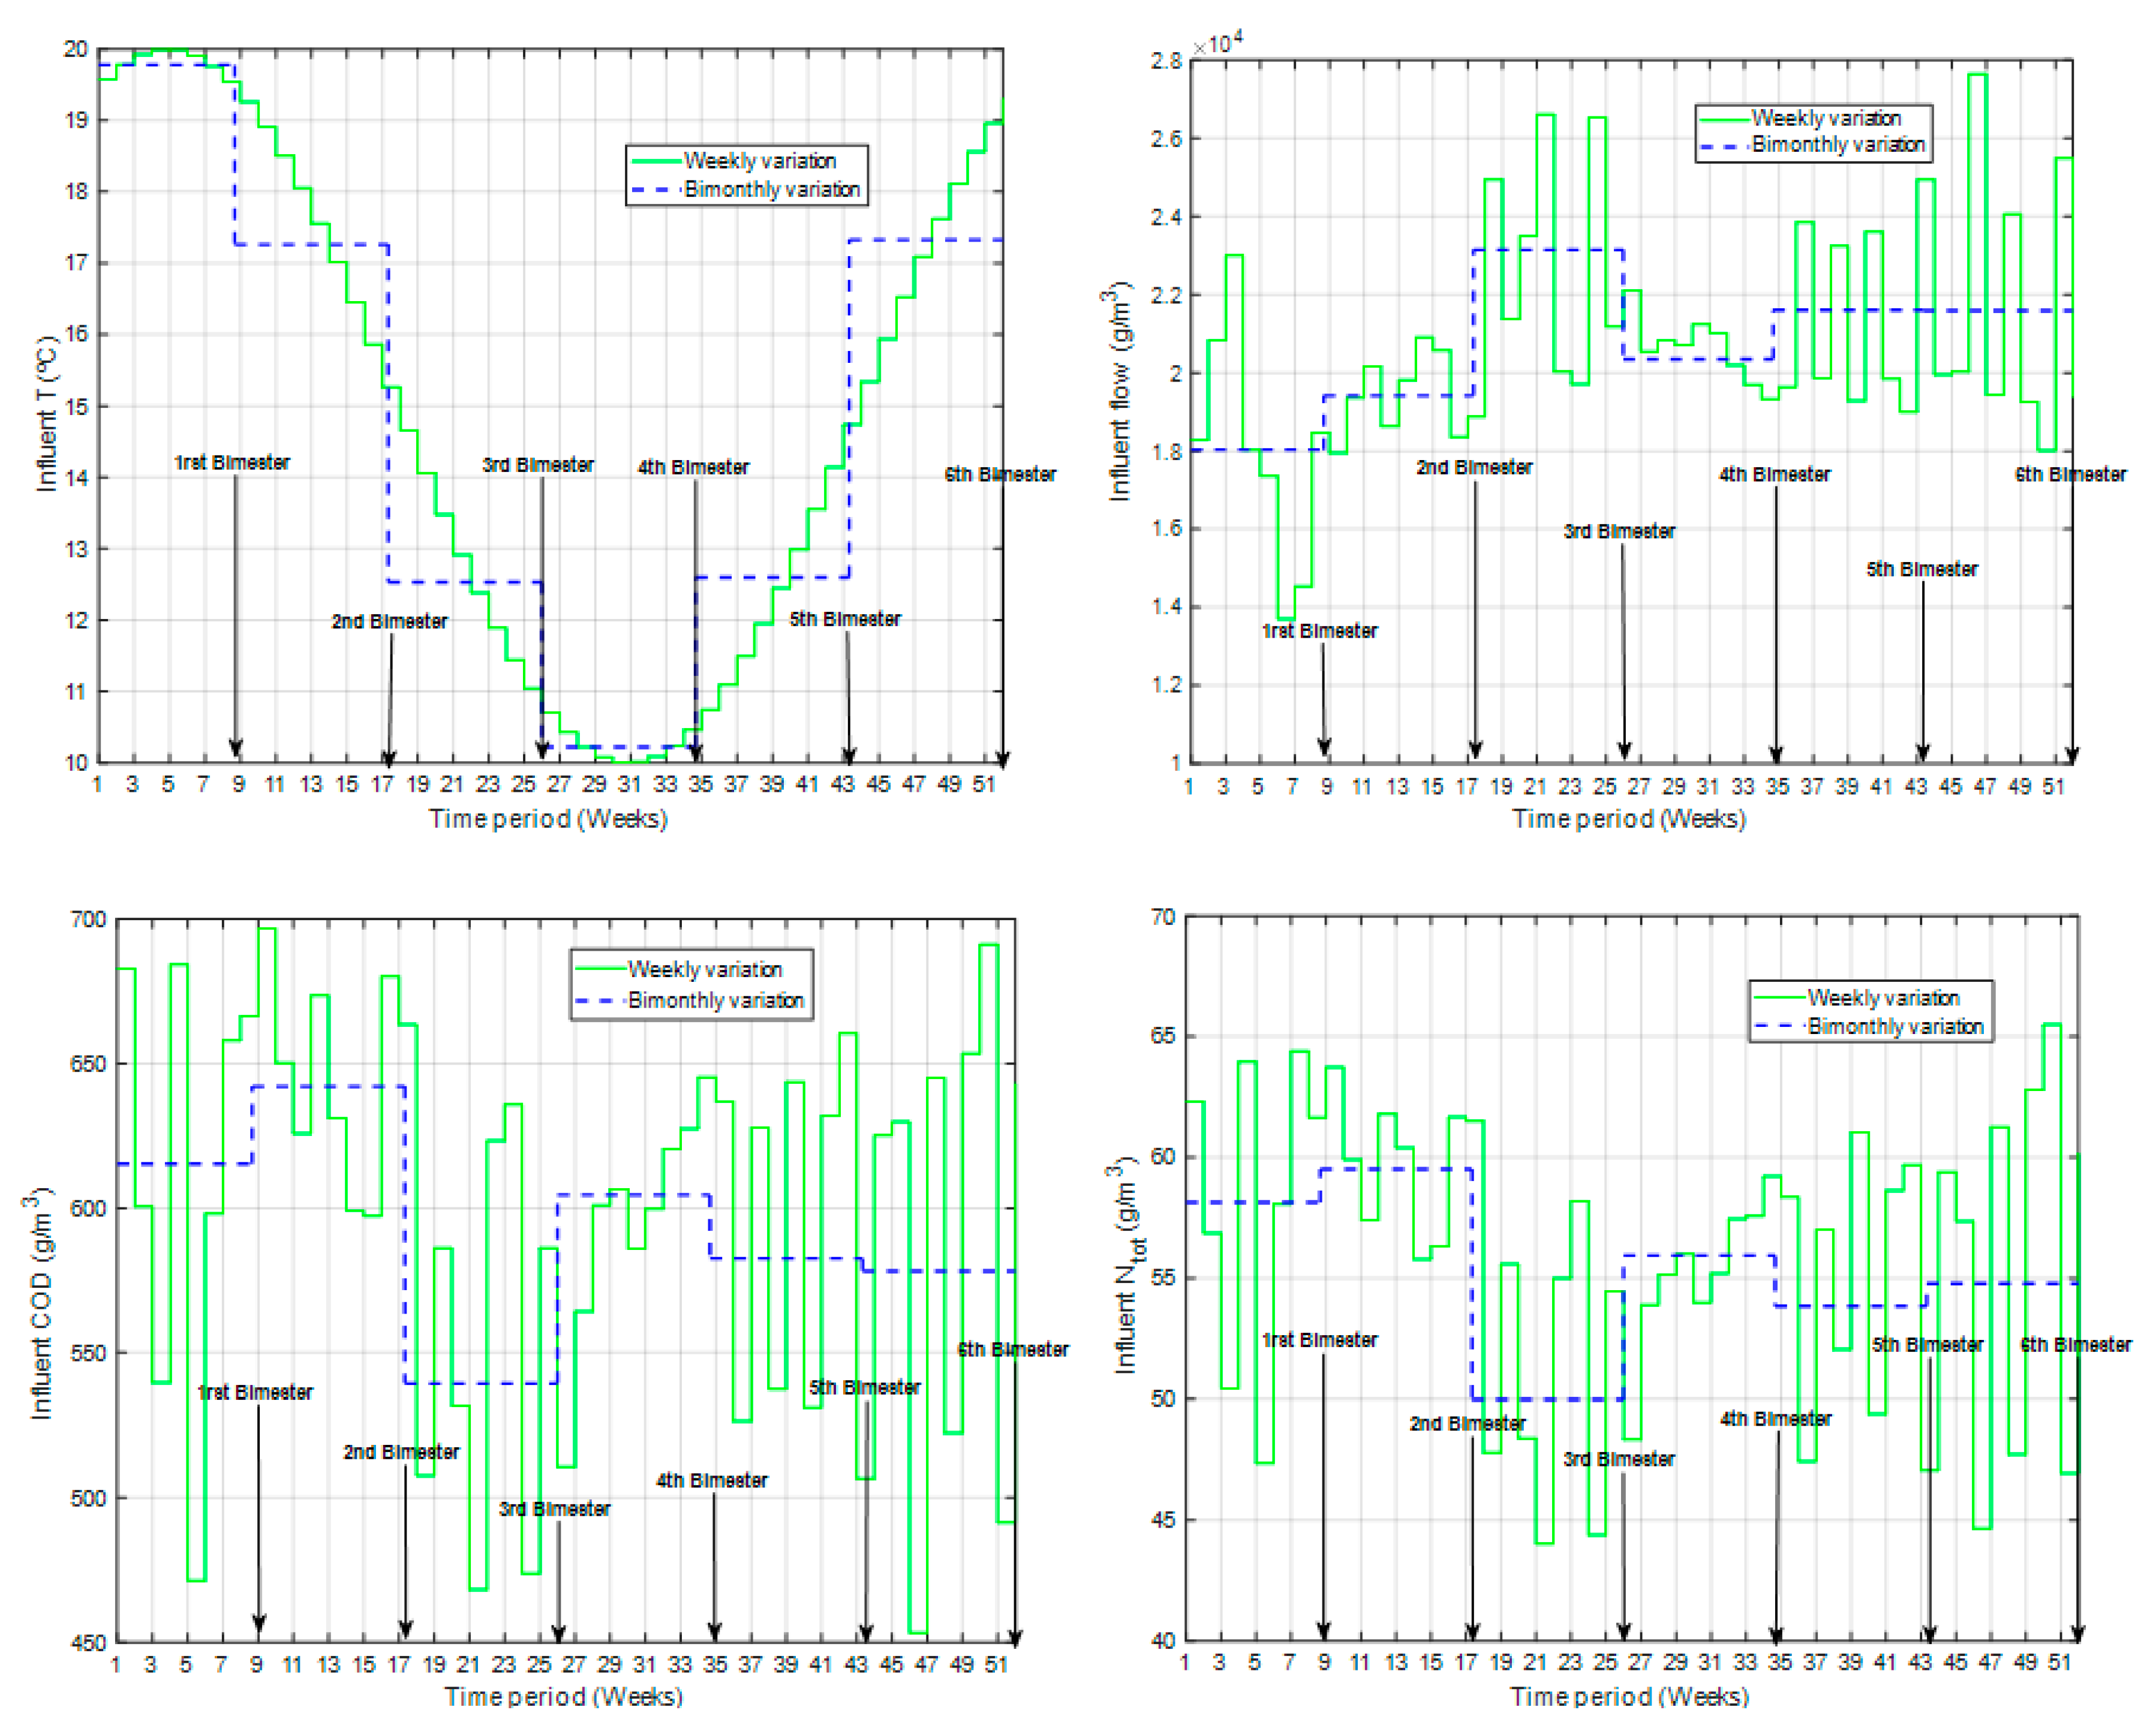
- The influent is constantly varying in flow and concentration mainly due to seasonal and daily variations of population activities, which modifies continuously the load to be treated. Temperature and rainfall effects produce significant changes in the processes affecting its efficiency. Since biological processes are non-linear, the variability of the inputs produces a variable behavior, which makes it difficult to find and maintain operating conditions that ensure the desired process performance with an optimal use of resources and minimum evitable emissions.
- Due to the interactions and interconnections between the different units, the control actions performed in ASP have an impact in the whole plant effecting, sludge and biogas production which are emissions to soil and air, respectively.
- Electricity used to perform control actions is the most important factor in the operating costs being aeration the main contribution [28] and it is also the major source of indirect carbon dioxide (CO2) emissions, then, the minimization of electricity consumption in the control actions improve economics as well as environmental costs.
- Heating requirements to keep the temperature of the anaerobic digestion close to 35 °C are covered using the biogas obtained as by-product. Biogas in excess can be used to produce electricity and reduce operating costs, but indirect emissions of CO2 are produced when using biogas to obtain energy.
- An external carbon source is required to provide enough organic matter to heterotrophs for denitrification. Carbon dosage can decrease the concentration of nitrates, reducing total nitrogen emissions to water but it is a chemical additive that increases also operating costs.
- Biological processes in ASP produce greenhouse gases as CO2. Biogas from anaerobic digestion contains methane, CO2 and hydrogen. The sludge for disposal is a solid residue that affects soil.
2.2.1. Analysis Procedure
- -
- Electricity consumption (kW) that includes aeration energy in the ASP (AE), pumping energy (PE) and mixing energy (ME) used in the whole plant.
- -
- Heating energy (HE) in kW h required to maintain the sludge fed to digester at 35 °C.
- -
- For chemicals usage:
- -
- The load of the external carbon source that is methanol with a concentration of 40,000 g/m3 with a flowrate given by Qcarb.
- -
- Amount in g of methane (Biogas CH4) and carbon dioxide (CO2-digester) produced in anaerobic digester.
- -
- Amount in g of carbon dioxide produced in ASP (CO2-ASP), computed from the relations given by Equations (9)–(11) introduced in the BSM2 evaluation program.
- -
- Total CO2 that combines CO2 from digester and CO2 from ASP.
- -
- Amount in kg of sludge for disposal.
- -
- For emissions to water:
- -
- Amount in g of ammonium in the effluent (SNH Load effluent)
- -
- Amount in g of total nitrogen in the effluent (Ntot Load effluent)
- -
- Amount in g of COD in the effluent (COD effluent)
- -
- Effluent quality index (EQI).
- Temporal characterization of BSM2 dynamic influent
3. Results
3.1. Analysis of the Effect of Control Actions and Influent Variations on Environmental Indicators Considering Different Temporal Windows. Different Activated Sludge Process (ASP) Control Strategies
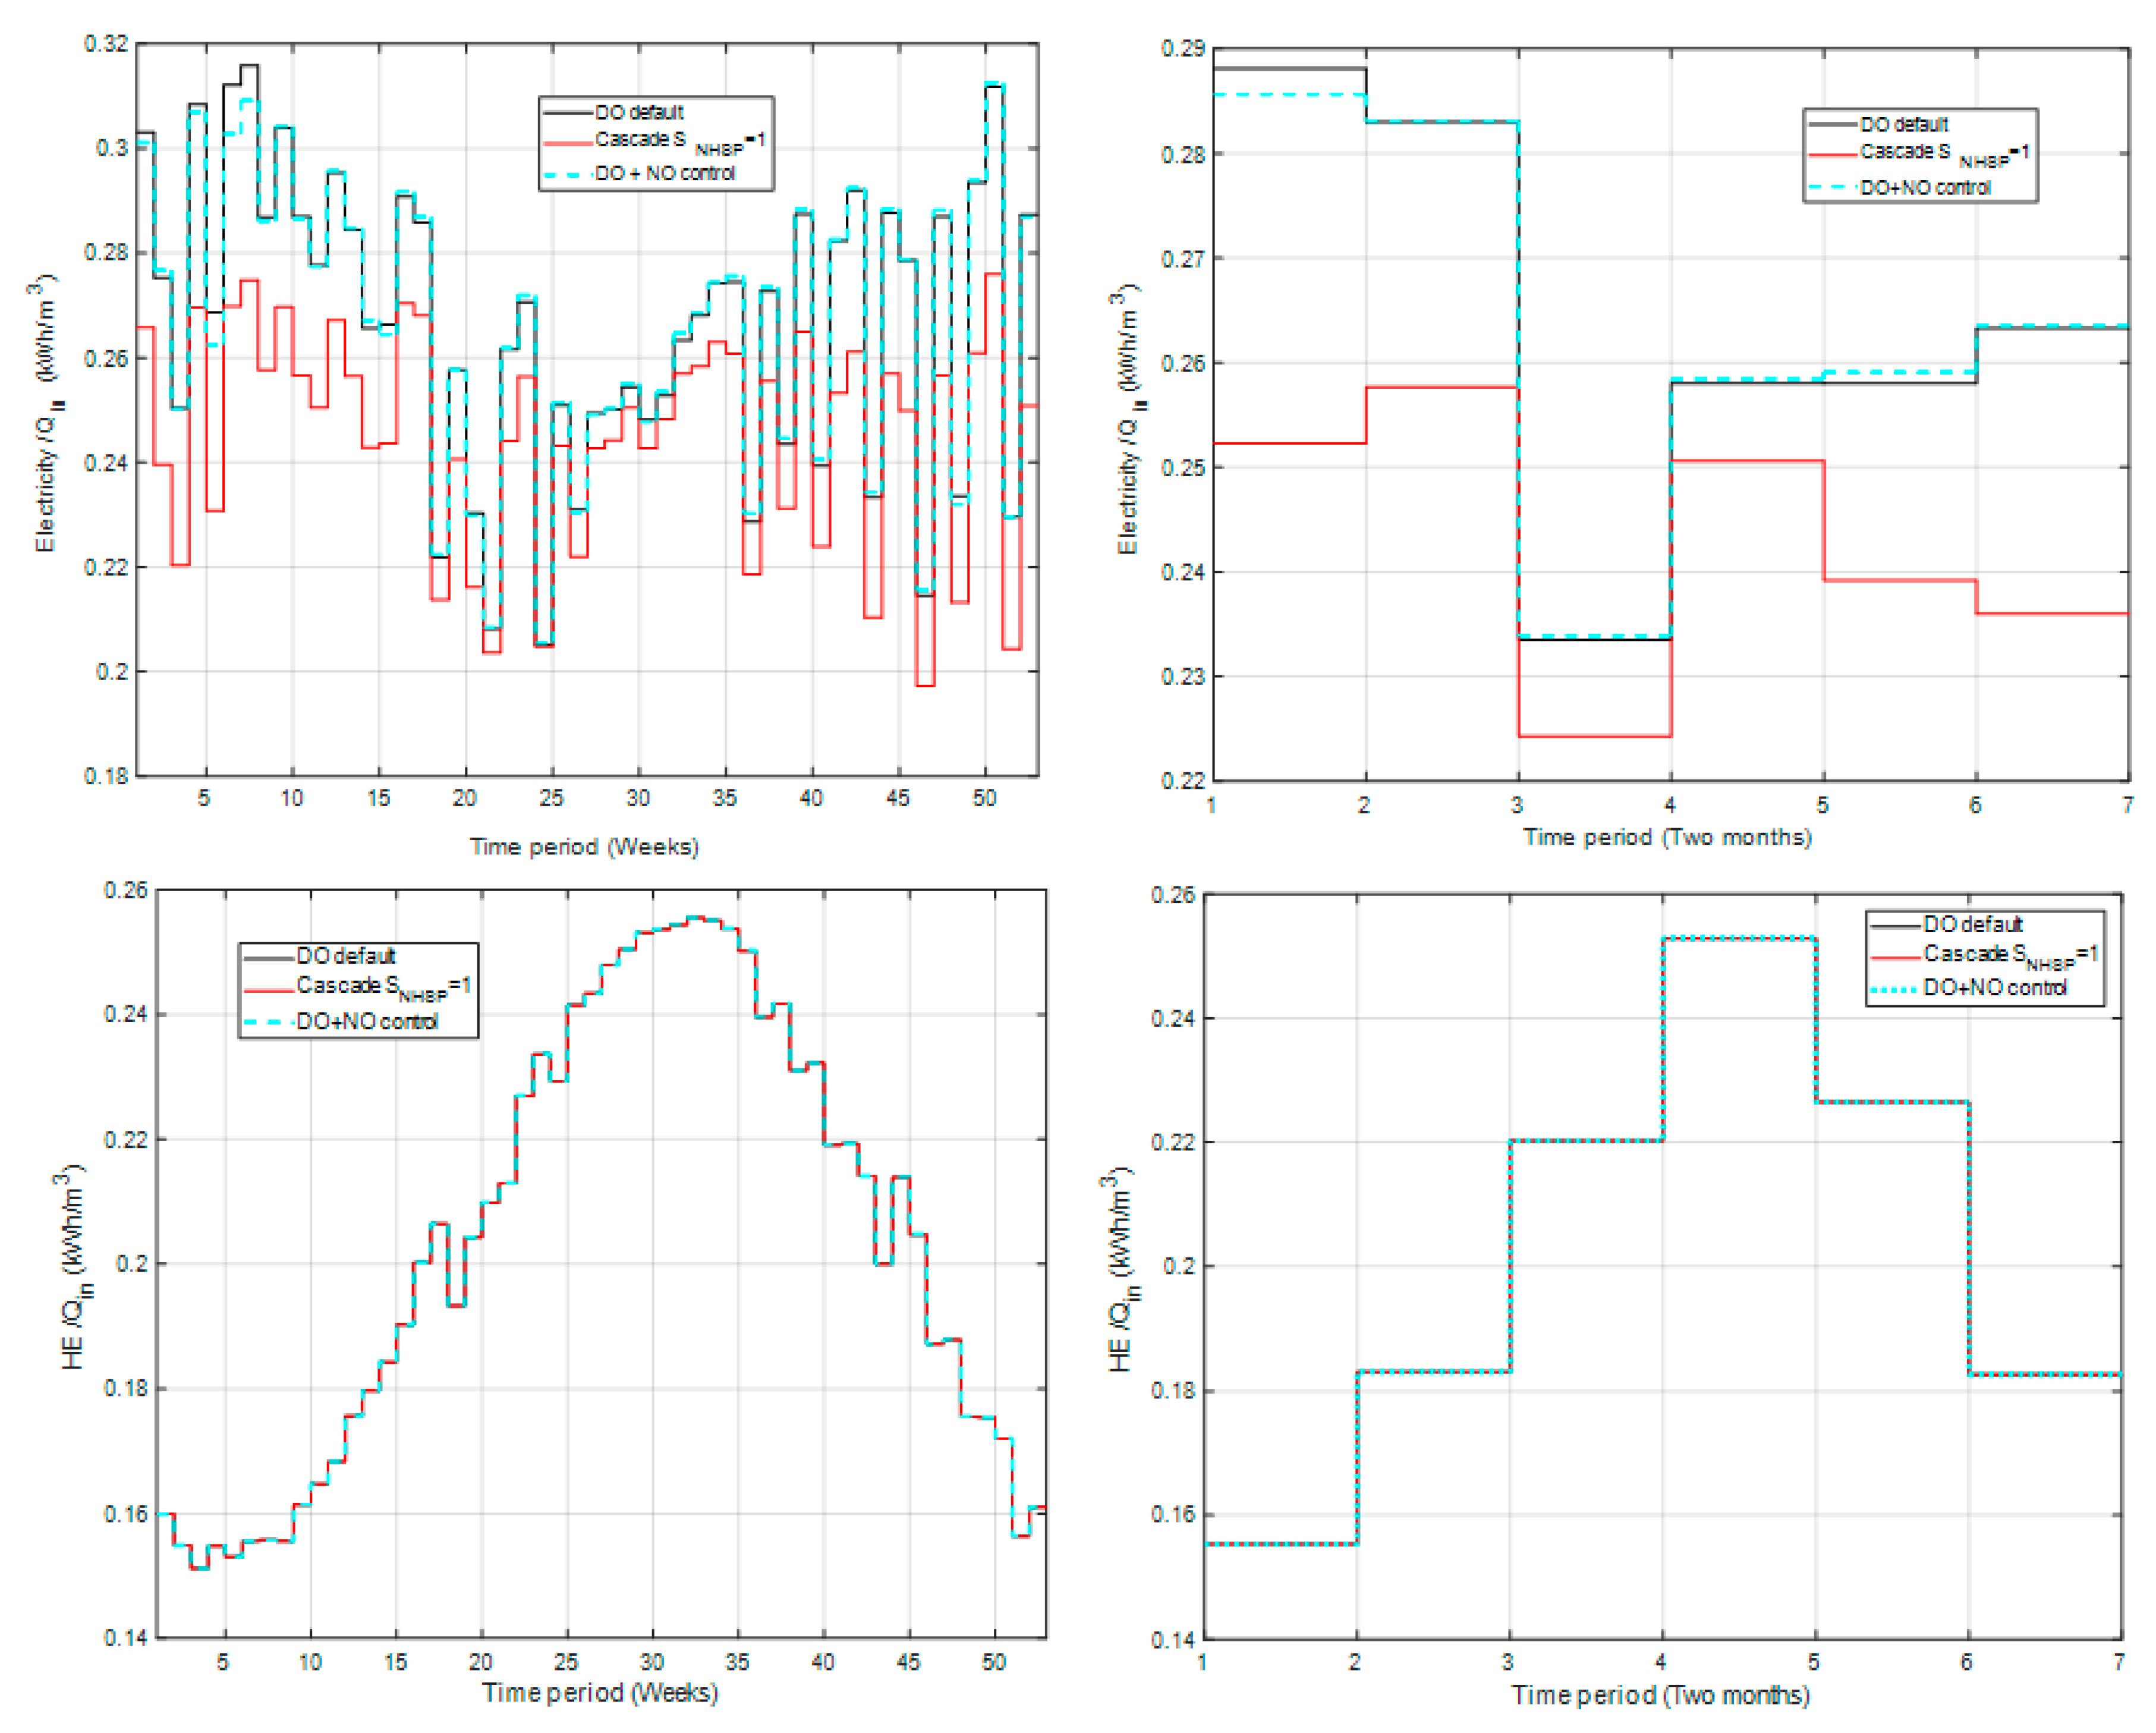
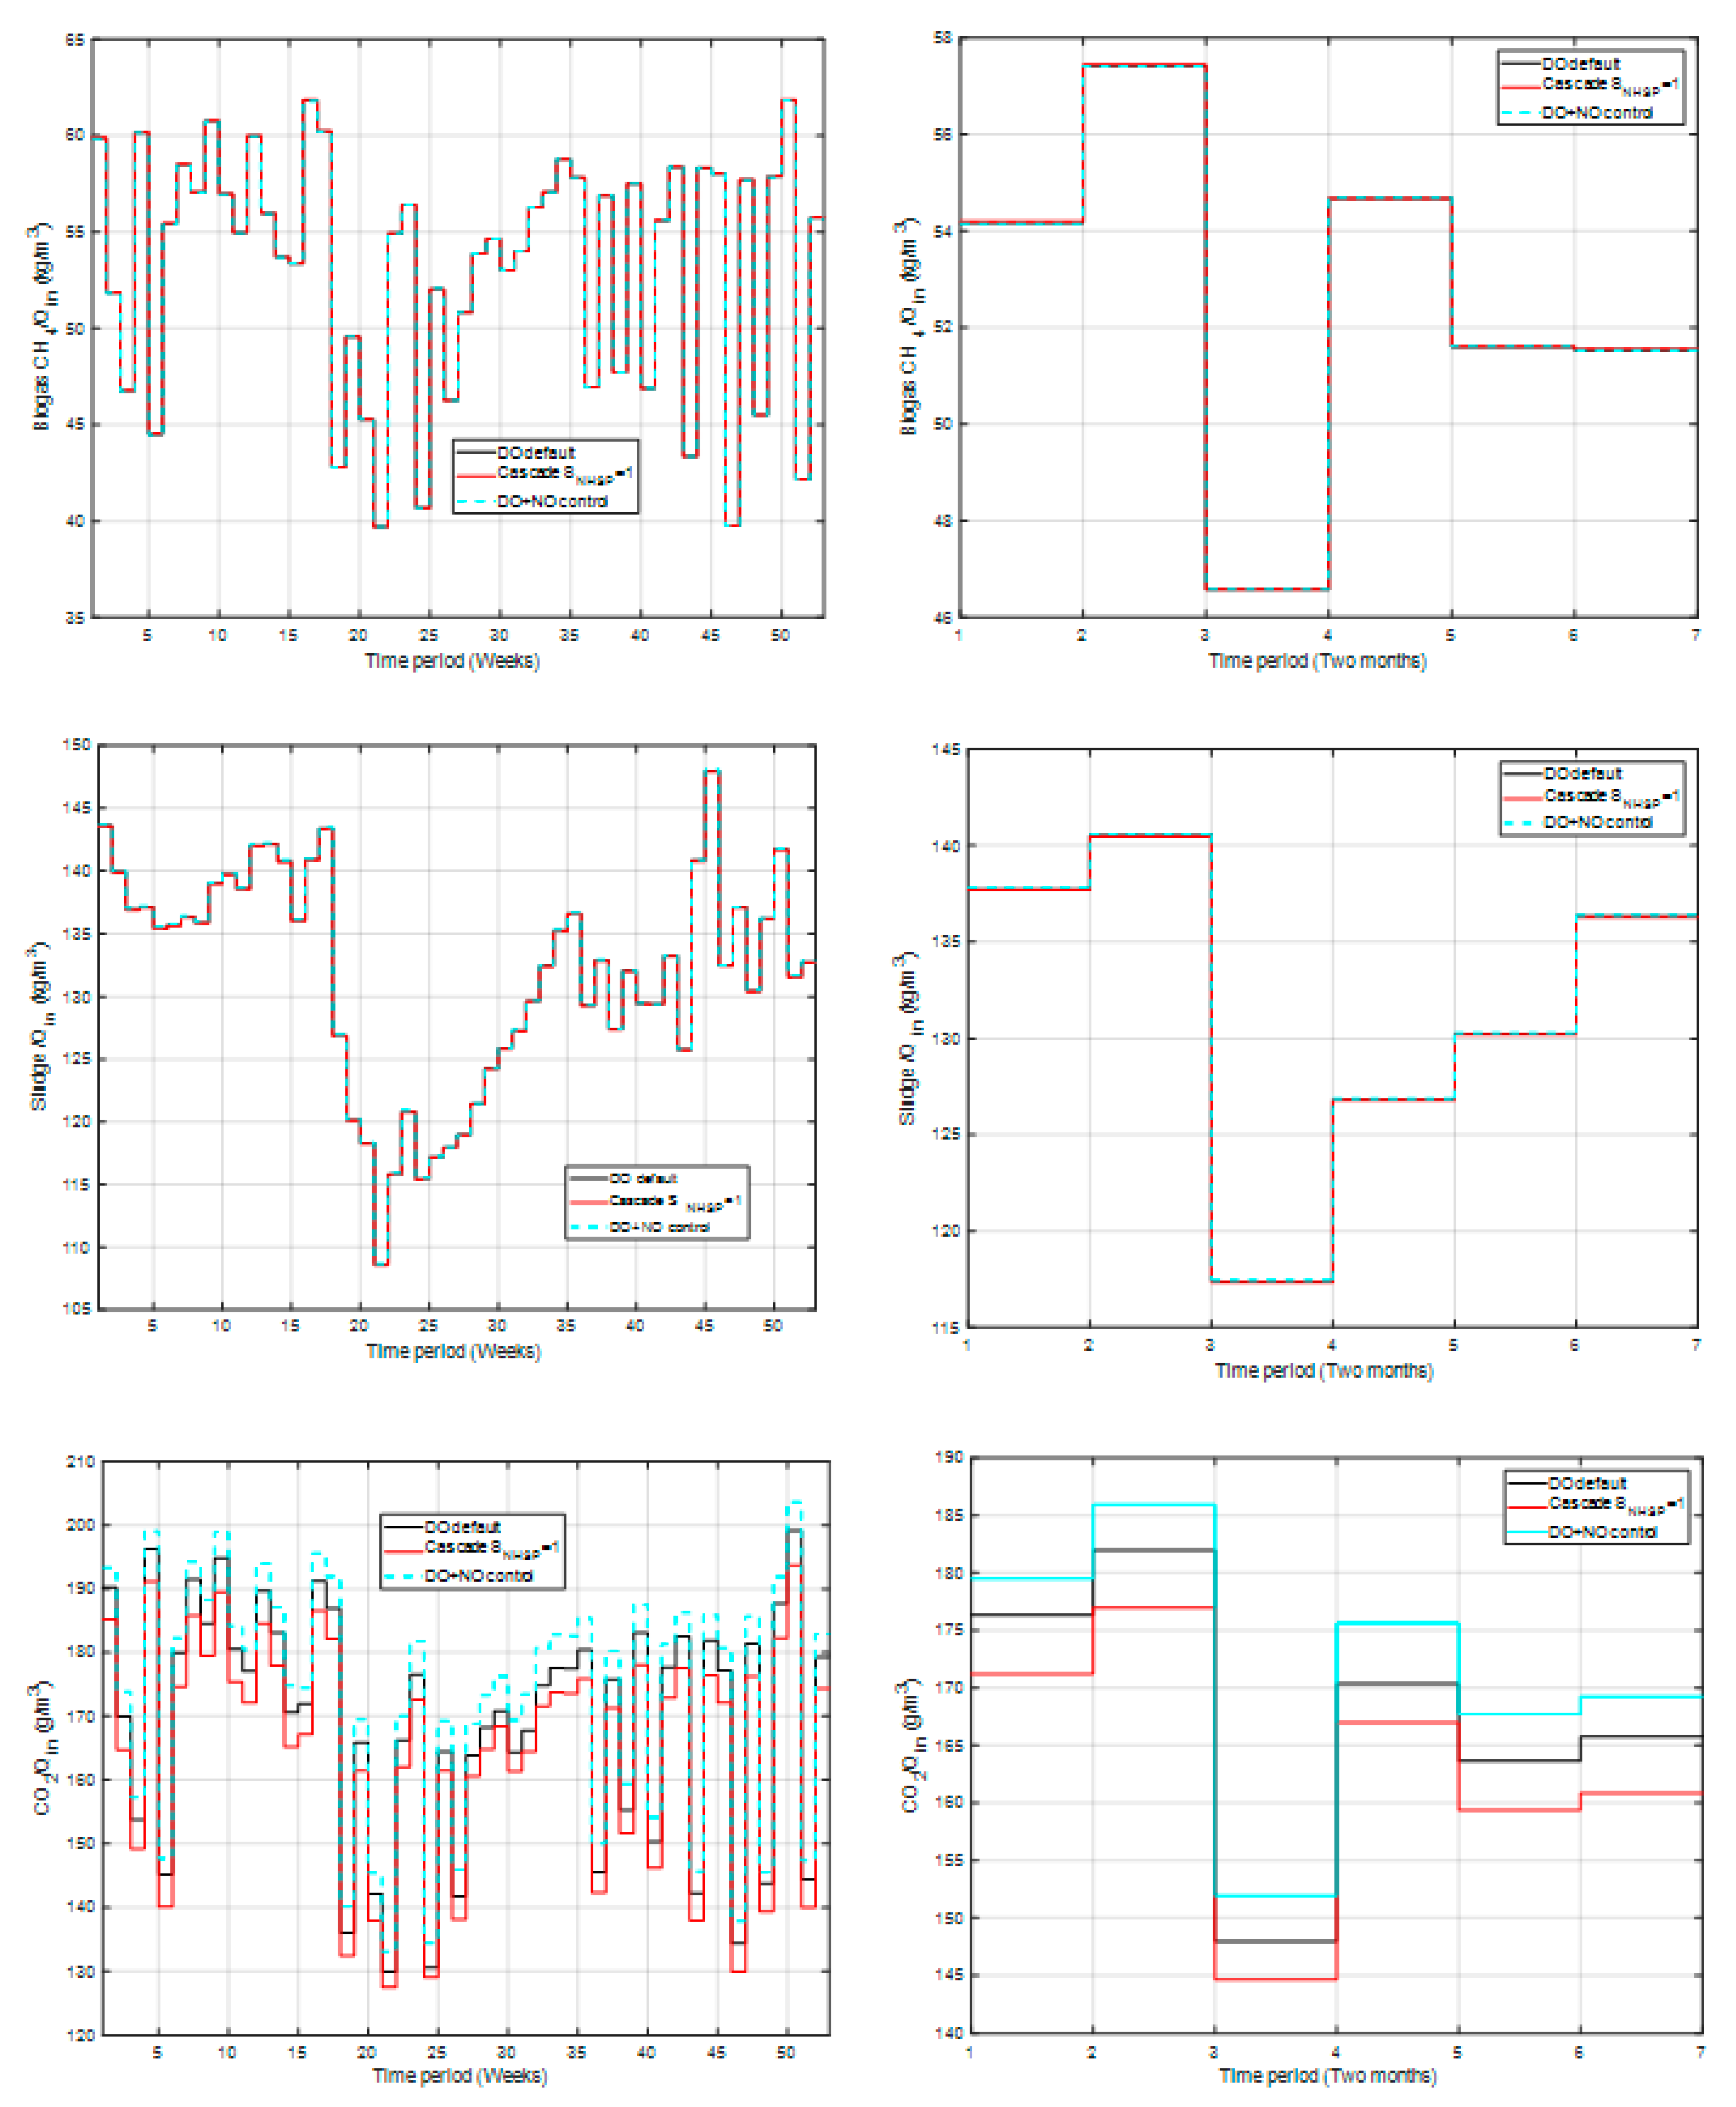
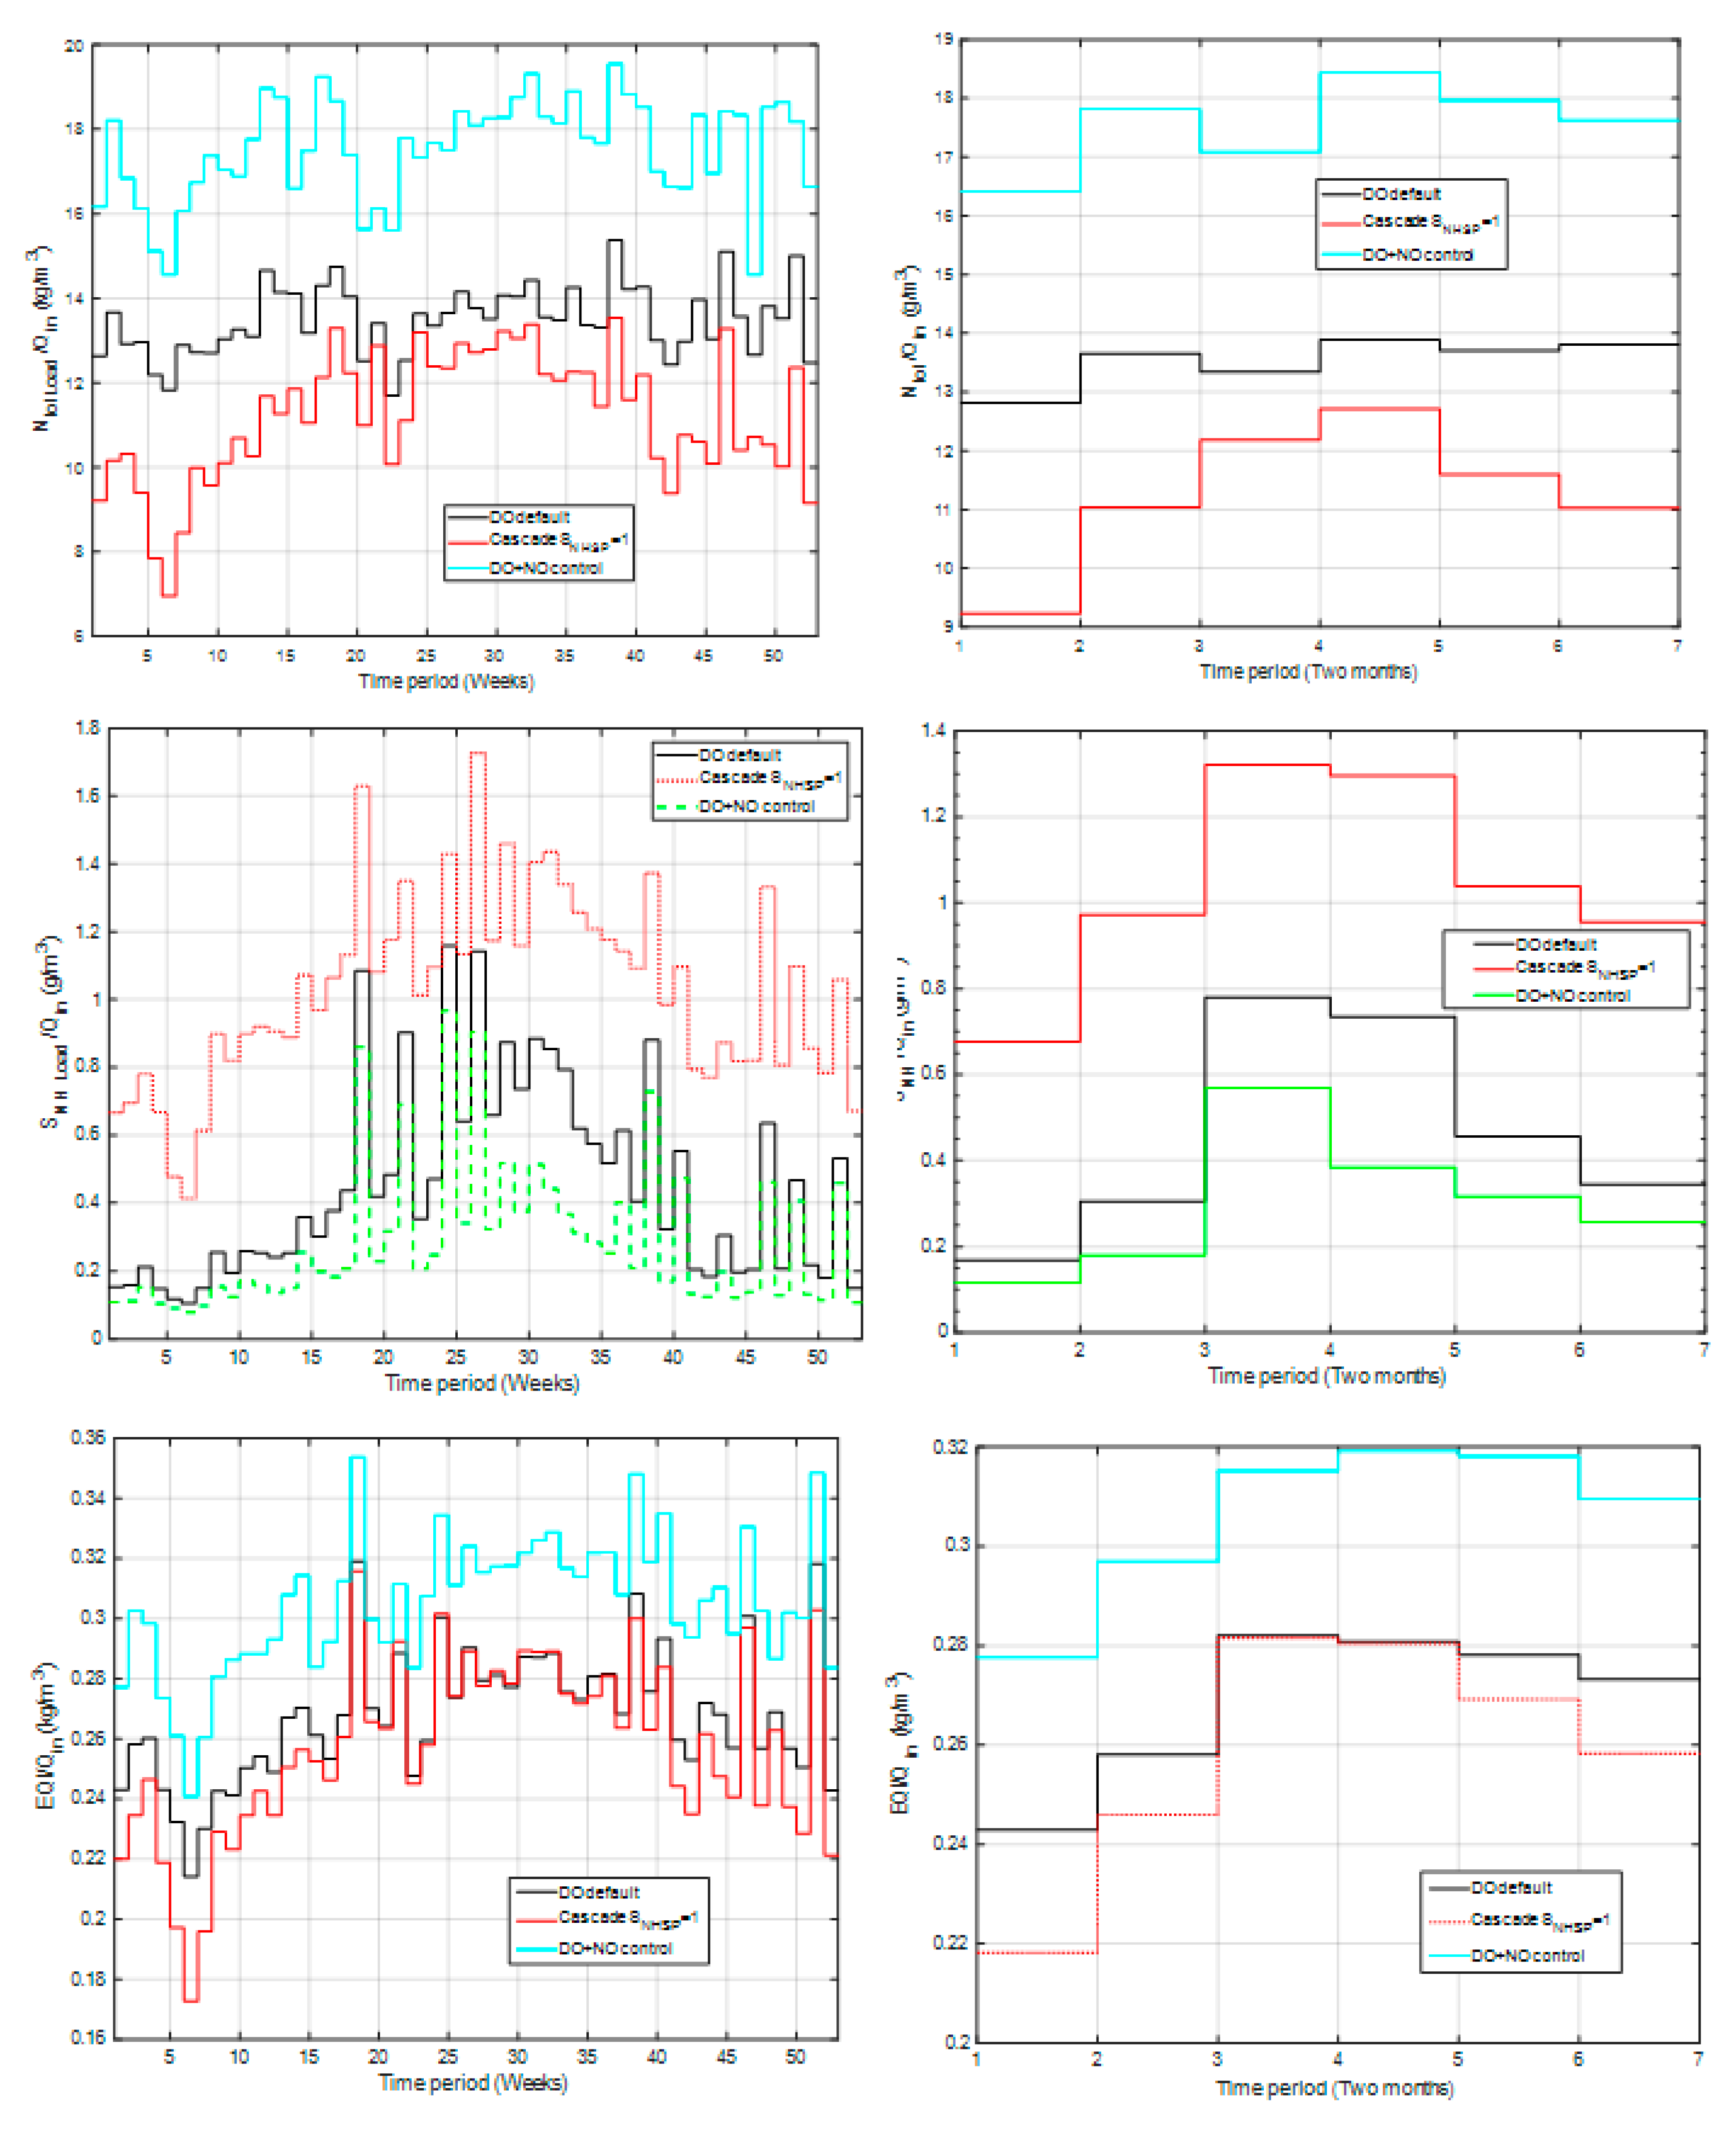
- Analysis of behavior in the full operating period (one year)
- Analysis of dynamic behavior considering weekly and bimonthly time scales
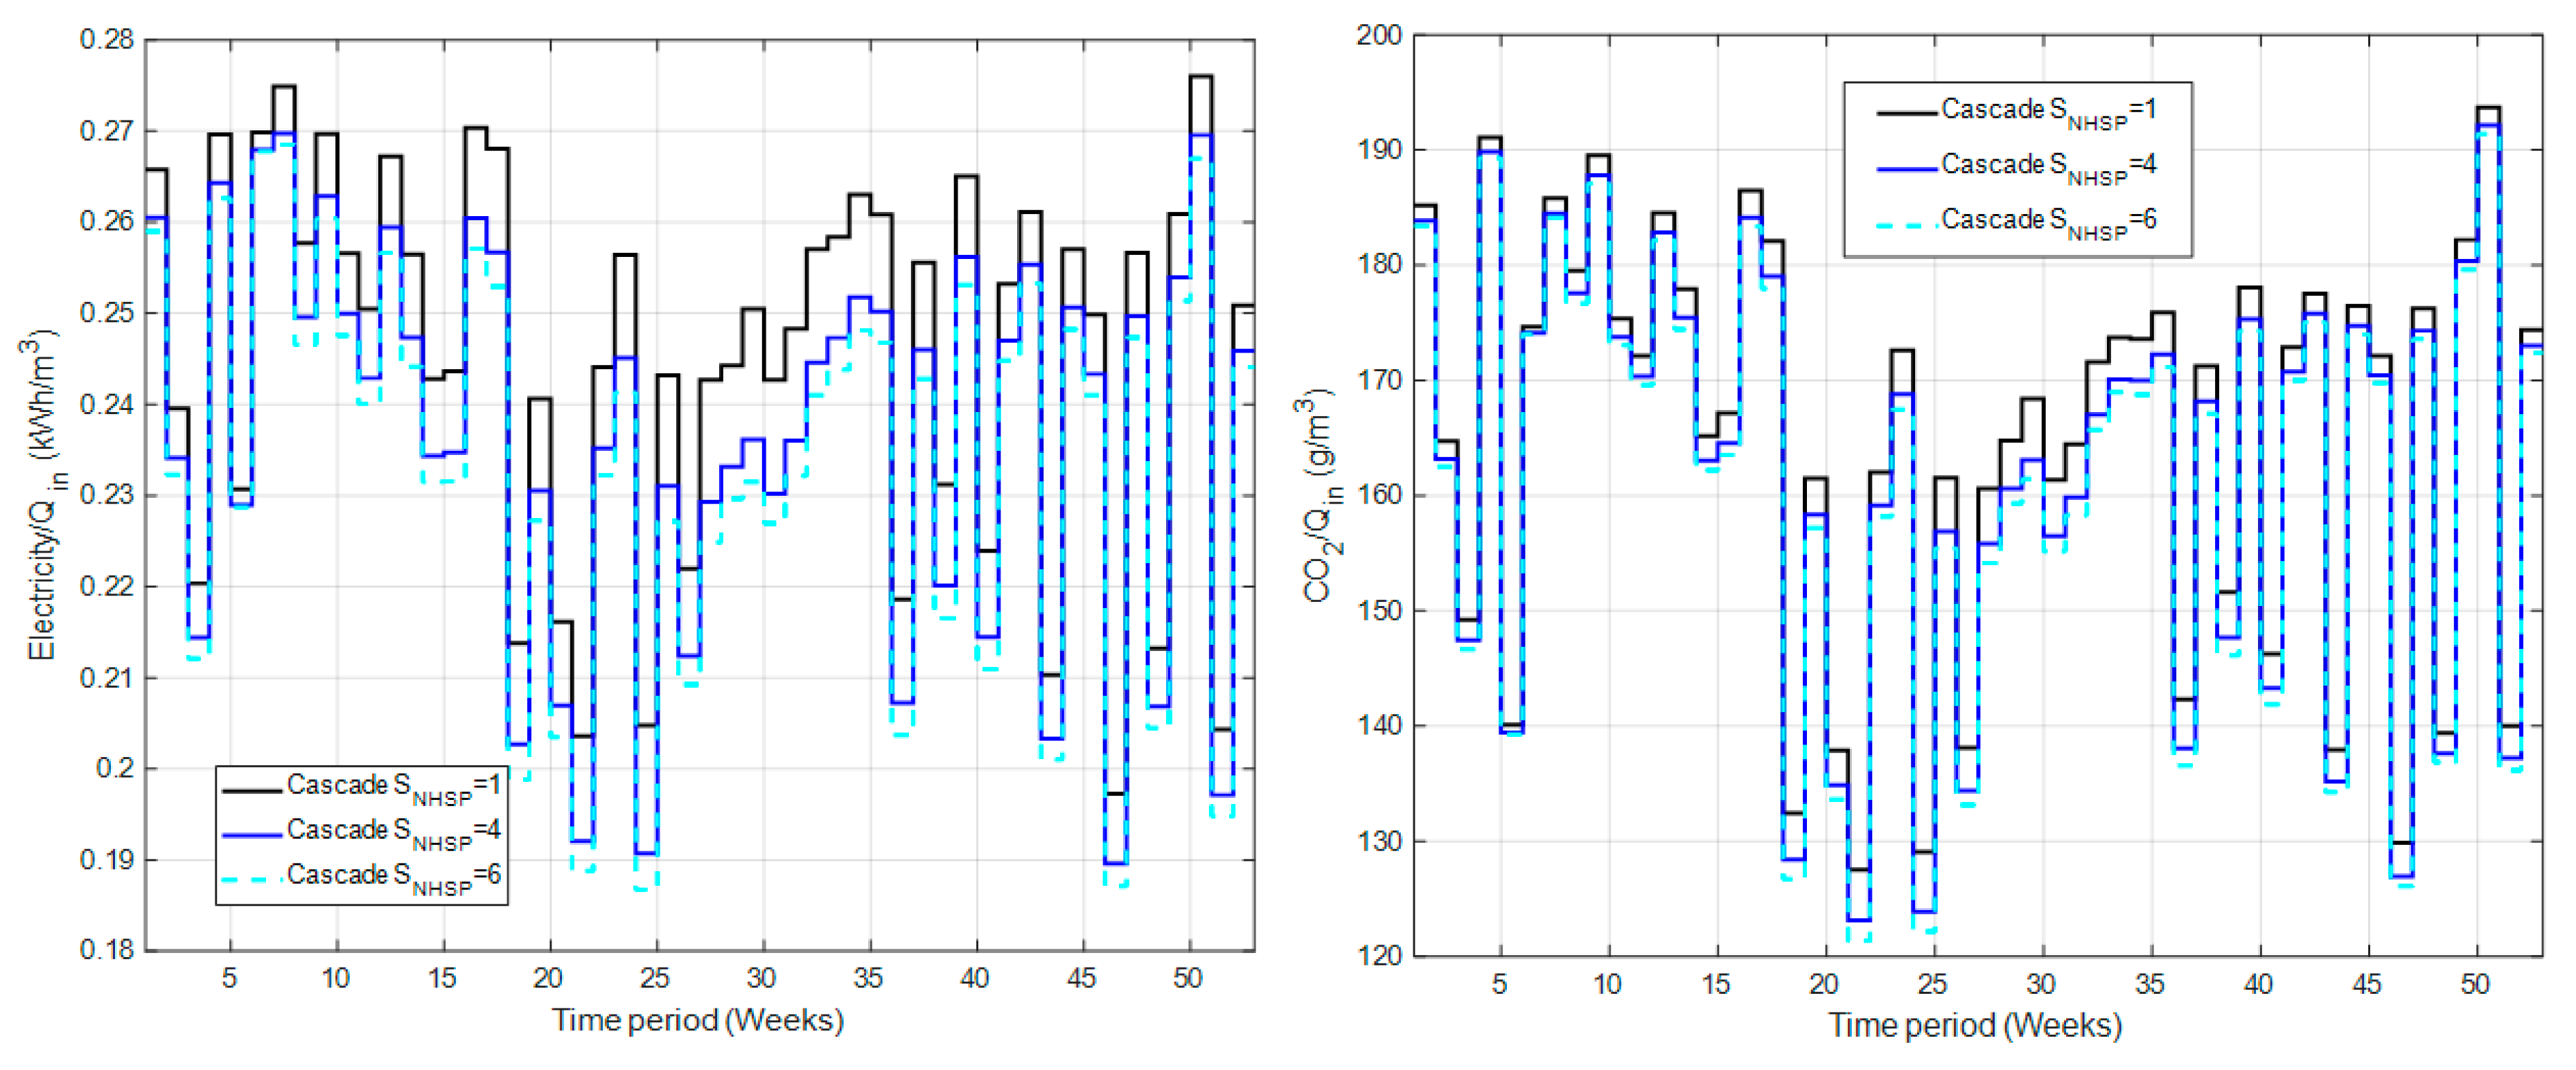
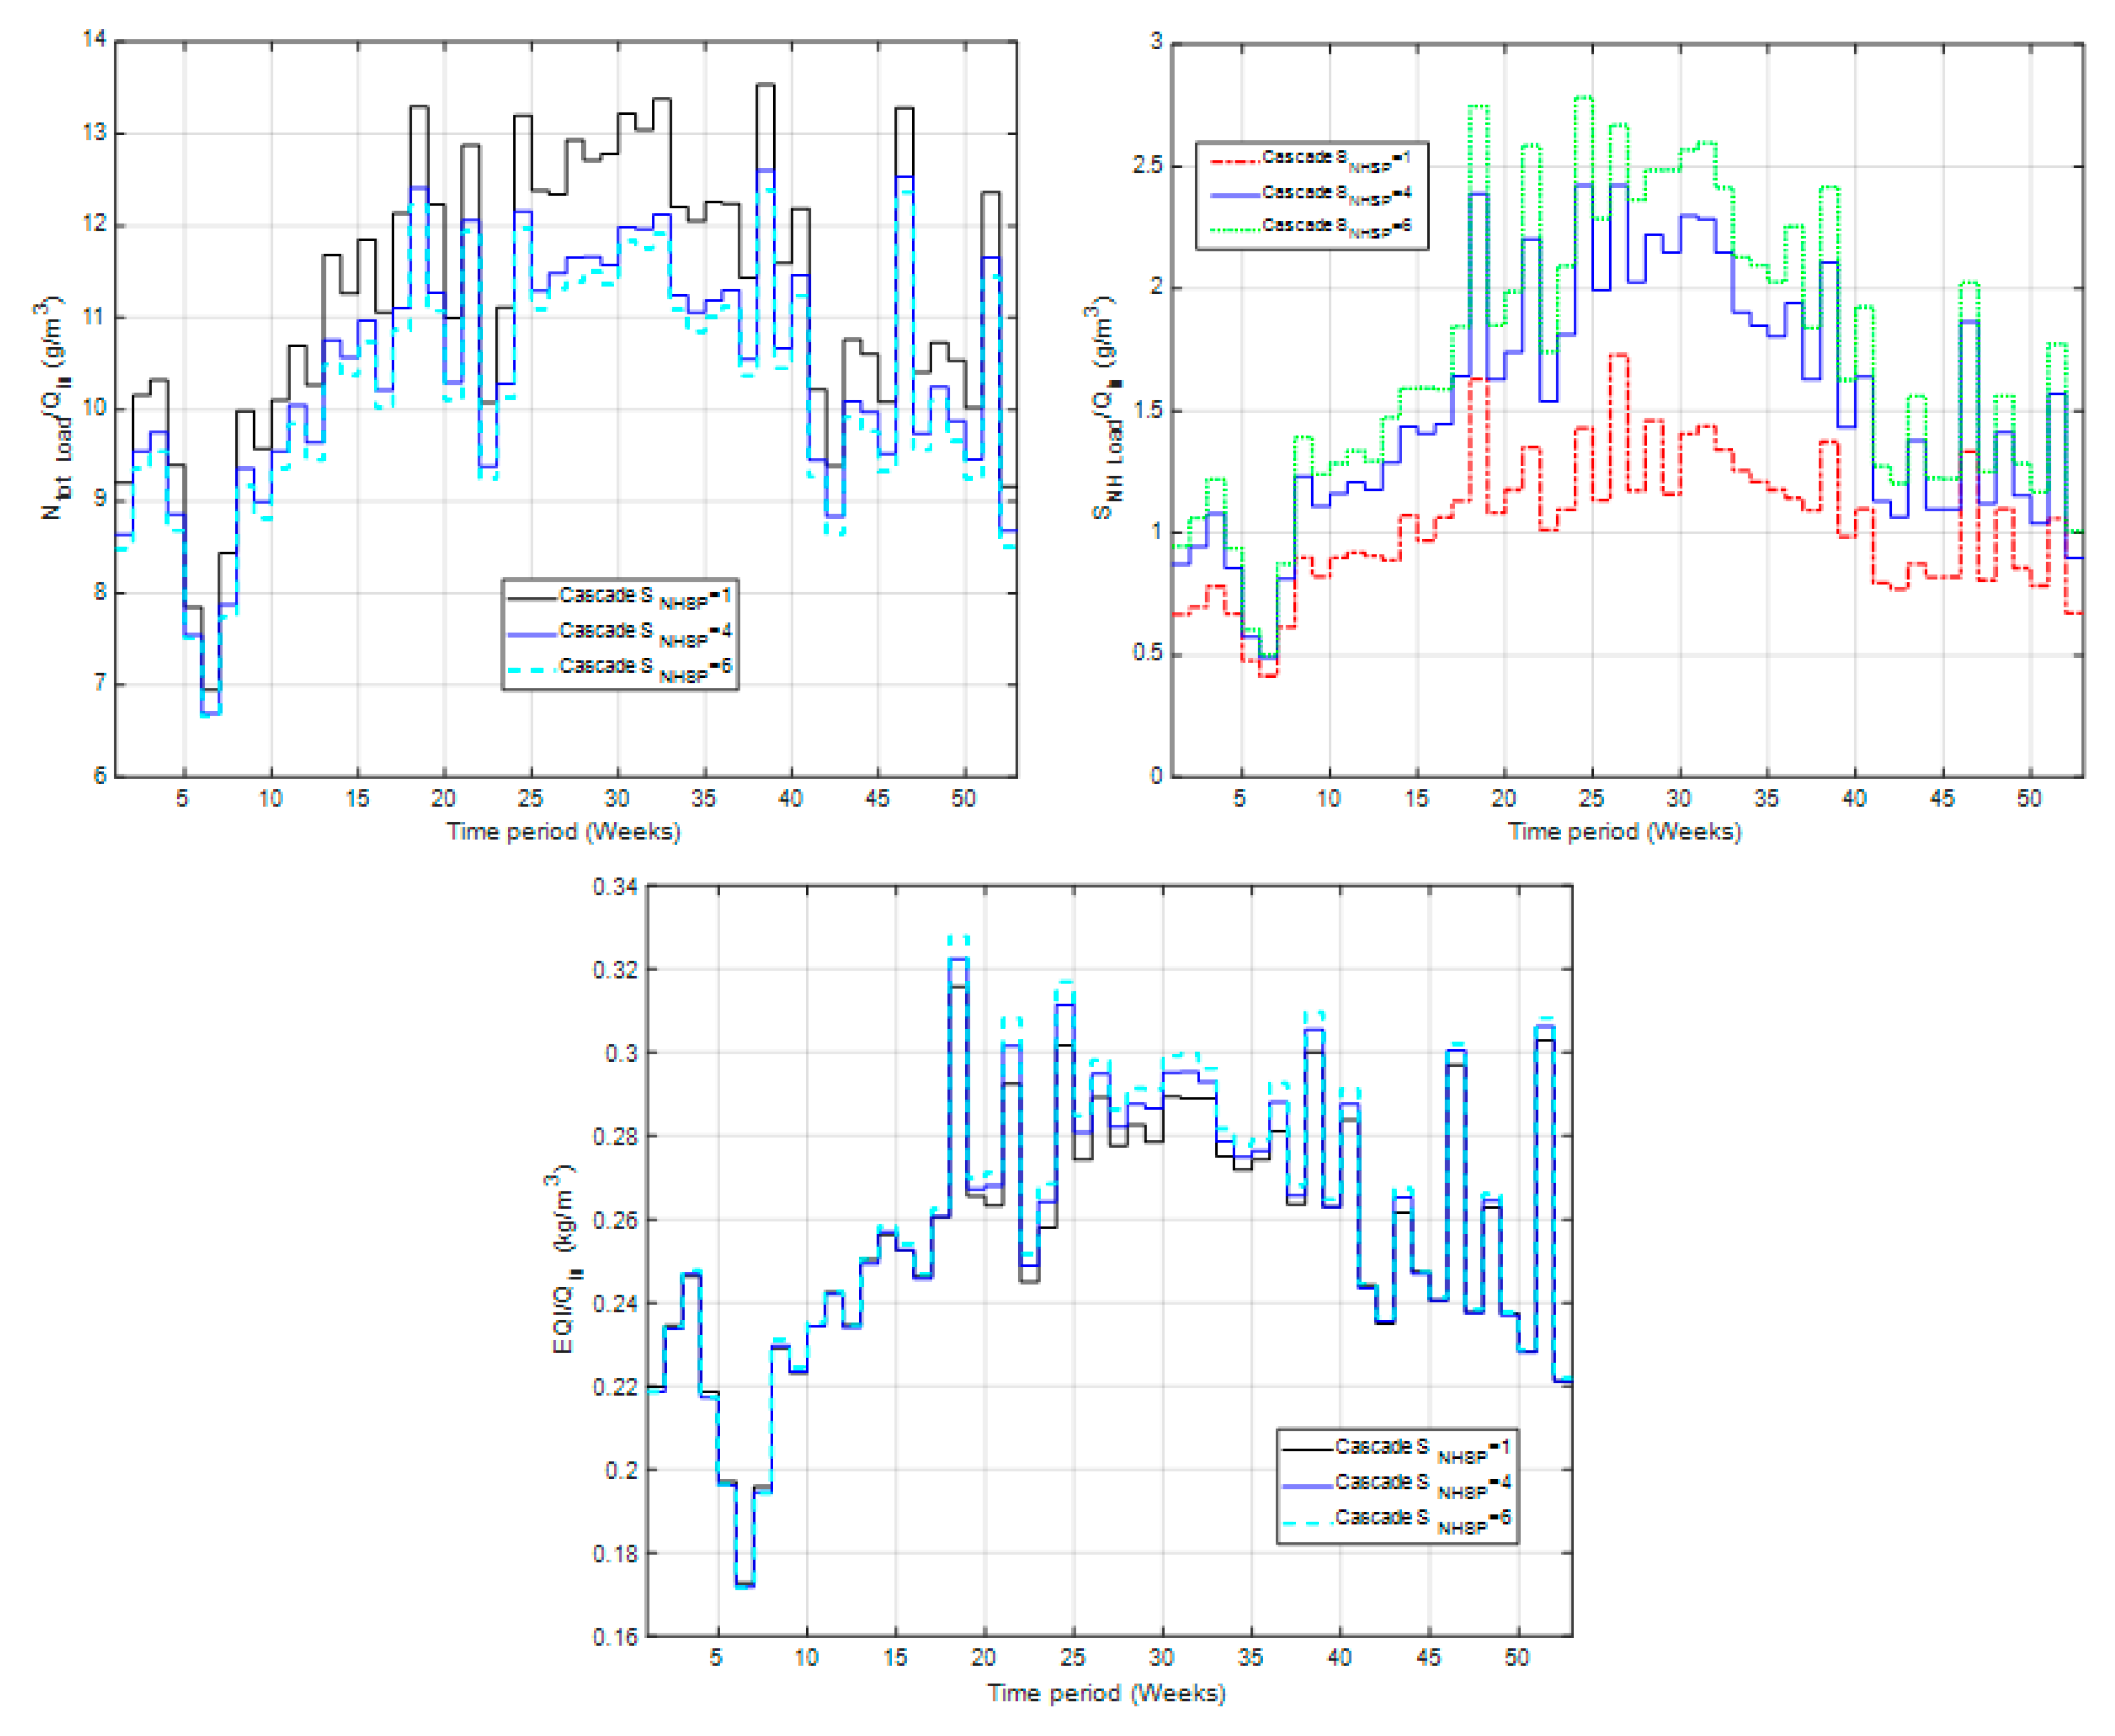
3.1.1. Different Set-Points for the Ammonium-Based Control Scheme (Cascade SNHSP)
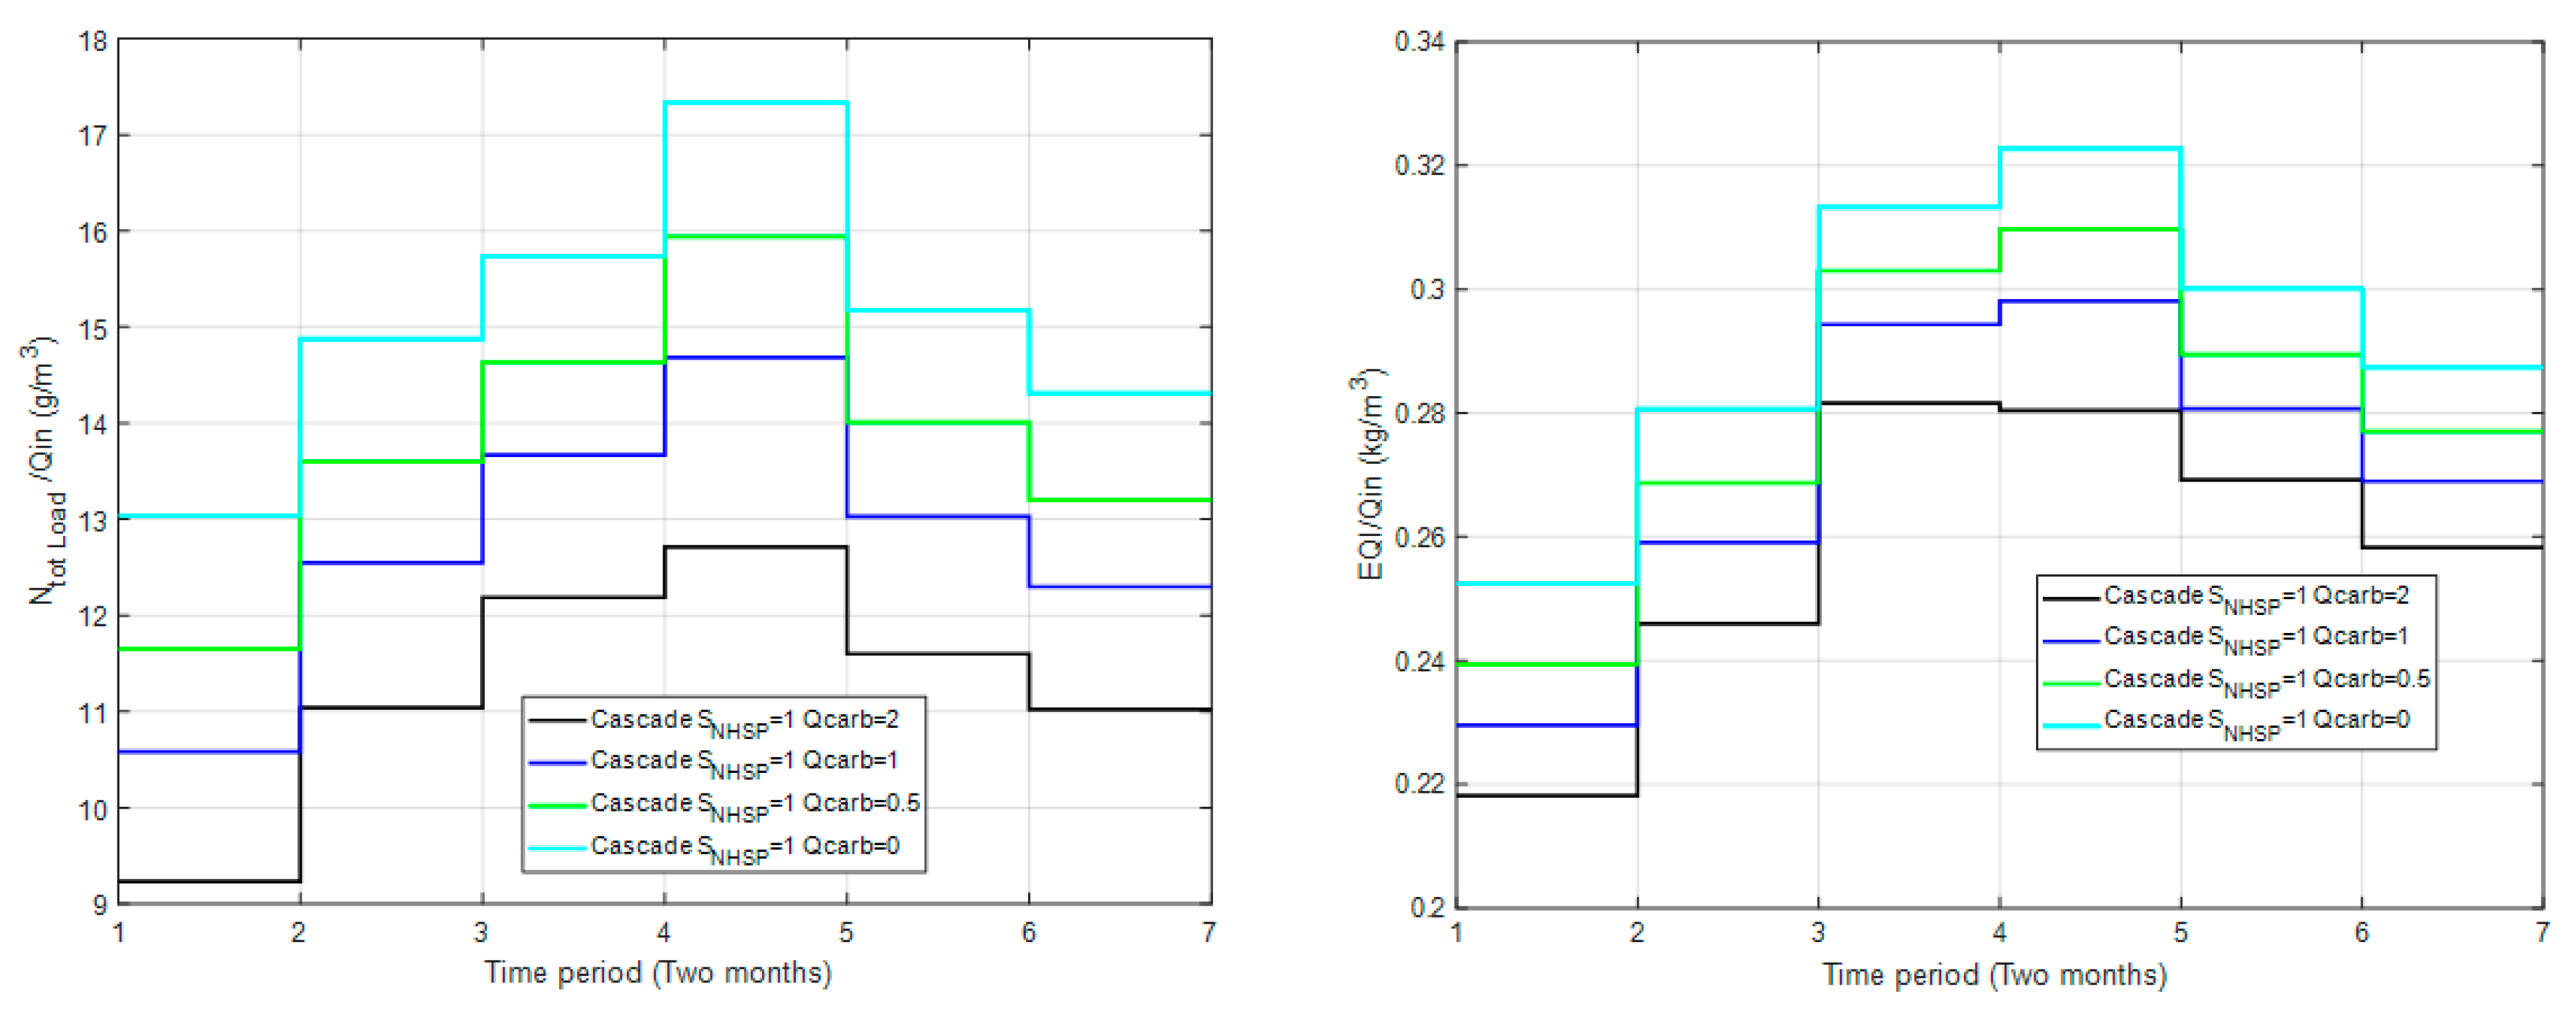
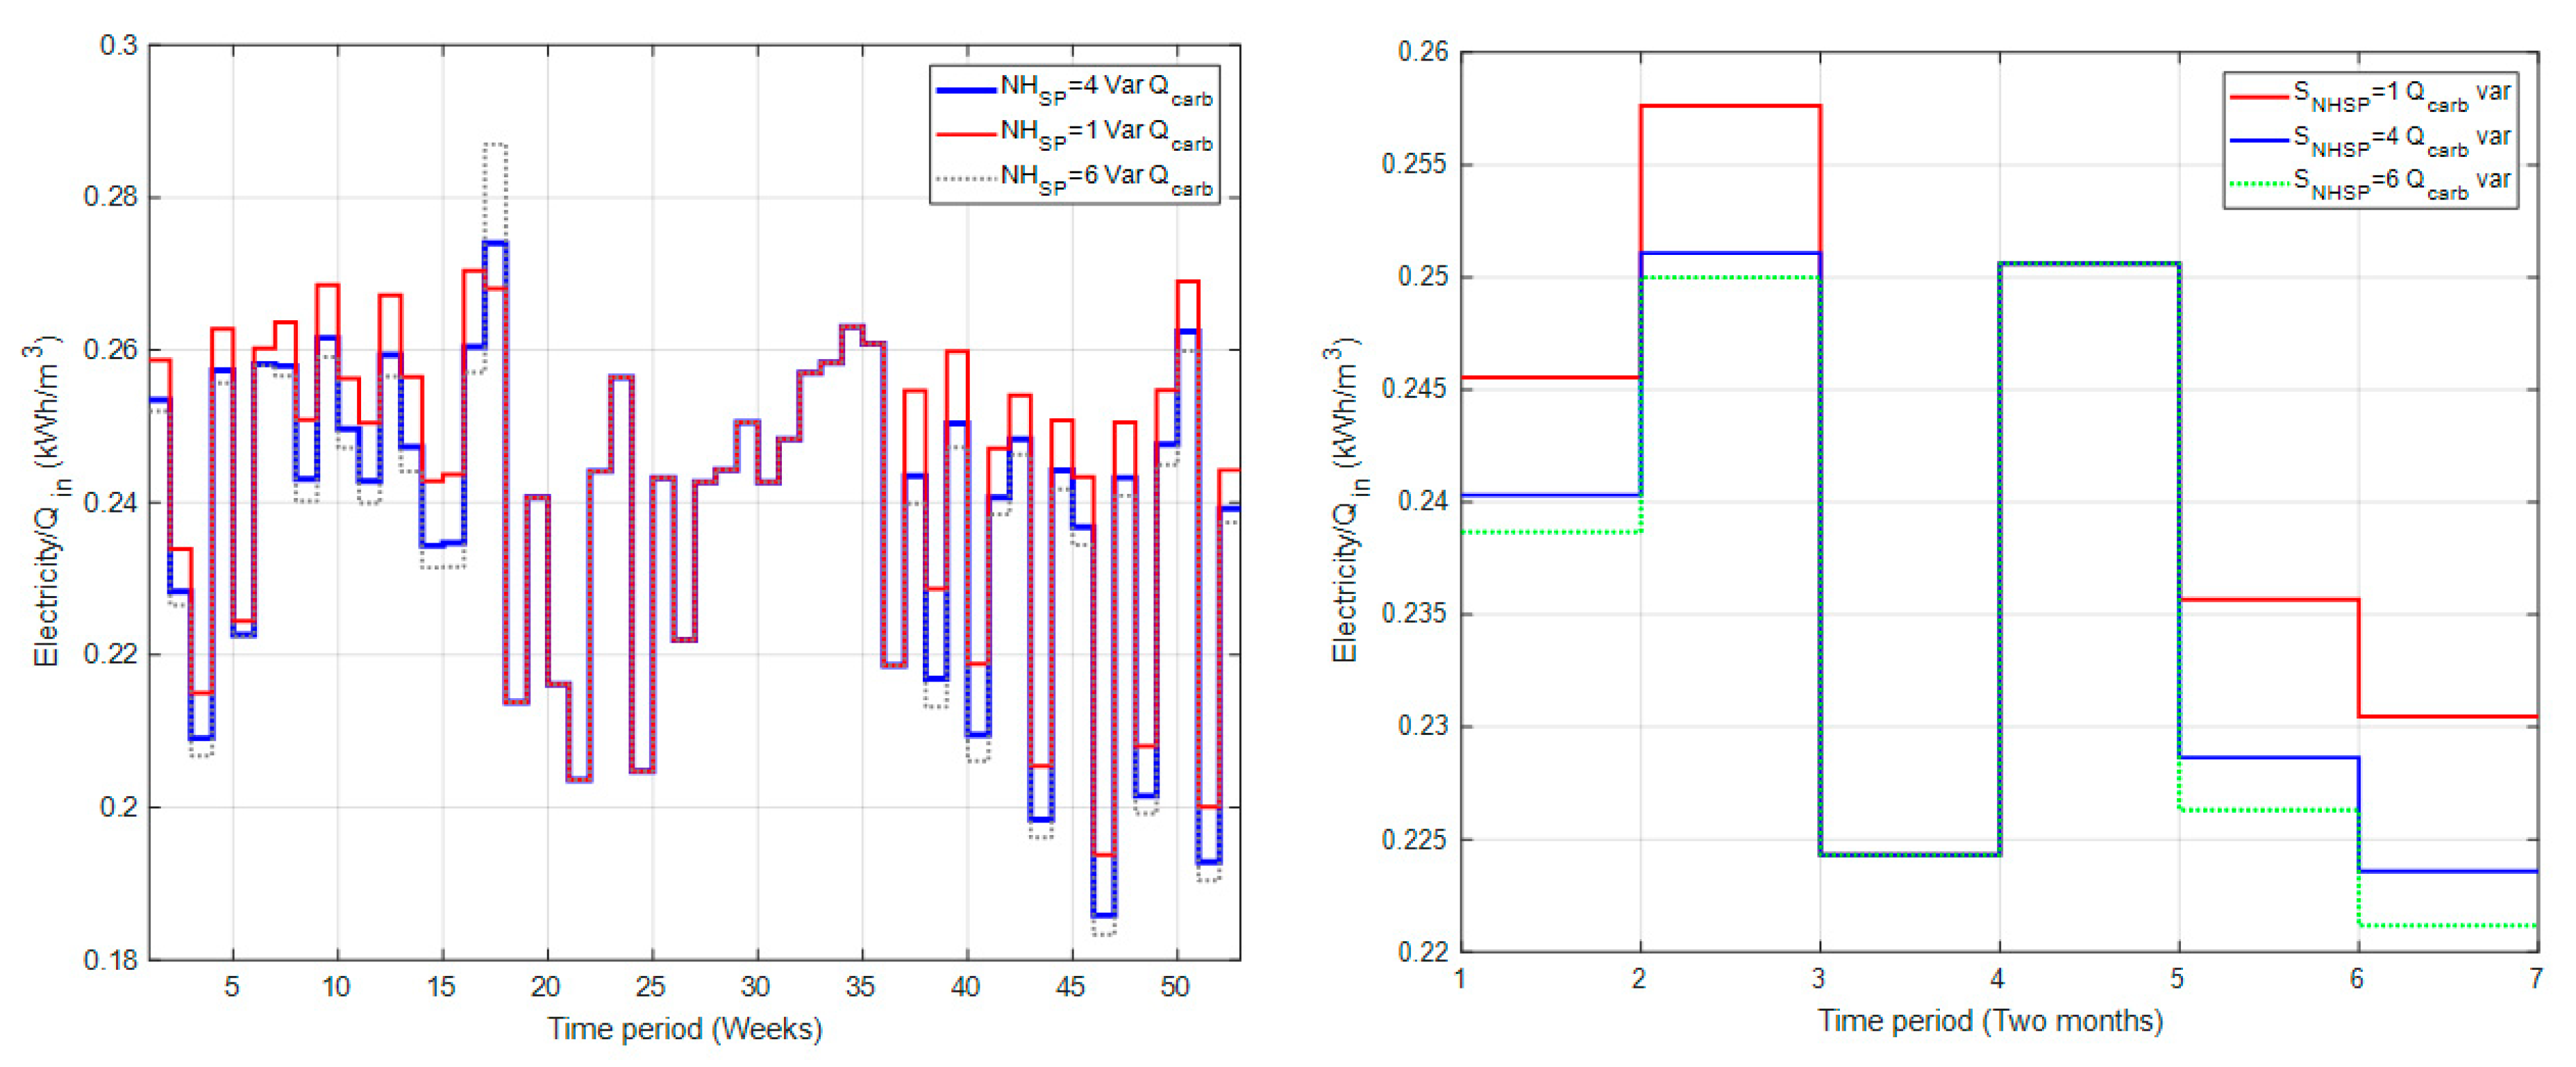
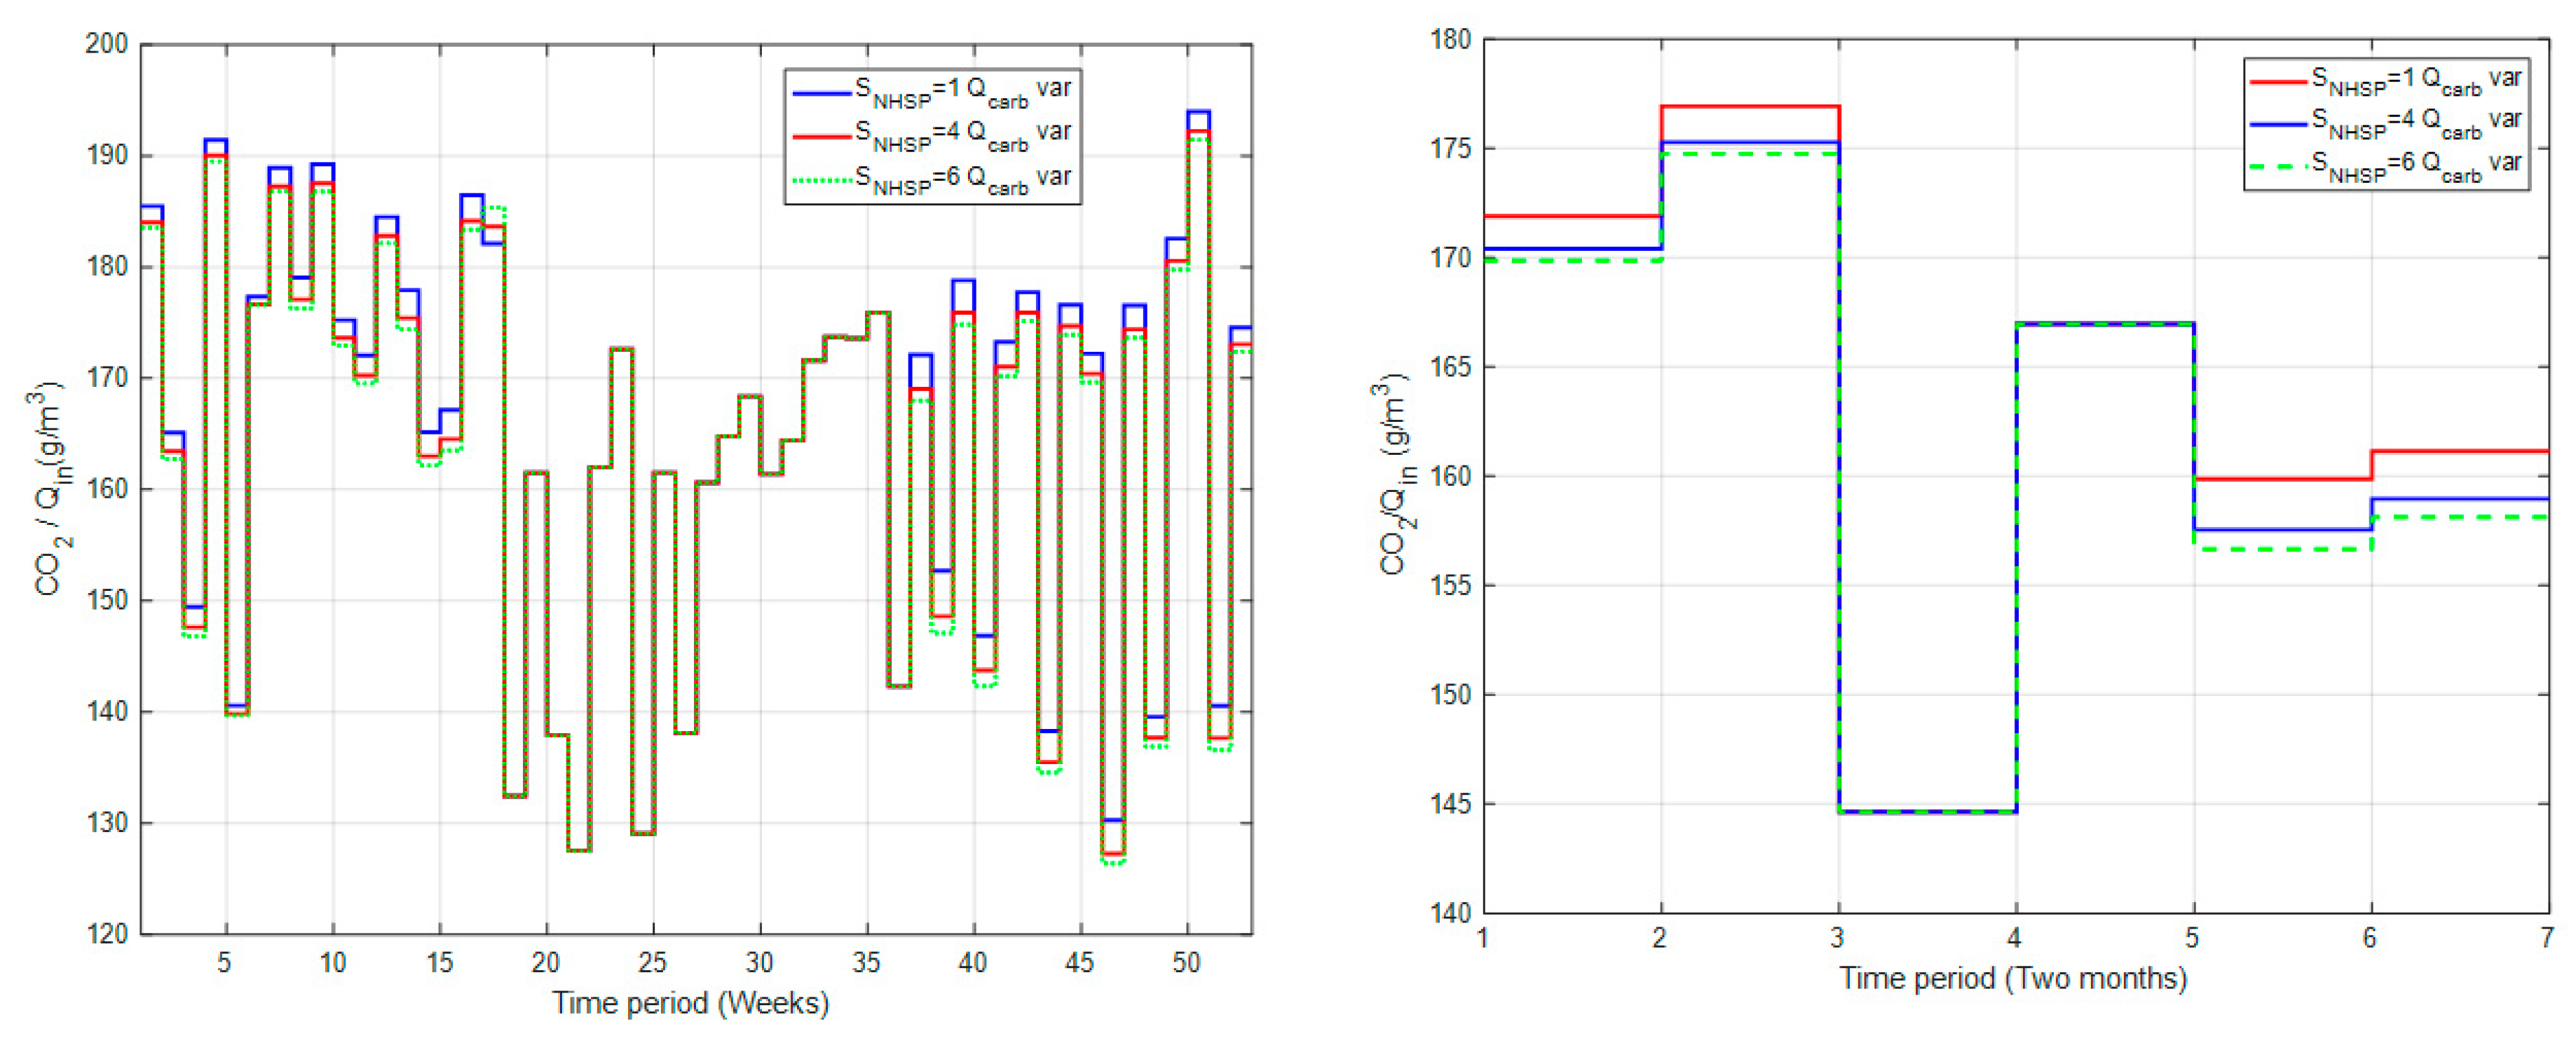
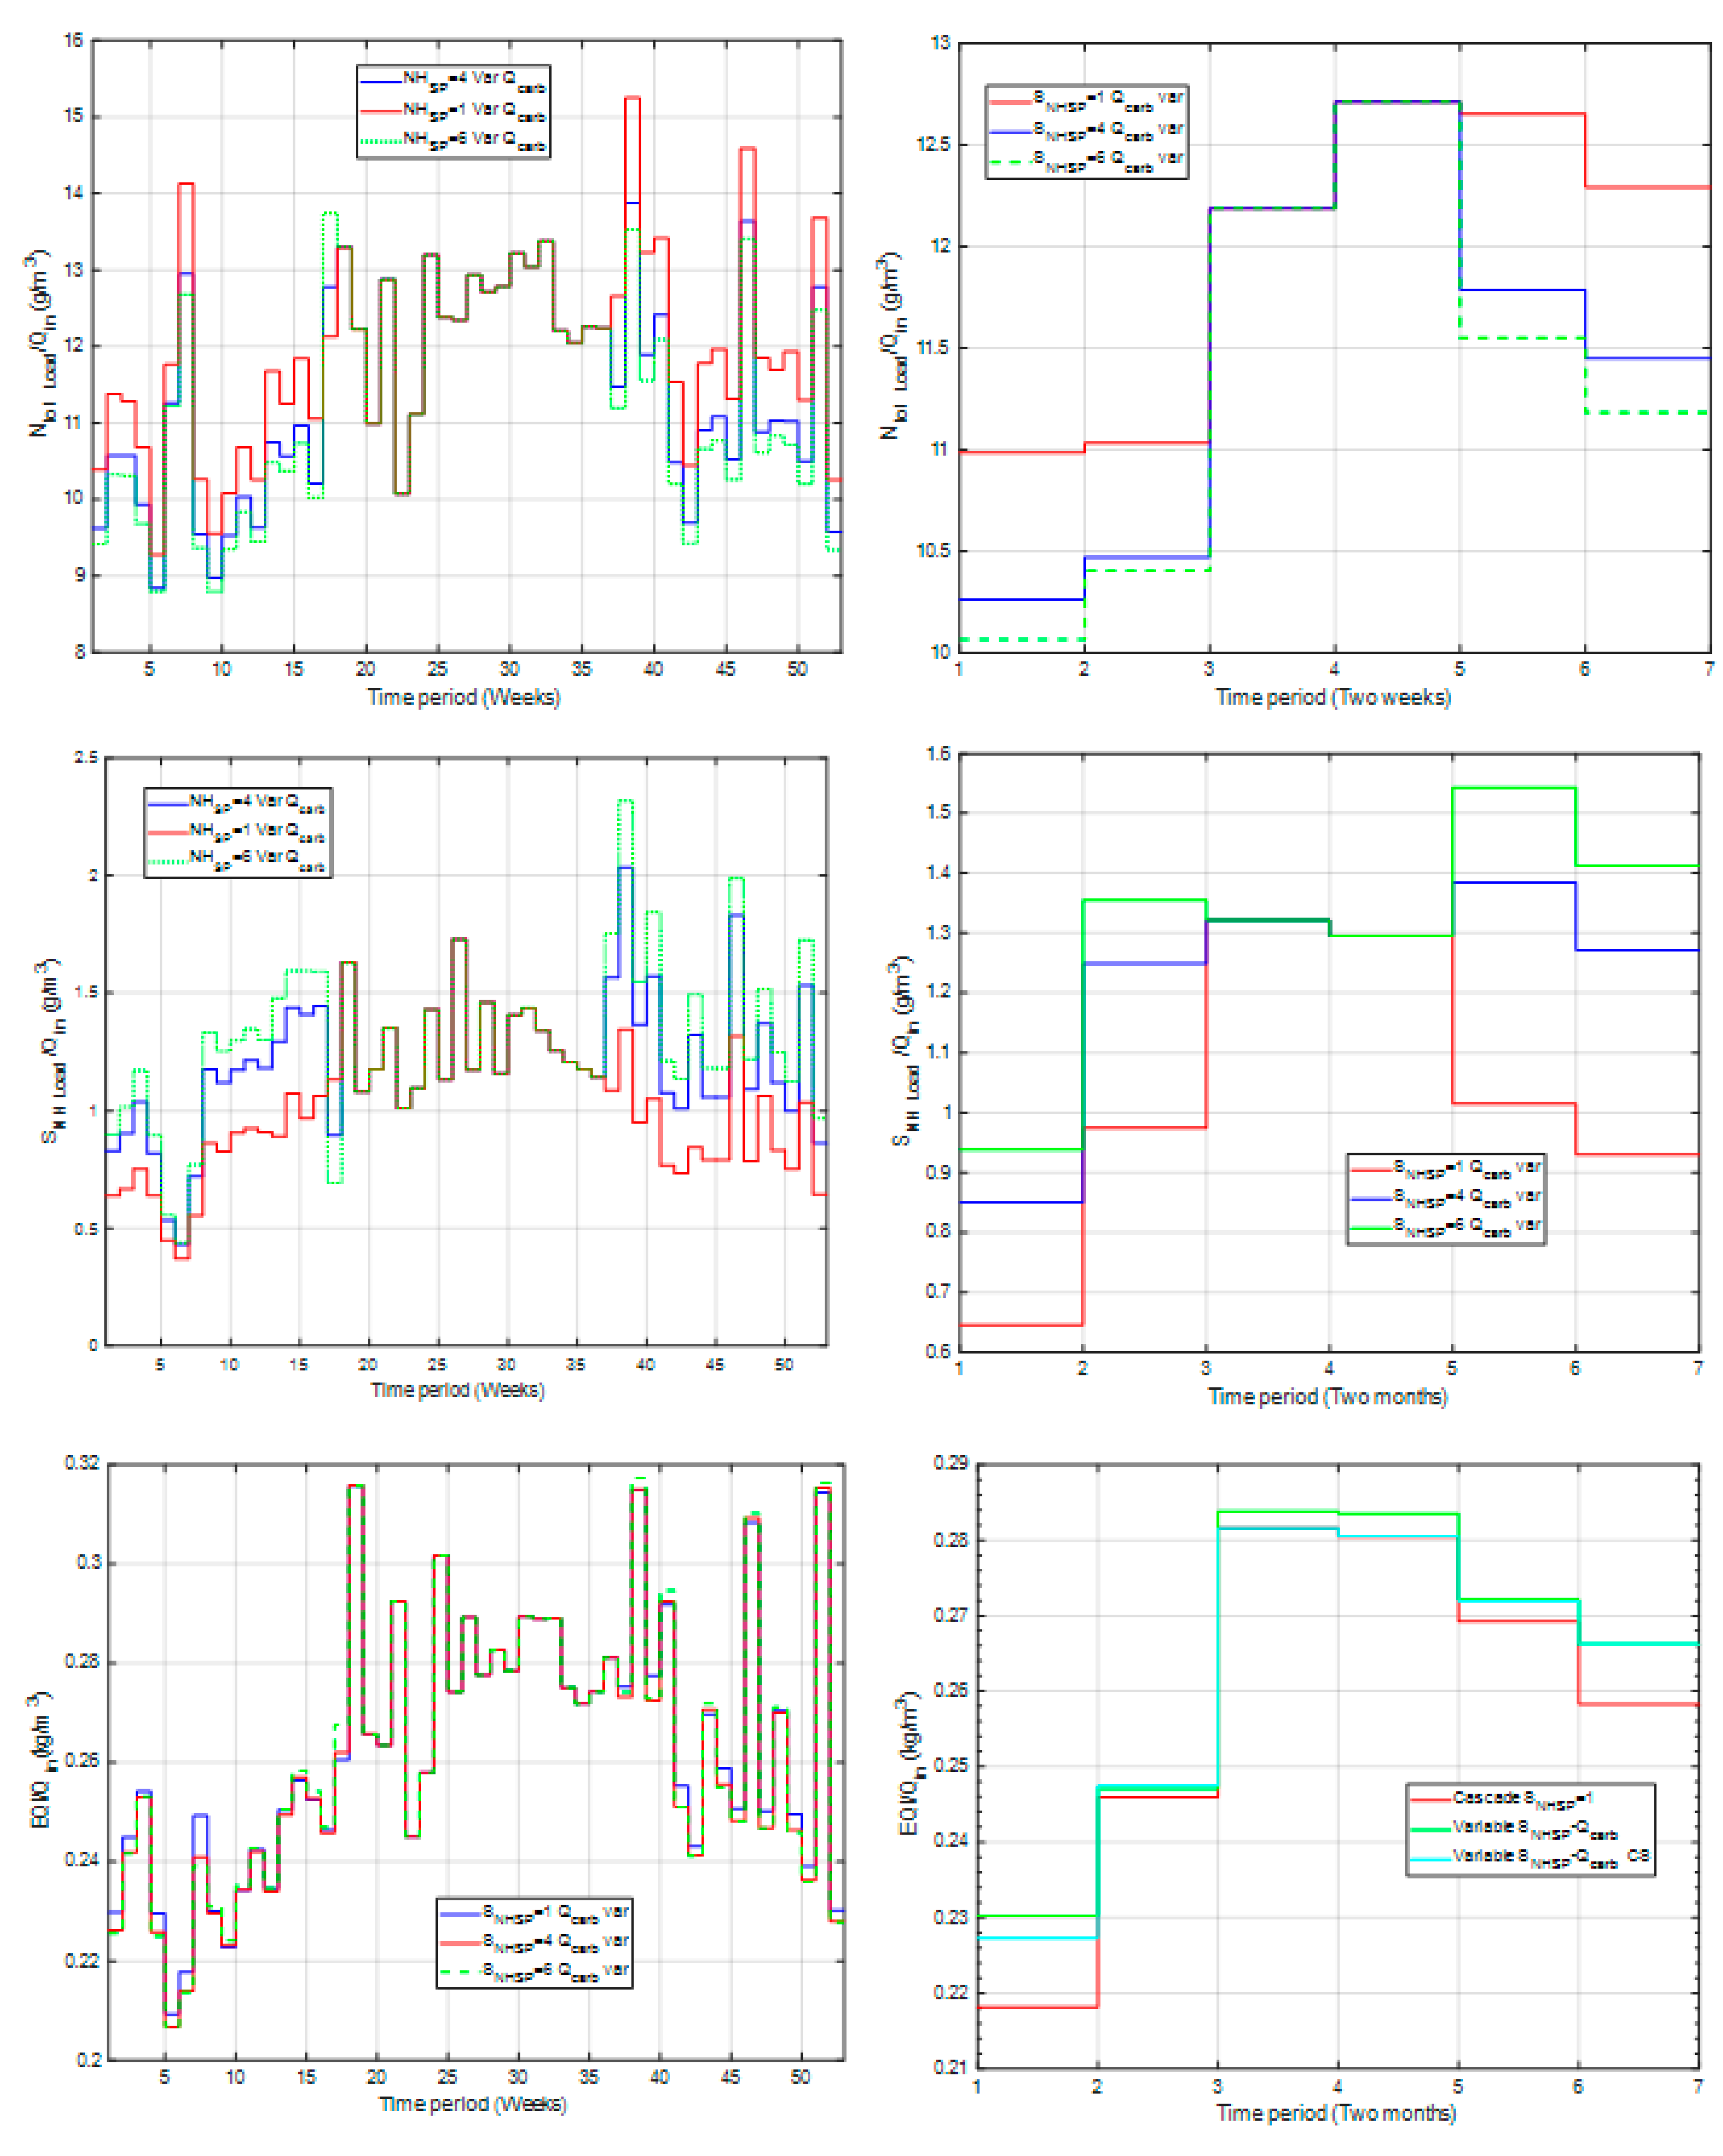
3.1.2. Effect of Variation of External Carbon Dosage (Qcarb) with the Ammonium-Based Control Scheme (Cascade SNHSP)
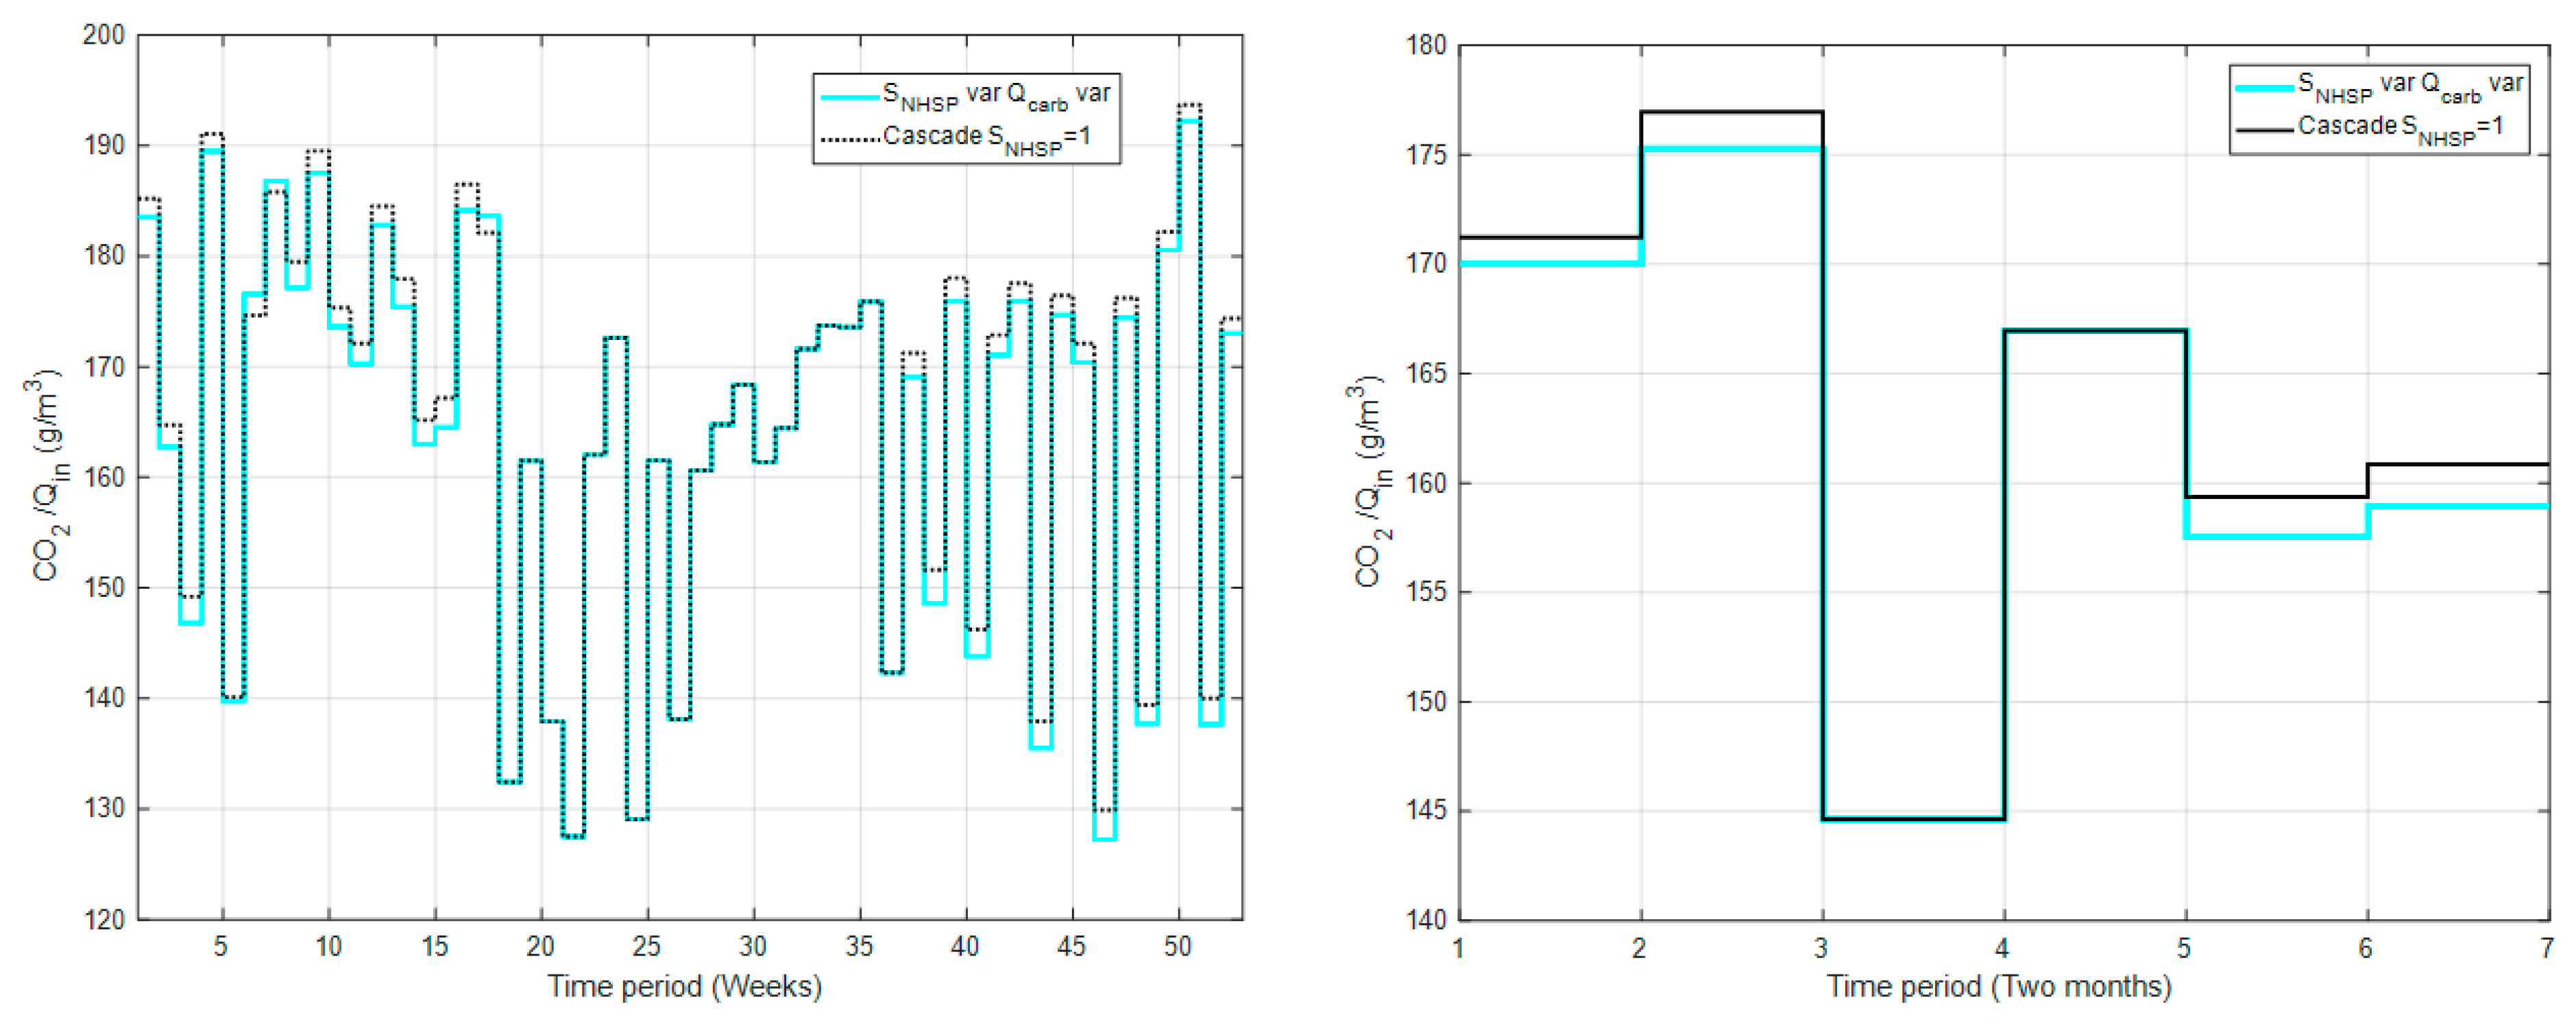
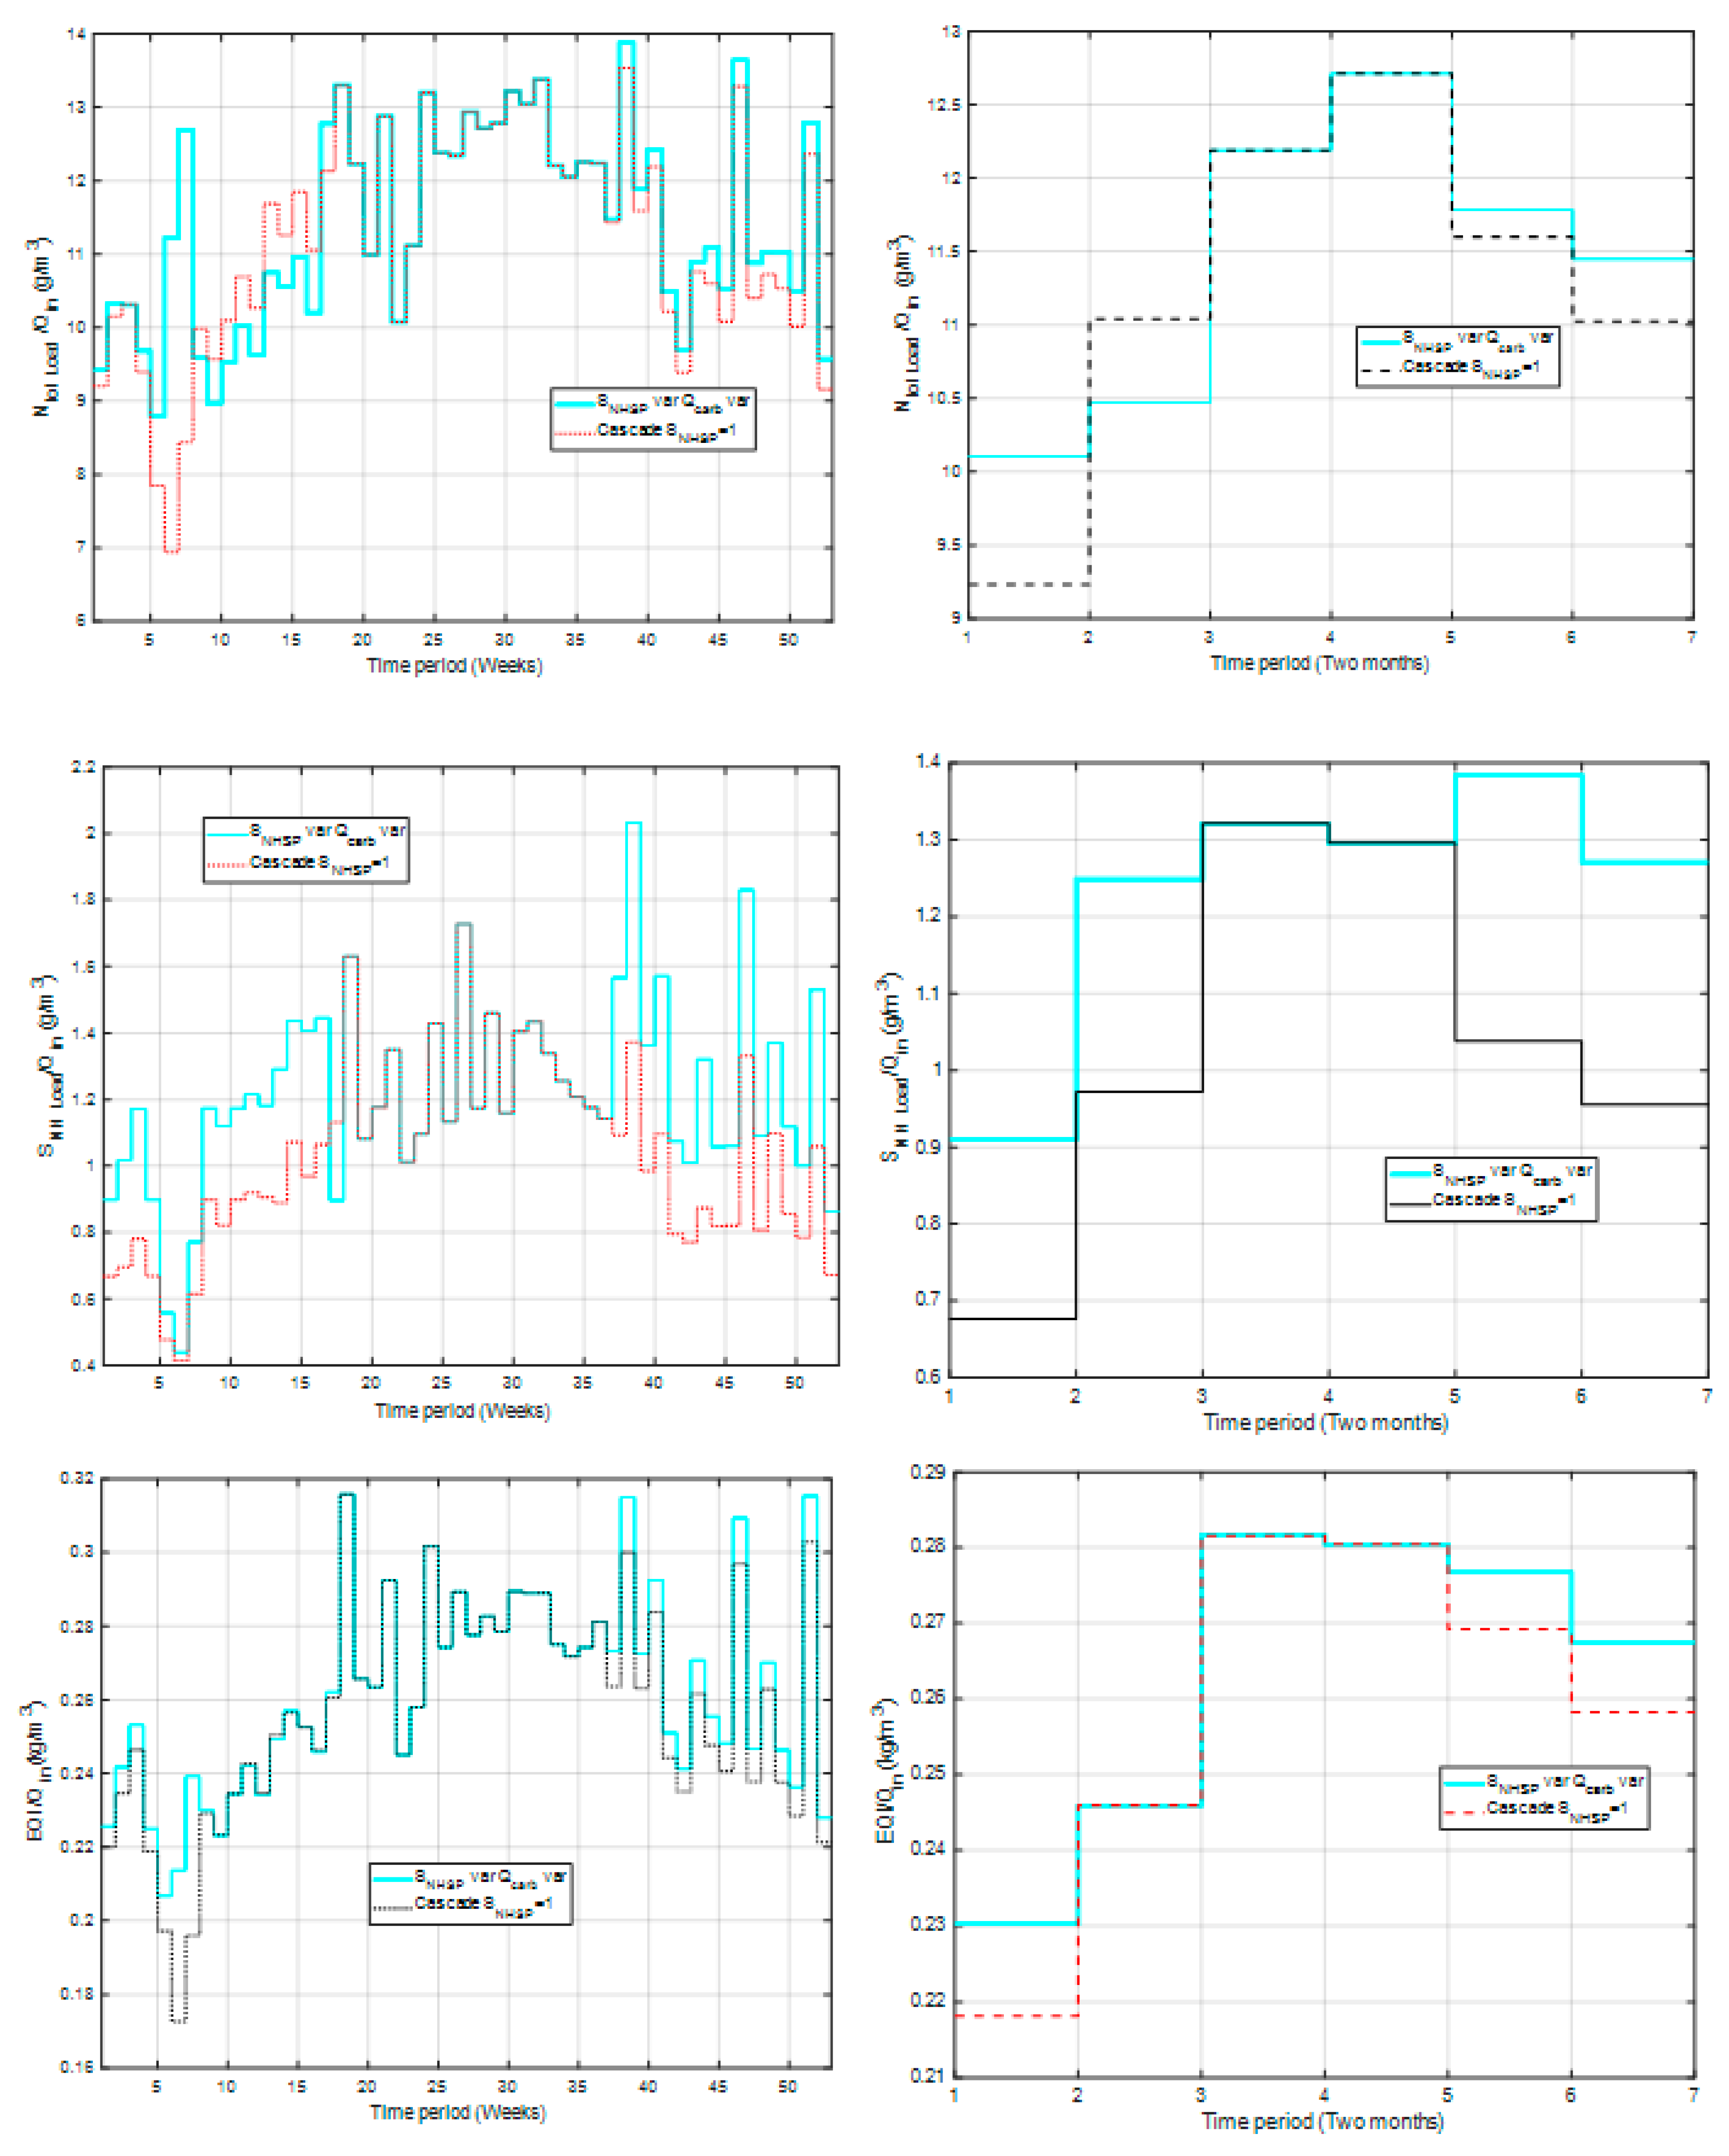
3.2. Selection of the Alternative Strategy for the Best Trade-off Solution
4. Conclusions
Author Contributions
Funding
Acknowledgments
Conflicts of Interest
Appendix A


| Environmental Indicators | Variable SNHSP = 1-Qcarb var | Variable SNHSP = 4-Qcarb var | Variable SNHSP = 6-Qcarb var | |
|---|---|---|---|---|
| Energy | Electricity (AE + PE + ME) (kW h/m3) | 0.240 | 0.236 | 0.235 |
| Heating energy (kW h/m3) | 0.204 | 0.204 | 0.204 | |
| Chemicals | External carbon (kg COD/m3) | 0.029 | 0.029 | 0.029 |
| Emissions to air | Biogas CH4 (g/m3) | 52.25 | 52.25 | 52.25 |
| CO2 (Digester) (g/m3) | 75.24 | 75.25 | 75.25 | |
| CO2 (ASP) (g/m3) | 87.80 | 86.54 | 86.08 | |
| Emissions to soil | Sludge for disposal (kg/m3) | 129.8 | 129.8 | 129.8 |
| Emissions to water | SNH effluent (g/m3) | 1.039 | 1.236 | 1.318 |
| Ntot effluent (g/m3) | 12.00 | 11.51 | 11.38 | |
| COD effluent (g/m3) | 48.91 | 48.93 | 48.94 | |
| EQI (kg/m3) | 0.260 | 0.265 | 0.265 | |
| Operating costs | OCI (EUR/d) | 0.400 | 0.400 | 0.400 |
References
- Gasperi, J.; Gromaire, M.C.; Kafi, M.; Moilleron, R.; Chebbo, G. Contributions of wastewater, runoff and sewer deposit erosion towet weather pollutant loads in combined sewer systems. Water Res. 2010, 44, 5875–5886. [Google Scholar] [CrossRef]
- Gasperi, J.; Zgheib, S.; Cladière, M.; Rocher, V.; Moilleron, R.; Chebbo, G. Priority pollutants in urban stormwaters: part 2–Case of combined sewers. Water Res. 2012, 46, 6693–6703. [Google Scholar] [CrossRef] [PubMed]
- Atinkpahoun, C.; Le, N.H.; Pontvianne, S.; Poirot, H.; Leclerc, J.P.; Pons, M.N.; Soclo, H.H. Population mobility and urban wastewater dynamics. Sci. Total Environ. 2018, 622, 1431–1437. [Google Scholar] [CrossRef] [PubMed]
- Borzooei, S.; Campo, G.; Cerutti, A.; Meucci, L.; Panepinto, D.; Ravina, M.; Riggio, V.; Ruffino, B.; Scibilia, G.; Zanetti, M. Optimization of the wastewater treatment plant: From energy saving to environmental impact mitigation. Sci. Total Environ. 2019, 691, 1182–1189. [Google Scholar] [CrossRef] [PubMed]
- Malinverni, F.; Genon, G. Development of a Practical Tool for the Assessment of Biological Performances in Wastewater Treatment Plants. Clean Soil Air Water 2016, 44, 1435–1443. [Google Scholar] [CrossRef]
- Borzooei, S.; Amerlinck YAbolfathic, S.; Panepintoa, D.; Nopens, I.; Lorenzi, E.; Meucci, L.; Zanettia, M. Data scarcity in modelling and simulation of a large-scale WWTP: Stop sign or a challenge. J. Water Process Eng. 2019, 28, 10–20. [Google Scholar] [CrossRef]
- Flores-Alsina, X.; Corominas, L.; Snip, L.; Vanrolleghem, P.A. Including greenhouse gas emissions during benchmarking of wastewater treatment plant control strategies. Water Res. 2011, 45, 4700–4710. [Google Scholar] [CrossRef]
- Meneses, M.; Concepción, H.; Vrecko, D.; Vilanova, R. Life Cycle Assessment as an environmental evaluation tool for control strategies in wastewater treatment plants. J. Clean. Prod. 2015, 107, 653–661. [Google Scholar] [CrossRef]
- Meneses, M.; Concepción, H.; Vilanova, R. Joint Environmental and Economical Analysis of Wastewater Treatment Plants Control Strategies: A Benchmark Scenario Analysis. Sustainability 2016, 8, 360. [Google Scholar] [CrossRef]
- Barbu, M.; Vilanova, R.; Meneses, M.; Santin, I. On the evaluation of the global impact of control strategies applied to wastewater treatment plants. J. Clean. Prod. 2017, 149, 396–405. [Google Scholar] [CrossRef]
- Revollar, S.; Vilanova, R.; Vega, P.; Francisco, M.; Meneses, M. Wastewater Treatment Plant Operation: Simple Control Schemes with a Holistic Perspective. Sustainability 2020, 12, 768. [Google Scholar] [CrossRef]
- Shimako, A. Contribution to the development of a dynamic Life Cycle Assessment method. Ph.D Thesis, INSA de Toulouse, Toulouse, French, 2017. [Google Scholar]
- Sánchez, F.; Rey, H.; Viedma, A.; Nicolás-Pérez, F.; Kaiser, A.S.; Martínez, M. CFD simulation of fluid dynamic and biokinetic processes within activated sludge reactors under intermittent aeration regime. Water Res. 2018, 139. [Google Scholar] [CrossRef] [PubMed]
- Gernaey, K.; Flores Alsina, X.; Rosen, C.; Benedetti, L.; Jeppsson, U. Dynamic influent pollutant disturbance scenario generation using a phenomenological modelling approach. Environ. Model. Softw. 2011, 26, 1255–1267. [Google Scholar] [CrossRef]
- Fearnside, P.M. Why a 100-year time horizon should be used for global warming mitigation calculations. Mit. Adapt. Strat. Glob. Chang. 2002, 7, 19–30. [Google Scholar] [CrossRef]
- Gernaey, K.; Jeppsson, U.; Vanrolleghem, P.; Copp, J.; Steyer, J. Benchmarking of Control Strategies for Wastewater Treatment Plants; IWA Publishing: Colchester, UK, 2010. [Google Scholar]
- Rieger, L.; Gillot, S.; Langergraber, G.; Ohtsuki, T.; Shaw, A.; Takács, I.; Winkler, S. Guidelines for Using Activated Sludge Models; IWA Scientific and Technical Report No. 22; IWA Publishing: London, UK, 2012. [Google Scholar]
- Jeppsson, U.; Pons, M.N.; Nopens, I.; Alex, J.; Copp, J.B.; Gernaey, K.V.; Rosen, C.; Steyer, J.P.; Vanrolleghem, P.A. Benchmark simulation model no 2: general protocol and exploratory case studies. Water Sci. Technol. 2007, 56, 67–78. [Google Scholar] [CrossRef] [PubMed]
- Alex, J.; Benedetti, L.; Copp, J.; Gernaey, K.; Jeppsson, U.; Nopens, I.; Pons, M.; Rosen, C.; Steyer, J.; Vanrolleghem, P.A. Benchmark Simulation Model No. 2 (BSM2), Technical Report No 3. IWA Taskgroup on Benchmarking of Control Strategies for WWTPs; IWA publishing: London, UK, 2018. [Google Scholar]
- Alex, J.; Benedetti, L.; Copp, J.; Gernaey, K.; Jeppsson, U.; Nopens, I.; Pons, M.; Rieger, L.; Rosen, C.; Steyer, J.; et al. Benchmark Simulation Model no. 1 (BSM1). In IWA Taskgroup on Benchmarking of Control Strategies for WWTPs. Dpt. of Industrial Electrical Engineering and Automation; LUTEDX-TEIE 7229; Lund University Cod.: Lund, Sweden, 2008; pp. 1–62. [Google Scholar]
- Henze, M.; Grady , C.P.L., Jr.; Gujer, W.; Marais, G.V.R.; Matsuo, T. Activated Sludge Model n 1; IAWQ Scientific and Technical Report n 1; IAWQ: London, UK, 1987. [Google Scholar]
- Takács, I.; Patry, G.G.; Nolasco, D. A dynamic model of the clarification thickening process. Water Res. 1991, 25, 1263–1271. [Google Scholar] [CrossRef]
- Batstone, D.J.; Keller, J.; Angelidaki, I.; Kalyuzhnyi, S.V.; Pavlostathis, S.G.; Rozzi, A.; Sanders, W.T.M.; Siegrist, H.; Vavilin, V.A. Anaerobic Digestion Model No. 1; IWA STR No. 13; IWA Publishing: London, UK, 2002. [Google Scholar]
- Olsson, G. ICA and me a subjective review. Water Res. 2012, 46, 1585–1624. [Google Scholar] [CrossRef] [PubMed]
- Åmand, L.; Olsson, G.; Carlsson, B. Aeration control—A review. Water Sci. Technol. 2013, 67, 2374–2398. [Google Scholar] [CrossRef]
- Takács, I.; Vanrolleghem, P. Elemental Balances in Activated Sludge Modelling; IWA Publishing: London, UK, 2006. [Google Scholar]
- Levasseur, A.; Lesage, P.; Margni, M.; Deschênes, L.; Samso, R. Considering Time in LCA: Dynamic LCA and Its Application to Global Warming Impact Assessments. Environ. Sci. Technol. 2010, 44, 3169–3174. [Google Scholar] [CrossRef]
- Panepinto, D.; Fiore, S.; Zappone, M.; Genon, G.; Meucci, L. Evaluation of the energy efficiency of a large wastewater treatment plant in Italy. Appl. Energy 2016, 161, 404–411. [Google Scholar] [CrossRef]
- Nguyen, H.; Safder, U.; Nguyen, X.; ChangKyoo, Y. Multi-objective decision-making and optimal sizing of a hybrid renewable energy system to meet the dynamic energy demands of a wastewater treatment plant. Energy 2019, 2019, 116570. [Google Scholar] [CrossRef]


| Common Conditions | Possible Control Schemes | ||
|---|---|---|---|
| Control Scheme | Short Denomination | Variables | |
| Qcarb = 2 m3/d Qr = 20648 m3/d Qa = 61944 m3/d In warm season, bimesters 1, 2 and 6: Qw = 450 m3/d In cold season bimesters 3–5: Qw = 300 m3/d | DO control scheme | DO Default | SO4SP = 2 g/m3 Kp = 25, Ti = 0.002, Tt = 0.001 |
| DO control scheme in the aerobic zone combined with nitrates control in the anoxic zone | DO + NO control | SO4SP = 2 g/m3 Kp = 25, Ti = 0.002, Tt = 0.001 | |
| SNO2SP = 1 g/m3 Kp = 1000, Ti = 0.025, Tt = 0.015 | |||
| Ammonium-based control scheme | Cascade SNHSP | SNHSP = 1 g/m3 Kp = −1, Ti = 1, Tt = 0.2 | |
| Effluent quality objectives | |||
| Total nitrogen (Ntote) | <18 gN/m3 | ||
| Ammonium concentration (SNHe) | <4 gN/m3 | ||
| Chemical oxygen demand (CODe) | <100 gCOD/m3 | ||
| Variable | Average | Maximum | Minimum | W. Av. max. | W. Av. min. | Bi-m. Av. max. | Bi-m. Av. min. |
|---|---|---|---|---|---|---|---|
| T (ºC) | 15 | 20.5 | 9.5 | 20 | 10 | 19.8 | 10.2 |
| Qin (m3/d) | 20,668 | 85,841 | 5146 | 27,800 | 13,800 | 23,200 | 18,000 |
| Ntoti (g/m3) | 55.2 | 114.2 | 7.7 | 65.5 | 44 | 59.6 | 50 |
| COD influent (g/m3) | 592.2 | 1213.0 | 36.5 | 695 | 454 | 615 | 540 |
| Environmental Indicators | DO Default | DO + NO Control | Cascade SNHSP | |
|---|---|---|---|---|
| Energy | Electricity (AE + PE + ME) (kW h/m3) | 0.263 | 0.263 | 0.243 |
| Heating energy (kW h/m3) | 0.204 | 0.204 | 0.204 | |
| Chemicals | External carbon (kg COD/m3) | 0.039 | 0.039 | 0.039 |
| Emissions to air | Biogas CH4 (g/m3) | 52.51 | 52.51 | 52.53 |
| CO2 (Digester) (g/m3) | 75.61 | 75.60 | 75.63 | |
| CO2 (ASP) (g/m3) | 91.52 | 95.52 | 87.20 | |
| Emissions to soil | Sludge for disposal (kg/m3) | 131.1 | 132.0 | 131.0 |
| Emissions to water | SNH effluent (g/m3) | 0.474 | 0.312 | 1.052 |
| Ntot effluent (g/m3) | 13.53 | 17.56 | 11.34 | |
| COD effluent (g/m3) | 48.99 | 49.01 | 49.07 | |
| EQI (kg/m3) | 0.270 | 0.307 | 0.260 | |
| Operation costs | OCI (EUR/m3) | 0.457 | 0.457 | 0.437 |
| Environmental Indicators | DO + NO Control | Cascade SNHSP = 1 | |
|---|---|---|---|
| Energy | Electricity (AE + PE + ME) (kW h/m3) | - | −7.6% |
| Emissions to air | CO2 (ASP) (g/m3) | +4.3% | −4.7% |
| Emissions to water | SNH effluent (g/m3) | −34.2% | +121% |
| Ntot effluent (g/m3) | +22.9% | −16.2% | |
| EQI (kg/m3) | +37.03% | −3.7% | |
| Operation costs | OCI (EUR/m3) | - | −4.4% |
| Environmental Indicators | Annual Average | W. Av. max. | W. Av. min. | Bi-m. Av. max. | Bi-m. Av. min. |
|---|---|---|---|---|---|
| Electricity (AE + PE + ME) (kW h/m3) | 0.263 | 0.315 | 0.204 | 0.288 | 0.224 |
| Heating energy (kW h/m3) | 0.204 | 0254 | 0.150 | 0.252 | 0.155 |
| Biogas CH4 (g/m3) | 52.51 | 63 | 40 | 57.5 | 46.5 |
| CO2 (Total) (g/m3) | 167.1 | 200.0 | 130.0 | 182.0 | 148.0 |
| Sludge for disposal (kg/m3) | 131.1 | 148.0 | 108.0 | 140.5 | 118.5 |
| SNH effluent (g/m3) | 0.474 | 1.150 | 0.100 | 0.800 | 0.180 |
| Ntot effluent (g/m3) | 13.53 | 15.20 | 11.80 | 14.00 | 12.80 |
| EQI (kg/m3) | 0.270 | 0.320 | 0.215 | 0.282 | 0.242 |
| Cascade SNHSP Scheme with Respect to DO Control | ||||||
| Indicator/Bimester | 1 | 2 | 3 | 4 | 5 | 6 |
| Electricity % | −13 | −9.0 | −4.0 | −2.0 | −6.0 | −11 |
| Ntot % | −29 | −20 | −10 | −9.0 | −16 | −21 |
| SNH % | 230 | 227 | 68 | 73 | 131 | 174 |
| EQI % | −8.3 | −6.0 | 0 | 0 | −3.5 | −5.4 |
| DO + NO Control with Respect to DO Control | ||||||
| Indicator/Bimester | 1 | 2 | 3 | 4 | 5 | 6 |
| Electricity % | −1.0 | 0 | 0 | 1.0 | 1.0 | 0 |
| Ntot % | 28 | 30 | 26 | 32 | 30 | 26 |
| SNH % | −50 | −33 | −26 | −47 | −29 | −23 |
| EQI % | 17 | 15 | 12 | 14 | 14 | 13 |
| Environmental Indicators | SNHSP = 1 g/m3 | SNHSP = 4 g/m3 | SNHSP = 6 g/m3 | Relative Variation SNHSP = 4% | Relative Variation SNHSP = 6% | |
|---|---|---|---|---|---|---|
| Energy | Electricity (AE + PE + ME) (kW h/m3) | 0.243 | 0.234 | 0.231 | −3.7 | −5.0 |
| Emissions to air | CO2 (ASP) (g/m3) | 87.20 | 84.32 | 83.29 | −3.3 | −3.7 |
| Emissions to water | SNH effluent (g/m3) | 1.052 | 1.562 | 1.765 | 48.5 | 67.8 |
| Ntot effluent (g/m3) | 11.34 | 10.54 | 10.36 | −7.0 | −8.64 | |
| EQI (kg/m3) | 0.260 | 0.263 | 0.265 | 1.15 | 1.9 | |
| Operating costs | OCI (EUR/d) | 0.437 | 0.428 | 0.425 | −2.1 | −2.7 |
| SNHSP = 4 g/m3 Scheme with Respect to SNHSP = 1 g/m3 | ||||||
| Indicator/Bimester | 1 | 2 | 3 | 4 | 5 | 6 |
| Electricity % | −2.4 | −3.5 | −4.9 | −4.8 | −3.8 | −3.0 |
| Ntot % | −5.9 | −4.5 | −5.7 | −9.0 | −7.3 | −5.5 |
| SNH % | 39 | 35 | 52 | 62 | 52 | 42 |
| EQI % | 0 | 0 | 2.5 | 1.8 | 3.3 | 0.4 |
| SNHSP = 6 g/m3 Scheme with Respect to SNHSP = 1 g/m3 | ||||||
| Indicator/Bimester | 1 | 2 | 3 | 4 | 5 | 6 |
| Electricity % | −2.8 | −4.7 | −6.7 | −6.0 | −5.0 | −4.2 |
| Ntot % | −8.1 | −8.2 | −8.2 | −10.6 | −8.6 | −6.4 |
| SNH % | 54 | 50 | 76 | 84 | 71 | 53 |
| EQI % | 0 | 0 | 3.6 | 3.2 | 1.9 | 0.8 |
| Environmental Indicators | Qcarb = 2 g/m3 | Qcarb = 1 g/m3 | Qcarb = 0.5 g/m3 | Qcarb = 0 g/m3 | |
|---|---|---|---|---|---|
| Energy | Electricity (AE + PE + ME) (kW h/m3) | 0.243 | 0.237 | 0.235 | 0.234 |
| Heating energy (kW h/m3) | 0.204 | 0.203 | 0.202 | 0.201 | |
| Chemicals | External carbon (kg COD/m3) | 0.039 | 0.019 | 0.010 | 0 |
| Emissions to air | Biogas CH4 (g/m3) | 52.53 | 51.90 | 51.59 | 51.28 |
| CO2 (Digester) (g/m3) | 75.63 | 74.77 | 74.35 | 73.92 | |
| CO2 (ASP) (g/m3) | 87.20 | 88.55 | 89.44 | 90.49 | |
| Emissions to soil | Sludge for disposal (kg/m3) | 131.01 | 128.40 | 127.08 | 125.77 |
| Emissions to water | SNH effluent (g/m3) | 1.052 | 1.028 | 1.019 | 1.011 |
| Ntot effluent (g/m3) | 11.34 | 12.83 | 13.86 | 15.09 | |
| COD effluent (g/m3) | 49.07 | 48.71 | 48.54 | 48.38 | |
| EQI (kg/m3) | 0.260 | 0.273 | 0.282 | 0.294 | |
| Operation costs | OCI (EUR/d) | 0.437 | 0.369 | 0.336 | 0.303 |
| Environmental Indicators | Qcarb = 1 g/m3 | Qcarb = 0.5 g/m3 | Qcarb = 0 g/m3 | |
|---|---|---|---|---|
| Energy | Electricity (AE + PE + ME) (kW h/m3) | −2.5% | −3.3% | −3.7% |
| Chemicals | External carbon (kg COD/m3) | −51.2% | −74.4% | −100% |
| Emissions to air | CO2 (ASP) (g/m3) | 1.6% | 2.6% | 3.8% |
| Emissions to soil | Sludge for disposal (kg/m3) | −2% | −3% | −4% |
| Emissions to water | SNH effluent (g/m3) | −2.3% | −3.2% | −3.9% |
| Ntot effluent (g/m3) | 13.1% | 22.2% | 33.1% | |
| EQI (kg/m3) | 5% | 8.5% | 13.8% | |
| Operation costs | OCI (EUR/d) | −15.6% | −23.1% | −30.7% |
| Indicator/Bimester | 1 | 2 | 3 | 4 | 5 | 6 | |
|---|---|---|---|---|---|---|---|
| Qcarb = 1 g/m3 | Ntot% | 15 | 15 | 12 | 16 | 12 | 11 |
| EQI % | 4.6 | 6.1 | 3.6 | 6.4 | 3.7 | 4.7 | |
| Qcarb = 0.5 g/m3 | Ntot% | 28 | 24 | 23 | 26 | 21 | 20 |
| EQI % | 9.1 | 8.0 | 7.1 | 11 | 7.4 | 5.8 | |
| Qcarb = 0 | Ntot% | 41 | 36 | 30 | 34 | 30 | 29 |
| EQI % | 14.6 | 14.3 | 10.6 | 15.0 | 11.1 | 12.4 |
| Name | SNHSP | Qcarb |
|---|---|---|
| Cascade SNHSP | Constant 1 g/m3 | Constant 2 g/m3 |
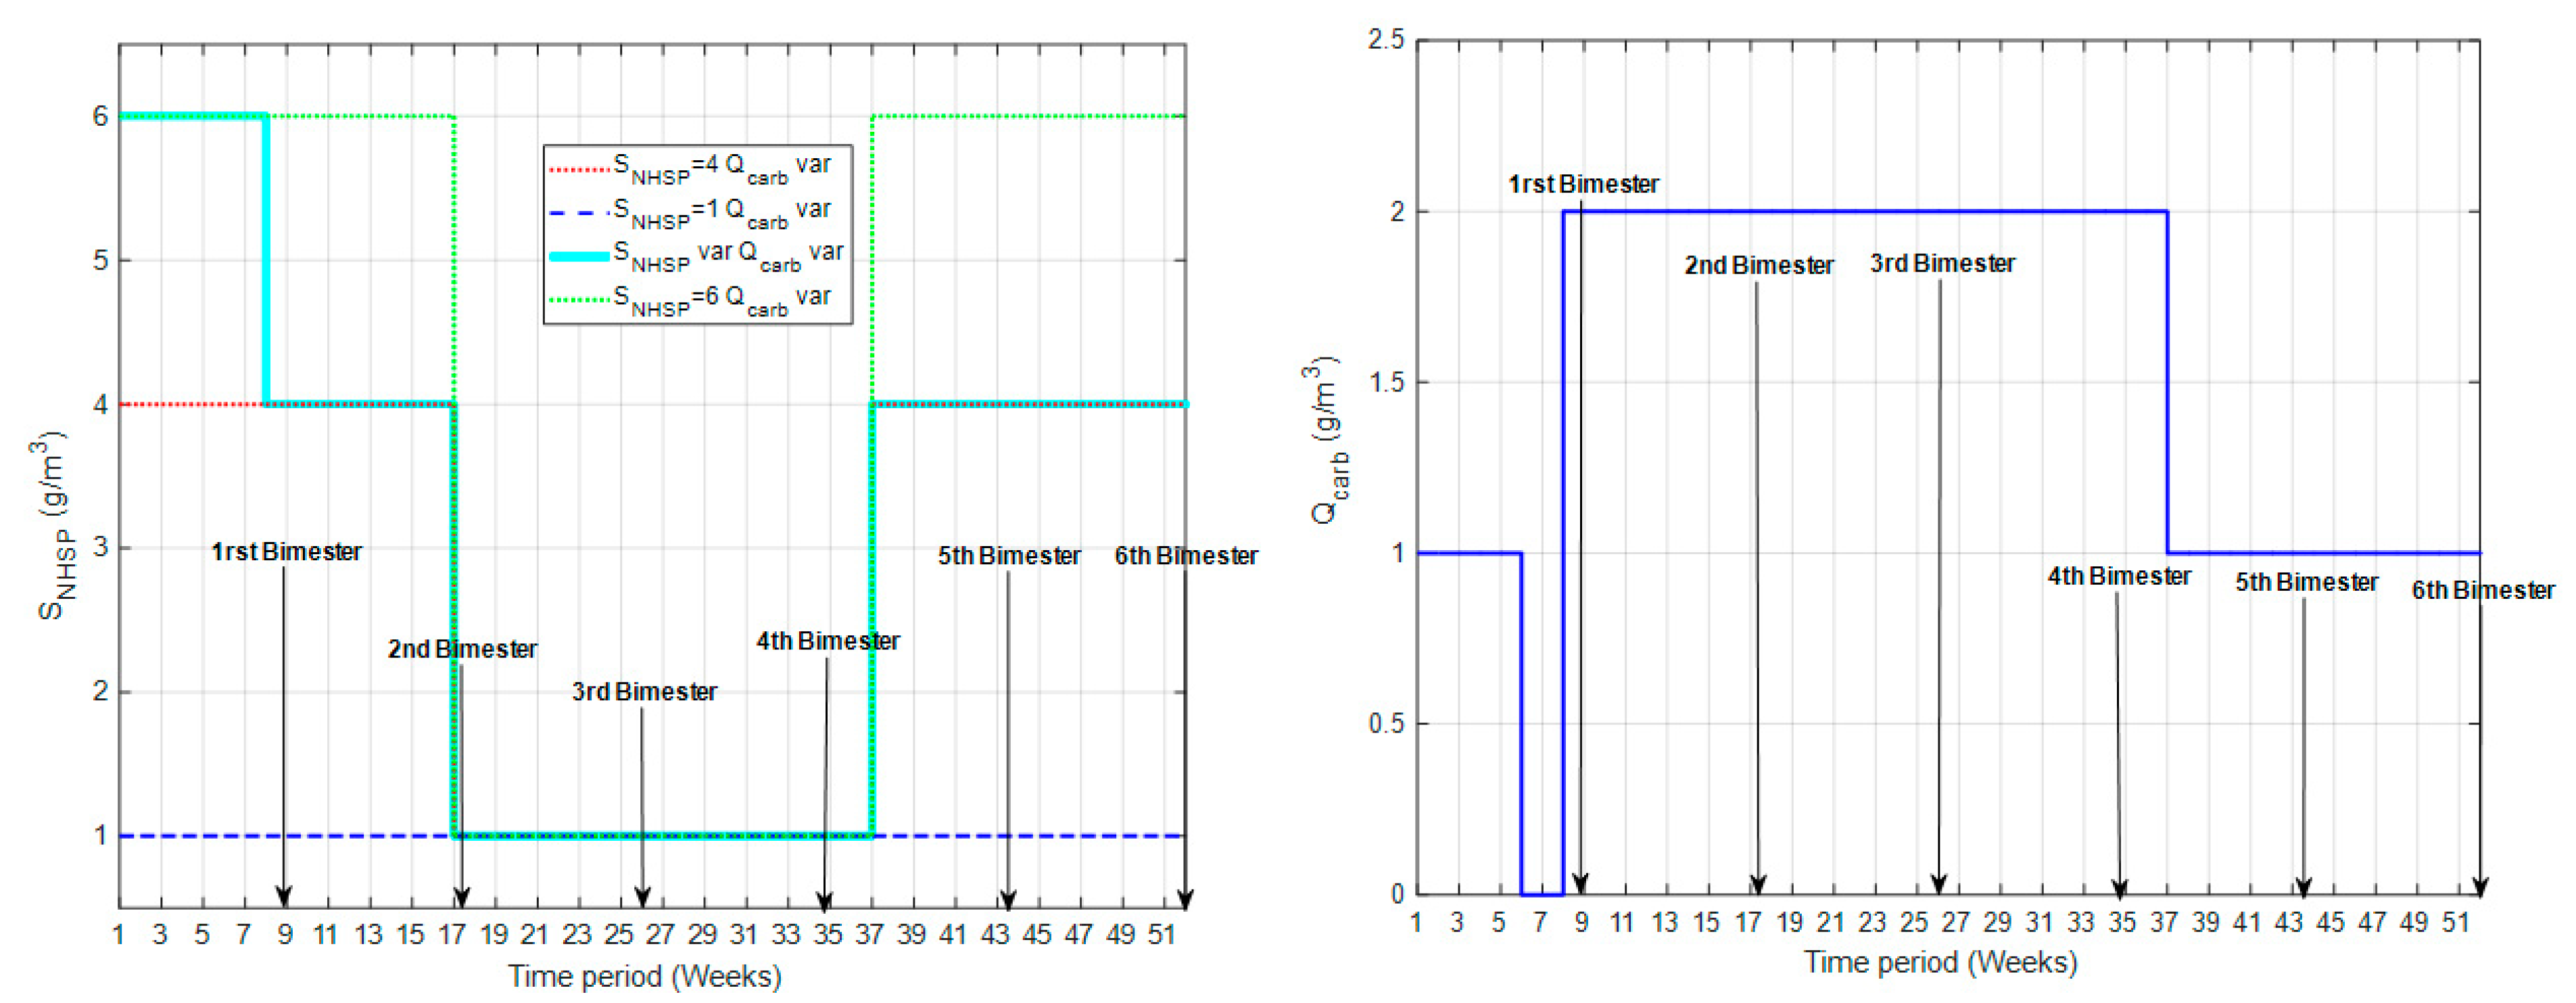
| SNHSP = 1 Qcarb var | Constant 1 g/m3 | Qcarb sequence shown in Figure 10 |
| SNHSP = 4 Qcarb var | SNHSP = 1 g/m3 between weeks 17 and 37, SNHSP = 4 g/m3 in the rest of operational period | Qcarb sequence shown in Figure 10 |
| SNHSP = 6 Qcarb var | SNHSP = 1 g/m3 between weeks 17 and 37, SNHSP = 6 g/m3 in the rest of operational period | Qcarb sequence shown in Figure 10 |
| SNHSP var Qcarb var | SNHSP = 6 g/m3 between weeks 1 and 8, SNHSP = 4 g/m3 between weeks 8 and 16, SNHSP = 1 g/m3 between weeks 17 and 37, SNHSP = 4 g/m3 from week 38 to the end of the operational period | Qcarb sequence shown in Figure 10 |
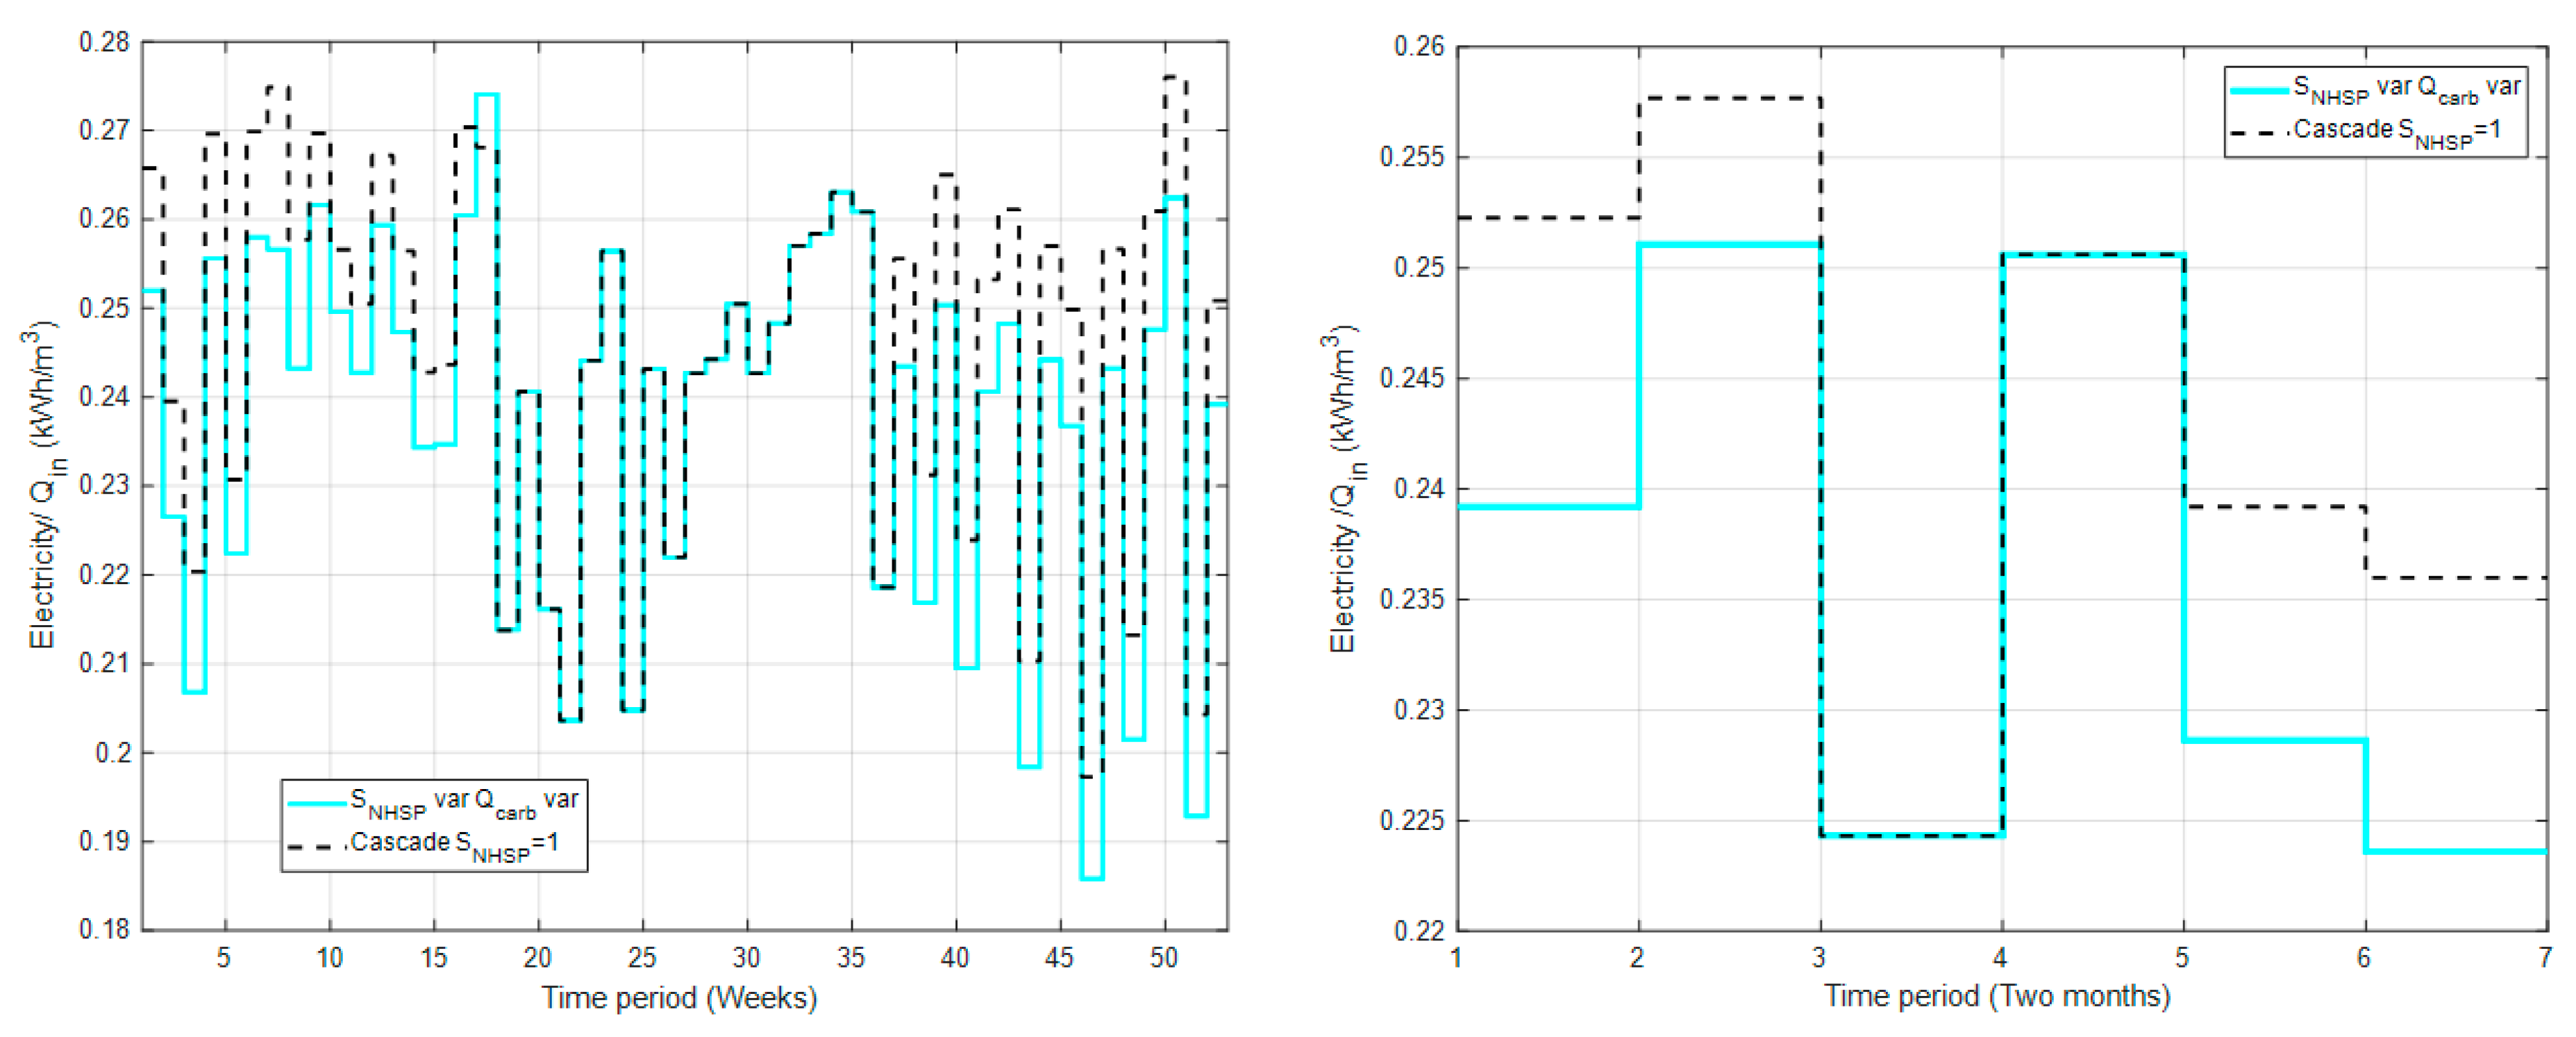
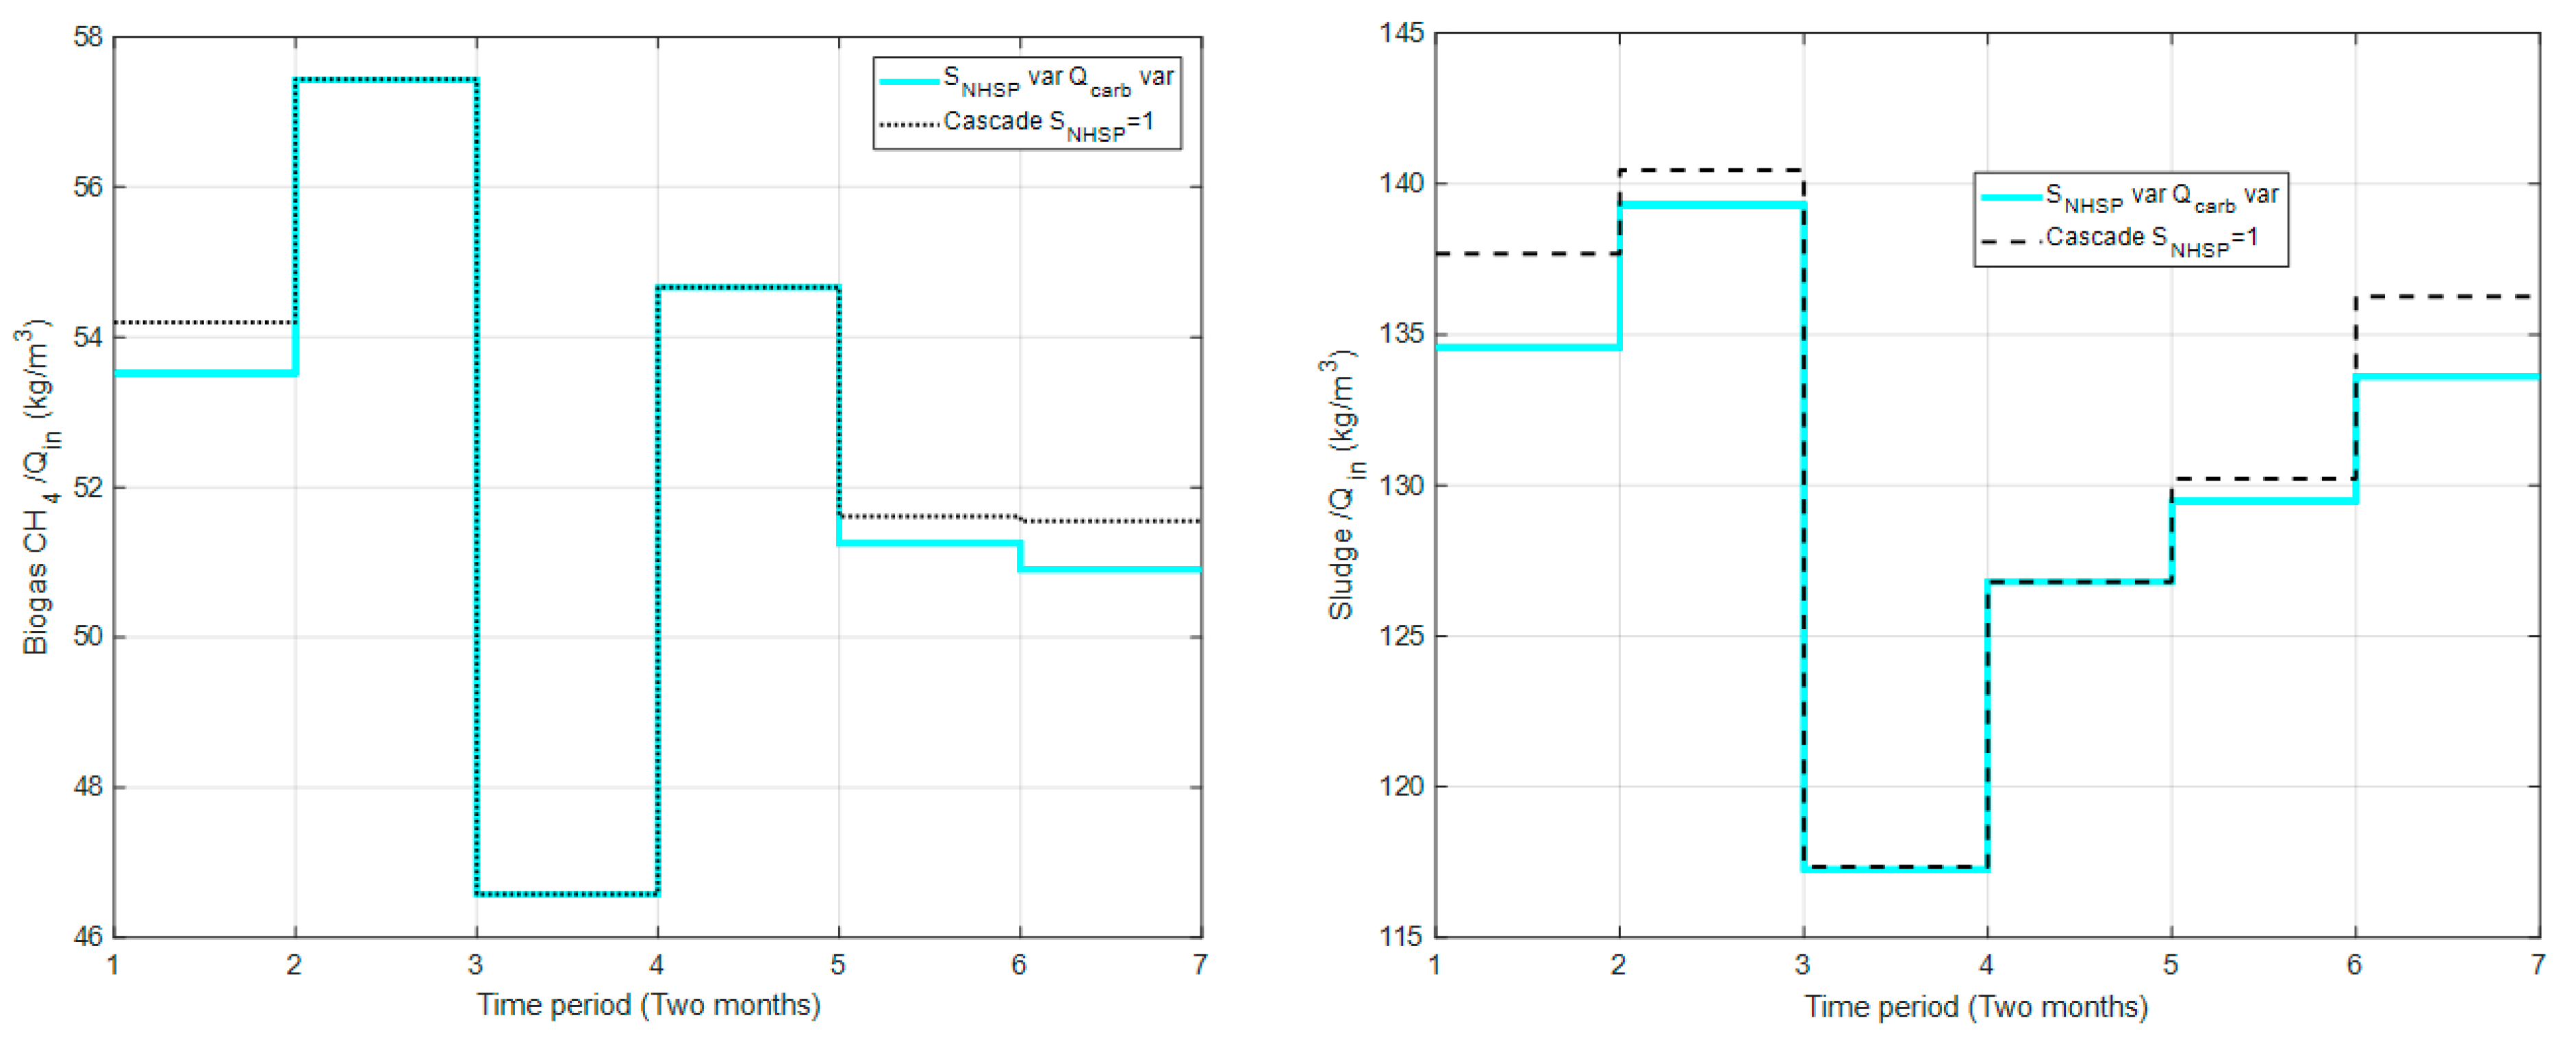
| Environmental Indicators | DO Default | Cascade SNHSP = 1 g/m3 | Variable SNHSP var-Qcarb var | |
|---|---|---|---|---|
| Energy | Electricity (AE + PE + ME) (kW h/m3) | 0.263 | 0.243 | 0.236 |
| Heating energy (kW h/m3) | 0.204 | 0.204 | 0.204 | |
| Chemicals | External carbon (kg COD/m3) | 0.039 | 0.039 | 0.029 |
| Emissions to air | Biogas CH4 (g/m3) | 52.51 | 52.53 | 52.25 |
| CO2 (Digester) (g/m3) | 75.61 | 75.63 | 75.25 | |
| CO2 (ASP) (g/m3) | 91.52 | 87.20 | 86.49 | |
| Emissions to soil | Sludge for disposal (kg/m3) | 131.1 | 131.0 | 129.8 |
| Emissions to water | SNH effluent (g/m3) | 0.474 | 1.052 | 1.244 |
| Ntot effluent (g/m3) | 13.53 | 11.34 | 11.48 | |
| COD effluent (g/m3) | 48.99 | 49.07 | 48.93 | |
| EQI (kg/m3) | 0.270 | 0.260 | 0.265 | |
| Operation costs | OCI (EUR/d) | 0.457 | 0.437 | 0.400 |
| Environmental Indicators | Cascade SNHSP = 1 g/m3 | Variable SNHSP var-Qcarb var | |
|---|---|---|---|
| Energy | Electricity (AE + PE + ME) (kW h/m3) | −7.6% | −10.3% |
| Chemicals | External carbon (kg COD/m3) | 0% | −25.6% |
| CO2 (ASP) (g/m3) | −4.7% | −5.5% | |
| Emissions to water | SNH effluent (g/m3) | +121% | +162% |
| Ntot effluent (g/m3) | −16.2% | −15.15% | |
| EQI (kg/m3) | −3.7% | −1.81% | |
| Operation costs | OCI (EUR/d) | −4.4% | −14.25% |
| Control Scheme | Effect on Environmental Indicators and Average Operation Costs |
|---|---|
| DO control | Advantages:
|
Disadvantages:
| |
| DO + NO control | Advantages:
|
Disadvantages:
| |
| Cascade SNHSP | Advantages:
|
Disadvantages:
| |
| SNHSP var Qcarb var strategy | Advantages:
|
Disadvantages:
|
© 2020 by the authors. Licensee MDPI, Basel, Switzerland. This article is an open access article distributed under the terms and conditions of the Creative Commons Attribution (CC BY) license (http://creativecommons.org/licenses/by/4.0/).
Share and Cite
Revollar, S.; Meneses, M.; Vilanova, R.; Vega, P.; Francisco, M. Quantifying the Benefit of a Dynamic Performance Assessment of WWTP. Processes 2020, 8, 206. https://doi.org/10.3390/pr8020206
Revollar S, Meneses M, Vilanova R, Vega P, Francisco M. Quantifying the Benefit of a Dynamic Performance Assessment of WWTP. Processes. 2020; 8(2):206. https://doi.org/10.3390/pr8020206
Chicago/Turabian StyleRevollar, Silvana, Montse Meneses, Ramón Vilanova, Pastora Vega, and Mario Francisco. 2020. "Quantifying the Benefit of a Dynamic Performance Assessment of WWTP" Processes 8, no. 2: 206. https://doi.org/10.3390/pr8020206
APA StyleRevollar, S., Meneses, M., Vilanova, R., Vega, P., & Francisco, M. (2020). Quantifying the Benefit of a Dynamic Performance Assessment of WWTP. Processes, 8(2), 206. https://doi.org/10.3390/pr8020206