2.2.3. Control Design
The design of the control system includes a fuzzy logic method to obtain values from the valve opening angle parameters H
2 and O
2 flow rates. The value of the fuzzy controller function membership is obtained from the output voltage data obtained from the SOFC simulator, which has been tested for maximum output limits. Meanwhile, the determination of the fuzzy rule base is the result of observing the characteristics of the SOFC simulator system diagram when heading towards its stabilizing output voltage.
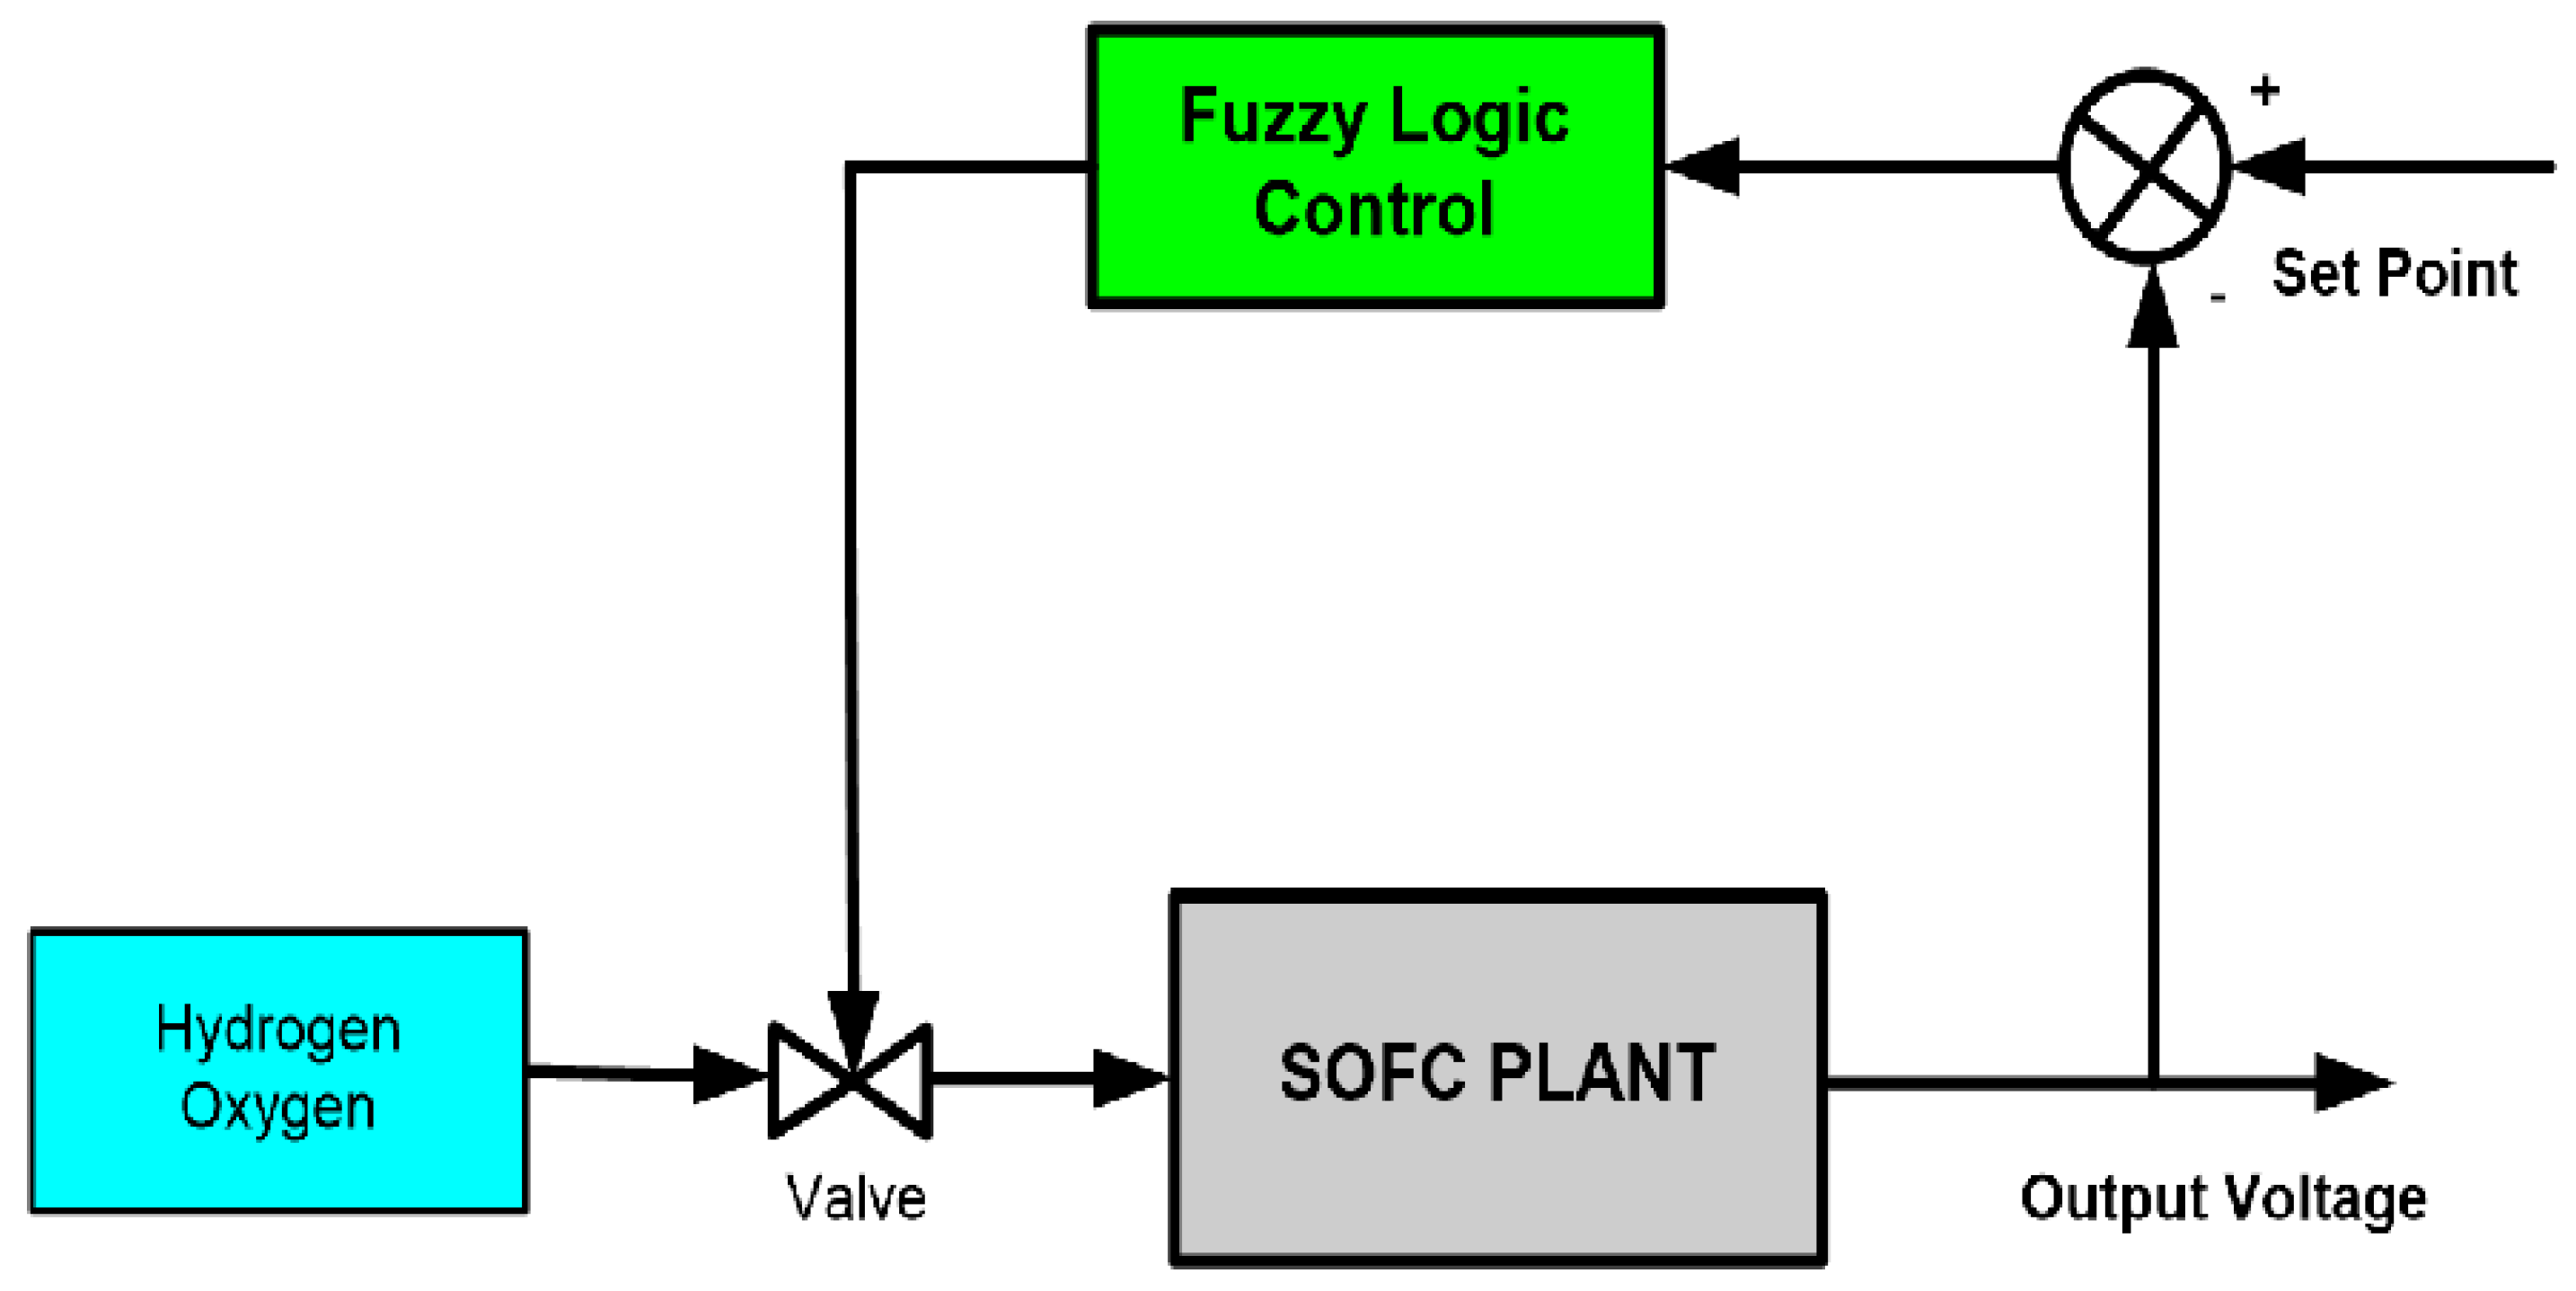
Figure 5 is a block controller of the H
2 and O
2 flow rates.
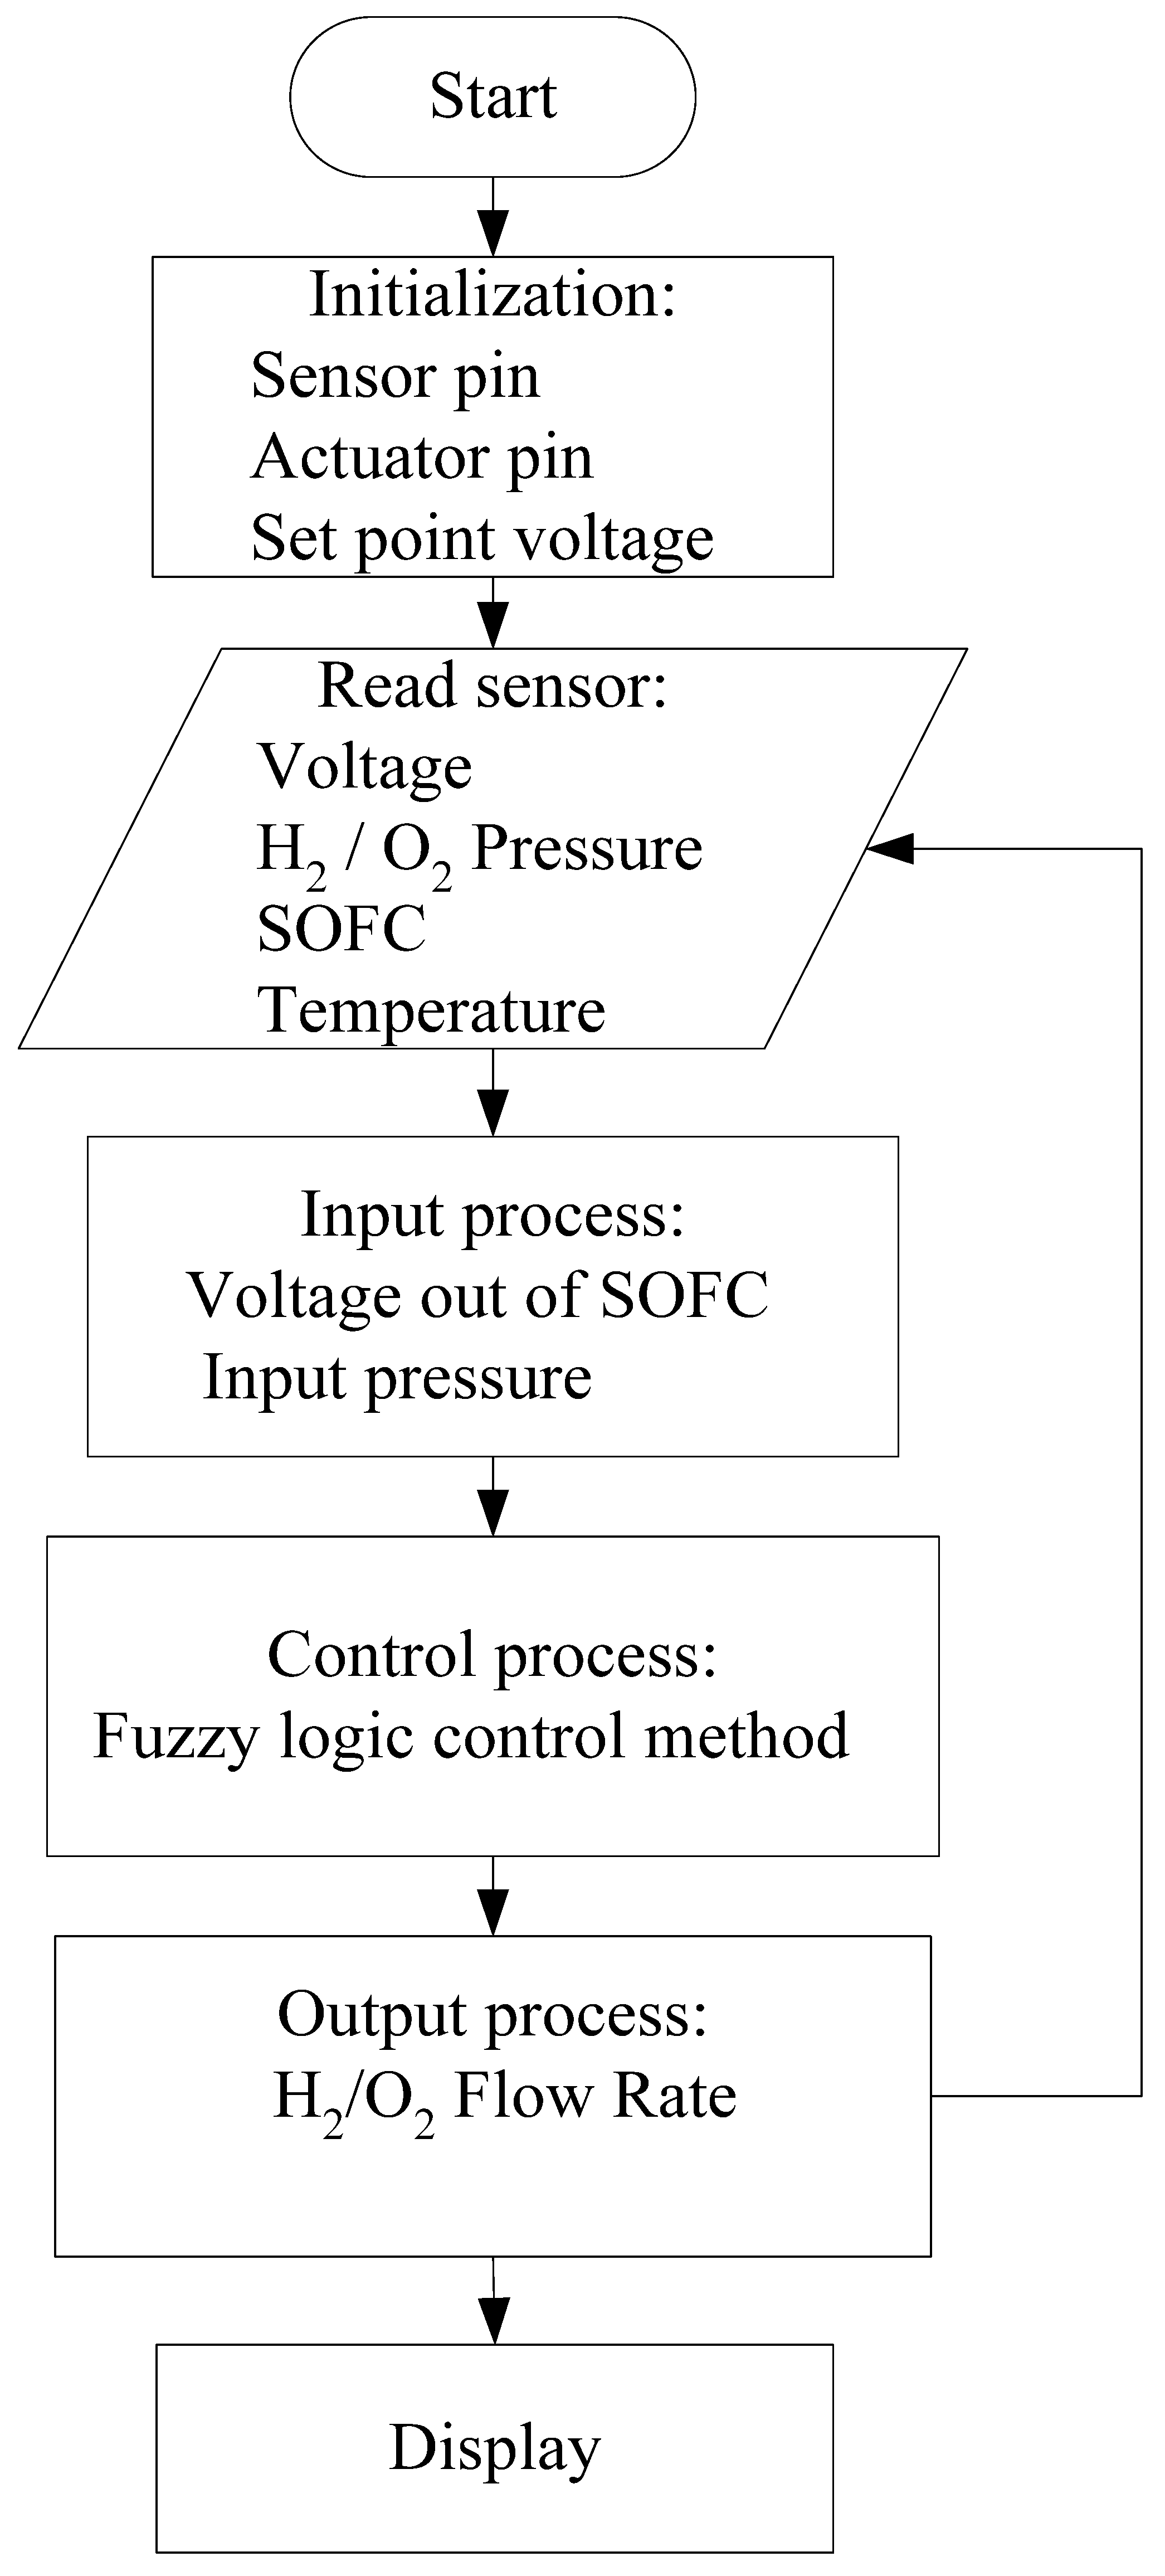
The fuzzy logic control method in this design obtains the input from the output voltage generated by the SOFC simulator. The output is in the form of an angle, which will be used to turn the valve to produce the expected H2 and O2 flow rates. The design of this fuzzy logic control method is divided into three: fuzzyfication, the rule base, and defuzzyfication.
Fuzzyfication
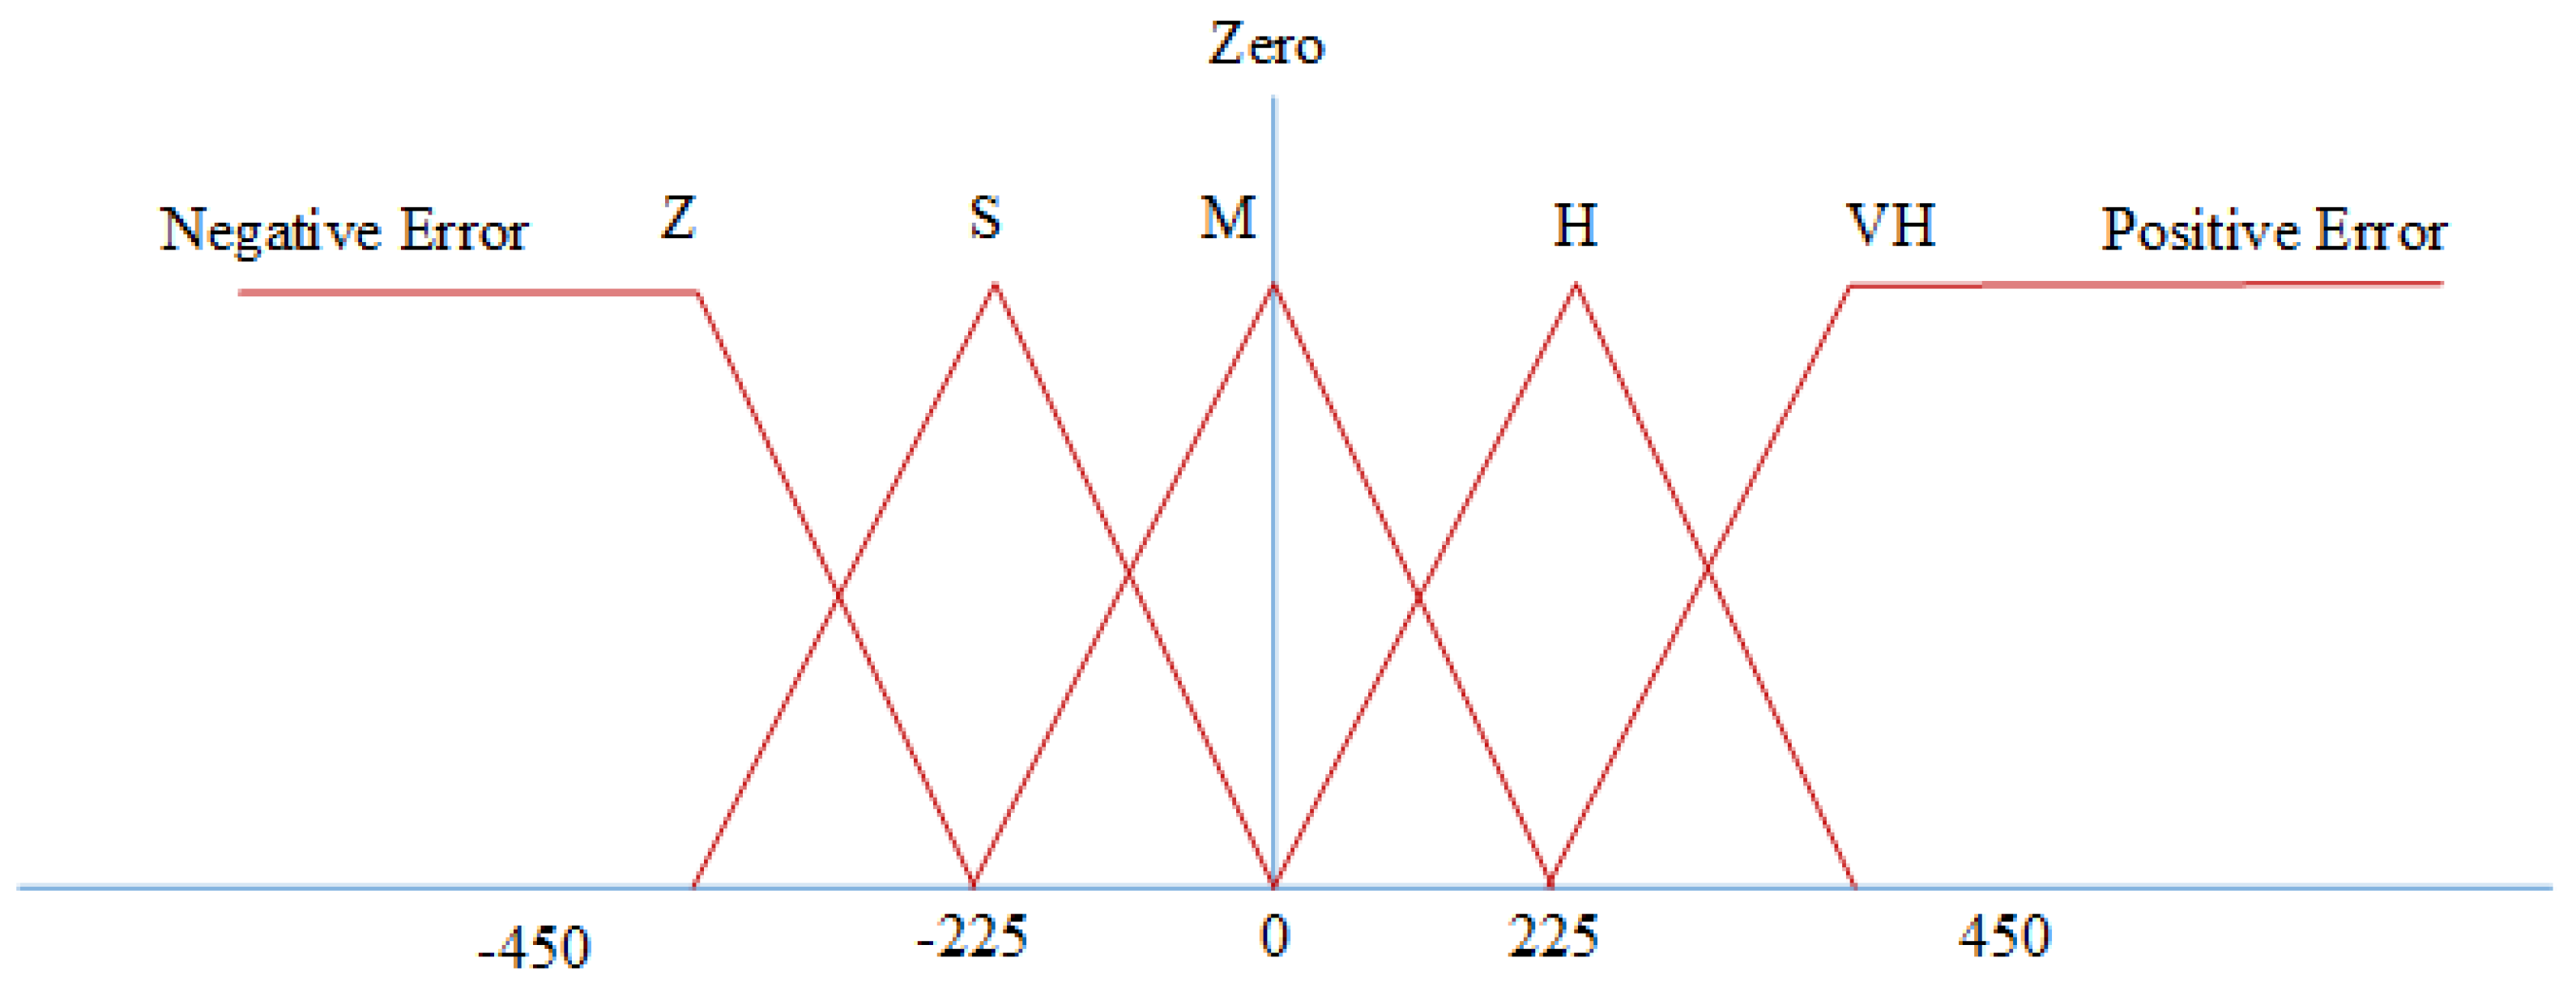
There is a membership function that plays the role of blurring (fuzzy), and this can be grouped into a set of memberships that have been determined. The processes in the fuzzyfication for H2 and O2 flow rates have the same input.
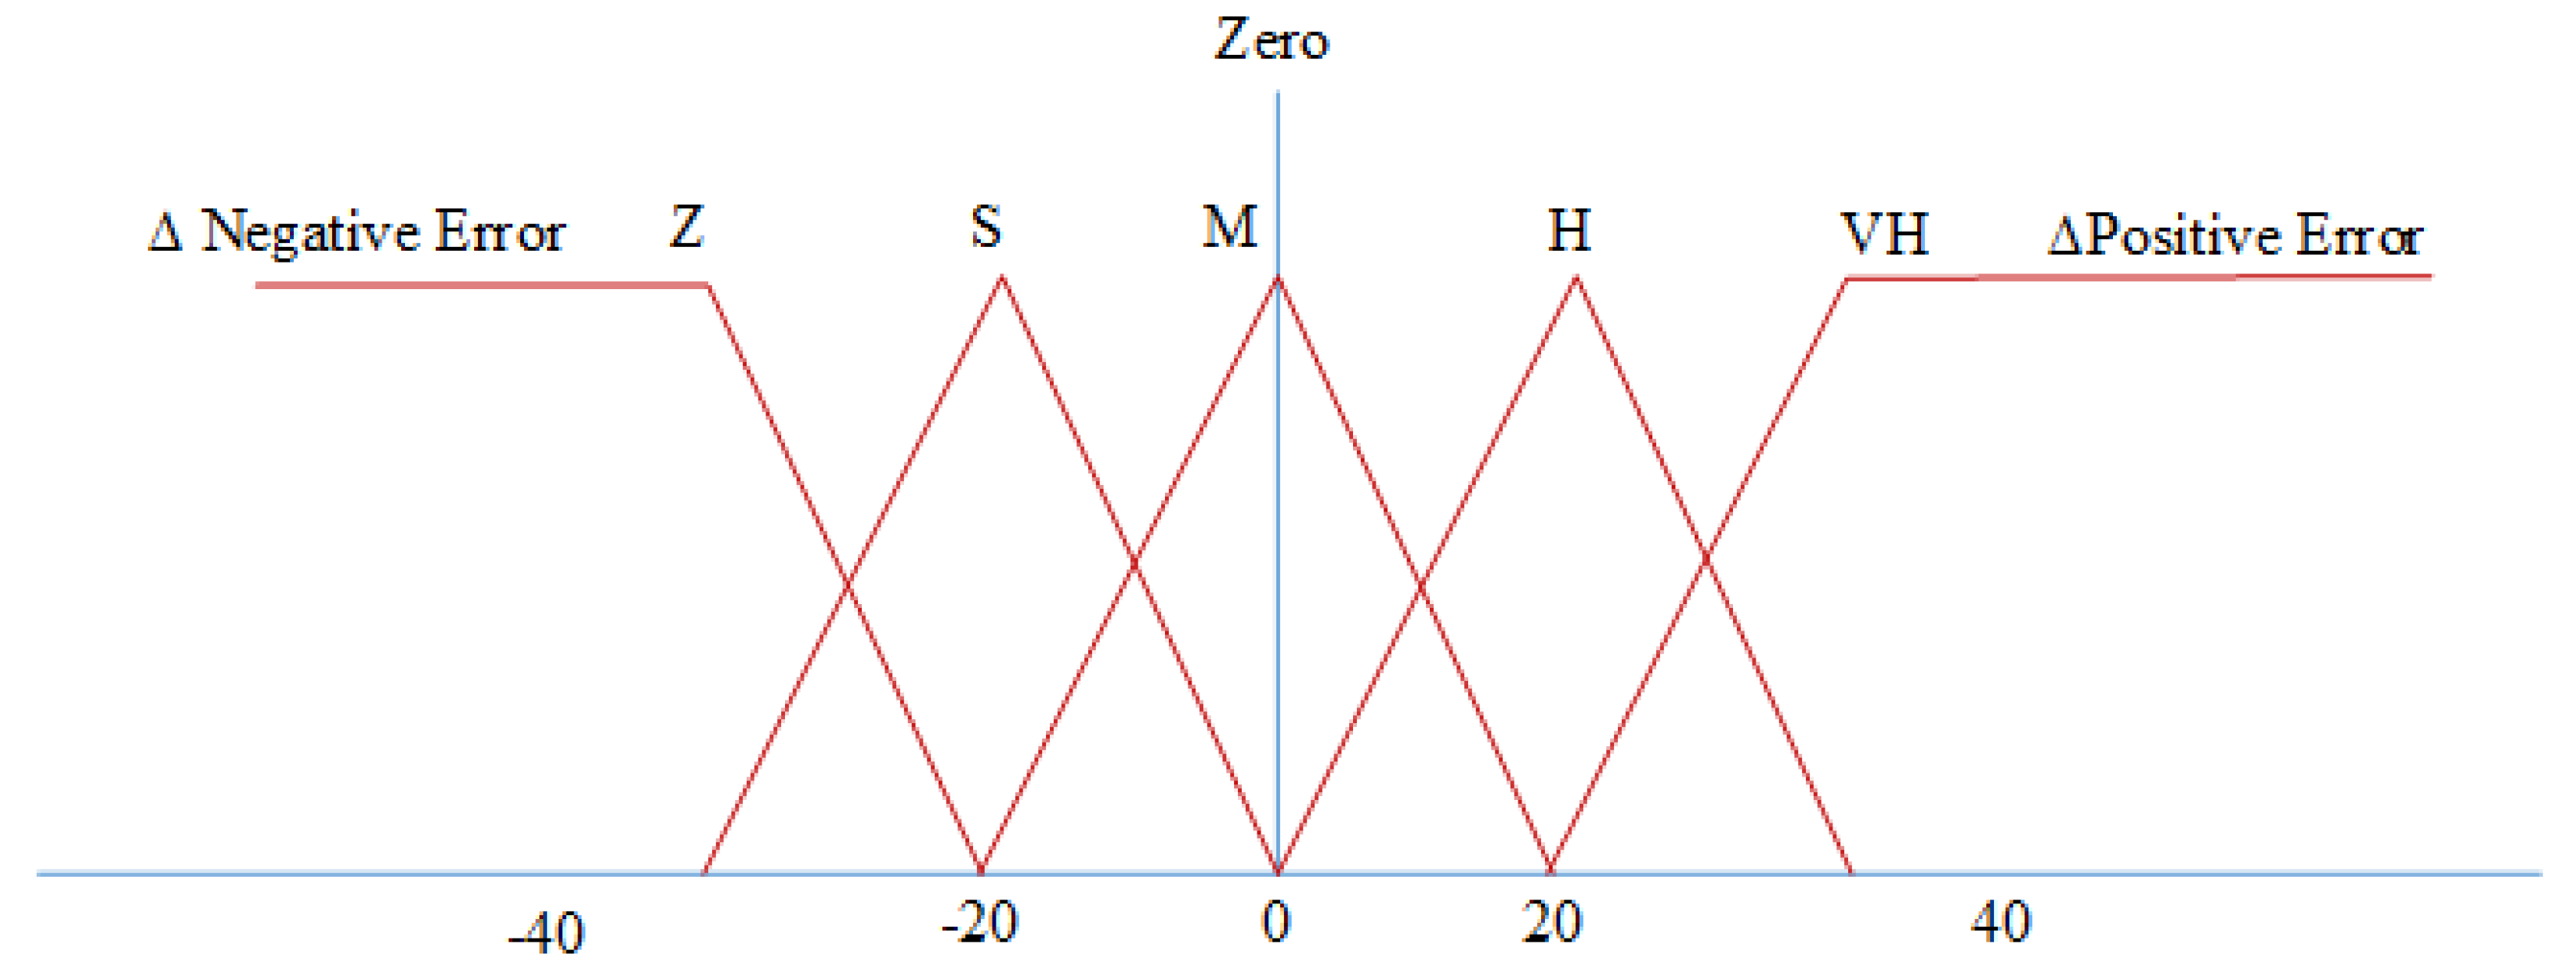
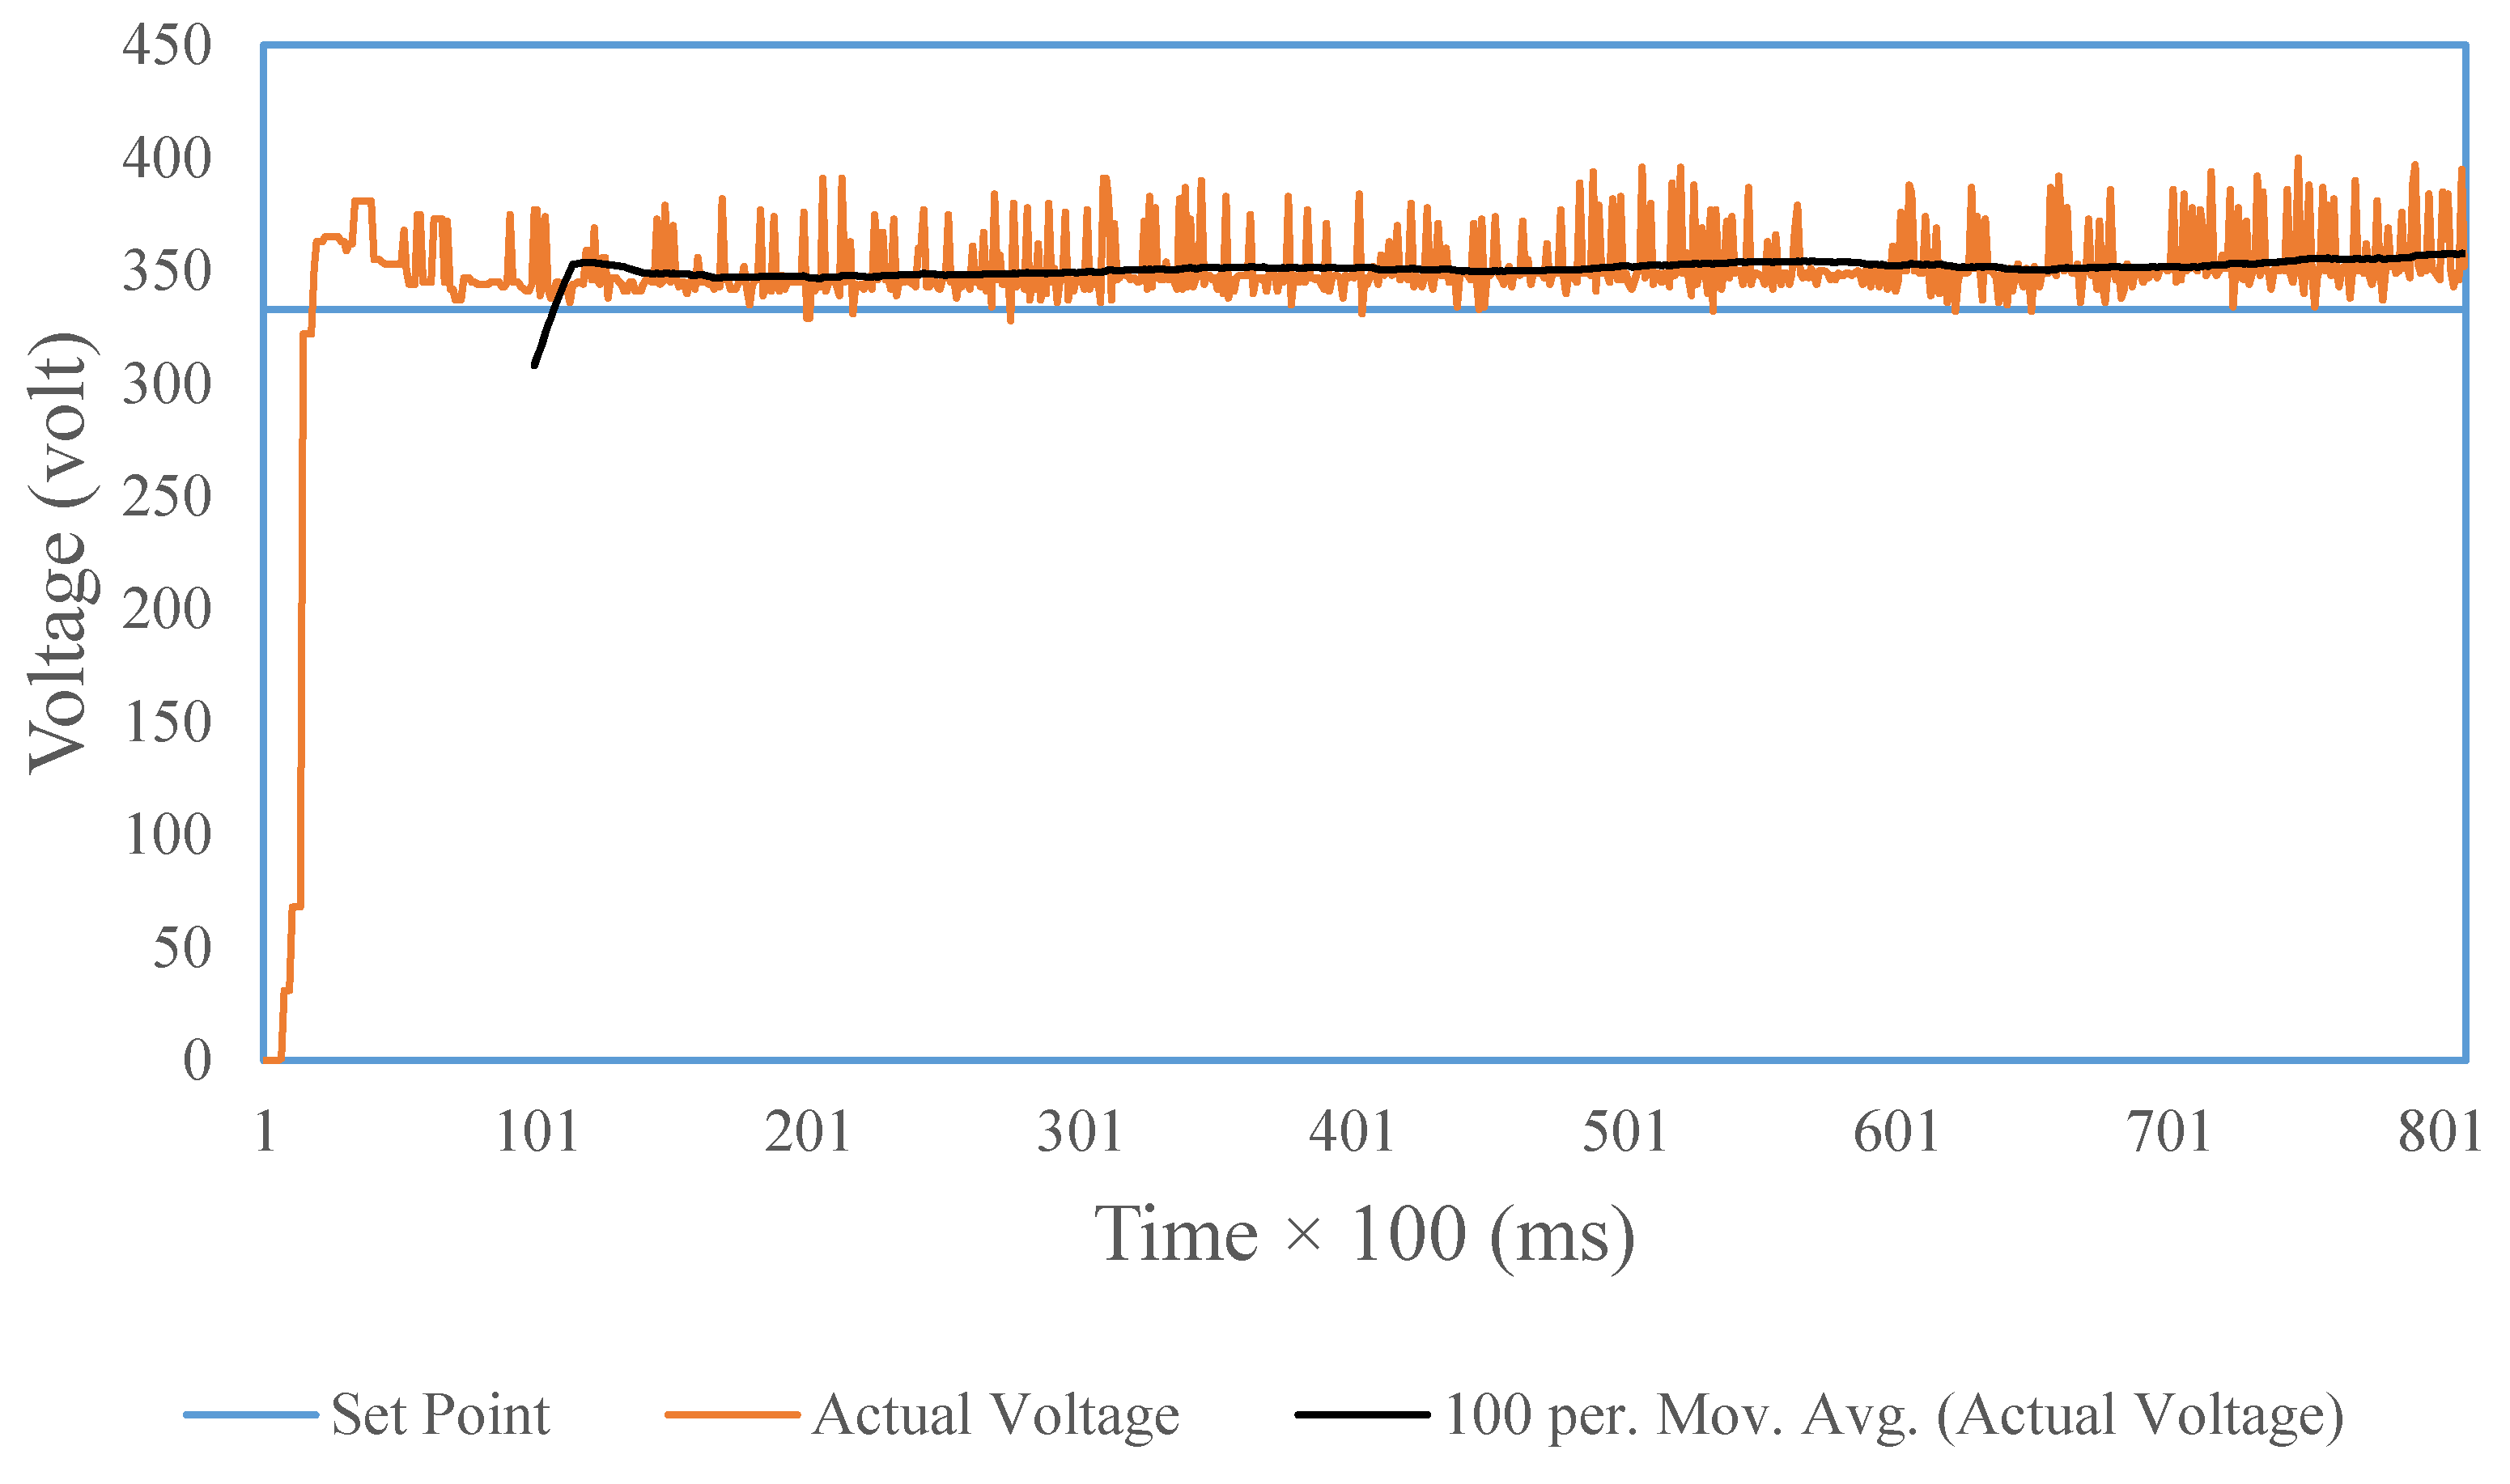
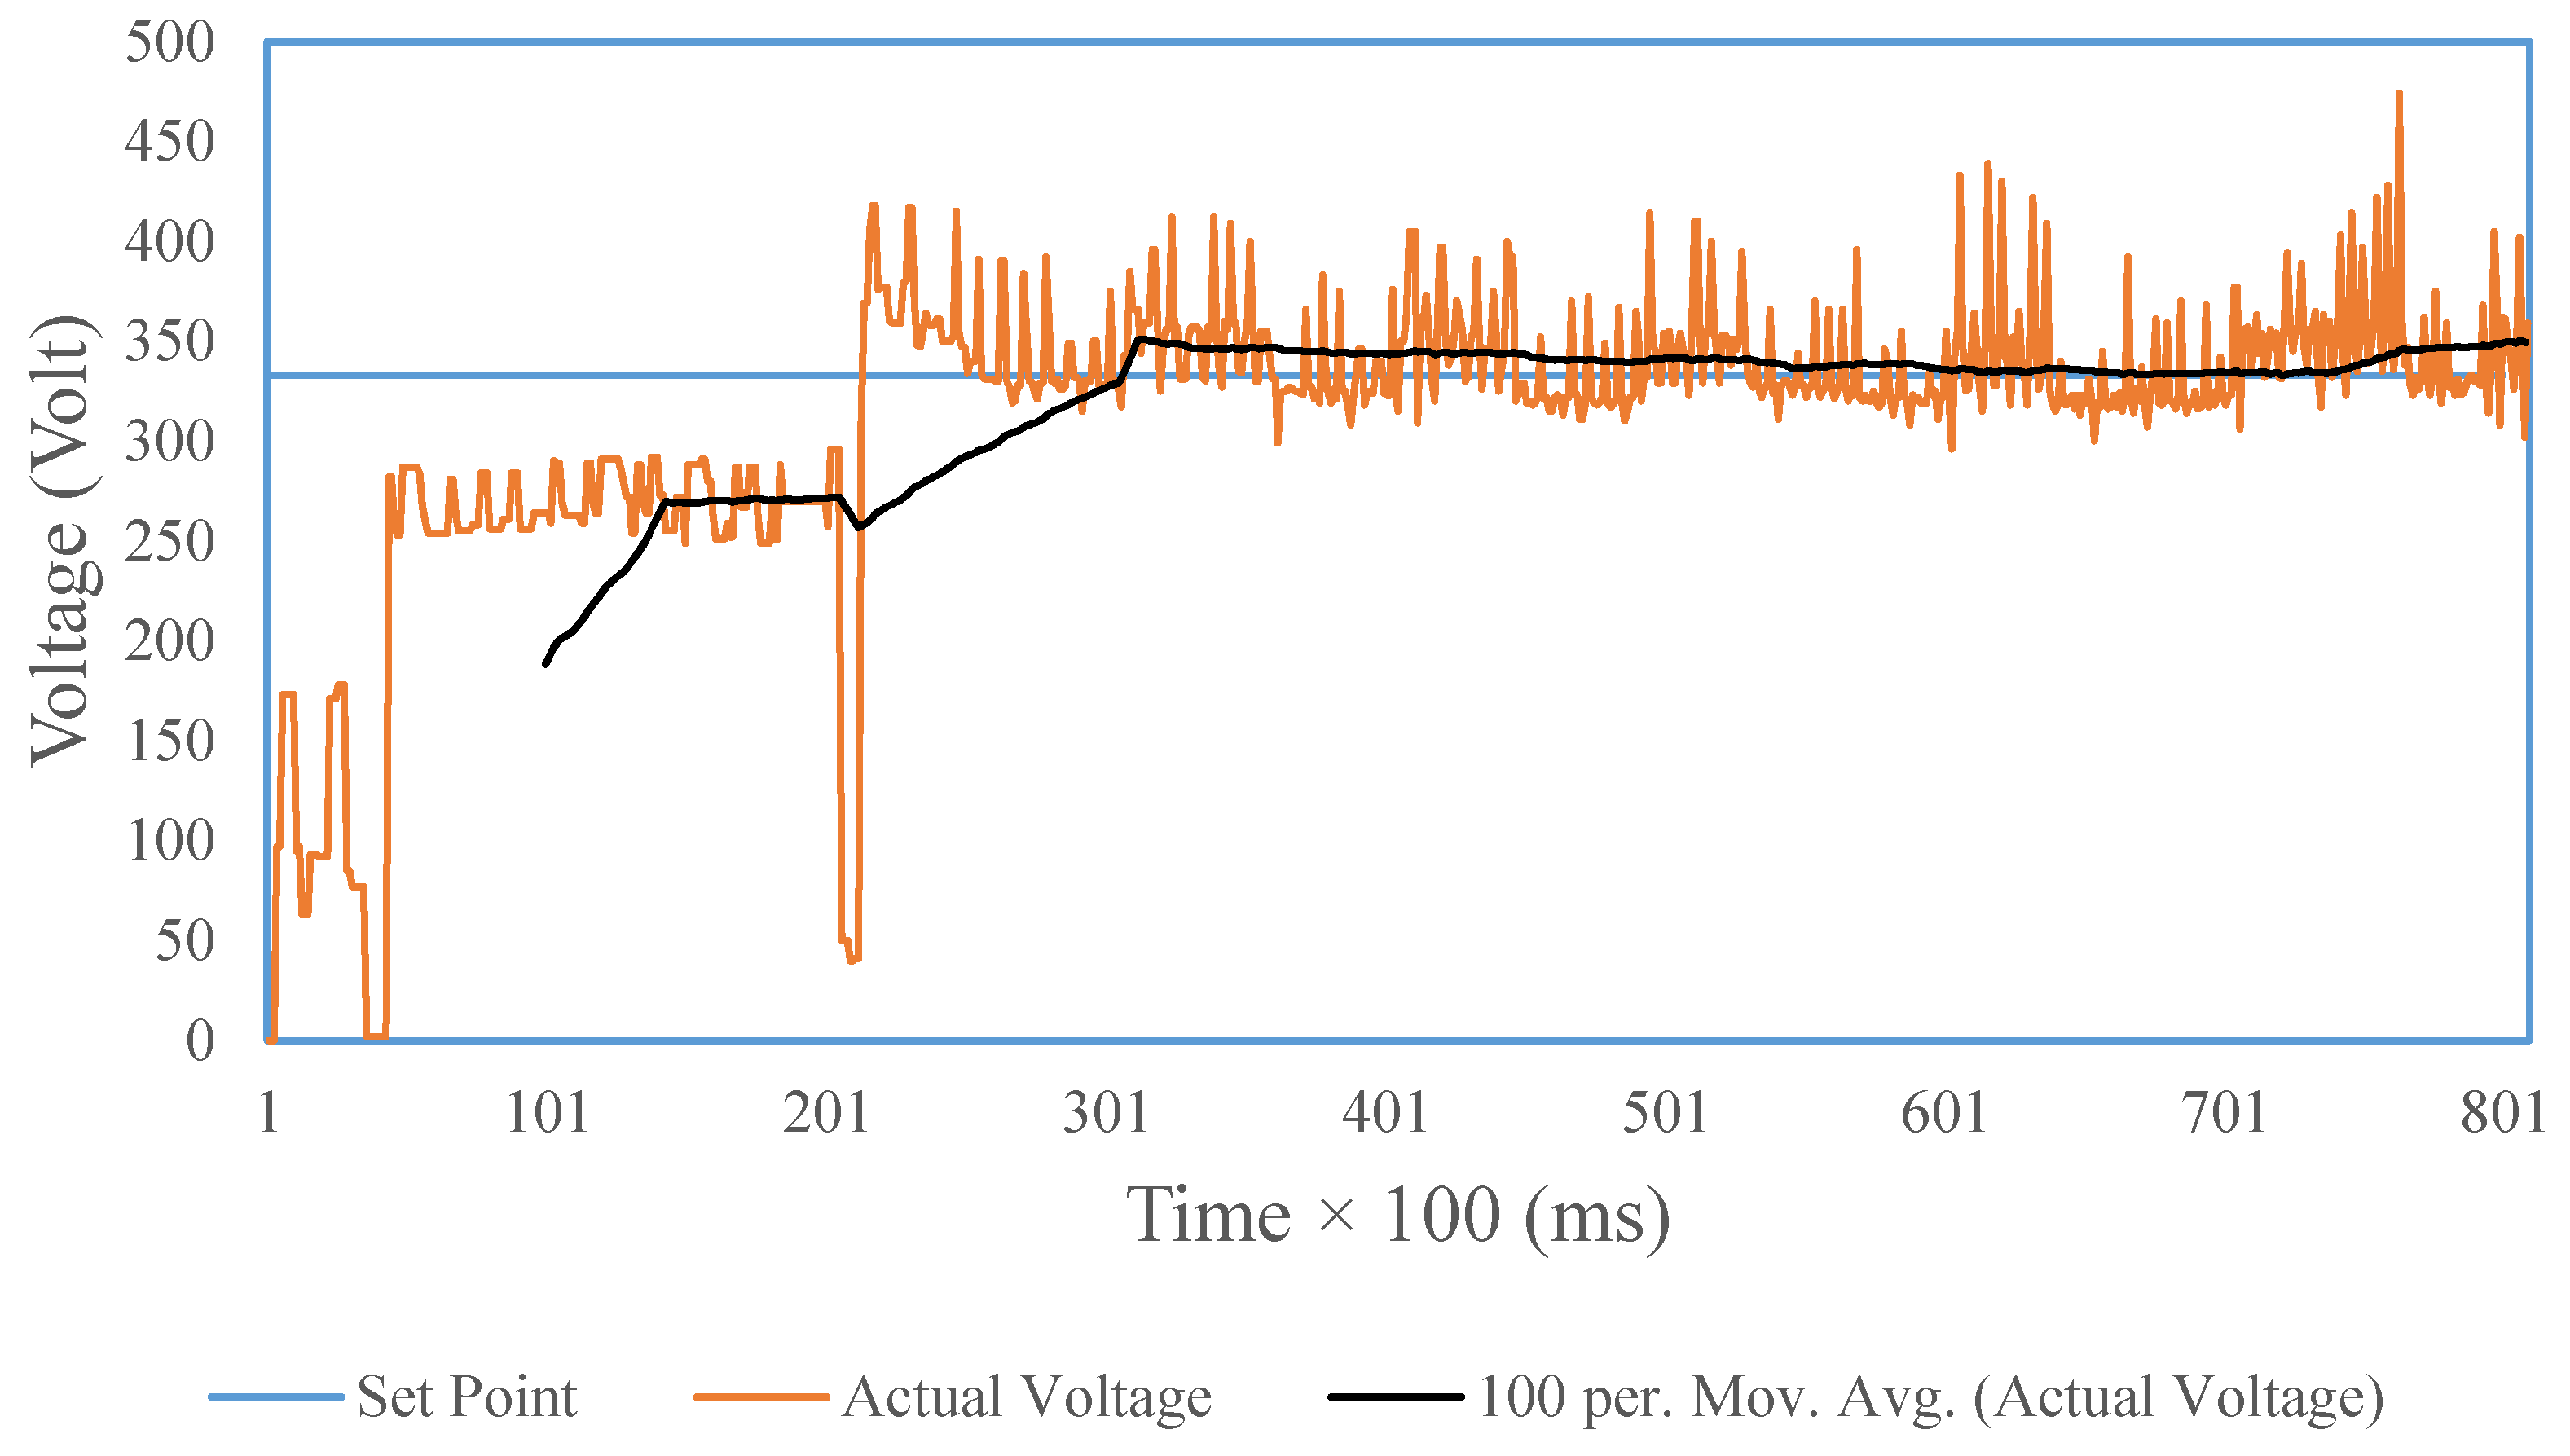
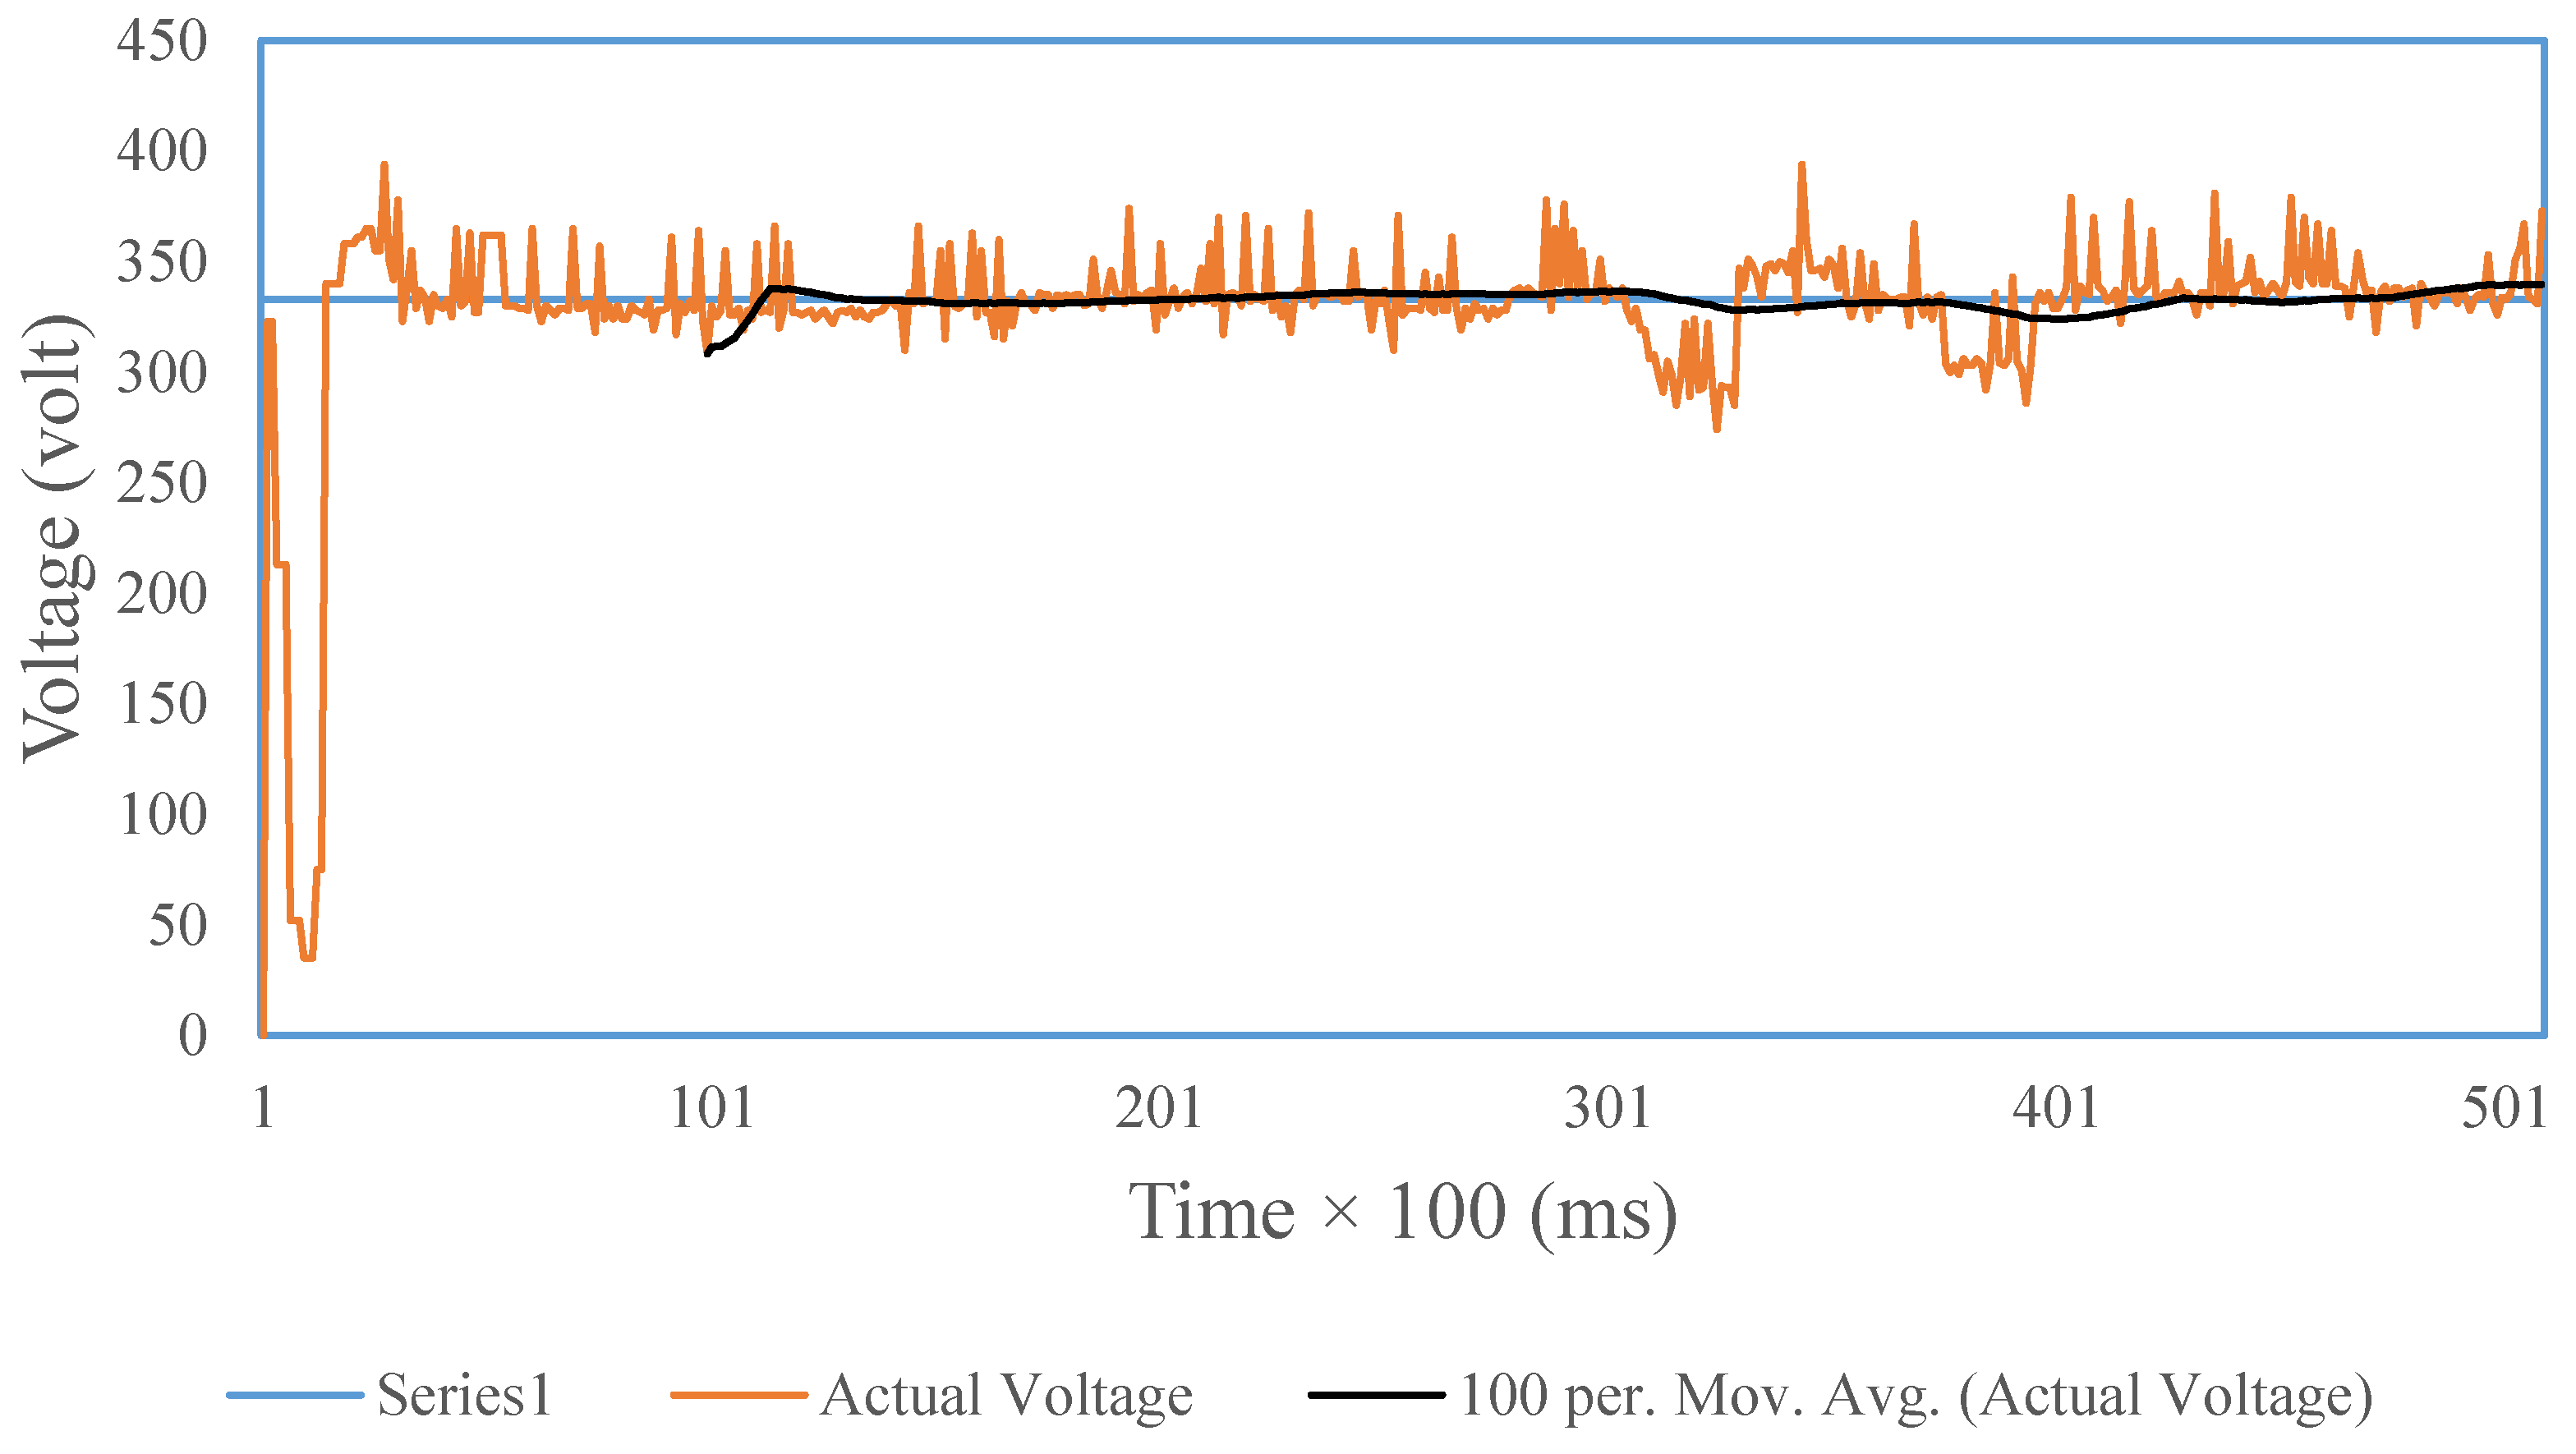
The fuzzy logic control has the input in the form of error and ∆error from the reading process of the SOFC output voltage values on the set point. The set point used is 333 volts. The
error and ∆
error membership functions are shown in the membership set graph in
Figure 6 and
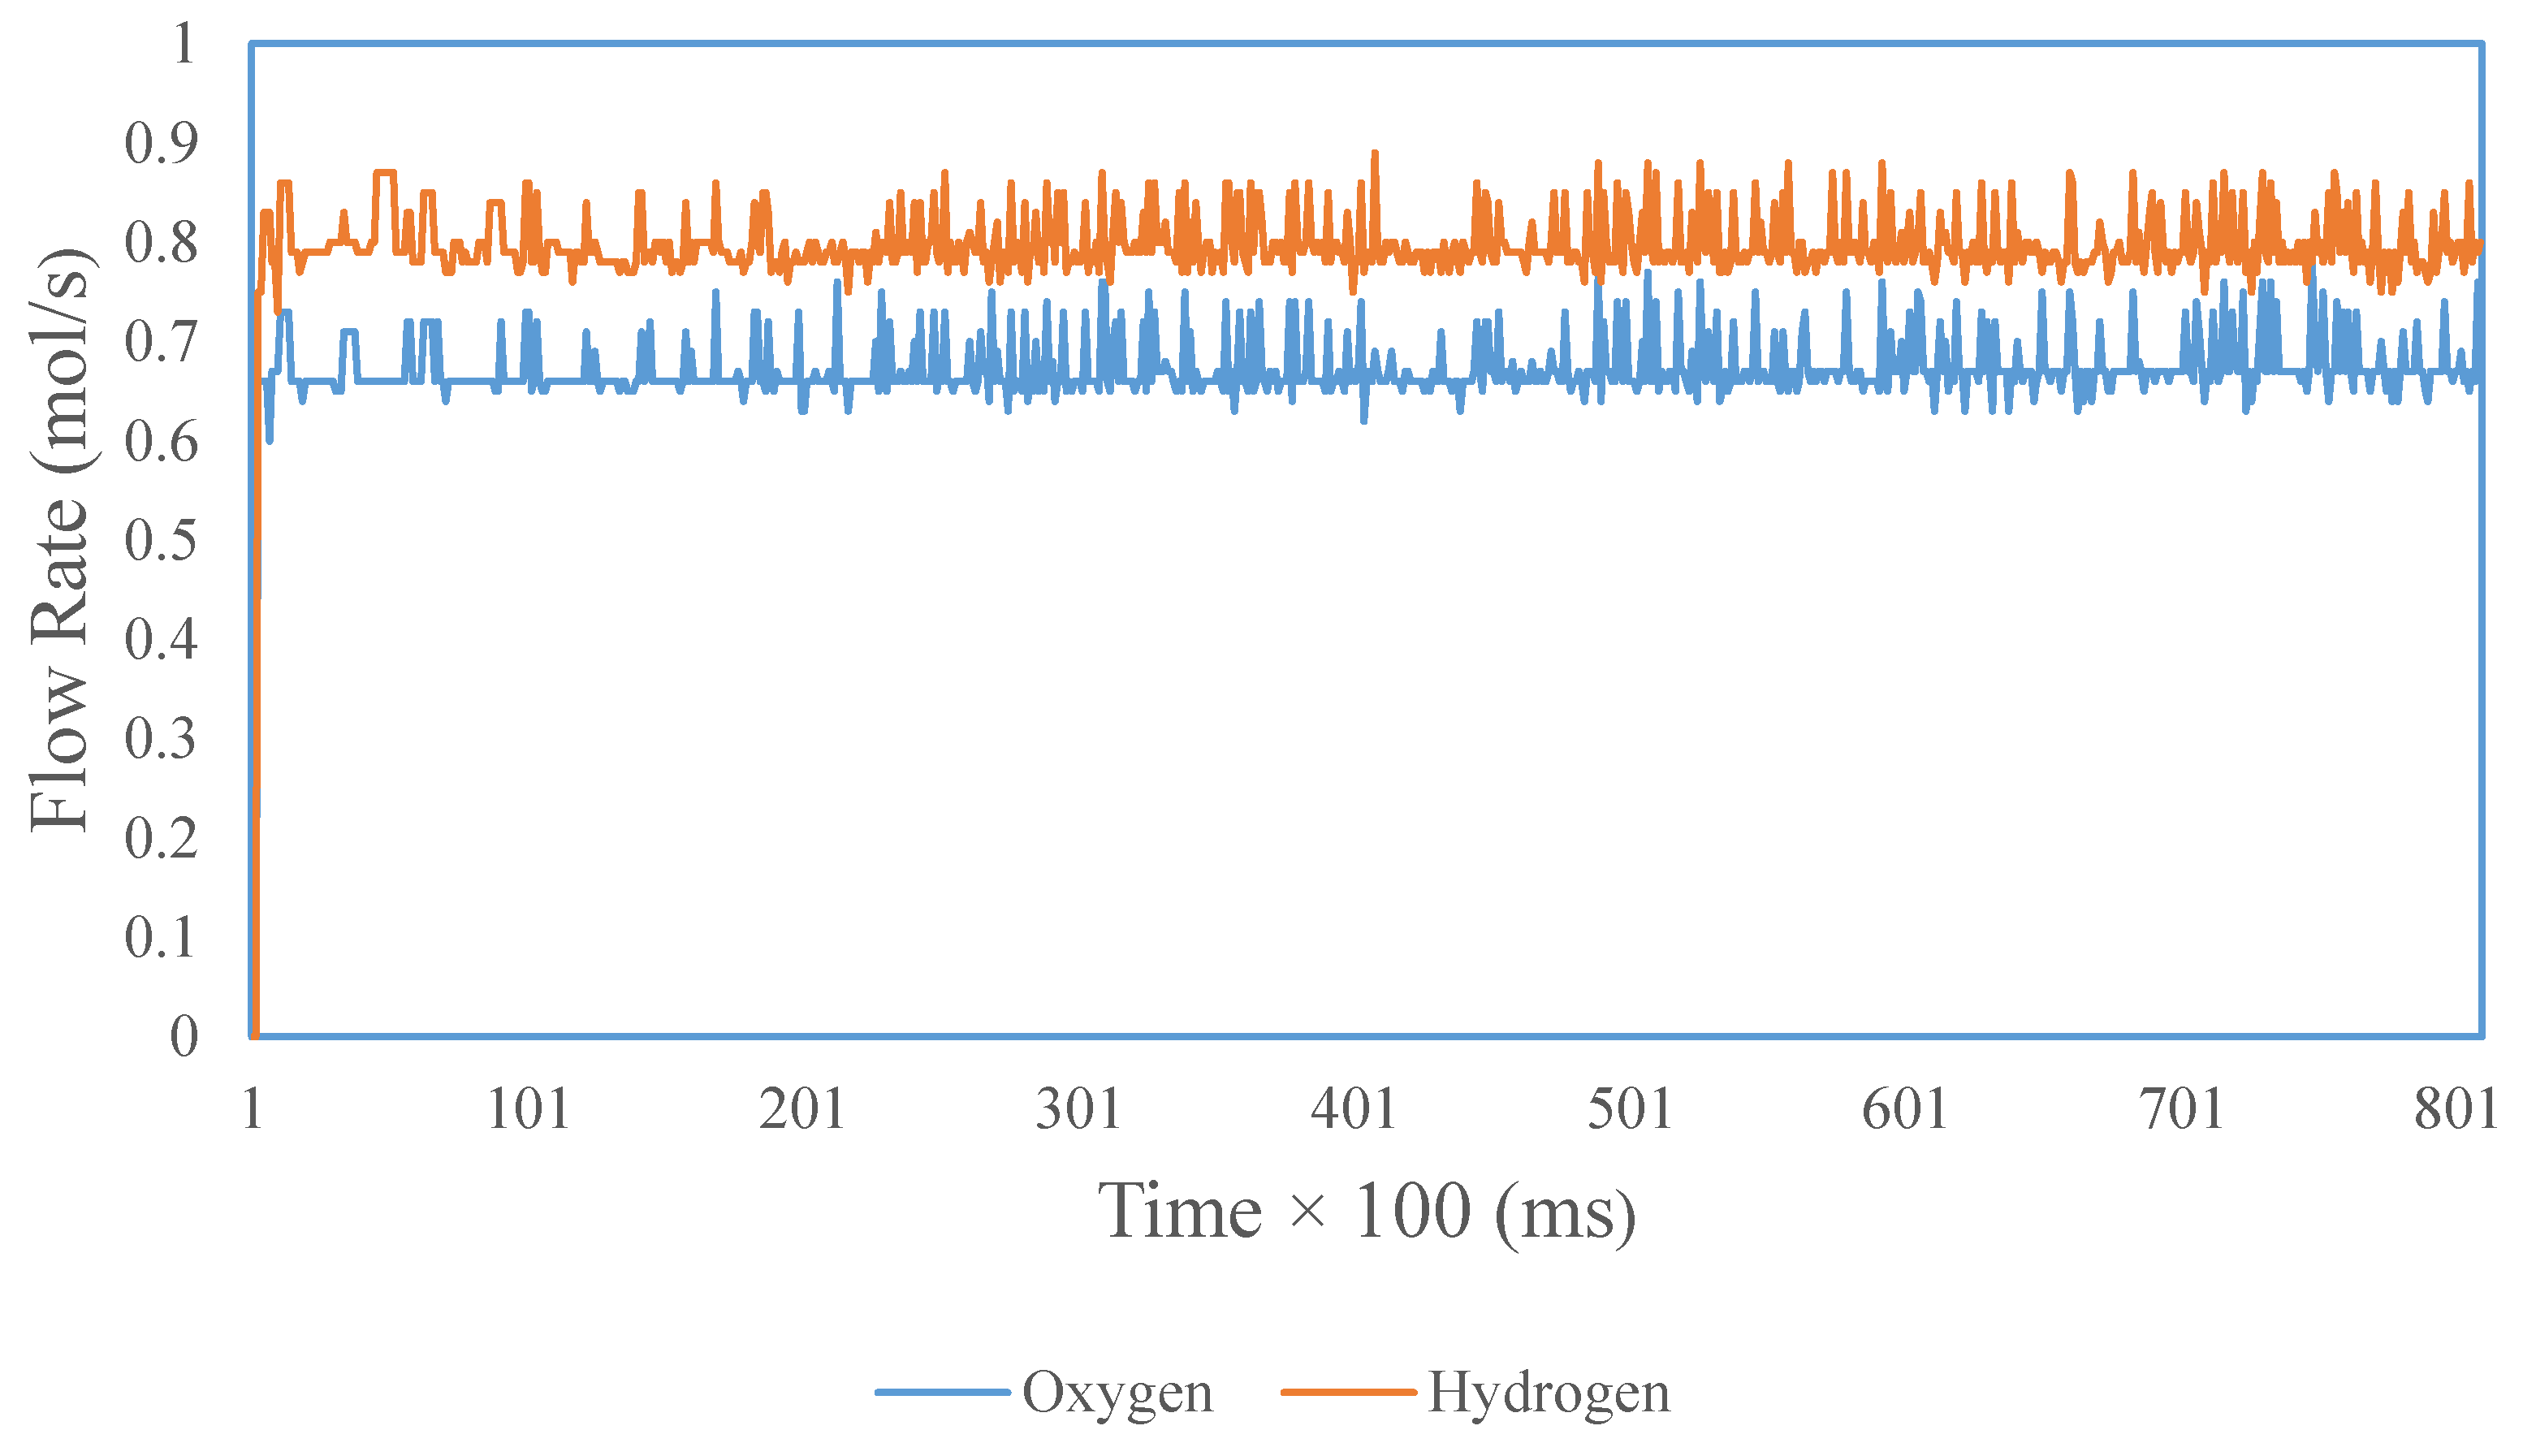
Figure 7. The limit of the
error membership set value is obtained from the maximum voltage value that can be generated by the SOFC simulator when the hydrogen and oxygen flow rates reach 1 mol/s. The limit of the membership set value of ∆
error is then obtained from the most frequent
error value changes.
Rule Base
Rule base in the design is divided into 2 pieces, namely the rule base angle of hydrogen flow rate and oxygen flow rate angle. Determination of the rule base is done by looking at the characteristics of the SOFC simulator when not using a controller.
The rule base parameter values are obtained through tuning with random angle values according to the characteristics of the system. Experiments carried out several times produce the best constant values as shown in
Table 1 and
Table 2. The meaning of the variable “C” is closed, “S” is small, “A” is average, “W” is wide, and “VW” is very wide. The meanings of Z (zero), S (small0, M (medium), H (high), and VH (very high) are variables that are made to facilitate controller programming.
Table 1 is 25 fuzzy rules used for hydrogen flow. As an example; if the error is Negative (Z) & the ∆error is Negative (Z) then the hydrogen flow rate angle is closed (C). The oxygen flow rate angle is closed (C). So in this condition the angle position is at the smallest (closed) in order to stabilize the system.
Table 2 is 25 fuzzy rules used for hydrogen flow. As an example; 25. If the error is Positive (VH) & error is Positive (VH) then the hydrogen flow rate angle is closed (C). The oxygen flow rate angle is closed (C). The oxygen flow rate angle is closed (C). So in this condition the angle position is at the smallest (closed) in order to stabilize the system.
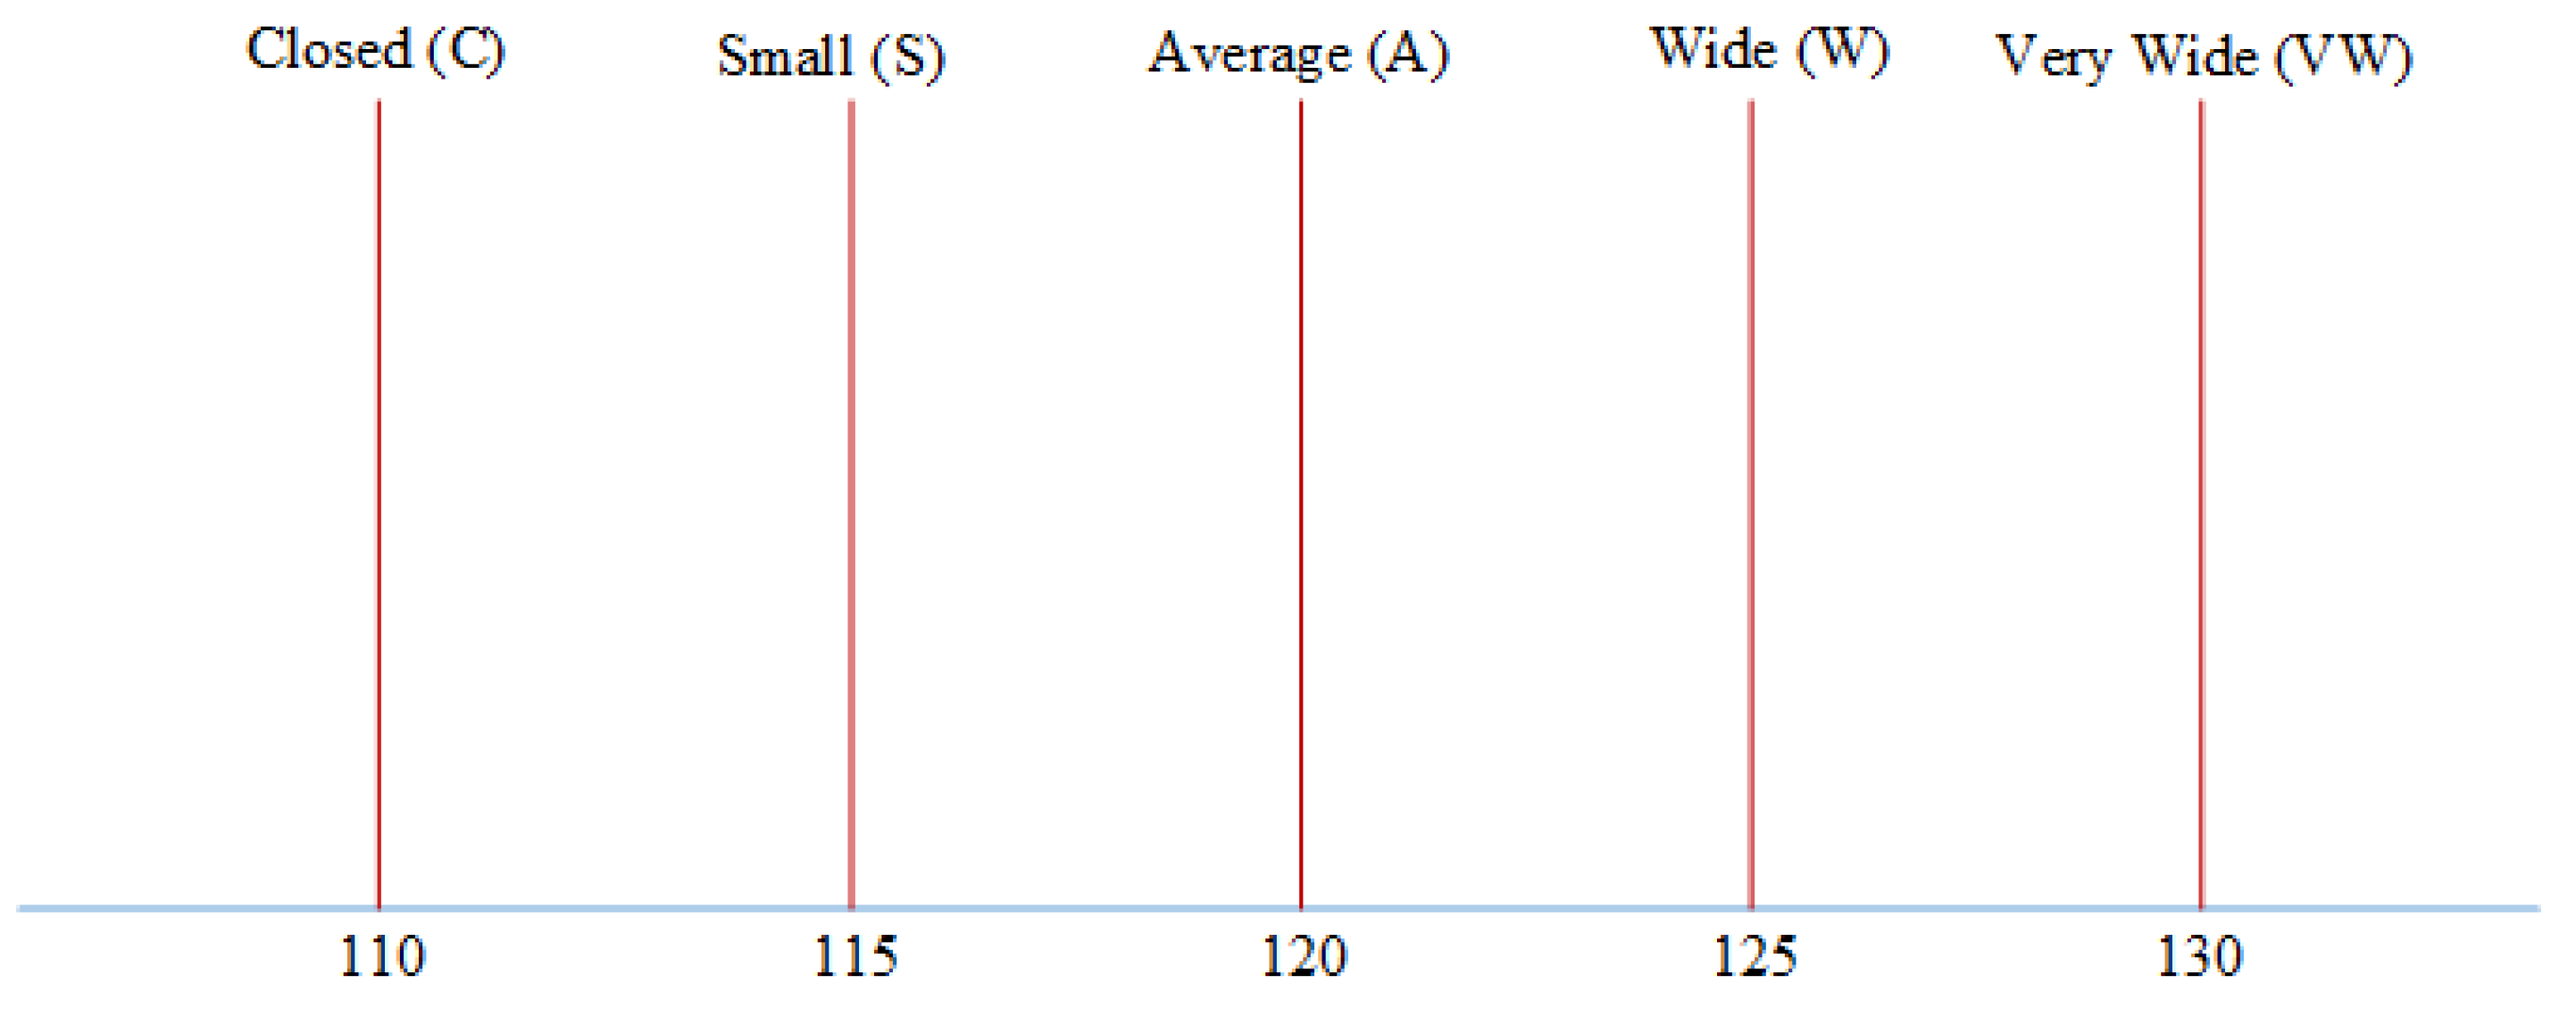
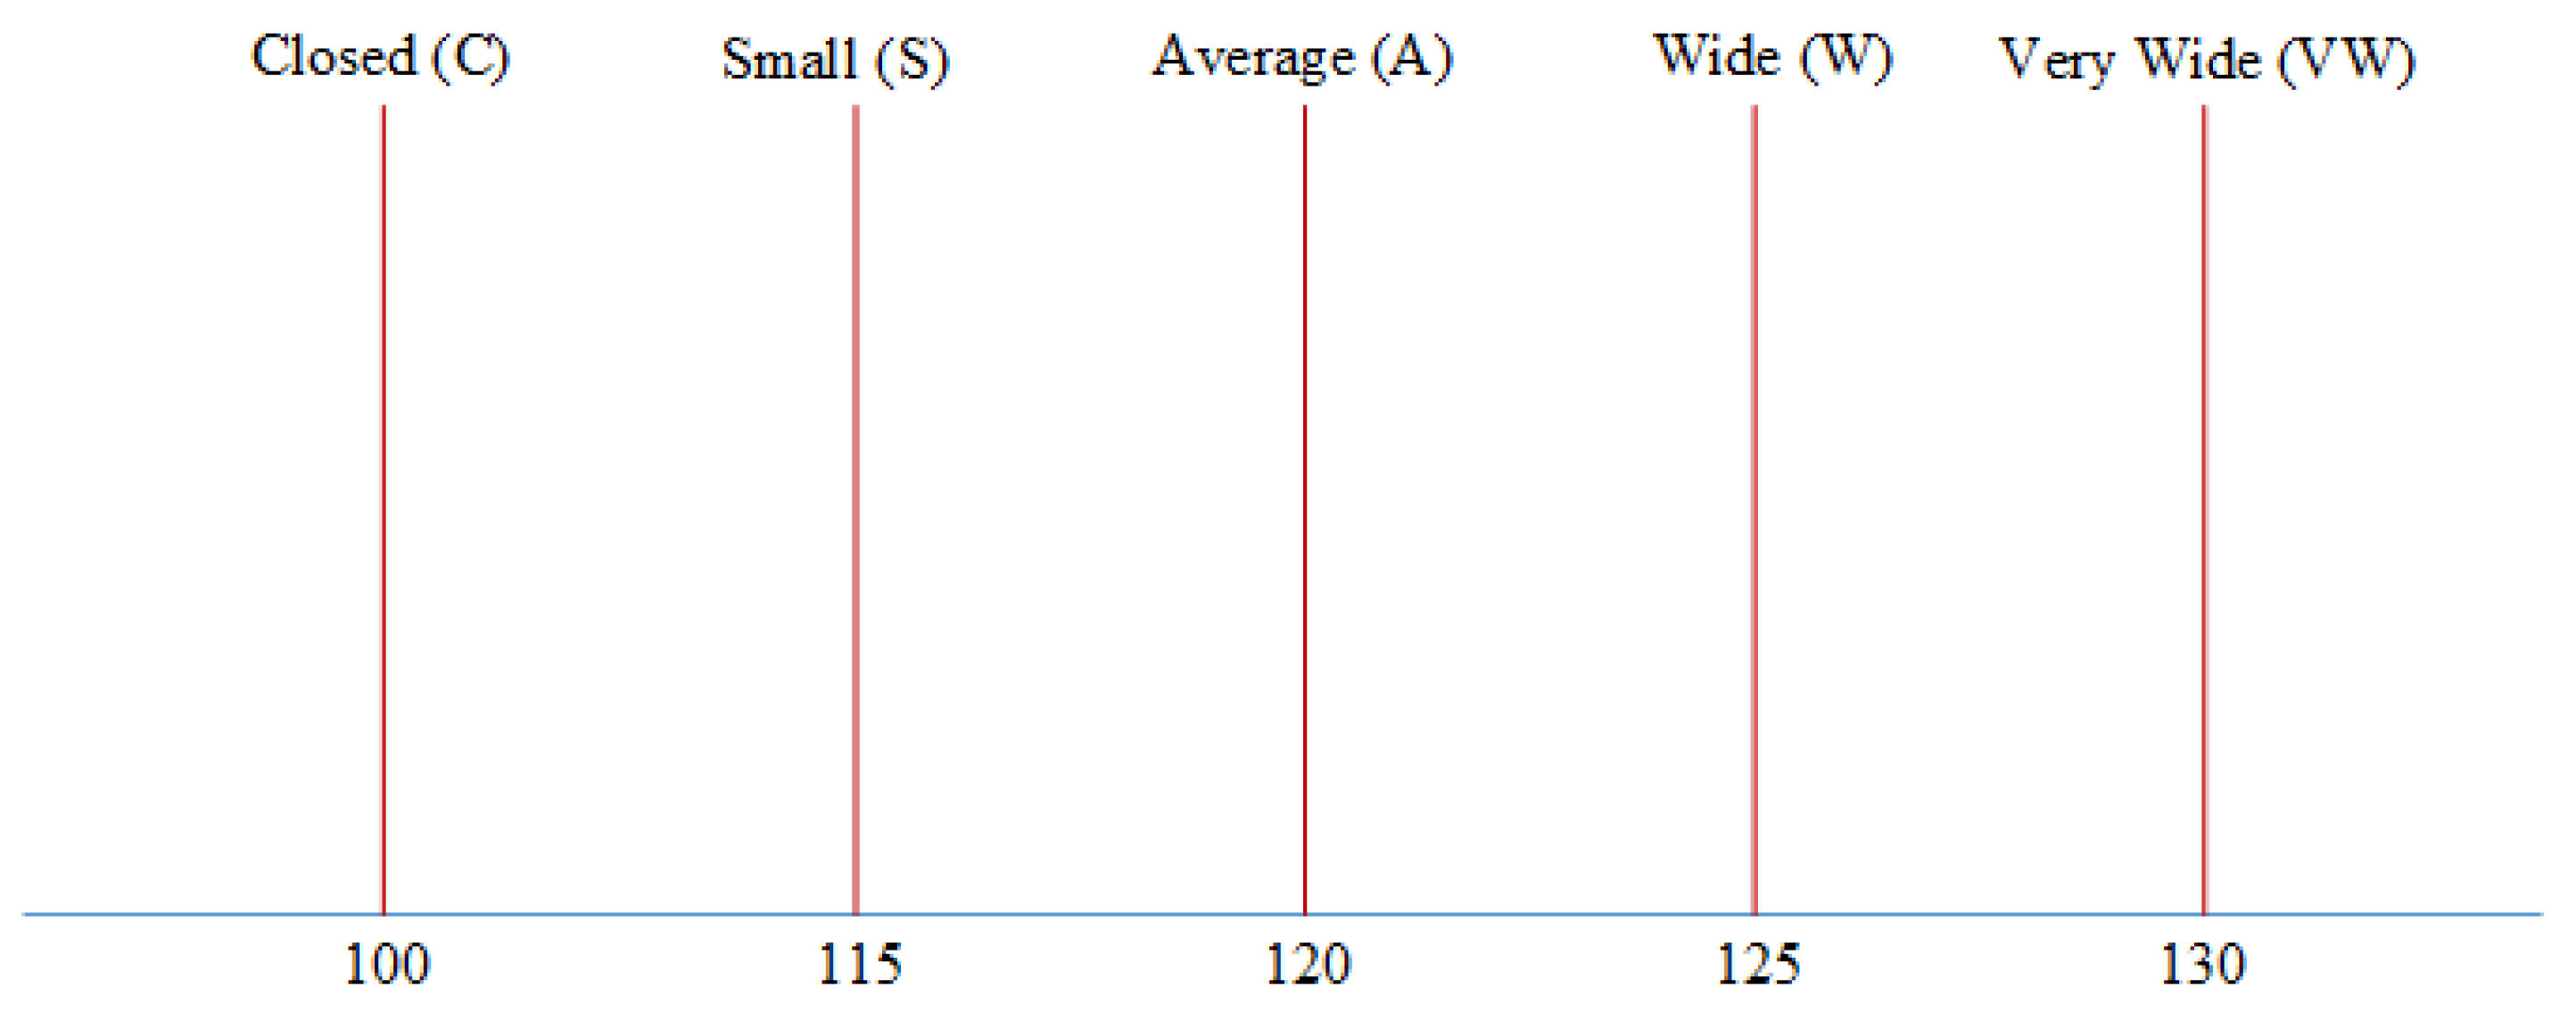
Singleton
This is the real value used to produce the output from FLC hydrogen and oxygen flow rates in the form of valve angles. It uses 2 singleton fruits-1 pieces for valve hydrogen flow rates and 1 piece for valve oxygen flow rates, as shown in
Figure 8 and
Figure 9 below:
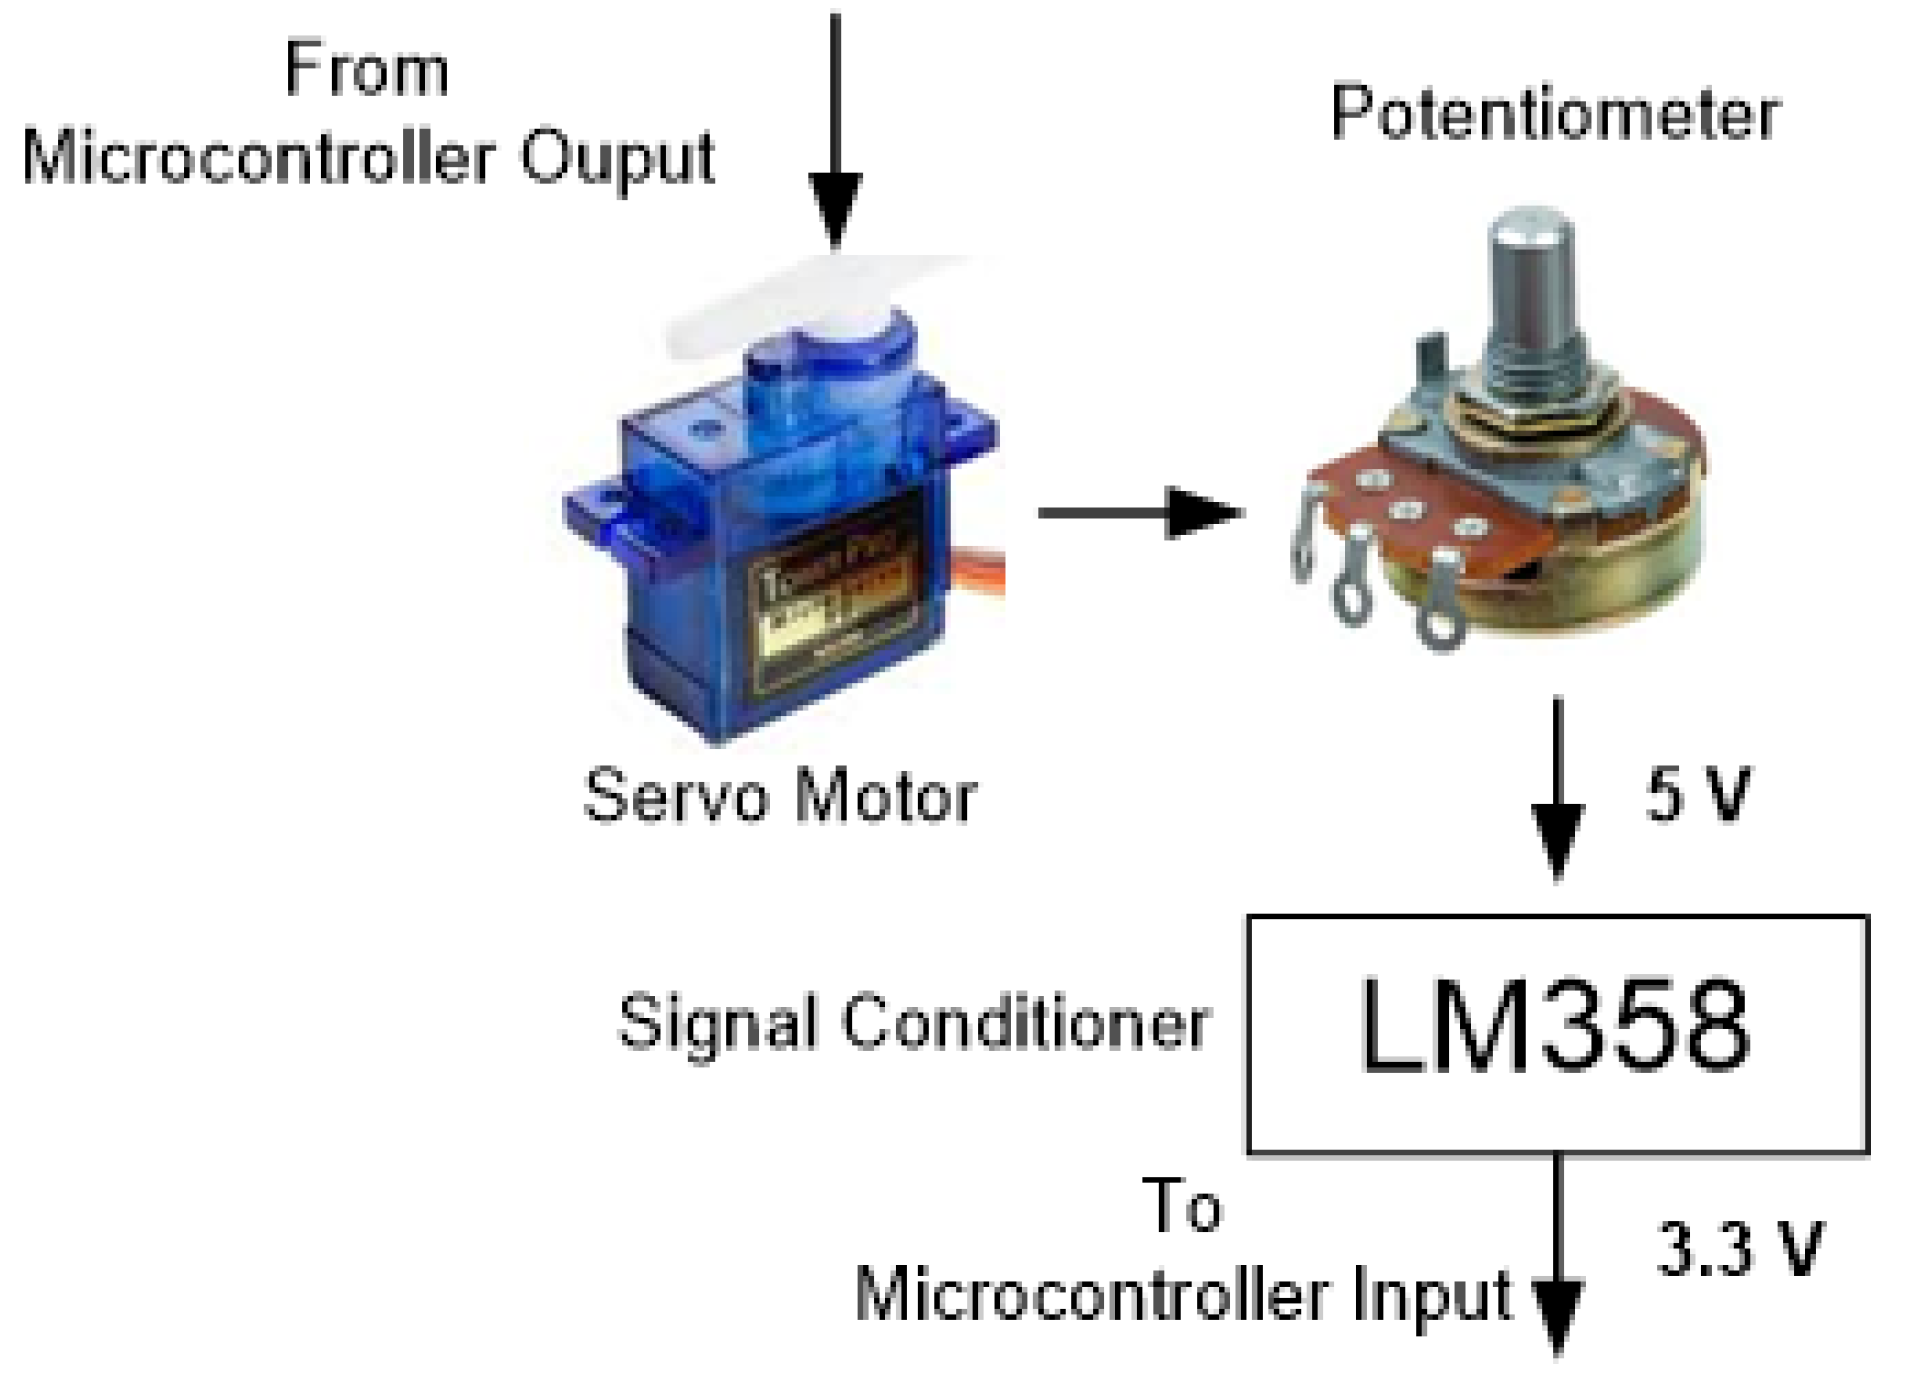
Back in
Figure 2 that the servo motor is used to rotate the potentiometer angle. The angle of the servo motor used is not full 180 degrees There is an offset of about 20 degrees so that the range is only around 150 degrees. By trial and error the best results are obtained for the angles of hydrogen, as shown in
Figure 8. While the best results are for the angles of oxygen, as shown in
Figure 9.
The position of the angles in
Figure 8 and
Figure 9 are the values included in the rule base. Rules base designed with 25 fuzzy rules. Between hydrogen and oxygen there is a difference in angle at the starting point 110 and 100 degrees, respectively.
Defuzzyfication
This is the final stage in designing fuzzy control methods. It uses the Sugeno fuzzy logic method with the weighted average method in order to obtain fuzzy output values for each rule. The weighted average method is carried out by summing each weight with the output value produced, and dividing that by the number of weights as shown below:
2.2.4. SOFC Simulator Model
The characteristics of the simulator include a number of conditions in its design. The SOFC cell stack model will be based on the following assumptions:
- -
Gas is ideal.
- -
The stack is fed with hydrogen and oxygen channels.
- -
Channels that carry gas along the electrode have a fixed volume and a small length, so they only need to determine a single pressure in the interior.
- -
The removal of each channel is through a single orifice.
- -
The temperature is stable at all times.
- -
The only source of loss is ohmic.
- -
The Nernst equation can be applied.
According to [
13], in relation to the characteristics of exhaust of channels, an orifice that is considered choked, when fed with a mixture of average molar gas (kg/kmol) and similar specific heat ratios, at a constant temperature, meets the following characteristics:
where
W is the mass flow [kg/s], K is the valve constant [
, and
Pu is the pressure in the channel.
For the case of the anode, the concept of using
fuel can be introduced, as a comparison between the flow of the reacting fuel and the flow of fuel injected into the stack.
is also a way to express the molar fraction of water at discharge. According to this definition, Equation (2) can be written as
where
is the mass flow through the anode valve [kg/s];
is the anode valve constant
;
,
are the molecular mass of hydrogen and water, respectively [kg/kmol]; Pan is the internal pressure on the anode channel [atm].
If it can be assumed that the molar flow of any gas through the valve is proportional to the partial pressure in the channel, then it can be stated according to the following:
where
,
are the molar flows of hydrogen and water through the anode valve [kmol/s];
,
are partial pressures of hydrogen and water [atm];
,
are hydrogen and water valve molar constants (kmol/(s atm)).
The design parameters of the simulator process are needed to calculate the value of the plant output. All of these are assumed as shown in
Table 3.
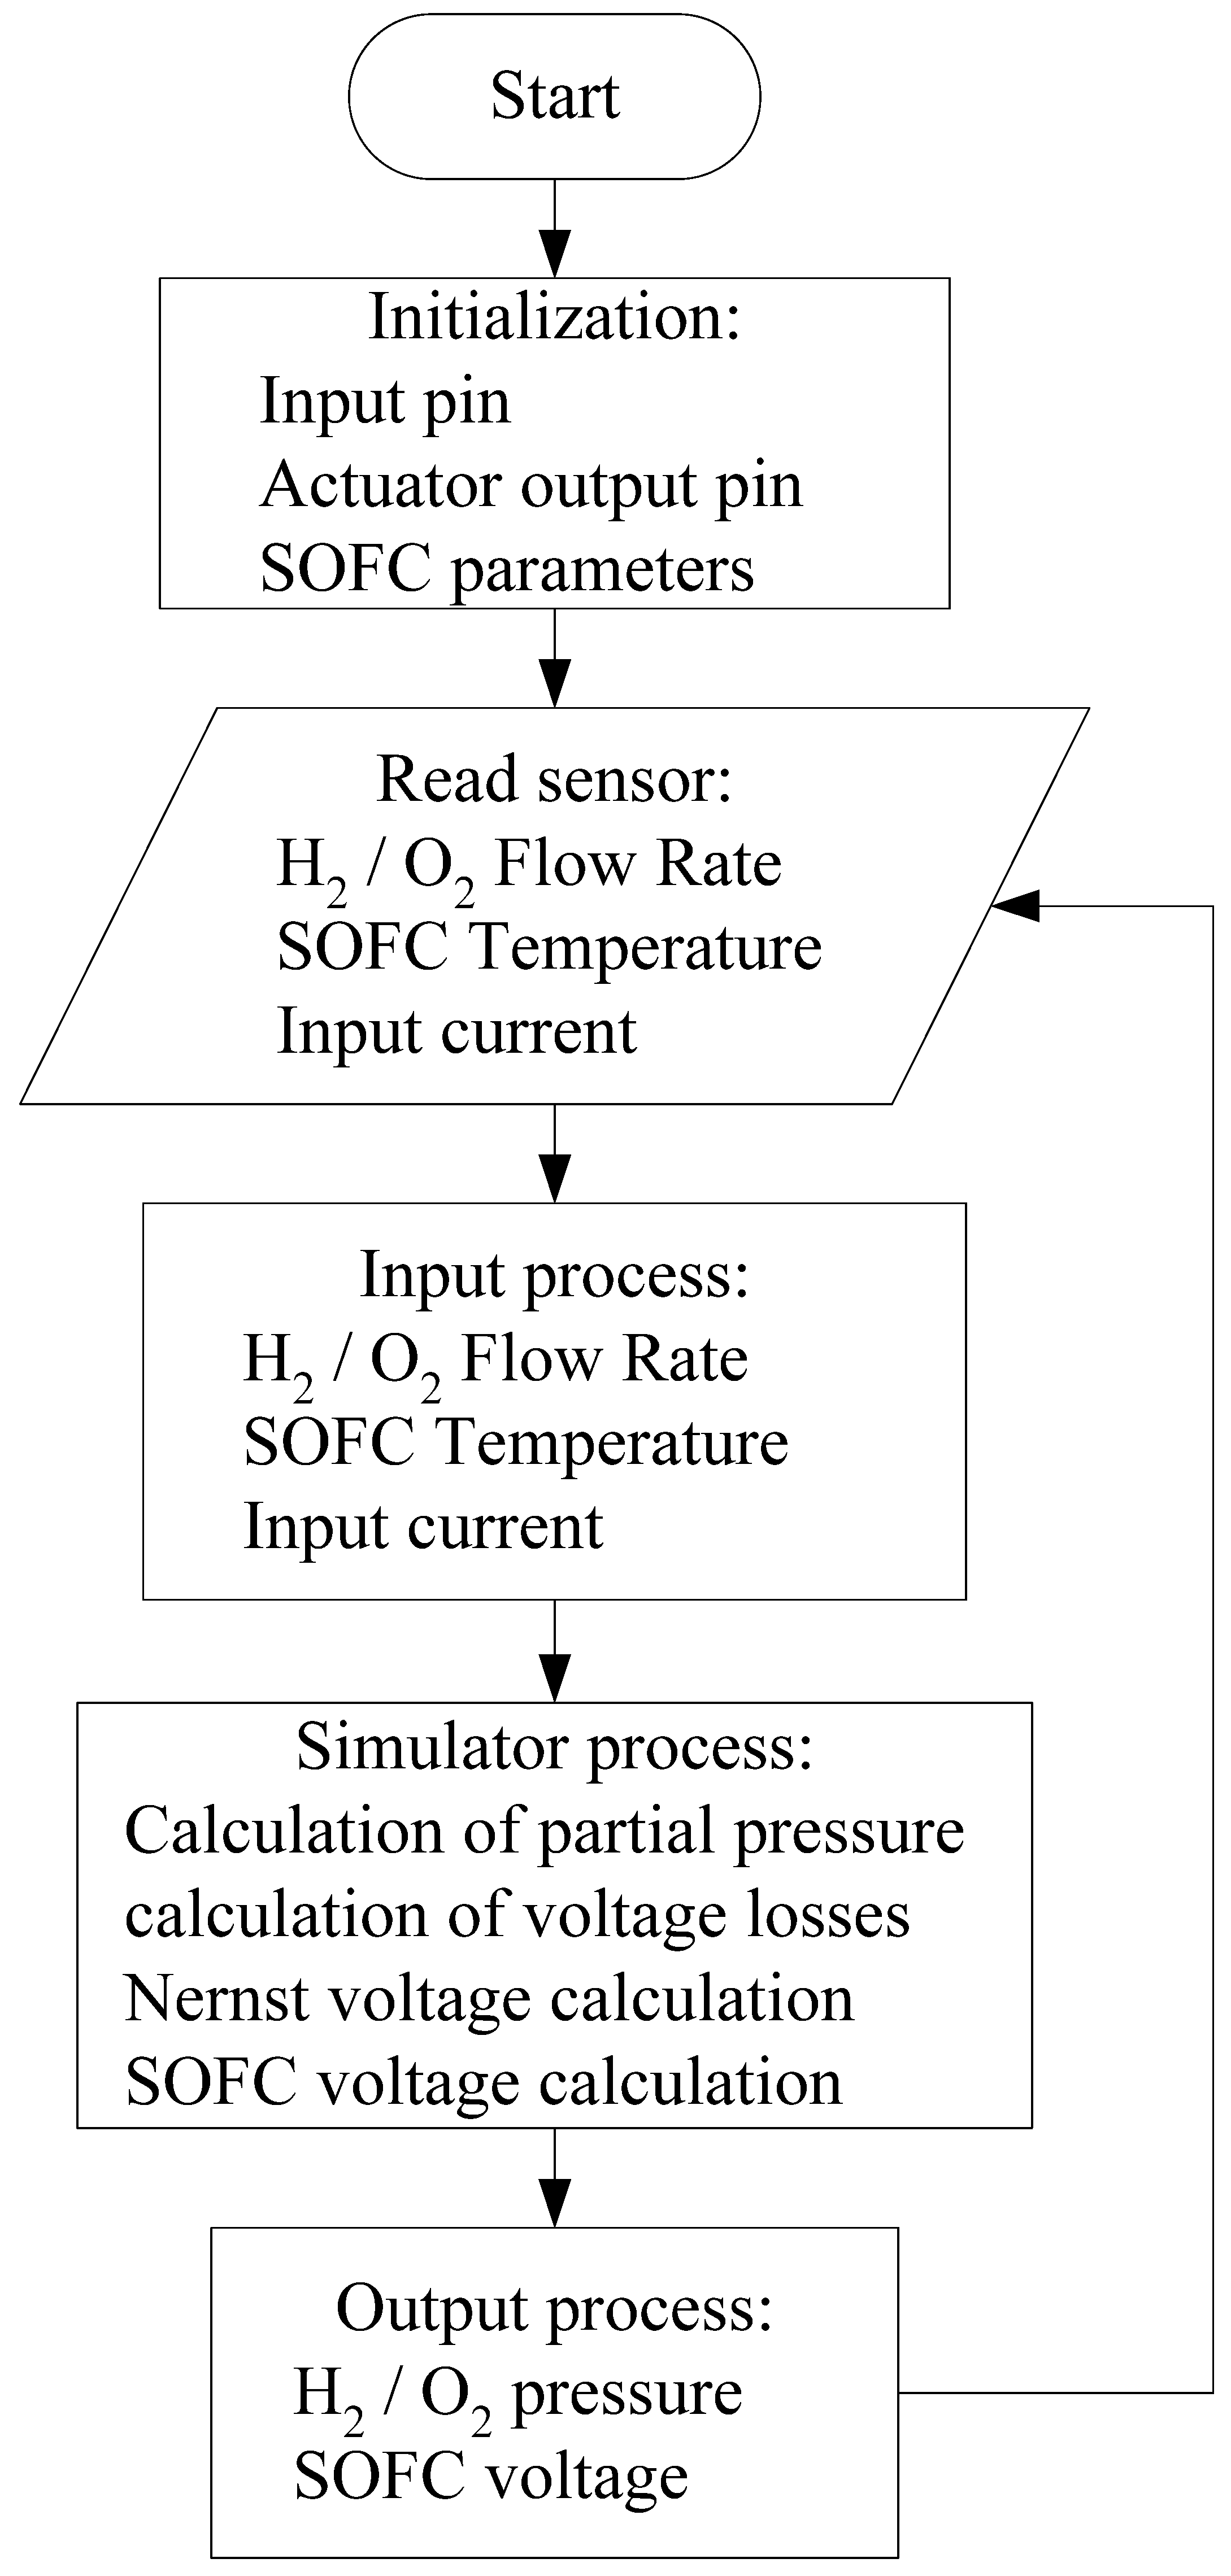
Partial pressure is calculated based on Equations (6), (8), and (10), while calculating the prototype of the SOFC simulator [
7,
13]. This equation is still in the form of a transfer function. In the use of a microcontroller, the equation must be converted into a time equation that is to be converted into C programming language. An equation is used to find the partial pressure value of H
2:
It is then transformed in reverse to its time version as shown below:
Next, it is made discrete by the method of backward differences, so the value of the H
2 partial pressure equation can be obtained based on the time changes:
The description of H
2 partial pressure calculation from Equation (5) resulted in the application of the equation
in C language with
and
.
Equation (7) is used to find the value of the partial pressure of H
2O with the description as follows:
It is then transformed reversely into the time equation as shown below:
Next, it is made discrete by the backward difference to obtain the value of the H
2O partial pressure, as shown below:
The description of partial pressure calculation of H2O from Equation (7) resulted in the application of the equation in C language with and .
This then forms Equation (9), which is used to calculate the O
2 partial pressure value, as follows:
For example,
It is then transformed reversely into
This is then discredited by the backward difference method to obtain the equation for O
2 partial pressure as shown below:
The above equation then resulted into the equation , which is to be applied in C language with and F.
Usually, the real output voltage may be reduced because of ohmic, activation, and concentration losses. The SOFC simulator process calculation has voltage losses consisting of
Vohmic,
Vact, and
Vconc, and these are expressed mathematically by Equations (12)–(14) [
7,
14].
where
I is the load current or SOFC output current. The SOFC output voltage can be calculated based on the following equation:
where
is the Nernst voltage equation, which is given as
where
E0 is the voltage associated with the reaction free energy (V),
R is the gas constant [J/kmol K], and
Ncell is the number of cells.


