Communication

Enhancing the Pore Properties and Adsorption Performance of Cocoa Pod Husk (CPH)-Derived Biochars via Post-Acid Treatment

1
Graduate Institute of Bioresources, National Pingtung University of Science and Technology, Pingtung 912, Taiwan
2
Department of Environmental Science and Engineering, National Pingtung University of Science and Technology, Pingtung 912, Taiwan
3
Department of Chemical and Materials Engineering, National Yunlin University of Science and Technology, Yunlin 640, Taiwan
4
Kaohsiung District Agricultural Research and Extension Station, Council of Agriculture, Pingtung 908, Taiwan
*
Author to whom correspondence should be addressed.
Processes 2020, 8(2), 144; https://doi.org/10.3390/pr8020144
Submission received: 31 December 2019 / Revised: 17 January 2020 / Accepted: 20 January 2020 / Published: 22 January 2020
(This article belongs to the Special Issue Carbonaceous Materials for CO2 Capture and Pollutants Removal)

Abstract

:
In this work, the cocoa pod husk (CPH) was converted into biochar products at higher carbonization temperatures (i.e., 400–800 °C). The pore and chemical properties of the resulting biochars and its post-leaching biochars by acid washing, including specific surface area, total pore volume, pore size distribution, true density, and scanning electron microscopy-energy dispersive X-ray spectroscopy (SEM-EDS) and Fourier Transform infrared spectroscopy (FTIR) were studied. Based on the pore properties, pyrolysis temperature at around 800 °C seemed to have the most profound impact on the pore development for producing biochar, where its Brunauer–Emmet–Teller (BET) surface area is 101 m2/g. More noticeably, more pores in the CPH-based biochar could be significantly created during the acid-washing, resulting in an increase of BET surface area from 101 to 342 m2/g. According to the data on the EDS and FTIR, the resulting biochars seemed to have oxygen-containing functional groups on the surface. Furthermore, the methylene blue (MB) adsorption performance of the optimal biochar product with maximal BET surface area was tested to fit its kinetics by the pseudo-second order model, showing a strong interaction between the biochar adsorbent and the cationic adsorbate.

1. Introduction

As the consumptions of cocoa bean and chocolate-related products (e.g., cakes, beverages and powders) became more and more widespread around the world, these significantly resulted in the spread of cultivation of cocoa (Theobroma cacao L.), including Central/South America, West Africa and Southeast Asia. According to the statistical databank by the International Cocoa Organization (ICCO) [1], the seven largest cocoa-producing countries at present are Côte d’Ivoire (Ivory Coast), Ghana, Indonesia, Nigeria, Cameroon, Brazil and Ecuador. The African region accounted for approximately 73% of production of cocoa beans in 2013/2014 based on the ratio of 3199 thousand tonnes (Africa) to 4373 thousand tonnes (world total). Côte d’Ivoire is the world’s leading exporter of cocoa beans, representing 39.9% of global net exports, followed by Ghana (20.5%) and Indonesia (8.6%). These tropical countries are suitable for the cocoa plantation because the cocoa tree can only grow at warm temperatures. In addition, soil and manures also determine the geographical distribution of cocoa cultivation. When harvesting cocoa beans, it involves removing ripe pods from the trees and opening them to extract the wet beans, further undergoing fermentation and drying processes before being bagged for export or delivery. However, some cocoa-derived by-products will be generated during the post-harvesting period. Among them, cocoa pod husk (CPH) should be the most important part due to its high proportion by weight [2,3]. It was reported that the ratio of CPH to cocoa beans may be up to 10 times by mass [4]. Thus, over ten million tons of CPH could be generated every year [5].
In the past, CPH was considered as a natural fertilizer to turn its lignocellulosic materials and minerals into the soils, but this reuse can cause black pod disease and environmental foul odors [2]. Alternatively, there are some utilization approaches without reusing it as a soil amendment [3], including feed ingredient for poultry and livestock, source of alkali for soap manufacturing and potash fertilizer. Due to its abundance of lignocellulosic compositions, this agricultural by-product was studied in recent years to reuse it as biomass fuel for boilers [6,7], filling matrix for biocomposites [8,9], biosorbent or adsorbent for removal of pollutants from water [10,11,12,13], and precursor for the production of carbon materials (i.e., biochar, activated carbon) and bio-oils [14,15,16,17]. In the previous study for converting CPH into energy-use biochar [15], a series of biochar products were prepared at mild pyrolysis (torrefaction) conditions (i.e., 190–370 °C for holding times of 30–120 min) in a horizontal electric oven. The CPH-based biochar indicated a lignite-like feature based on the thermochemical characteristics with carbon content (>60 wt%) and calorific value (>25 MJ/kg). In the study by Adjin-Tetteh et al. [17], the authors investigated the pyrolysis of CPH in a kiln reactor set between 550 and 600 °C at a high heating rate (400 °C/min). In order to produce the high-value added chemicals from the Ghanaian CPH in the fast pyrolysis, the main purpose was to characterize the resulting bio-oils by several instruments, including gas chromatography–mass spectrometery (GC-MS), Fourier-transform infrared spectroscopy (FTIR), Karl–Fisher titrator, viscometer, pH meter, densitometer, and X-ray fluorescence (XRF).
Pyrolysis is the thermochemical process under oxygen-limiting atmosphere for converting biomass into pyrolytic products at temperatures between 300 and 700 °C [18]. It is proposed as a feasible strategy to mitigate climate change because the biodegradable carbon in the lignocellulosic biomass has been reformed into the stable carbon in the resulting biochar product (i.e., carbon sequestration). Furthermore, biochar can be reused as a sustainable soil amendment to improve soil fertility and mitigate emissions of greenhouse gases (i.e., CO2 and CH4) [19]. It is well known that biochar can improve soil fertility by the confirmed benefits, including reduced leaching of nitrogen into ground water, increased cation-exchange capacity in soil, moderating of soil acidity, enhanced water retention, and increased number of beneficial soil microbes [20]. Therefore, the application of biochar to soil will upgrade its physical, chemical and biological properties, resulting in greater productivity of the fruits, crops and vegetables [21].
The ash content in the CPH can range from 8% to 16% [7,15,17,22]. More significantly, the dominant inorganic element is potassium (K), accounting for about 50% in the CPH ash. On the other hand, the pore properties of biochar (i.e., specific surface area and pore volume) play a vital role in being used as a biosorbent for removing pollutants from the soil medium and water environment. Although biochar with a larger specific surface area (SSA) can be obtained at higher pyrolysis temperatures [23], its SSA value was almost less than 100 m2/g. Expectably, these inorganic minerals in the biochar could have a negative impact on its pore properties. In this work, the CPH-based biochar products were produced at different temperatures (i.e., 400–800 °C) held for 30 min. Then, they were further leached with 0.25 M acid solution (HCl) to dissolve the minerals from the carbon-rich matrix. In order to compare the results of the pore and chemical properties between them, the resulting biochar and its acid-washed one were analyzed by the N2 adsorption–desorption isotherms, scanning electron microscopy-energy dispersive X-ray spectroscopy (SEM-EDS) and Fourier Transform infrared spectroscopy (FTIR). Subsequently, the optimal biochar product was taken to perform its adsorptive removal of methylene blue (MB) from water at different MB concentrations by the proper kinetic model.

2. Materials and Methods

2.1. Materials

The precursor CPH in the biochar production was taken from a cocoa plantation farm (Pingtung, Taiwan). Because the wet CPH is liable to deterioration and malodor generated, the precursor sample was exposed to solar radiation and then put into a hot-air circulating oven for several days. Subsequently, this dried CPH was broken by a blade crusher and further screened to take the target range from 20 to 40 mesh No. (The opening sizes of the sieve are 0.841 and 0.400 mm, respectively.). The dried and sieved CPH was fed to a vertical carbonization furnace for the pyrolysis experiments. Regarding the relevant elements of CPH, the previous study showed the contents of carbon (C) and potassium (K) with 46.65% and 4.03%, respectively [15]. On the other hand, the thermal degradation behaviors of CPH were previously evaluated by a thermogravimetric analyzer at 5 and 10 °C/min [15], indicating an onset carbonization at above 400 °C.

2.2. Pyrolysis and Post-Acid Treatment Experiments

Among the carbonization conditions that influence the pore properties of biochar, the pyrolysis temperature could be the most important process parameter [24]. According to the results previously studied [15,25], the CPH-based biochar products (denoted as CPH-BC-400, CPH-BC-500, CPH-BC-600, CPH-BC-700 and CPH-BC-800) were produced under a nitrogen flow (500 cm3/min) atmosphere at the following carbonization conditions: temperatures of 400–800 °C, residence time of 30 min and heating rate of 10 °C/min. Using 10 g for each pyrolysis experiment, the yields of the CPH-based biochar products showed the values ranging from 40.70% at 400 °C to 30.22% at 800 °C. Subsequently, the biochar products (i.e., CPH-BC-400 and CPH-BC-800) were separately mixed with 0.25 M HCl (Merck Co., Darmstadt, Germany) solution (about 100 cm3) on a hot-plate where the solution was heated to about 75 °C for 30 min. Finally, the solution was further washed by deionized water (100 cm3) three times to remove the minerals and residual impurities like chlorides. The acid-washed biochar products were denoted as CPH-BC-400-AW and CPH-BC-800-AW, respectively. Prior to the measurements and/or observations of pore and chemical properties, these resulting biochar products were dried at about 105 °C overnight and then stored at a desiccator (Ching-Fa Co., Hsinchu, Taiwan).

2.3. Characterization of Resulting Biochar

The pore properties of the resulting biochar products, including SSA, pore volume and average pore width, were determined by their N2 adsorption–desorption isotherms at −196 °C on the surface area and porosity analyzer (Micromeritics ASAP 2020, Norcross, GA, USA). Before the measurement, the biochar samples were degassed at a heating profile (heated at 10 °C/min up to 200 °C for holding 480 min) in a vacuum. Herein, the SSA (SBET) was obtained on a basis of the Brunauer–Emmett–Teller (BET) theory, which was calculated at the approximate relative pressure (P/P0) range from 0.05 to 0.30 [26]. The total pore volume of resulting biochar (Vt) was calculated by assuming that, in the range 0.95 < P/P0 < 1, all pores in the biochar sample were filled with condensed nitrogen gas [27]. The pore width is defined as the diameter in case of the cylindrical pores with open-ended and non-intersecting geometry. Using the values of total pore volume (Vt) and BET surface area (SBET), the average width of pore (DAVE) can be roughly obtained by the following equation [28,29]:
DAVE = 4 Vt/SBET.
Due to the mesoporous feature of resulting biochar (i.e., CPH-BC-800), the Barrett–Joyner–Halenda (BJH) method was used to determine the pore size distribution based on the adsorption branch of N2 adsorption–desorption isotherms by the modified Kelvin equation [27]. On the other hand, its true density (ρs) was measured by using a helium gas pycnometer (Micromeritics AccuPyc 1340, Norcross, GA, USA) for the porosity of resulting biochar (i.e., the ratio of total pore volume to apparent volume, εp). Subsequently, the particle density (ρp) (sometimes called as apparent density) was thus obtained by the values of Vt and ρs according to the following equation [28,29]:
ρp = 1/[Vt + (1/ρs)].
Based on the definitions of ρs and ρp, the porosity of resulting biochar (εp) can be further calculated by the following relationship [28,29]:
εp = 1 − (ρps).
In order to elucidate the variations on the pore and chemical properties of resulting biochar with relation to the impacts of pyrolysis temperature and acid-leaching, the surface structure and elemental contents of the biochar sample were analyzed by using a scanning electron microscopy—energy dispersive X-ray spectroscopy (Hitachi S-3000N, Tokyo, Japan) with operating at a 15.0 kV accelerating potential. The surface of the sample was first coated with a conductive gold film using an ion sputter coater (Hitachi E1010) before observing the SEM. In addition, the thermogravimetric analysis (TGA) of the optimal biochar (i.e., CPH-BC-800) and its acid-washed product (i.e., CPH-BC-800-AW) was tested to evaluate the variations on mass loss with temperature. Furthermore, the functional oxygen-containing groups on the surface of resulting biochar were measured in the range 400–4000 cm−1 by the Fourier infrared spectrometer (JASCO FT/IR-4600, Tokyo, Japan). Prior to the FTIR measurement, the biochar sample was mixed with IR-grade potassium bromide (KBr) to generate pellet disc (about 0.1 wt% biochar) by a hydraulic press.

2.4. Adsorption Experiments

Referring to the previous study [25], the adsorption kinetics of the optimal biochar (i.e., CPH-BC-800-AW) was preliminarily tested in an agitating tank for the removal of methylene blue (MB) from 2 L of aqueous solution. The adsorption conditions were fixed at the solution temperature of 25 °C biochar dosage of 0.3 g and agitation speed of 200 rpm, but changed in the initial MB concentrations (i.e., Co = 5, 10, and 15 mg/L). Each aliquot solution (about 10 cm3) was sampled at 0.5, 1, 5, 10, 20, 30, 40, 50 and 60 min during the adsorption experiments. The analysis of MB concentration (i.e., Ct), was determined by a UV/Visible spectrophotometer (U-2900, Hitachi Co., Tokyo, Japan) at 661 nm. The amount of MB (qt, mg/g) adsorbed at the sampling time (t) was calculated by the following equation:
qt = V(Co − Ct)/m,
where m is biochar mass (i.e., 0.3 g), V is solution volume (i.e., 2 L), Co is initial MB concentration (mg/L) and Ct is residual MB concentration at sampling time (t). In this work, the adsorbed MB amount at equilibrium was calculated by the fitting of the commonly used equation (i.e., pseudo second-order kinetic model), which will be more discussed later.

3. Results and Discussion

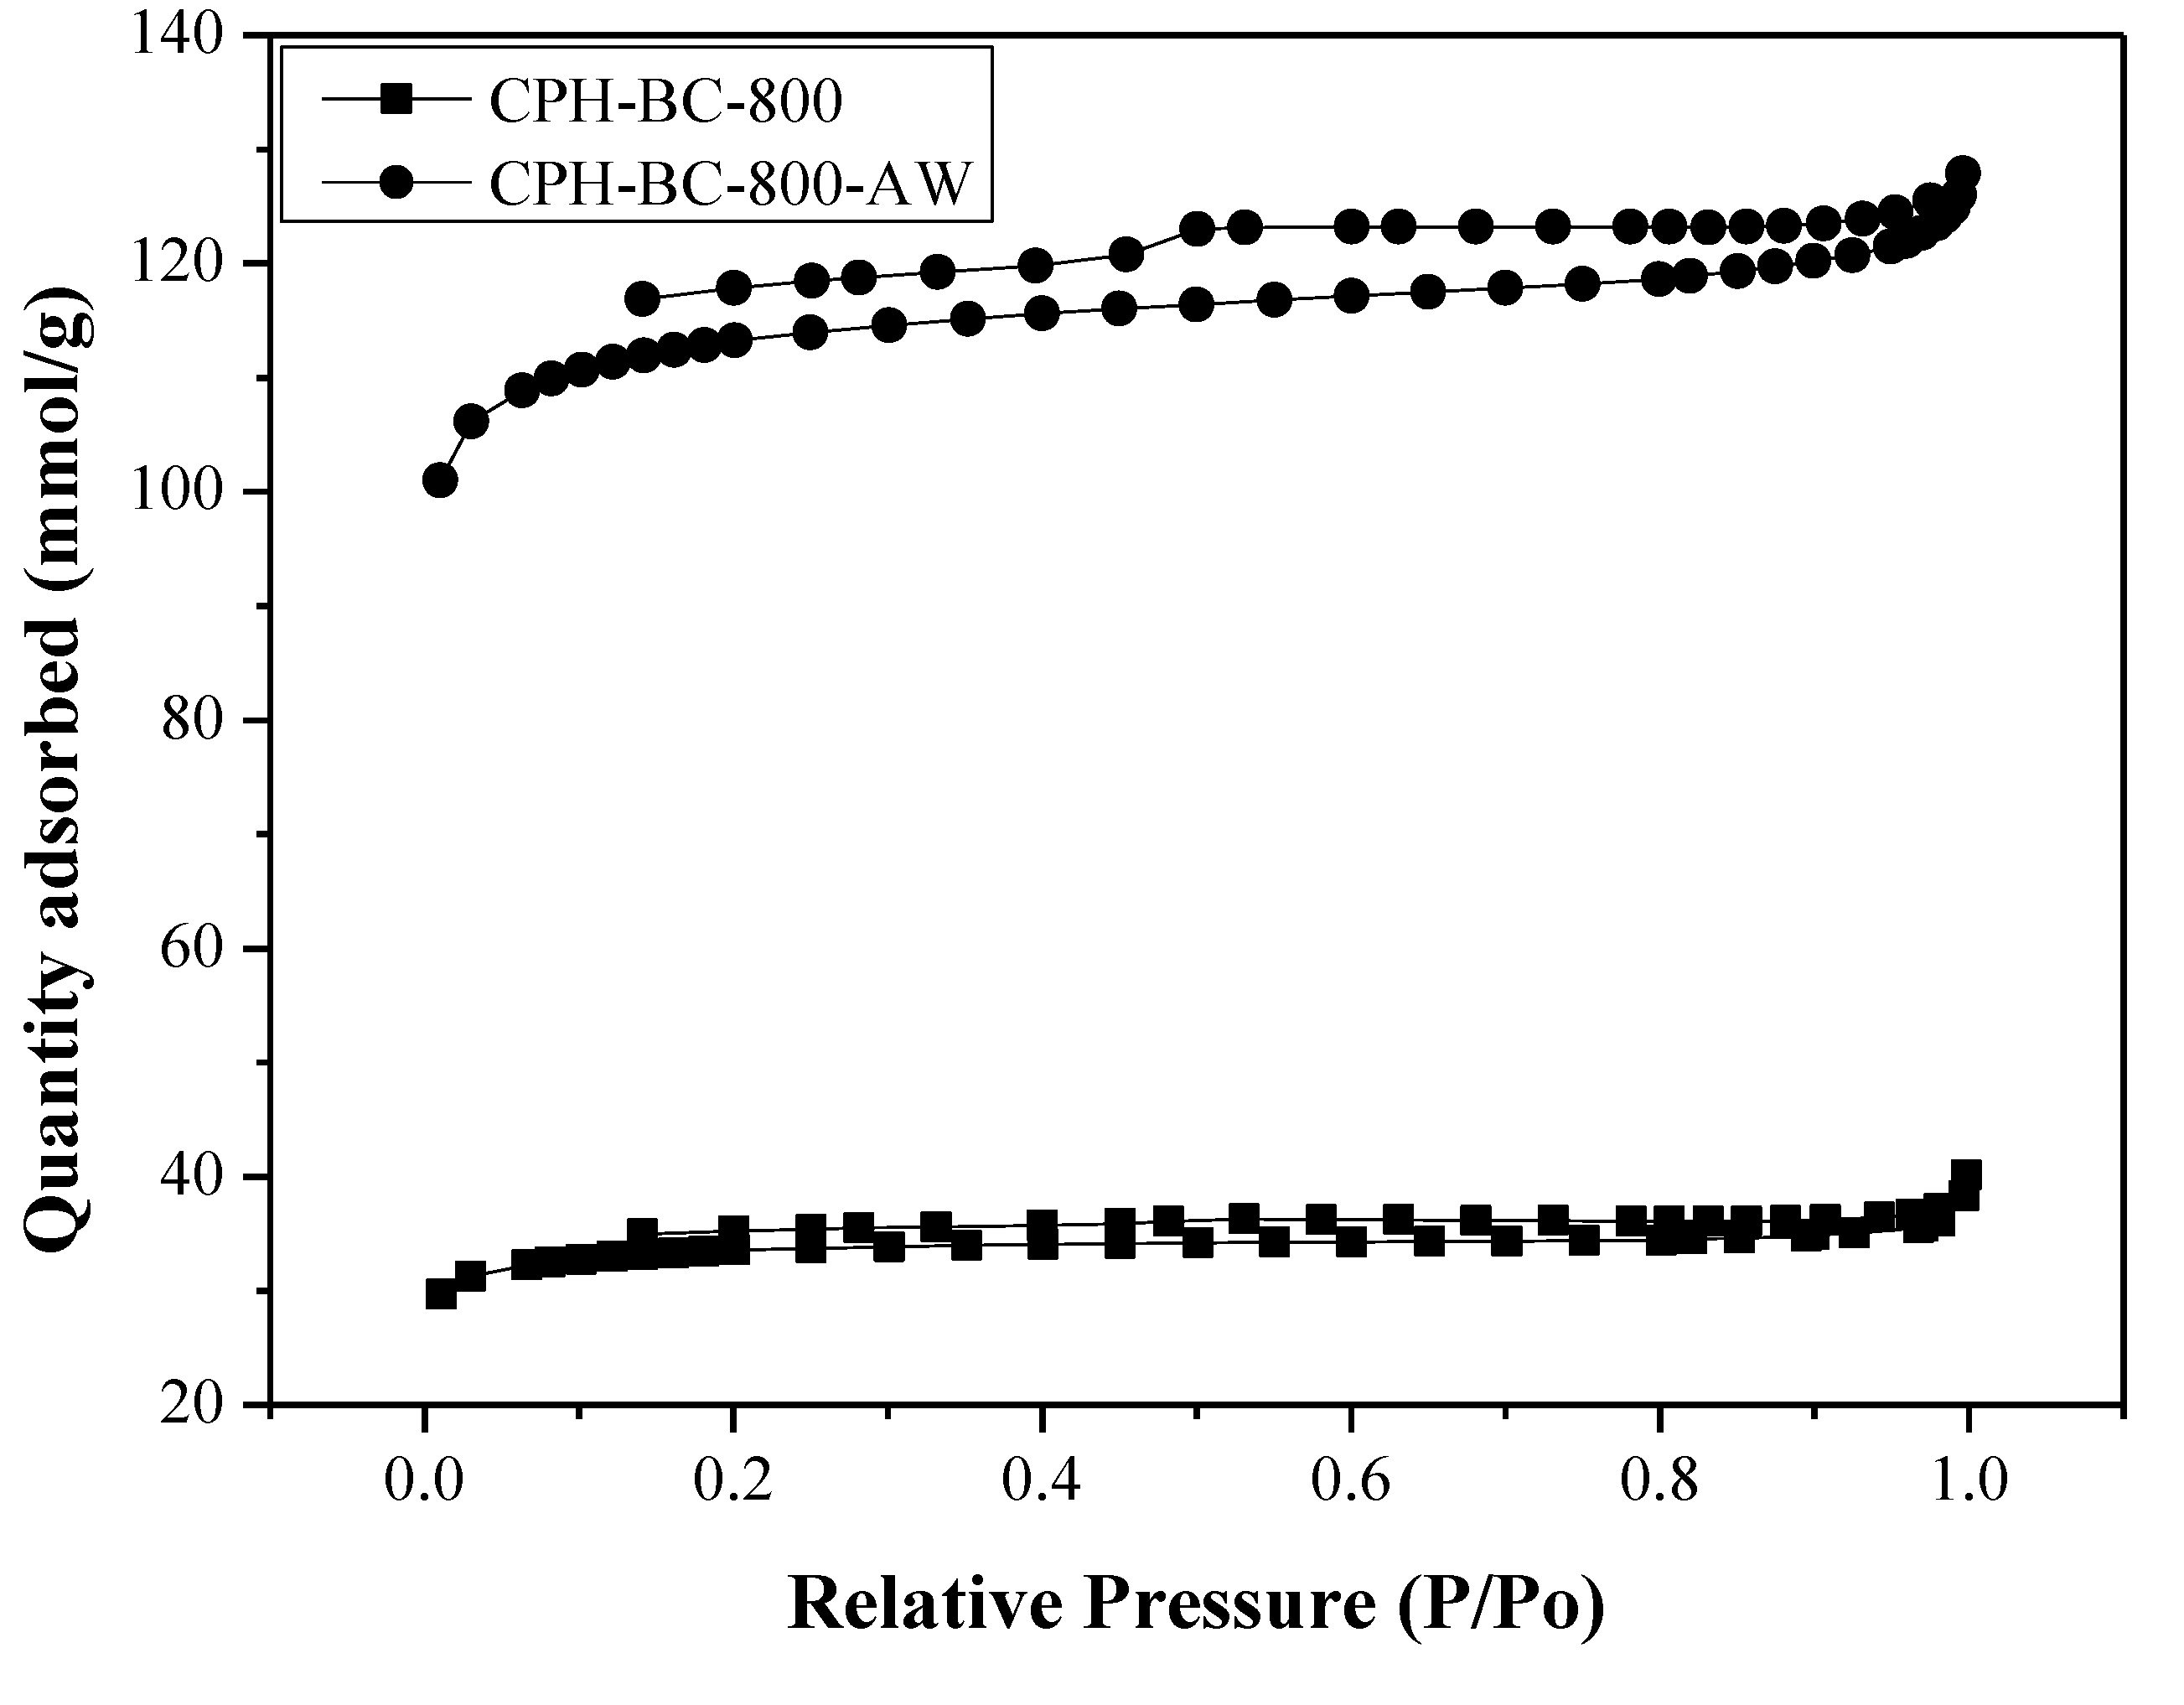
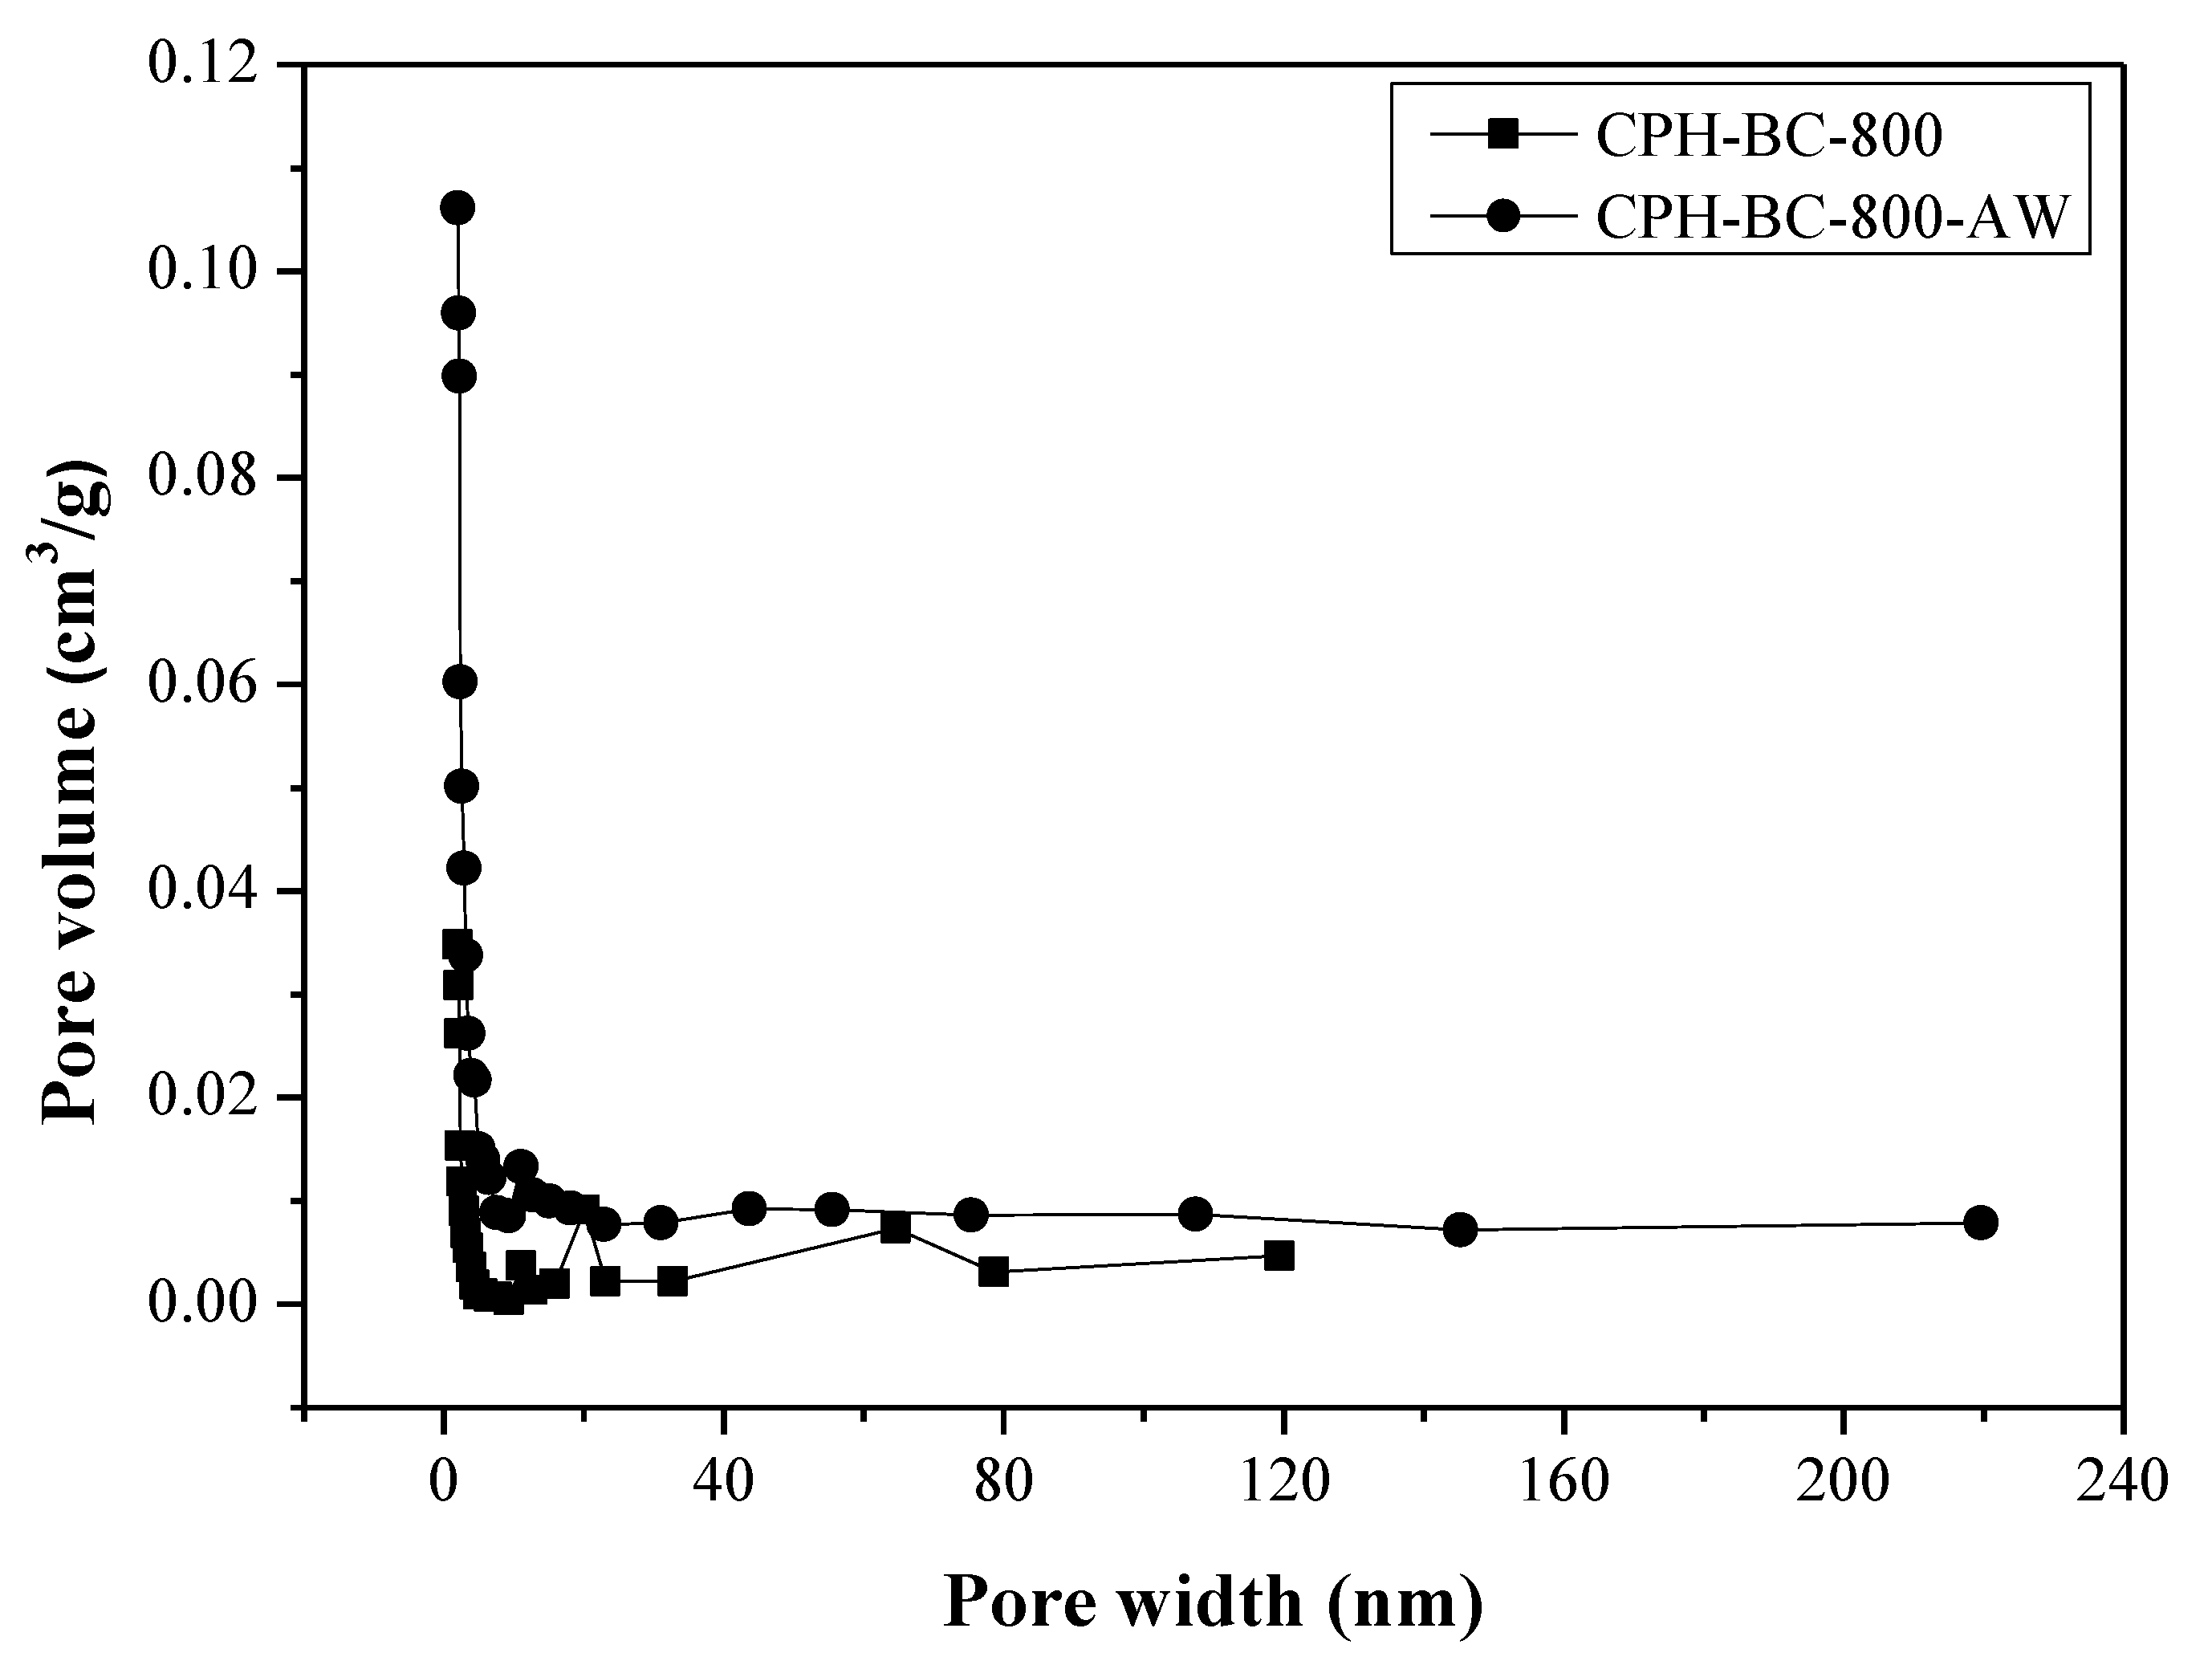
3.1. Pore Properties of Resulting Biochars

Table 1 listed the pore properties and densities of resulting biochar products, including BET surface area, total pore volume, average pore width, true density, particle density and particle porosity. Obviously, the pyrolysis temperature was an influential parameter in the pore development of resulting biochar during the carbonization process. As seen in Table 1, the BET surface area of CPH-BC-800 (i.e., 101.04 m2/g) is significantly higher than that of CPH-BC-400 (i.e., 0.33 m2/g). With increasing the carbonization temperature, the content of aromatic carbon in the resulting biochar increased, but the content of aliphatic carbon decreased [24]. Therefore, the organic carbon in the CPH-BC-800 should be present in polycondensed aromatic structures, which are responsible for the stability of biochar when applied to the soils, and thus mitigated greenhouse gas (GHG like CH4 and CO2) emissions (i.e., carbon sequestration). In the literature [24,30,31], it has concluded that increasing carbonization temperature generally led to the variations on the chemical and physical properties of resulting biochar, including a decline of oxygen-containing or ion-exchange functional groups, an increase of SSA, and a higher content of nonvolatile elements. From the data in Table 1, the temperature at 800 °C induced a significant change on the pore properties and true density of resulting biochar. Presumably, it was attributed to the rigorous carbonization/shrinkage reaction, resulting in more rigid and porous structures in the resulting biochar (i.e., CPH-BC-800) as compared to those of CPH-BC-400. At higher temperatures, a more severe devolatilization of the carbonaceous precursor was produced (i.e., CPH), leading to a more developed porous structure.
As mentioned above, the content of inorganic minerals in the resulting biochar may hinder pore development during carbonization. Based on the dissolution of metals by means of acid solution, the resulting biochar was further rinsed by the dilute acid to leach out alkali from ash. Expectably, the existing pores in the resulting biochar can be exposed again, thus indicating an increase of pore properties. As listed in Table 1, this speculation has been certified by triple increase in the SSA data (i.e., 342 m2/g for CPH-BC-800-AW vs. 101 m2/g for CPH-BC-800). On the other hand, no new pores were obviously created during the acid-leaching, resulting in a slight increase from 0.3 m2/g (CPH-BC-400) to 0.9 m2/g (CPH-BC-400-AW).
For describing the pore structures of resulting biochar, the adsorption–desorption isotherms of nitrogen (N2) at −196 °C is the most used method. Figure 1 showed the N2 adsorption–desorption isotherms of CPH-BC-800 and CPH-BC-800-AW. From the adsorption isotherm curve (type I), these biochar products should be microporous (i.e., pore width ˂2.0 nm), showing high adsorbed amounts at extremely relative pressures due to micropore filling [26,27]. More notably, these biochar products also indicated the hysteresis loop observed at the adsorption and desorption isotherms (type IV). The most characteristic feature of the isotherm is related to the occurrence of pore condensation due to the presence of mesopores in the resulting biochar. From these isotherms (Figure 1), it was also confirmed that the CPH-BC-800-AW has larger pore properties in comparison with CPH-BC-800. Based on the definition by the International Union of Pure and Applied Chemistry (IUPAC), the shape of the hysteresis loop seemed to be type H4, which are often associated with narrow slit-like pores [27]. As consistently shown in Figure 2, the resulting biochar products had narrow pore size distributions with a major range less than 5 nm (50 Å), indicating that both the micropores and mesopores are present in the CPH-BC-800 and CPH-BC-800-AW. Furthermore, new pores, especially in mesopores, were created during the acid-leaching, which can be depicted in Figure 3 for their porous structures by the SEM observations. When comparing the surface texture of the CPH-BC-800 in Figure 3a with that of the CPH-BC-800-AW in Figure 3b, it obviously showed more pore formation in the acid-washed biochar. Therefore, the acid-washed treatment of biochar may be employed to enhance its physical properties due to the new pore development by the removal of minerals and tars.

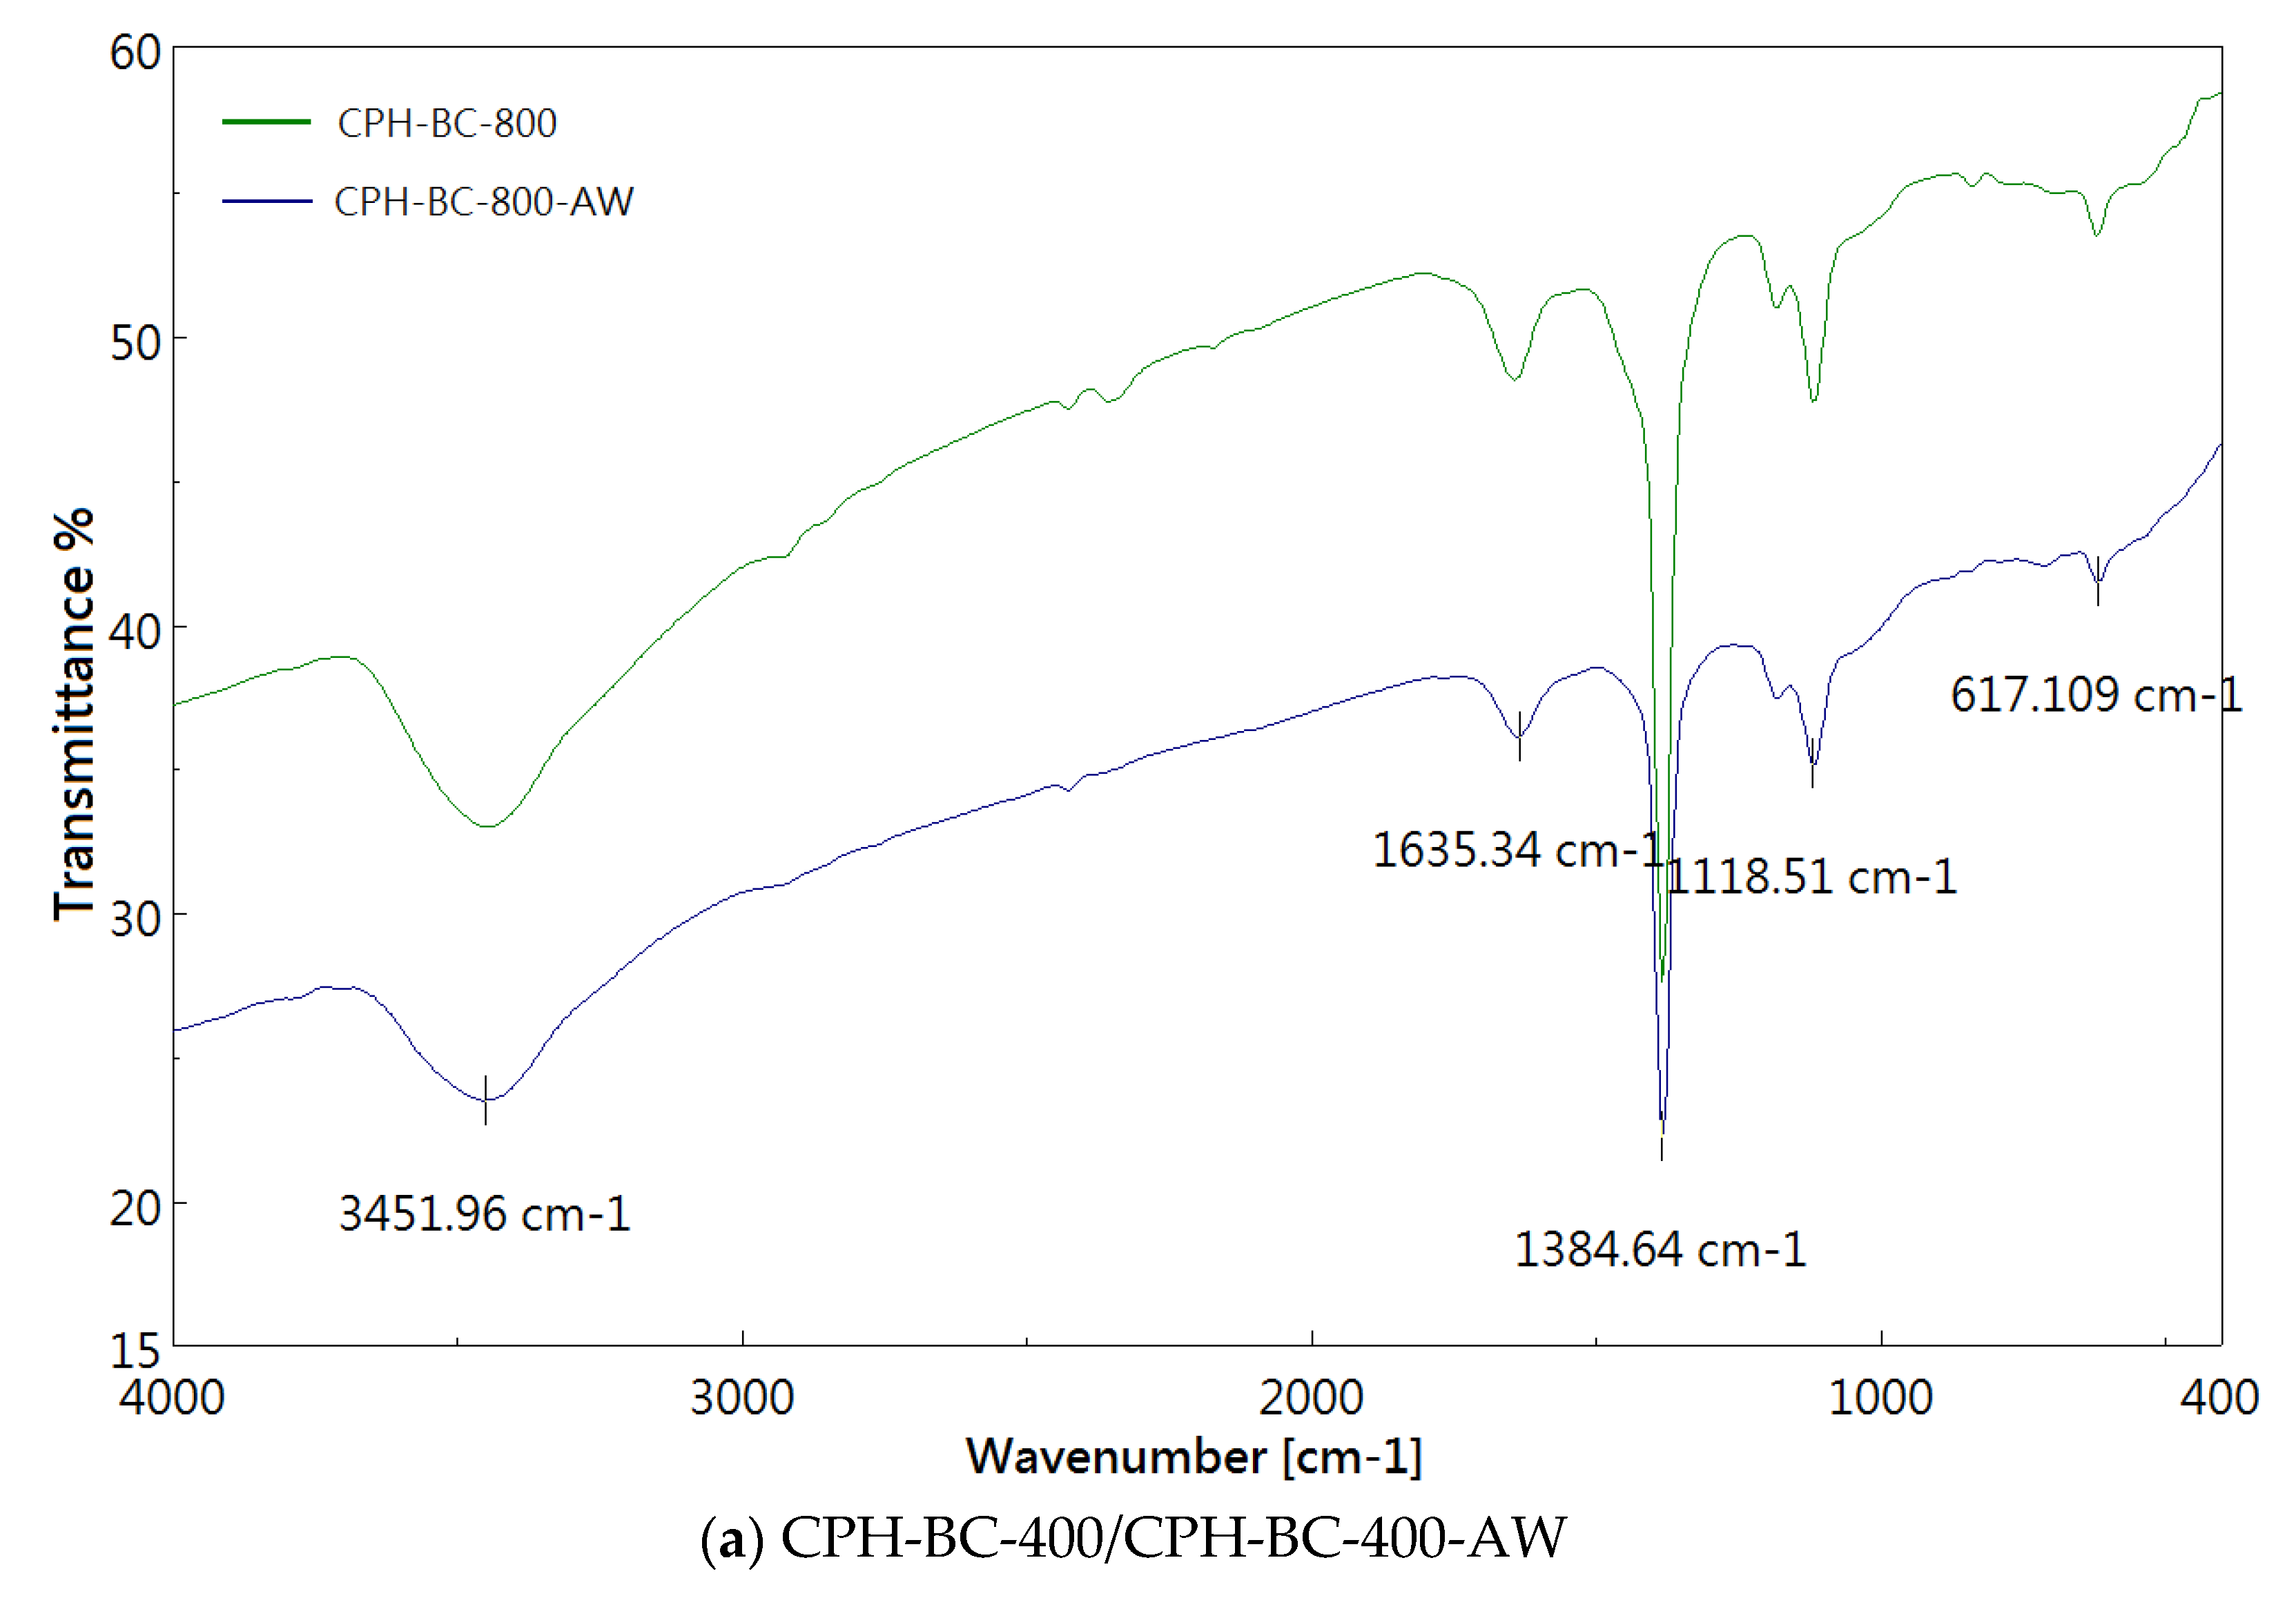
3.2. Chemical Characterization of Resulting Biochar

Regarding the agronomic considerations in biochar, the mineral ash content and elemental composition may be the most important properties [30]. The former also determined the pH and cation exchange capacity of biochar. The latter is closely related to the organic carbon, which is primarily present in recalcitrant condensed aromatic rings with functional oxygen-containing groups [32]. During the textural observations by the SEM, the elemental contents on the surface of resulting biochar were further analyzed by the energy dispersive X-ray spectroscopy (EDS). As depicted in Figure 4, the dominant elements of CPH-BC-800 were carbon (C), oxygen (O), potassium (K) and magnesium (Mg). By contrast, only carbon and oxygen were remained in the CPH-BC-800-AW, indicating that the acid-leaching of resulting biochar resulted in complete removal of mineral ash. The high oxygen content on the surface of resulting biochar was associated with some reactive functional groups (e.g., carbonyl and hydroxyl), which are in connection with the hydrophilic (polar) nature [29]. Based on the TGA diagrams for the biochar products (Figure 5), it can be seen that the mass loss contained three regions, which may correspond to the loss of moisture (25–200 °C), labile organic matter (200–600 °C), and inorganic carbonates (600–900 °C) [33]. Obviously, the contents of inorganic carbonates for the optimal biochar (i.e., CPH-BC-800) were significantly higher than that of its acid-washed product (i.e., CPH-BC-800-AW), implying that the acid-leaching played a vital role in the removal of mineral carbonates. Furthermore, Figure 6 showed the Fourier Transform infrared spectroscopy (FTIR) spectra of resulting biochar products. As summarized in Table 2 [34,35], some oxygen-containing functional groups could be associated with the absorption peaks at about 3450, 1630, 1380, 1120 and 620 cm−1. Obviously, a sharp peak was observed at about 1380 cm−1, which may be assigned to the O-H bending and/or symmetric C-H bending.

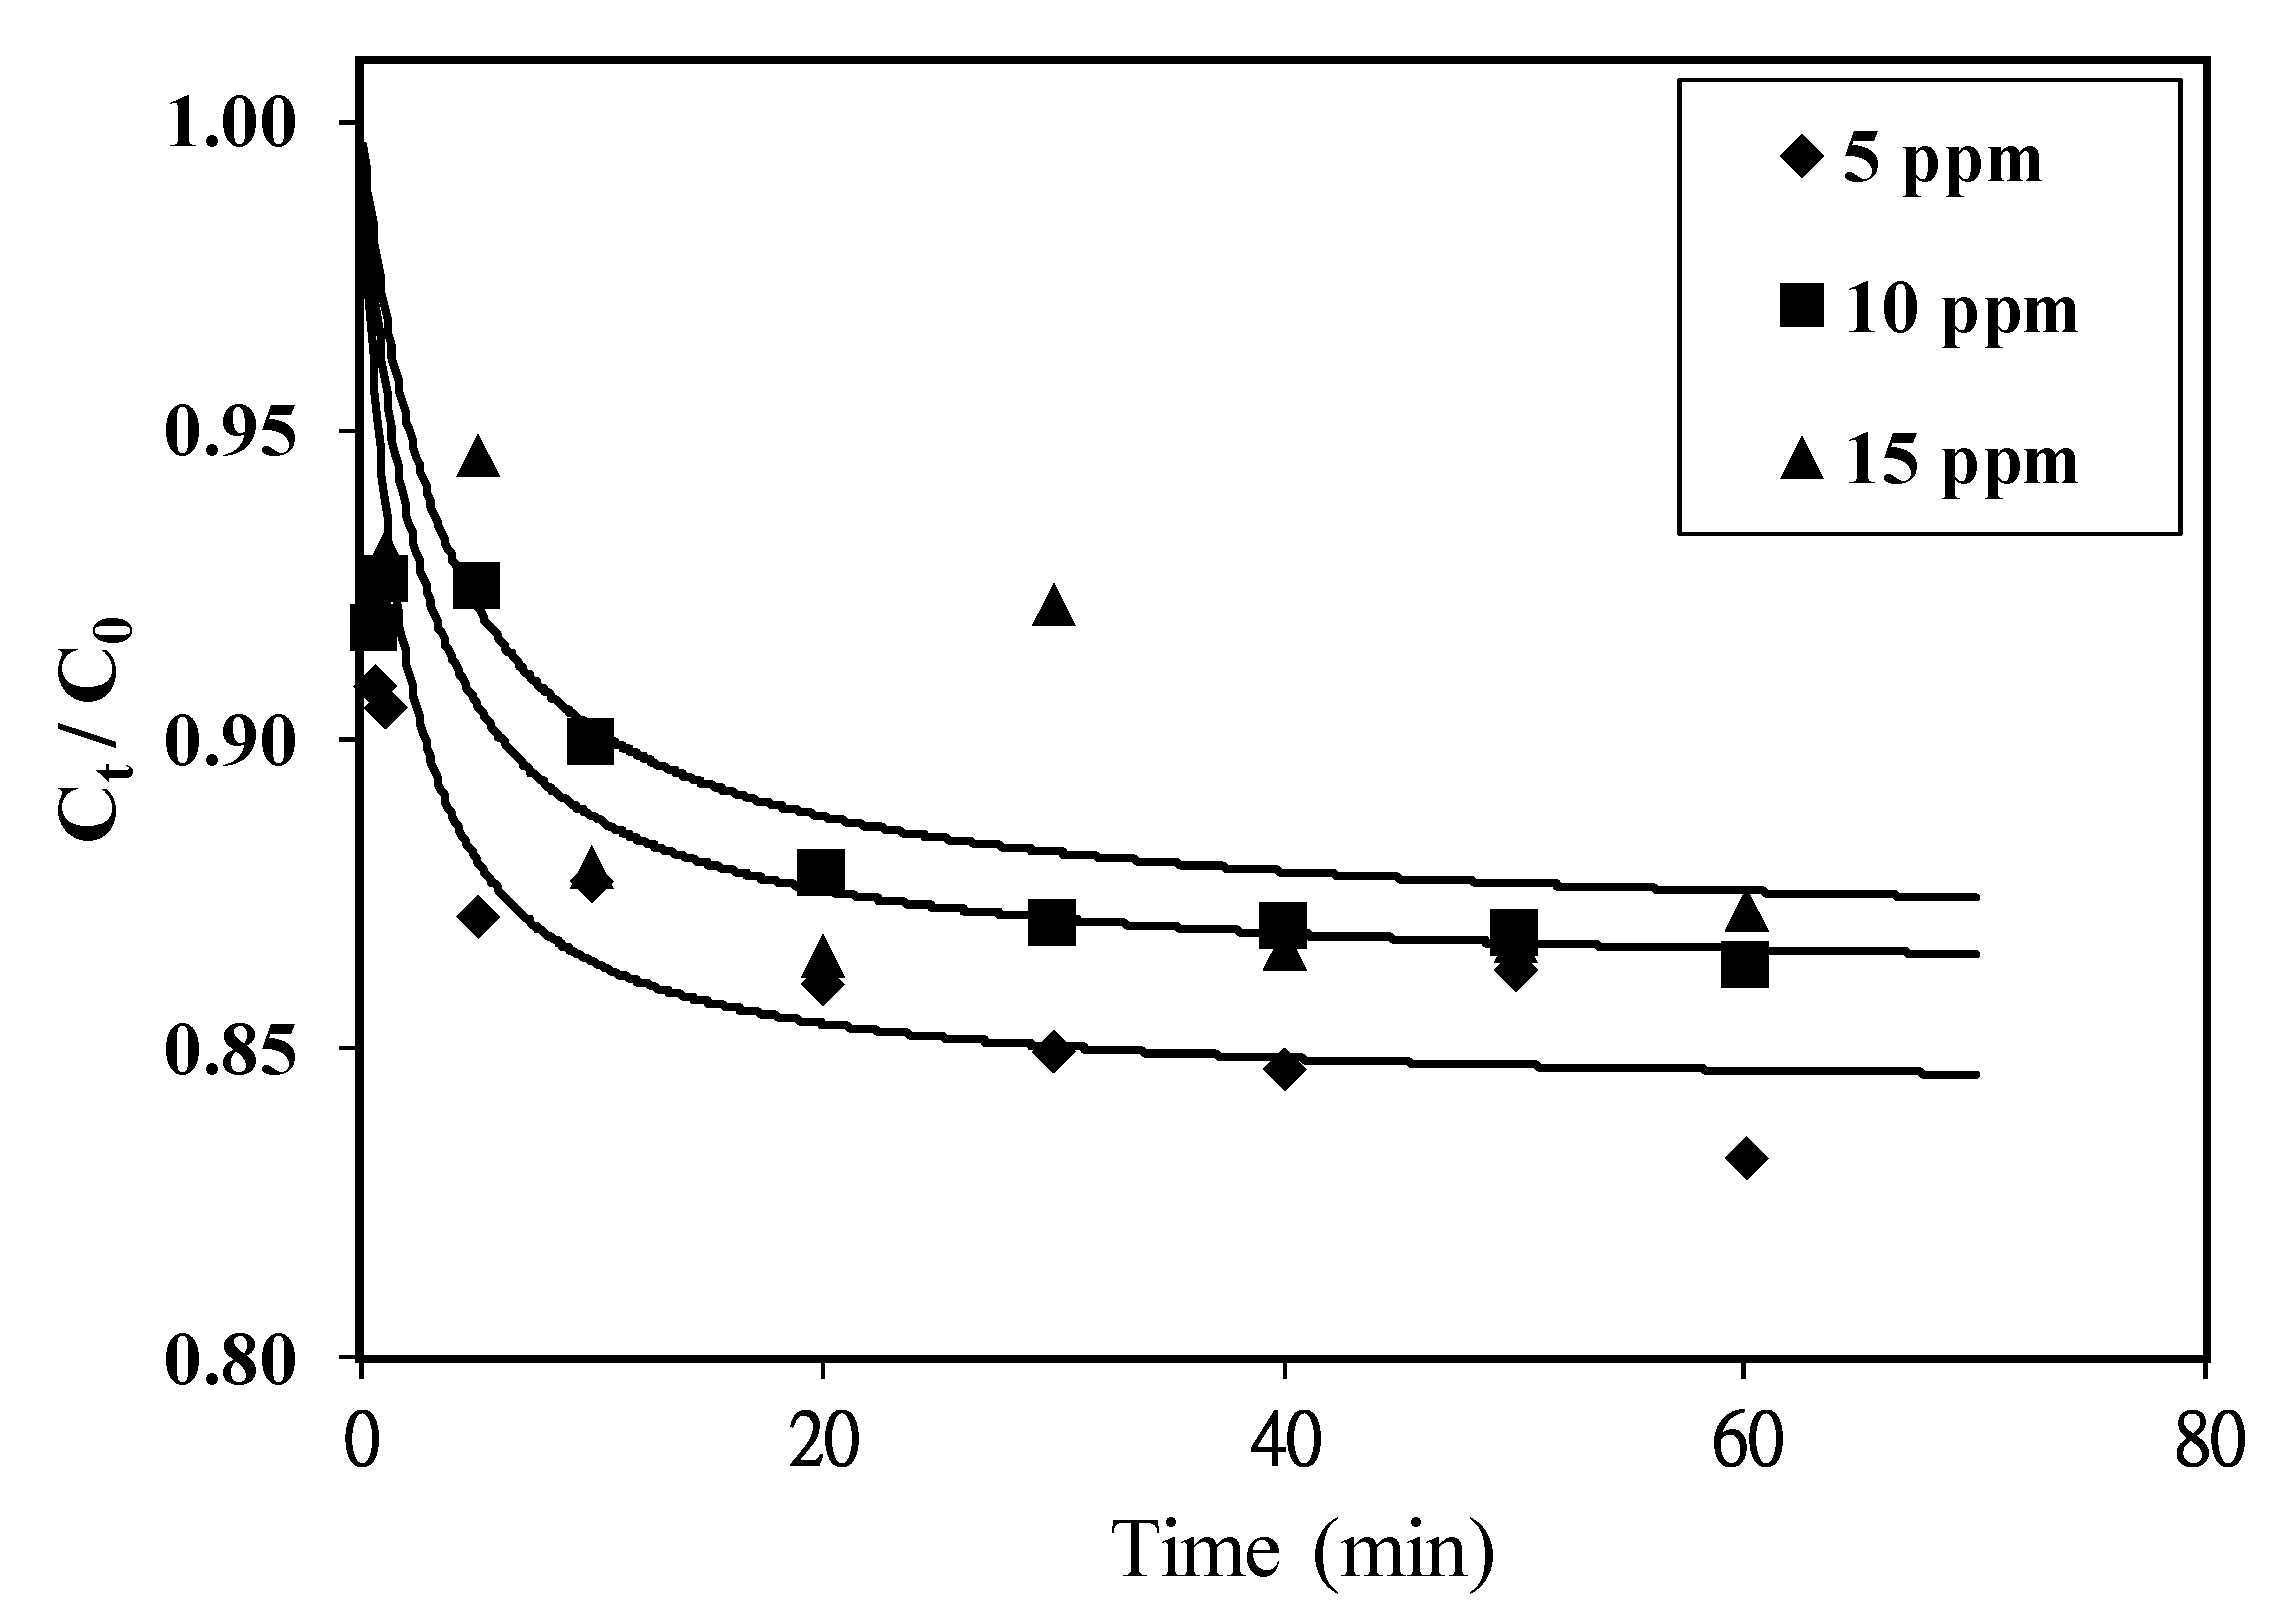
3.3. Adsorption Performance of Resulting Biochar

In this work, we considered the kinetic adsorption of a single adsorbate (i.e., MB) from a dilute solution in a near constant volume and well-mixed batch system. The adsorption performance of the optimal biochar (i.e., CPH-BC-800-AW) was tested to remove MB under three initial MB concentrations (i.e., 5, 10 and 15 mg/L) by fixing the biochar dosage (0.15 g/L), agitation speed (200 rpm) and temperature (25 °C). From Figure 7, the decrease in residual MB concentration ratio (Ct/C0) was observed at a short adsorption time. For example, the value of Ct/C0 was reduced to about 0.90 within 1 min. Implicitly, the strong interactions like “ion-exchange” adsorption may exist between the cationic compound (i.e., MB) and the biochar product. Therefore, the adsorption kinetics was fitted by pseudo-second order model in this work [36]. Using the linear form of this model (the following equation), the adsorption data can be further correlated to obtain its kinetic parameters:
t/qt = 1/(k × qe2) + (1/qe) × t
where qe and k are the model parameters, indicating the adsorbed MB amount of at equilibrium (mg/g) and the rate constant (g/(mg.min)), respectively. Using the following equation, the time required biochar (i.e., CPH-BC-800-AW) to take up half as much cationic compound (i.e., MB) as it occurred at the equilibrium state (i.e., t = t1/2 as qt = qe/2) can be further obtained:
t1/2 = 1/(k × qe).
Table 3 listed the fitted values of kinetic parameters for the adsorption of MB onto CPH-BC-800-AW. It can be seen that the adsorption kinetics fitted this model well with correlation coefficients (>0.92). Although the fitted adsorption capacities (i.e., qe) in this work were lower than those obtained from the adsorption of dyes onto activated carbon, they (seen in Table 3) increased as the value of C0 increased [37,38,39]. This increasing trend can be attributed to the fact that more MB compounds were adsorbed onto the CPH-based biochar product at the equilibrium condition without showing its adsorption exhaustion.

4. Conclusions

Based on the analytical results of the pore and chemical properties for the CPH-based biochar, the conclusions can be drawn as follows:
Under the pyrolysis experiments studied from 400 to 800 °C, the temperature could be the most important process parameter for determining the pore properties of resulting biochar.
The post-treatment by acid-leaching had a positive impact on the enhancement of pore properties for the resulting biochar. The optimal biochar product (i.e., CPH-BC-800-AW) possessed microporous features, showing the pore properties with BET surface area of 342 m2/g and total pore volume of about 0.20 cm3/g.
The pore features of optimal biochar produced at 800 °C were both the type I (micropores) and type IV (mesopores) from the observations of the nitrogen adsorption–desorption isotherms.
The resulting biochar without acid-washing seemed to have surface oxygen-containing functional groups from the observations of energy dispersive X-ray spectroscopy (EDS) and Fourier Transform infrared spectroscopy (FTIR).
Based on the MB adsorption test and its fittings by pseudo-second order model, the resulting CPH-based biochar could be used as an effective adsorbent for removal of cationic compounds from the aqueous solution.

Author Contributions

Conceptualization, W.-T.T.; methodology, C.-H.H., C.-H.T., W.-S.C. and Y.-T.C.; validation, C.-H.H.; data curation, Y.-Q.L.; formal analysis, Y.-Q.L.; writing—original draft preparation, W.-T.T.; writing—review and editing, W.-T.T. All authors have read and agreed to the published version of the manuscript.

Funding

This research received no external funding.

Acknowledgments

The authors express sincere appreciation to the Instrument Centers of National University and National Pingtung University of Science and Technology for the assistances in the elemental analysis (EA) and energy dispersive X-ray spectroscopy (EDS) observation, respectively.

Conflicts of Interest

The authors declare no conflict of interest.

References

  1. The International Cocoa Organization (ICCO). Annual Report-2014–2015; ICCO: Abidjan, Côte d’Ivoire. Available online: www.icco.org/about-us/international-cocoa-agreements/cat_view/1-annual-report.html (accessed on 29 June 2019).
  2. Vriesmann, L.C.; Teofilo, R.F.; Petkowicz, C.L.O. Extraction and characterization of pectin from cacao pod husks (Theobroma cacao L.) with citric acid. LWT Food Sci. Technol. 2012, 49, 108–116. [Google Scholar] [CrossRef] [Green Version]
  3. Oddoye, E.O.K.; Agyente-Badu, C.K.; Gyedu-Akoto, E. Cocoa and its by-products: Identification and utilization. In Chocolate in Health and Nutrition; Watson, R.R., Preedy, V.R., Zibadi, S., Eds.; Springer: New York, NY, USA, 2013; pp. 23–37. [Google Scholar]
  4. Figueira, A.; Janick, J.; BeMiller, J.N. New products from Theobroma cacao: Seed pulp and pod gum. In New Crops; Janick., J., Simon, J.E., Eds.; Wiley: New York, NY, USA, 1993; pp. 475–478. [Google Scholar]
  5. Okiyama, D.C.G.; Navarro, S.L.B.; Rodrigues, C.E.C. Cocoa shell and its compounds: Applications in the food industry. Trends Food Sci. Technol. 2017, 63, 103–112. [Google Scholar] [CrossRef]
  6. Syamsiro, M.; Saptoadi, H.; Tambunan, B.H.; Pambudi, N.A. A preliminary study on use of cocoa pod husk as a renewable source of energy in Indonesia. Energy Sustain. Dev. 2012, 16, 74–77. [Google Scholar] [CrossRef]
  7. Martinez-Angel, J.D.; Villamizar-Gallardo, R.A.; Ortiz-Rodriguez, O.O. Characterization and evaluation of cocoa (Theobroma cacao L.) pod husk as a renewable energy source. Agrociencia 2015, 49, 329–345. [Google Scholar]
  8. El-Shekeil, Y.A.; Sapuan, S.M.; Algrafi, M.W. Effect of fiber loading on mechanical and morphological properties of cocoa pod husk fibers reinforced thermoplastic polyurethane composites. Mater. Des. 2014, 64, 330–333. [Google Scholar] [CrossRef]
  9. Chun, K.S.; Husseinsyah, S.; Osman, H. Utilization of cocoa pod husk as filler in polypropylene biocomposites: Effect of maleated polypropylene. J. Thermoplast. Compos. 2015, 28, 1507–1521. [Google Scholar] [CrossRef]
  10. Bello, O.S.; Ahmad, M.A. Adsorptive removal of a synthetic textile dye using cocoa pod husk. Toxicol. Environ. Chem. 2011, 93, 1298–1308. [Google Scholar] [CrossRef]
  11. Mylsamy, S.; Theivarasu, C. Adsorption of reactive dye using low cost adsorbent: Cocoa (Theobroma cacao) shell. World J. Appl. Environ. Chem. 2012, 1, 22–29. [Google Scholar]
  12. Njoku, V.O.; Ayuk, A.A.; Oguzie, E.E.; Ejike, E.N. Biosorption of Cd (II) from aqueous solution by cocoa pod husk biomass: Equilibrium, kinetic, and thermodynamic studies. Sep. Sci. Technol. 2012, 47, 753–761. [Google Scholar] [CrossRef]
  13. Pua, F.L.; Sajab, M.S.; Chia, C.H.; Zakaria, S.; Rahman, I.A.; Salit, M.S. Alkaline-treated cocoa pod husks as adsorbent for removing methylene blue from aqueous solutions. J. Environ. Chem. Eng. 2013, 1, 460–465. [Google Scholar] [CrossRef]
  14. Ahmad, F.; Daud, W.M.A.W.; Ahmad, M.A.; Radzi, R. Using cocoa (Theobroma cacao) shell-based activated carbon to remove 4-nitrophenol from aqueous solution: Kinetics and equilibrium studies. Chem. Eng. J. 2011, 178, 461–467. [Google Scholar]
  15. Tsai, C.H.; Tsai, W.T.; Liu, S.C.; Lin, Y.Q. Thermochemical characterization of biochar from cocoa pod husk prepared at low pyrolysis temperature. Biomass Convers. Biorefin. 2018, 8, 237–243. [Google Scholar] [CrossRef]
  16. Tsai, W.T.; Huang, P.C. Characterization of acid-leaching cocoa pod husk (CPH) and its resulting activated carbon. Biomass Convers. Biorefin. 2018, 8, 521–528. [Google Scholar] [CrossRef]
  17. Adjin-Tetteh, M.; Asiedu, N.; Dodoo-Arhin, D.; Karam, A.; Amaniampong, P.N. Thermochemical conversion and characterization of cocoa pod husks a potential agricultural waste from Ghana. Ind. Crops Prod. 2018, 119, 304–312. [Google Scholar] [CrossRef]
  18. Basu, P. Biomass Gasification, Pyrolysis and Torrefaction, 2nd ed.; Academic Press: London, UK, 2013. [Google Scholar]
  19. Mukherjee, A.; Lal, R. Biochar impacts on soil physical properties and greenhouse gas emissions. Agronomy 2013, 3, 313–339. [Google Scholar] [CrossRef] [Green Version]
  20. Biochar Use in Soils. Available online: https://biochar-international.org/soil-health/ (accessed on 29 June 2019).
  21. Lehmann, J.; Joseph, S. Biochar for environmental management: An introduction. In Biochar for Environmental Management, 2nd ed.; Lehmann, J., Joseph, S., Eds.; Routledge: New York, NY, USA, 2015; pp. 1–13. [Google Scholar]
  22. Titiloye, J.O.; Baker, M.S.A.; Odetoye, T.E. Thermochemical characterisation of agricultural wastes from West Africa. Ind. Crops Prod. 2013, 47, 199–203. [Google Scholar] [CrossRef]
  23. Miles, T.R.; Rasmussen, E.M.; Gray, M. Aqueous contaminant removal and stormwater treatment using biochar. In Agricultural and Environmental Applications of Biochar: Advances and Barriers; Guo, M., He, Z., Uchimiya, S.M., Eds.; Soil Science Society of America: Madison, WI, USA, 2016; pp. 341–376. [Google Scholar]
  24. Steiner, C. Considerations in biochar characterization. In Agricultural and Environmental Applications of Biochar: Advances and Barriers; Guo, M., He, Z., Uchimiya, S.M., Eds.; Soil Science Society of America: Madison, WI, USA, 2016; pp. 87–100. [Google Scholar]
  25. Tsai, T.W.; Hsu, C.H.; Lin, Y.Q. Highly porous and nutrients-rich biochar derived from dairy cattle manure and its potential for removal of cationic compound from water. Agriculture 2019, 9, 114. [Google Scholar] [CrossRef] [Green Version]
  26. Gregg, S.J.; Sing, K.S.W. Adsorption, Surface Area, and Porosity; Academic Press: London, UK, 1982. [Google Scholar]
  27. Lowell, S.; Shields, J.E.; Thomas, M.A.; Thommes, M. Characterization of Porous Solids and Powders: Surface Area, Pore Size and Density; Springer: Dordrecht, The Netherlands, 2006. [Google Scholar]
  28. Smith, J.M. Chemical Engineering Kinetics, 3rd ed.; McGraw-Hill: New York, NY, USA, 1981. [Google Scholar]
  29. Suzuki, M. Adsorption Engineering; Elsevier: Amsterdam, The Netherlands, 1990. [Google Scholar]
  30. Mukome, F.N.D.; Parikh, S.J. Chemical, physical, and surface characterization of biochar. In Biochar: Production, Characterization, and Applications; Ok, Y.S., Uchimiya, S.M., Chang, S.X., Bolan, N., Eds.; CRC Press: Boca Raton, FL, USA, 2016; pp. 67–96. [Google Scholar]
  31. Chia, C.H.; Downie, A.; Munroe, P. Characteristics of biochar: Physical and structural properties. In Biochar for Environmental Management: Science, Technology and Implementation, 2nd ed.; Lehmann, J., Joseph, S., Eds.; Routledge: New York, NY, USA, 2015; pp. 89–109. [Google Scholar]
  32. Leng, L.; Huang, H. An overview of the effect of pyrolysis process parameters on biochar stability. Bioresour. Technol. 2018, 270, 627–642. [Google Scholar] [CrossRef]
  33. Masek, O.; Johnston, C.T. Thermal analysis for biochar characterisation. In Biochar: A Guide to Analytical Methods; Singh, B., Camps-Arbestain, M., Lehmann, J., Eds.; CRC Press: Boca Raton, FL, USA, 2017; pp. 283–293. [Google Scholar]
  34. Cantrell, K.B.; Hunt, P.G.; Uchimiya, M.; Novak, J.M.; Ro, K.S. Impact of pyrolysis temperature and manure source on physicochemical characteristics of biochar. Bioresour. Technol. 2012, 107, 419–428. [Google Scholar] [CrossRef]
  35. Johnston, C.T. Biochar analysis by Fourier-transform infra-red spectroscopy. In Biochar: A Guide to Analytical Methods; Singh, B., Camps-Arbestain, M., Lehmann, J., Eds.; CRC Press: Boca Raton, FL, USA, 2017; pp. 199–213. [Google Scholar]
  36. Ho, Y.S.; Chiang, C.C.; Hsu, Y.C. Sorption kinetics for dye removal from aqueous solution using activated clay. Sep. Sci. Technol. 2001, 36, 2473–2488. [Google Scholar] [CrossRef]
  37. Demirbas, E.; Kobya, M.; Sulak, M.T. Adsorption kinetics of a basic dye from aqueous solutions onto apricot stone activated carbon. Bioresour. Technol. 2008, 99, 5368–5373. [Google Scholar] [CrossRef] [PubMed]
  38. Ghaedi, M.; Golestani Nasab, A.; Khodadoust, S.; Rajabi, M.; Azizian, S. Application of activated carbon as adsorbents for efficient removal of methylene blue: Kinetics and equilibrium study. J. Ind. Eng. Chem. 2014, 20, 2317–2324. [Google Scholar] [CrossRef]
  39. Tsai, W.T.; Huang, P.C.; Lin, Y.Q. Reusing cow manure for the production of activated carbon by potassium hydroxide (KOH) activation process and its liquid-phase adsorption performance. Processes 2019, 7, 737. [Google Scholar] [CrossRef] [Green Version]
Figure 1. N2 adsorption–desorption isotherms of CPH-BC-800 products.
Processes 08 00144 g001
Figure 2. Pore size distributions of CPH-BC-800 products.
Processes 08 00144 g002
Figure 3. SEM images (×1000) of (a) CPH-BC-800, (b) CPH-BC-800-AW.
Processes 08 00144 g003
Figure 4. Energy dispersive spectroscopy (EDS) spectra of (a) CPH-BC-800, and (b) CPH-BC-800-AW.
Processes 08 00144 g004
Figure 5. Thermogravimetric analysis (TGA) diagrams of CPH-BC-800 and CPH-BC-800-AW.
Processes 08 00144 g005
Figure 6. Fourier Transform infrared spectroscopy (FTIR) spectra of (a) CPH-BC-400/CPH-BC-400-AW, (b) CPH-BC-800/CPH-BC-800-AW.
Processes 08 00144 g006aProcesses 08 00144 g006b
Figure 7. Plots of dimensionless concentration (Ct/C0) vs. adsorption time at different initial MB concentrations (Co). Full lines: calculated from Equation (5) and Table 3.
Processes 08 00144 g007
Table 1. Pore properties and densities of CPH-based biochar products.
Biochar Product aSBET b
(m2/g)
Vt c
(cm3/g)
Dave d
(Å)
ρs e
(g/cm3)
ρp f
(g/cm3)
εp g
(g/cm3)
CPH-BC-4000.30.0028328.621.41371.40800.0040
CPH-BC-400-AW0.90.0042197.181.46411.45520.0061
CPH-BC-5001.30.0053167.961.37911.36910.0073
CPH-BC-6000.40.0030336.871.70421.69550.0028
CPH-BC-7003.40.004451.711.63381.62210.0072
CPH-BC-800101.00.059323.471.45451.33900.0794
CPH-BC-800-AW342.00.194922.791.97081.42390.2775
a Cocoa pod husk (CPH)-based biochar products (CPH-BC) produced at 400–800 °C. The notation of AW indicated the post treatment of CPH-BC by acid washing. b BET surface area (SBET) was calculated from the relative pressure (P/P0) of 0.05–0.30. c Total pore volume (Vt) was obtained at P/P0 of about 0.995. d Average pore width (DAVE) was obtained from Equation (1). e Measured by a pycnometer. f Particle density (ρp) was obtained from Equation (2). g Porosity (εp) was obtained from Equation (3).
Table 2. FTIR spectra of CPH-BC-400/800 products and their corresponding assignments for the primary absorption peaks (cf. Figure 7).
Absorption Peak (cm−1)Possible Functional Group Assignments
3450O-H stretching
1630C=O stretching or C=C aromatic stretching
1380O-H bending (phenolic) or symmetric C-H bending
1120C-O symmetric stretching
620C-H bending
Table 3. Adsorption kinetic parameters for the adsorption of methylene blue (MB) onto the optimal biochar (CPH-BC-800-AW). a.
Initial MB Concentration
(mg/L)
k
(g/mg. min)
qe
(mg/g)
Correlation Coefficientt1/2
(min)
50.1195.250.9831.60
100.0459.290.9962.39
150.02213.180.9123.45
a Adsorption conditions: temperature of 25 °C, adsorbent dosage of 0.15 g/L, and agitation speed of 200 rpm.

