1. Introduction
Oil is one of the most important raw materials in all industries—it is considered to be one of the decisive factors for the success of manufacturing and translation enterprises. Global crude oil demand in 2018 amounted to 99.2 million barrels a day and is expected to increase to 100.6 million barrels a day in 2019. In comparison, the demand for daily oil use was 86.4 million barrels in 2010; thus, it is an orbit of growing demand [
1]. In Vietnam, the oil and gas industry has been increasingly invested in and developed by the government [
2]. Along with the development of science and technology, this has led to an increase in oil production, which has caused the price of crude oil to decline compared to the last period [
3]. Therefore, selecting an appropriate oil and gas supplier is one important strategy to which businesses must pay special attention and which they must consider in the current era of industrialization and modernization. The survey of this must consider many factors, both qualitative and quantitative. Thus, the selection of suppliers in the oil and gas industry is a multi-criteria decision. To select the optimal supplier, one needs to go through the steps in the supplier selection decision model diagram. Selecting the most optimal supplier requires detailed planning. MCDM models refer to decision making in the presence of multiple criteria, which are often in conflict. MCDM issues are common in everyday life [
4].
Supplier selection is intrinsically related to the Multi-Criteria Decision Making problem (MCDM) [
5]. MCDM is an effective tool used to solve complex selection issues including multiple criteria and options, especially for qualitative variables. Qualitative standards often have vague characteristics which are difficult to accurately define, making it difficult to synthesize evaluation results. The MCDM method will quantify qualitative criteria, calculate the total score of the evaluation subjects according to the weight of each criterion, and help decision makers to have a stronger and more accurate basis on which to make decisions. Some commonly used methods include The Technique for Order of Preference by Similarity to Ideal Solution (TOPSIS), Analytic Network Process (ANP), Analytic hierarchy process (AHP), Preference ranking organization method for enrichment evaluation (PROMETHEE), et al. [
5].
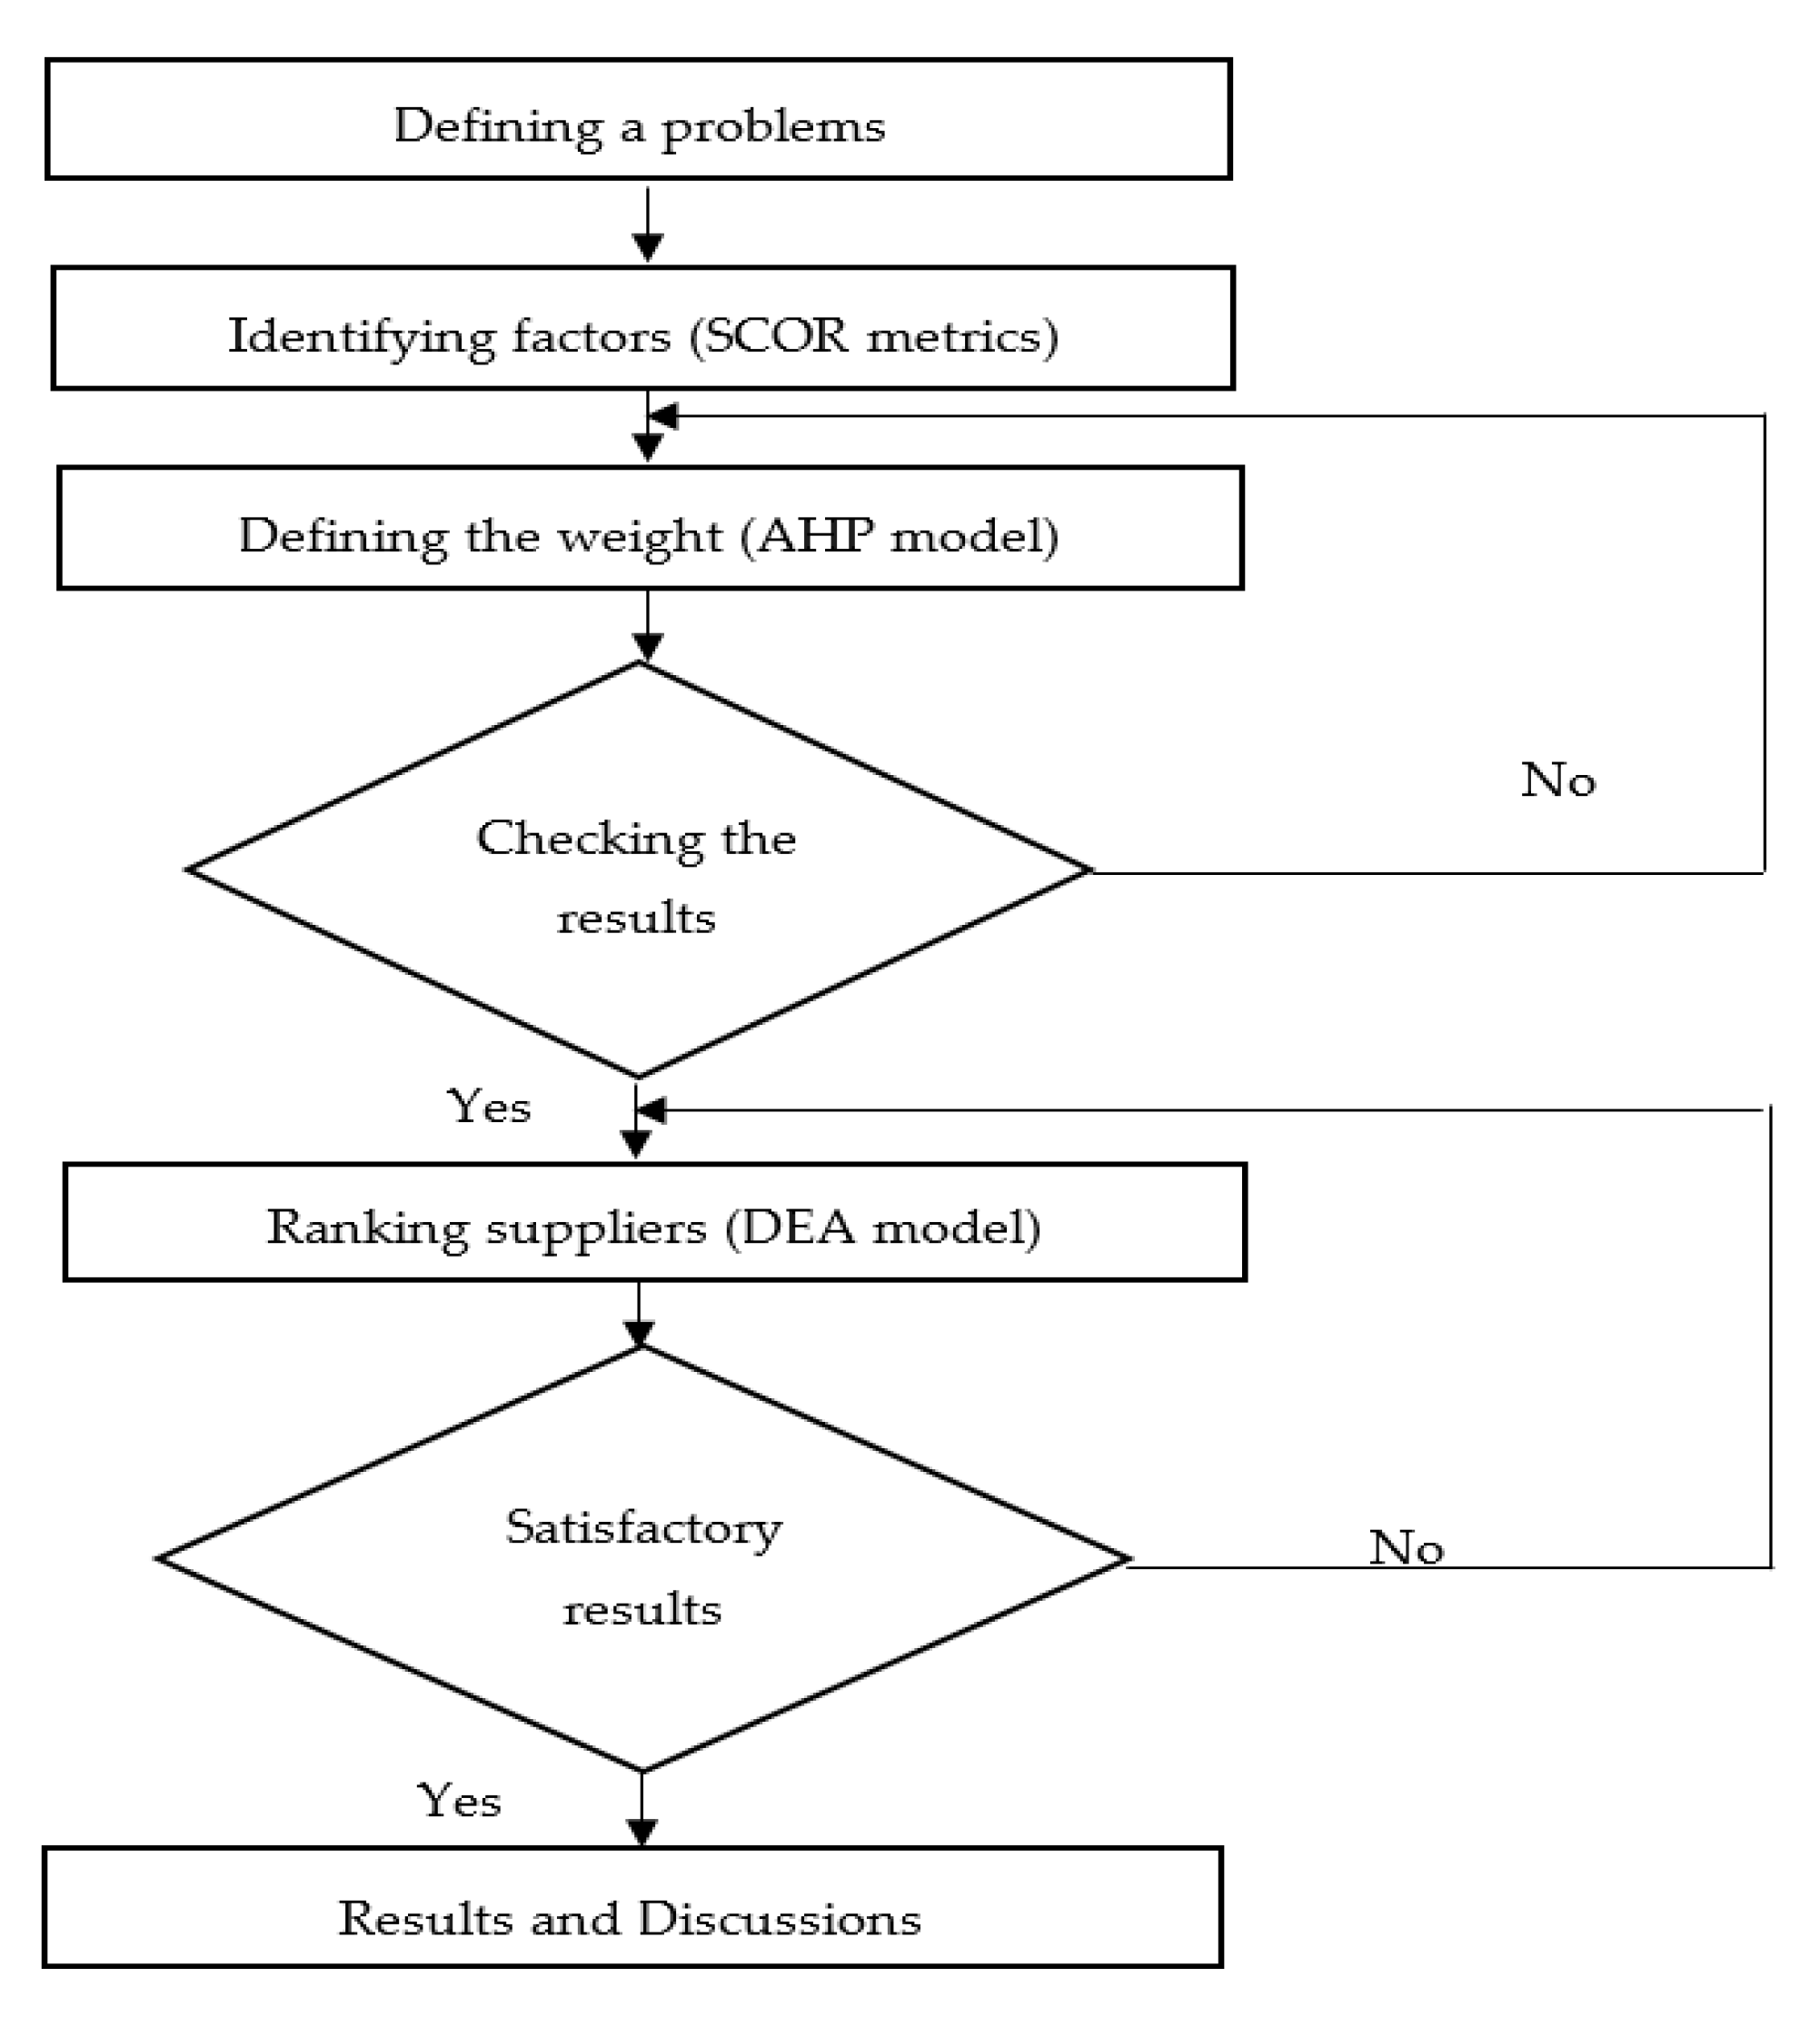
The goal of this study is to design an MCDM including the Supply Chain Operation Reference (SCOR) model, analytic hierarchy process (AHP) and the Data Envelopment Analysis (DEA) method to evaluate and select an optimal supplier in the oil industry. In the first step of research, the criteria used to evaluate potential suppliers are determined through the SCOR model; then, the analytical hierarchy process is proposed to evaluate the weight of criteria. The AHP can be applied for ranking alternatives, but the of selection a number of suppliers is practically limited because of the number of pairwise comparisons that need to be made, and a disadvantage of the FAHP approach is that input data, expressed in linguistic terms, depend on the experience of decision makers and thus involve subjectivity. Thus, we proposed the DEA model to rank alternatives in the final stage. Also, The DEA is presented to reaffirm conclusions as a systematic method and to improve upon the disadvantages of the FAHP model as mentioned above.
In this research, the author uses the SCOR model, AHP and the DEA method to evaluate and select the optimal supplier in the petroleum industry. The criteria used to evaluate potential suppliers are determined through the SCOR model. The weight of all criteria are defined by the AHP model through the expert’s opinion, and DEA is used to rank providers at the final stage. The primary goal of this research is to provide a modern MCDM model for supplier selection in the oil industry. This research also presents a useful guideline for supplier selection in other industries.
2. Literature Review
Supplier selection is basically a matter of MCDM. Robert Handfield et al. [
6] used the AHP model to illustrate the use of AHP as a decision support model to help managers understand the trade-off between environmental factors in their decision making. Then, they demonstrated how the AHP model can be used to assess the relative importance of various environmental characteristics to assess the relative performance of a number of potential suppliers. Reuven R. Levary [
7] has demonstrated that AHP is an appropriate method to assess and rank potential suppliers. In this study, the essential supplier characteristics were identified and considered in the supplier selection process. Farzad et al. [
8] discussed various methods regarding supplier selection; in addition, they presented the advantages and disadvantages of the selection methods, especially the AHP model.
William Ho et al. [
9] reviewed the literature of MCDM methods in supplier selection processes. This research not only provides evidence that multidisciplinary decision-making methods are better than traditional cost-based methods, but also assists researchers and decision-makers to adopt further methods to improve efficiency. Selecting suppliers is one of the most important activities of purchasing management in the supply chain. Supplier selection is a complex issue involving multiple qualitative and quantitative criteria. A trade-off between these tangible and intangible factors is essential in choosing the best supplier [
10]. Tahriri et al. [
10] incorporated AHP in selecting the best suppliers. The results show that the AHP process allows the introduction of optimal order quantities among selected suppliers to maximize the total purchase value. Zolfani et al. [
11] used an MCDM model to select suppliers. First, eight evaluation criteria, including cost, quality, distance, delivery reliability, reputation, technology level, compatibility, and development capability, are identified. The AHP model is used to calculate the weight of each criterion. Then, The CO mplex PR oportional AS sessment of alternatives to G rey relations (COPRAS-G) method was adopted to rank and select the optimal supplier.
Beikkhakhian et al. [
12] used fuzzy analytic hierarchy process (FAHP), the weight of suppliers’ rapid assessment criteria to be measured and set, as an input to the TOPSIS model to rank suppliers. He-Yau Kang et al. [
13] proposed a fuzzy analysis network process model to evaluate different aspects of suppliers to consider the feedback and interdependence of factors. The networks and elements are compared in pairs in an uncertain environment. Asamoah et al. [
14] used the AHP method to assess and select suppliers in a pharmaceutical manufacturing company in Ghana. The research has sought to use analytical process analysis to select the most appropriate raw material suppliers for artemether–lumefantrine antimalarial drugs. Rakesh D.Raut et al. [
15] used the Interpretive Structural Modeling (ISM) method to identify success factors in the sustainable supply chain management practices of the oil and gas industry. This research can help academics, government regulators, and practitioners highlight their efforts in implementing sustainable supply chain management at different organizational levels.
Bushra Luzon et al. [
16] used the AHP method to evaluate and determine weights for selected criteria including the quality, price, delivery, service and warranty and claims, competence engineering, manufacturing facilities and capacity, financial status, performance history and geographic location. Wood et al. [
17] applied Multi-Criteria Decision-Making techniques including fuzzy TOPSIS with flexible entropy weights for the purpose of selecting suppliers to develop petroleum industry facilities. José Felipe Figueiredo Barata et al. [
18] used a Multi-Criteria Decision-Making model to rank sustainable suppliers in the oil and gas industry in Brazil. In this study, the author has demonstrated the need for rapid sustainability evaluation along with the expansion of civilization. Similarly, the improvement of the supply chain is a need that has arisen in the oil and gas industry; in particular, it is responsible for the majority of CO
2 emissions into the atmosphere.
3. Methodology
3.1. Research Graph
In this research, the author uses the SCOR model, AHP and DEA model to assess and select the optimal supplier in the oil and gas industry. The three main phases of the research topic are shown as
Figure 1.
3.2. Basic Theory
3.2.1. Supply Chain Operation Reference Model
The SCOR model identifies the best applications, performance metrics and functional requirements of each core process, subprocess and supply chain operations. The SCOR model provides a standard structure and terminology to help companies unify a wide range of management tools, such as business process reconstruction, benchmarking, and practice analysis. SCOR’s tools help the company develop and manage its supply chain structure effectively [
19]. Basic properties of the SCOR model include cost, quality, organizational, service, relationship [
20].
3.2.2. Analytic Hierarchy Process (AHP)
The AHP was proposed by Saaty [
21]. The steps for the AHP process are as follows:
Step 1 Identify the problem and research objectives.
Step 2 Develop the hierarchical structure of the AHP model.
Based on the problem identification and research objectives made in Step 1, we set the hierarchical structure and define relationships between criteria as well as suppliers.
Step 3 Develop a pairwise comparison matrix.
In the pairwise comparison matrix, the value of the comparison matrix is the reciprocal of the opposite half of the symmetrical diagonal of the matrix, aij = 1/aij; Comparing pairs of standards together, the necessary assessment against an objective with n criteria can be calculated.
Step 4 Assess the consistency of the judgments and conduct a consequence–weight analysis after the comparison is made between pairs of indicators. Sum them up into a matrix of n rows and n columns. The m
ij element represents the importance of the row i indicator compared to the column index.
Step 5 Check consistency index.
Based on the real number matrix formed in Step 4, the largest eigenvector (λ
max) and consistency index (CI) are found.
where
is the largest eigenvector; n is number of criteria.
After calculating the maximum specific value, according to Saaty [
21], we can use the consistency ratio (CR). This ratio compares the degree of consistency with the objectivity (randomness) of the data:
where CI: consistency index; RI: random index.
The random index values are shown in
Table 1.
If CR ≤ 0.1, this is is satisfactory, whereas if CR ≥ 0.1, we have to re-evaluate the pair comparison matrix.
Step 6 Develop a super matrix.
After completing the above steps, a super matrix is formed in
Table 2 as follows:
Step 7 Calculate the weight of the target function.
The total weight for the function of 1 is
The total weight for the function of p is
3.2.3. DEA Model
The Charnes–Cooper–Rhodes (CCR) model is a basic DEA model [
22]. The definition of the CCR model is as follows:
In addition, the segment program as a linear program (LP) is as follows [
23] if
The linear program is equal to the fraction program [
24].
The Farrell model of a linear program (Equation (1)) with the variable ξ and non-negative vector α = α
1, α
2, α
3, …, α
f is [
23]
To avoid ineffective boundary points, we try the following linear sequence [
23]:
The CCR output orientation (CCR-O) has a dual multiplier model, which is denoted as [
23]
Banker et al. introduced an input-oriented Banker–Charnes–Cooper (BCC-I) model which can evaluate the effectiveness of DMU0 by solving the following linear equation:
We avoid incorrect border points by calling the linear program as follows [
23]:
Therefore, this is the first multiplier for the problem solved as follows [
23]:
The second multiplier provided by the linear program is performed as follows:
There are cases in which f and u are vectors and scalar v
0 may be positive or zero. Therefore, dual programs [
23] have equivalent BCC segment programs:
A measurement model based on an input slacks-based measure (SBM) stack—the SBM effective input orientation (SBM-I C)—is SBM input-oriented and assumes a constant ratio [
23]:
4. Case Study
To verify the model, the author conducted a survey of suppliers at ABC Petroleum Joint Stock Company—one of the leading oil and gas companies in Vietnam. The company is increasingly expanding investment and improving its supply chain because of the increasing oil and gas demand. Based on the opinions of experts (including the head of the purchasing department) and the ability to provide raw material, prices, and the ability to fulfill orders, 10 potential suppliers that typically bring high efficiency to the business are identified.
The process of screening and identifying a list of potential suppliers is based on supply capacity, financial capacity and other factors. The list of potential suppliers is shown in
Table 3.
The main and sub-criteria for selecting oil and gas suppliers are determined from the SCOR model and the literature review, which are shown in
Table 4.
After collecting all necessary criteria and suppliers, the matrix related to the target are built. The decision maker then compares the attributes associated with the criteria. The pairwise comparison matrices are performed and the weight vector of each matrix are calculated. All properties are compared using individual criteria. By comparing the main pairs of criteria together, we obtain
Table 5 as follows:
To calculate the weights of the criteria, we take each value divided by the sum of each corresponding column. Then, we calculate the average of each row, which is the weight corresponding to each criterion as shown in
Table 6.
From the table above, we can calculate the weight vector as follows:
As the number of criteria is 5, we take n = 5,
and CI is calculated as follows:
With n = 5, we have an RI of 1.12.
We have a consistency ratio of 0.07896 ≤ 0.1, so the data comparing the main criteria pairs is appropriate and does not need to be re-evaluated.
The weights of all suppliers are defined by the AHP model, which are shown in
Table 7.
In summary, a graphic of the DEA model for the analysis of DMUs (suppliers) along with three inputs and three outputs is shown in
Figure 2. The results of the AHP model for the ranking of various suppliers on qualitative attributes are utilized in the output qualitative benefits of the DEA model [
25,
26]. In our situation, the inputs are those factors that organizations would consider as an improvement if they were decreased in value (i.e., smaller values are better), whereas outputs are those factors that organizations would consider as improvements if they were increased in value (i.e., larger is better). This is a standard approach when seeking to use DEA as a discrete alternative multiple criteria decision-making tool [
26].
Raw data are provided by case organization, as shown in
Table 8.
5. Discussion
Supplier evaluation and selection has been identified as an important problem which can affect the efficiency of a supply chain. It can be seen that selecting a supplier is complicated, in that decision-makers must have a wide view concerning qualitative and quantitative features to assess the symmetrical impact of the criteria to reach the most accurate result.
In this empirical study, the authors collected data from 10 oil suppliers in Vietnam. A hierarchical structure is established to select the best suppliers and is built based on the SCOR metric. Next, an analytical hierarchy process is proposed to evaluate the weight of criteria. The AHP can be applied for ranking alternatives, but the number of suppliers selected is practically limited because of the number of pairwise comparisons that need to be made; a disadvantage of the AHP approach is that input data, expressed in linguistic terms, depend on the experience of decision makers and thus involve subjectivity. Thus, we proposed the DEA model to rank alternatives in the final stage. As the results showed that DMU_1, DMU_4 and DMU_10 are identified as extremely efficient, all six models are shown in
Table 9, which have a condition response to the enterprise’s supply requirement. This research provides a Multi-Criteria Decision Making model for supplier evaluation and selection in oil production projects. This research also presents useful guidelines for supplier selection processes in other industries.
6. Conclusions
Multiple-Criteria Decision Making (MCDM) is an effective tool used to solve complex selection issues including multiple criteria and options, especially for qualitative variables. Qualitative standards often have vague characteristics which are difficult to accurately define, making it difficult to synthesize evaluation results according to criteria and thus difficult to reach a conclusion or make an accurate decision. The MCDM method will quantify these criteria, calculate the total score of the evaluation subjects according to the weight of each criterion and help decision makers to have a stronger and more accurate outcome. Many studies have applied the MCDM approach to various fields of science and engineering, and this number has been increasing over the past years. One of the fields to which the MCDM model has been applied is the supplier selection problem. Thus, the authors proposed the MCDM model for supplier selection and evaluation in this research.
In this research, the author used SCOR, AHP and DEA to assess and select the optimal supplier in the oil industry. The criteria used to evaluate potential suppliers were determined through the SCOR model. The weights of all suppliers were determined by the AHP model through expert opinion surveys, and the DEA model was used to rank providers at the final stage. After the model implementation and the results were shown in
Table 9, DMU_1, DMU_4 and DMU_10 were shown to be the best suppliers.
For future research, the author proposes to consider more criteria in the supplier selection process. Particular attention should be paid to the sustainable development factor, which is evaluating sustainability, which is increasing rapidly with the expansion of the period of industrialization and modernization. Similarly, the improvement of the supply chain is a need that has arisen in the oil and gas industry; in particular, it is responsible for the majority of CO2 emissions in the atmosphere.
Author Contributions
Conceptualization, C.-N.W., H.-T.T., T.-P.H. and V.-T.N.; Data curation, C.-N.W., V.-T.N. and Y.-F.H.; Formal analysis, T.-P.H. and Y.-F.H.; Funding acquisition, H.-T.T.; Investigation, H.-T.T.; Methodology, C.-N.W., V.-T.N. and Y.-F.H.; Project administration, C.-N.W. and V.-T.N.; Resources, C.-N.W., H.-T.T., T.-P.H. and V.-T.N.; Software, T.-P.H.; Supervision, Y.-F.H.; Validation, H.-T.T.; Writing—original draft, H.-T.T. and V.-T.N.; Writing—review & editing, C.-N.W., T.-P.H. and Y.-F.H. All authors have read and agreed to the published version of the manuscript.
Funding
This research was partly supported by National Kaohsiung University of Science and Technology, and project number 108-2622-E-992-017-CC3 from the Ministry of Sciences and Technology in Taiwan.
Acknowledgments
The authors appreciate the support from National Kaohsiung University of Science and Technology, Hong Bang International University, Ministry of Sciences and Technology in Taiwan.
Conflicts of Interest
The authors declare no conflict of interest
References
- Garside, M. Daily Demand for Crude Oil Worldwide from 2006 to 2020 (in Million Barrels)*. Available online: https://www.statista.com/statistics/271823/daily-global-crude-oil-demand-since-2006/ (accessed on 10 October 2019).
- Thoibaotaichinhvietnam. Tập Trung Hoàn Thiện thể chế, Chính Sách để PVN và Ngành Dầu Khí Phát Triển. Available online: http://thoibaotaichinhvietnam.vn/pages/thoi-su/2019-01-25/tap-trung-hoan-thien-the-che-chinh-sach-de-pvn-va-nganh-dau-khi-phat-trien-67155.aspx (accessed on 10 October 2019).
- Minh, L. Giá Dầu Giảm Trước triển Vọng Nhu cầu toàn cầu yếu Hơn. Available online: https://www.msn.com/vi-vn/sports/news/gi%C3%A1-d%E1%BA%A7u-gi%E1%BA%A3m-tr%C6%B0%E1%BB%9Bc-tri%E1%BB%83n-v%E1%BB%8Dng-nhu-c%E1%BA%A7u-to%C3%A0n-c%E1%BA%A7u-y%E1%BA%BFu-h%C6%A1n/ar-AACLOQ7 (accessed on 10 October 2019).
- Xu, L.; Yang, J.-B. Introduction to Multi-Criteria Decision Making and the Evidential Reasoning Approach. Ph.D. Thesis, Manchester School of Management Manchester, Manchester, UK, 2001. [Google Scholar]
- Lưu, Q.Đ.; Bùi, H.P.; Nguyễn, T.P.T.; Trần, T.L.A. Xây dựng mô hình ra quyết định đa tiêu chuẩn tích hợp để lựa chọn và phân nhóm nhà cung cấp xanh. Tạp chí Khoa học ĐHQGHN:Kinh tế và Kinh doanh 2017, 33, 43–54. [Google Scholar]
- Deng, X.; Hu, Y.; Deng, Y.; Mahadevan, S. Supplier selection using AHP methodology extended by D numbers. Expert Syst. Appl. 2014, 41, 156–167. [Google Scholar] [CrossRef]
- Levary, R.R. Using the analytic hierarchy process to rank foreign suppliers based on supply risks. Comput. Ind. Eng. 2008, 55, 535–542. [Google Scholar] [CrossRef]
- Farzad, T.; Rasid, O.M.; Aidy, A.; Mohd, Y.R. A review of supplier selection methods in manufacturing industries. Suranaree J. Sci. Technol. 2008, 15, 201–208. [Google Scholar]
- Ho, W.; Xu, X.; Dey, P.K. Multi-criteria decision making approaches for supplier evaluation and selection: A literature review. Eur. J. Oper. Res. 2010, 202, 16–24. [Google Scholar] [CrossRef]
- Tahriri, F.; Osman, M.R.; Ali, A.; Yusuff, R.; Esfandiary, A. AHP approach for supplier evaluation and selection in a steel manufacturing company. J. Ind. Eng. Manag. 2008, 1, 54–76. [Google Scholar]
- Zolfani, S.H.; Chen, I.-S.; Rezaeiniya, N.; Tamošaitienė, J. A hybrid MCDM model encompassing AHP and COPRAS-G methods for selecting company supplier in Iran. Technol. Econ. Dev. Econ. 2012, 18, 529–543. [Google Scholar] [CrossRef]
- Beikkhakhian, Y.; Javanmardi, M.; Karbasian, M.; Khayambashi, B. The application of ISM model in evaluating agile suppliers selection criteria and ranking suppliers using fuzzy TOPSIS-AHP methods. Expert Syst. Appl. 2015, 42, 6224–6236. [Google Scholar] [CrossRef]
- Kang, H.-Y.; Lee, A.H.; Yang, C.-Y. A fuzzy ANP model for supplier selection as applied to IC packaging. J. Intell. Manuf. 2012, 23, 1477–1488. [Google Scholar] [CrossRef]
- Asamoah, D.; Annan, J.; Nyarko, S. AHP approach for supplier evaluation and selection in a pharmaceutical manufacturing firm in Ghana. Int. J. Bus. Manag. 2012. [Google Scholar] [CrossRef]
- Raut, R.D.; Narkhede, B.; Gardas, B.B. To identify the critical success factors of sustainable supply chain management practices in the context of oil and gas industries: ISM approach. Renew. Sustain. Energy Rev. 2017, 68, 33–47. [Google Scholar] [CrossRef]
- Luzon, B.; El-Sayegh, S.M. Evaluating supplier selection criteria for oil and gas projects in the UAE using AHP and Delphi. Int. J. Constr. Manag. 2016, 16, 175–183. [Google Scholar] [CrossRef]
- Wood, D.A. Supplier selection for development of petroleum industry facilities, applying multi-criteria decision making techniques including fuzzy and intuitionistic fuzzy TOPSIS with flexible entropy weighting. J. Nat. Gas Sci. Eng. 2016, 28, 594–612. [Google Scholar] [CrossRef]
- Barata, J.F.F.; Quelhas, O.L.G.; Costa, H.G.; Gutierrez, R.H.; Lameira, V.D.J.; Meiriño, M.J. Multi-criteria indicator for sustainability rating in suppliers of the oil and gas industries in Brazil. Sustainability 2014, 6, 1107–1128. [Google Scholar] [CrossRef]
- Logistics4vn. SCOR Là Gì? Giới Thiệu Mô Hình SCOR (Supply Chain Operation Reference). Available online: https://logistics4vn.com/scor-la-gi-supply-chain-operation-reference (accessed on 10 October 2019).
- Nazim, R.; Yaacob, R.A.I.R. Criteria for Supplier Selection: An Application of AHP-SCOR Integrated Model (ASIM). Int. J. Supply Chain Manag. 2017, 6, 284–290. [Google Scholar]
- Saaty, T.L. An exposition of the AHP in reply to the paper “remarks on the analytic hierarchy process”. Manag. Sci. 1990, 36, 259–268. [Google Scholar] [CrossRef]
- Wang, C.-N.; Huang, Y.-F.; Cheng, I.-F.; Nguyen, V.T. A Multi-Criteria Decision-Making (MCDM) Approach Using Hybrid SCOR Metrics, AHP, and TOPSIS for Supplier Evaluation and Selection in the Gas and Oil Industry. Processes 2018, 6, 252. [Google Scholar] [CrossRef]
- Kahraman, C.; Ruan, D.; Tolga, E. Capital budgeting techniques using discounted fuzzy versus probabilistic cash flows. Inf. Sci. 2002, 142, 57–76. [Google Scholar] [CrossRef]
- Charnes, A.; Cooper, W.; Rhodes, E. Measuring the efficiency of decision making units. Eur. J. Oper. Res. 1978, 2, 429–444. [Google Scholar] [CrossRef]
- Sarkis, J. A methodological framework for evaluating environmentally conscious manufacturing programs. Comput. Ind. Eng. 1999, 36, 793–810. [Google Scholar] [CrossRef]
- Shang, J.; Sueyoshi, T. A unified framework for the selection of a Flexible Manufacturing System. Eur. J. Oper. Res. 1995, 85, 297–315. [Google Scholar] [CrossRef]
© 2020 by the authors. Licensee MDPI, Basel, Switzerland. This article is an open access article distributed under the terms and conditions of the Creative Commons Attribution (CC BY) license (http://creativecommons.org/licenses/by/4.0/).


