Article

Flow and Diffusion Characteristics of Typical Halon Extinguishing Agent Substitute under Different Release Pressures

School of Chemical Engineering, Nanjing University of Science and Technology, Nanjing 210094, China
*
Authors to whom correspondence should be addressed.
Processes 2020, 8(12), 1684; https://doi.org/10.3390/pr8121684
Submission received: 3 December 2020 / Revised: 16 December 2020 / Accepted: 16 December 2020 / Published: 21 December 2020
(This article belongs to the Special Issue Green Technologies for Production Processes)

Abstract

:
To provide guidance towards reducing the weight of the HFC-125 storage vessel by reducing the release pressure and to reveal the effects of release pressure on the extinguishing efficiency of HFC-125, we investigated the flow and diffusion characteristics of HFC-125 under six release pressures in the present study. The influence of release pressure on the degree of superheat, injection duration, pressure loss, jet angle, and concentration distribution were analyzed. Results show that the degree of superheat and the injection duration both decreased with the release pressure. The bubble expansion in the HFC-125 could slow down the pressure decrease in the storage vessel. The flow process in the pipeline can be divided into three phases: pipeline filling, stable flow, and mixed gases release. Both of the maximum and mean values of the pipeline pressure loss increased with the release pressure. The maximum concentration value decreased with the increase of the distance from the nozzle. The maximum concentration value in the near field from the nozzle increased with the release pressure. The concentration and holding time (duration above 17.6% volume concentration) of HFC-125 in the near field from the nozzle met the requirements of minimum performance standards (MPS) for HFC-125.

1. Introduction

Halon fire extinguishing agents, especially for Halon 1301, negatively impact the ozone layer and have a high global warming potential (GWP) index, which goes against the environment protection and the sustainable development of the world [1]. The search for appropriate alternatives for the halon fire extinguishing agents has received increasing attention in the past decades [2,3]. Pentafluoroethane (HFC-125) does not destroy the ozone layer and its GWP index is only half of that of Halon 1301. It is regarded as a candidate substitute for Halon 1301 in the engine nacelle and auxiliary power unit of commercial aircrafts at low temperatures [4,5]. However, when HFC-125 is applied in aircrafts, owing to the lower extinguishing efficiency of HFC-125 compared with Halon 1301, more HFC-125 agents (an increase of approximately 80% in weight) and larger fire extinguishing agent storage vessels (approximately 2.3 to 4.3 times in volume larger than that of Halon 1301) are needed [6]. Such an increase in weight and volume will pose a great challenge to the aircraft design in the aspect of cost control, fuel consumption, and safety [7], which goes against the sustainable development of the aviation industry. It is noted that if the release pressure is appropriately reduced on the condition of meeting the requirements of the airworthiness provisions for the volume concentration and holding time of the fire extinguishing agent, the weight of the agent storage vessel can be reduced, which is considerably beneficial to the weight reduction of the aircraft. The weight reduction can greatly reduce the greenhouse gas emissions generated by the fuel consumption. In order to evaluate whether the requirements of the minimum performance standards (MPS) [8] for HFC-125 can be satisfied or not on the condition of reducing the release pressure, it is of great necessity to study the flow characteristics in the pipeline and the diffusion behaviors in the power nacelle of HFC-125 under different pressures.
Some attention was devoted to the flow behaviors of fire extinguishing agents in pipelines. However, few studies have been reported on HFC-125. Williamson studied the flow behaviors of Halon 1301 in pipelines under 2.48 MPa [9]. He found that the pressure decreased in a nonlinear way when the Halon 1301 agent flowed in the pipeline, and the agent boiling would slow down the pressure decrease. Moreover, the release rate of the Halon 1301 agent increased with the bottle volume. In the case of 5.2 MPa, Elliott et al. [10] proposed a homogeneous and equilibrium model of two-phase (gas and liquid phase) flow to estimate the flow behaviors of Halon 1301 in the pipeline. It was found that the predicted data based on the model were in accordance with the experimental data. Yang et al. [11] presented a two-phase (gas and liquid phase) equilibrium model to calculate the thermodynamic properties and filling conditions of five selected agents: HFC-227ea, CF3I, FC-218, HFC-125, and CF3Br. The accuracy of the presented model was verified under the release pressures from 2.8 to 4.1 MPa. The predicted values based on the two-phase quilibrium model were found to be in good agreement with the measured values. Tuzla et al. [12] developed a computer code to predict the single-phase and two-phase flow behaviors of the fire extinguishing agents in the pipeline under 5.71 MPa on the basis of the multi-phase flow algorithms generally used in the nuclear power plant. Kim et al. [13] employed FLUENT software to simulate the flow behaviors of Halon 1301 in the fire extinguishing system under 4.1 MPa. The volume percentage of the Halon 1301 agent in the pipeline and the outlet was obtained. In addition, the release behaviors of the Halon 1301 agent in the case of different surface areas of the rupture disk were analyzed. The results indicated that the release rate of the Halon 1301 agent increased with the surface area of the rupture disk. Moreover, it was found that little influence of the pipeline diameter was exerted on the release process of the Halon 1301 agent in the storage vessel. However, the release rate of the Halon 1301 agent at the pipeline outlet increased with the pipeline diameter. Some studies were reported on the diffusion behaviors of fire extinguishing agents in enclosure spaces, with the majority being numerical simulation studies. Among them, the study concerning the diffusion of HFC-125 in enclosure spaces was rare. Sarkos [14] studied the diffusion behaviors of Halon 1301 in a full-scale aircraft cabin under 2.48 MPa. The profiles of the agent concentration, visibility, pressure, temperature, noise, etc. were measured. The results indicated that the influence of the ultralow-pressure, over-temperature, and the agent concentration overshoot on passengers can be alleviated by the air disturbance. In addition, the air disturbance was helpful in the diffusion of the agent. The fire extinguishing agent released from the ceil can finally enter the lavatory and other complex areas through diffusion. Niu et al. [15] employed fire dynamics simulator (FDS) to study the diffusion behaviors of the Halon 1301 agent in the helicopter engine nacelle in the case of no-ventilation. The concentration distribution of the Halon 1301 agent in 6–10 s in the case of different mass flow rates and injection time were measured. It was found that reducing the mass flow rate of the fire extinguishing agent was beneficial to improve the system reliability and reduce the amount of the fire extinguishing agent. Using the lumped parameter approach, Kurokawa et al. [16,17] proposed a one-dimensional model to predict the volume concentration of the Halon 1301 fire extinguishing agent with the assumption that the profile of the flow rate was as a ladder shape. The proposed model was found to acceptably predict the volume concentration of the fire extinguishing agent. Adopting Fluent software, Zaparoli [18] investigated the diffusion behaviors of the Halon 1301 agent in the cases of three air flow rates in the cargo hold of the aircraft. It was indicated that the agent concentration decreased continuously with time when the air flow rate was 0.08 kg/s. Using Hflowx and Fluent, Lee [19] simulated the diffusion of the fire extinguishing agent (HFC-125, CF3I, and Halon 1301) in the engine nacelle and auxiliary power unit (APU) nacelle on the basis of a one-dimensional two-phase flow algorithm. It was found that small differences occurred between the simulation results and the experimental results. In summary, the flow and diffusion behaviors of the Halon fire extinguishing agent have been analyzed under single release pressure in the previous studies. However, scarce attention was focused on the flow and diffusion behaviors of HFC-125. Moreover, it is indicated in the previous studies that the flow and diffusion characteristics of the fire extinguishing agent are in close relationship with the volume of the storage vessel, the pipe diameter, the nozzle location and configuration, the outlet flow rate, the degree of phase transition, etc., whose design are greatly dependent on the initial release pressure. Therefore, considering the urgent need of the alternatives for the halon fire extinguishing agents and the deduction of the aircraft weight, it is of considerable necessity and importance to study the flow and diffusion behaviors of HFC-125 under different release pressures.
In the present study, the flow behaviors in the pipeline and the diffusion behaviors in the enclosure spaces of HFC-125 were studied under different release pressures using a full-scale airborne fire extinguishing system in the engine nacelle. Many parameters including the degree of superheat, the injection duration, the jet structure, and the concentration distribution were measured and discussed. The effects of release pressure on the above-mentioned parameters were then analyzed.

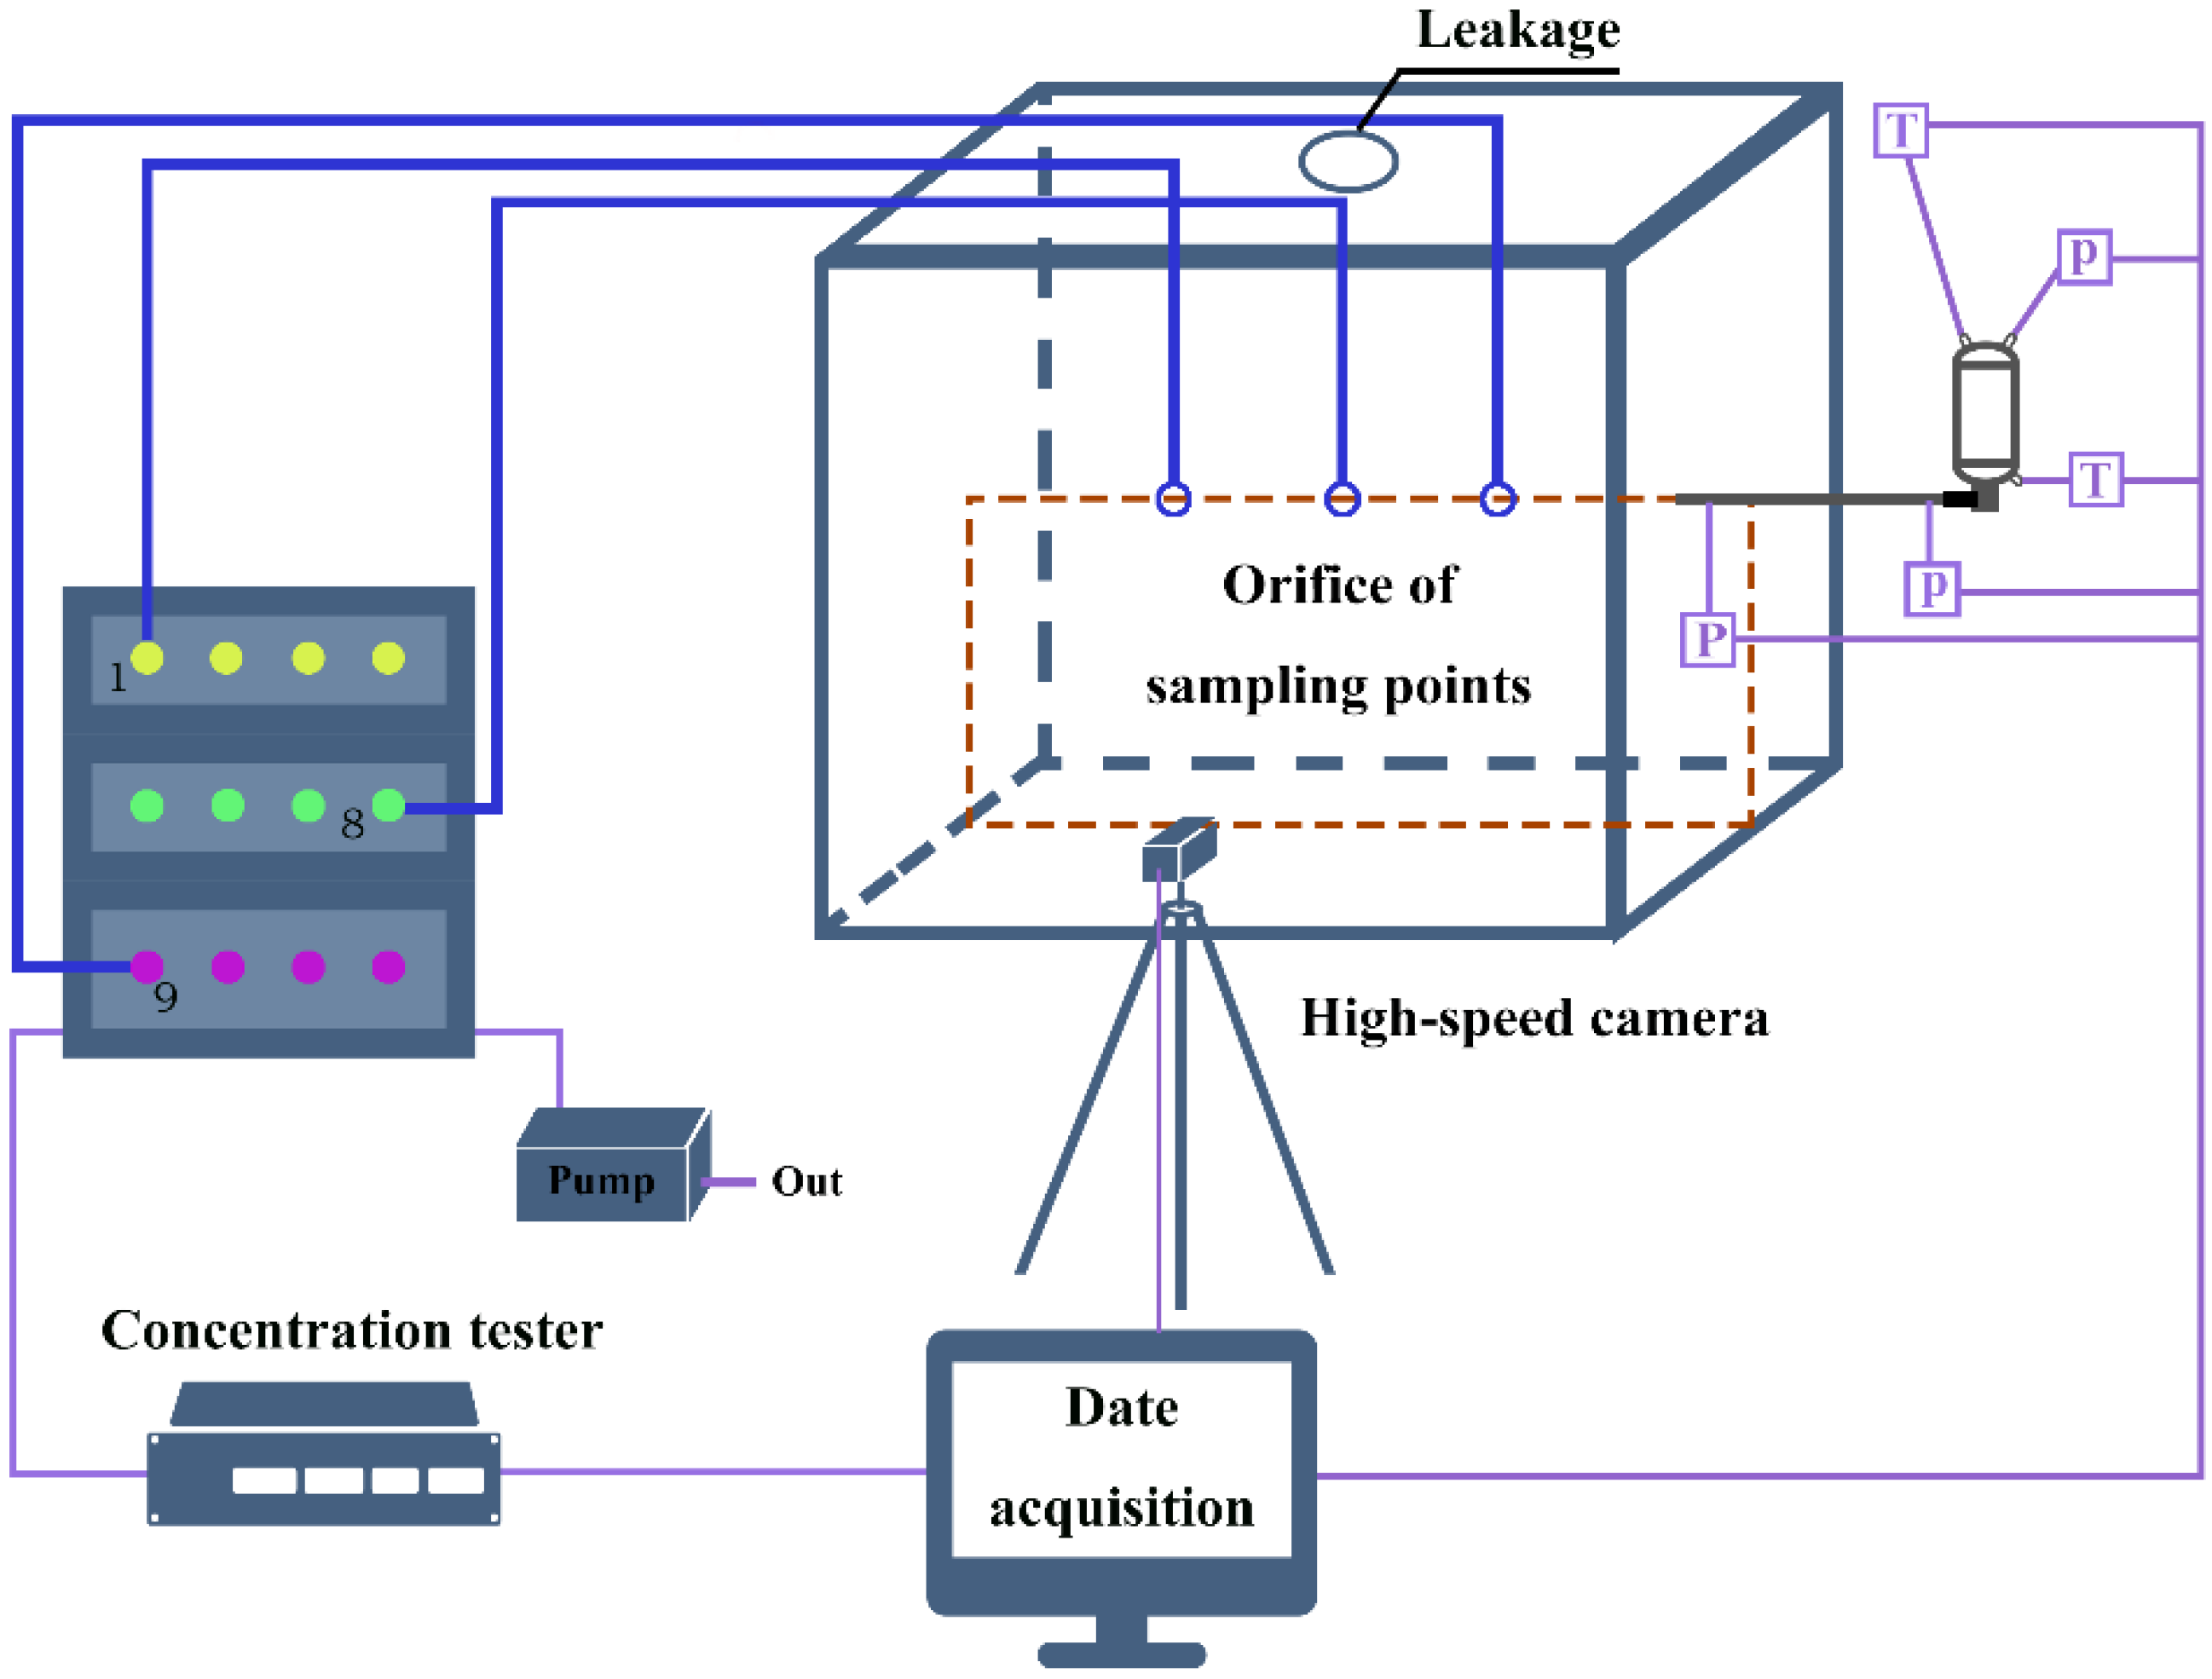
2. Experiment Apparatus

Figure 1 shows the schematic diagram of the full-scale airborne fire extinguishing system. It was mainly composed of 3 parts: agents release system, enclosure space, and data acquisition system. The agents release system consisted of a high-pressure storage vessel with the working capacity of 1.4 L, a vessel head valve, a pipe, and a nozzle. The storage vessel was pressurized by nitrogen to drive the agents in the storage vessel. In the present study, the storage vessel was filled with HFC-125 of 0.95 kg. In order to saturate the nitrogen dissolved in the fire extinguishing agent, we increased the vessel pressure slowly by nitrogen to 2.41, 2.76, 3.1, 3.45, 3.79, and 4.14 MPa under 294.25 K. The vessel head valve was installed at the outlet of the vessel to control the opening and close of the fire extinguishing system. The downstream pipe was 2400 mm long and 15.6 mm in diameter and employed the same straight-through nozzle. The diffusion characteristics of the fire extinguishing agent jet was proceeded in an enclosure space (2200 mm (long) × 2300 mm (wide) × 2000 mm (high)) with a pressure relief port.
The data acquisition system consisted of two K-type thermocouples, three pressure transmitters, a fire extinguishing agent concentration tester, and a high-speed camera. The variations of pressure in the vessel and pipeline and the equilibrium temperature of the agents throughout the release process were monitored by the pressure transmitter and the thermocouple, respectively. The thermocouples were installed at the top and bottom of the vessel. Three pressure transmitters with the range of 0–5 MPa were installed to record the vessel pressure at the top of the vessel (P) and the pressure loss of the HFC-125 agent at the inlet of the pipe (Pin) and the inlet of the nozzle (Pout) in the pipeline. The length between Pin and Pout in the downstream pipeline was 2 m. There were 12 channels in the fire extinguishing agent concentration tester, and the measurement range was 0–80%. It was noted that the concentration mentioned here refers to the volume concentration of the gaseous fire extinguishing agent. The concentration distribution of the HFC-125 at 3 imaginary isometric sections (shown in Figure 2) was measured and analyzed in the present study. Therein, Section II was the central section of the enclosure space, and Section I and III were 550 mm away from the left and right of Section II, as shown in Figure 2. Point 2, point 4, and point 10 were located on the circle with a diameter of 109.7 mm, while point 3, point 5, and point 11 were located on the circle with a diameter of 219.4 mm. Point 12 was located on the circle with a diameter of 329.1 mm. The orifices of the sampling pipe were fixed at the 12 points located in the enclosure space to measure the concentration of the fire extinguishing agent. A Photron FASTCAM UX50 high-speed camera with the frame rate of 1000 fps was used to study the diffusion behaviors of the fire extinguishing agent in the ejection process in the enclosure space.

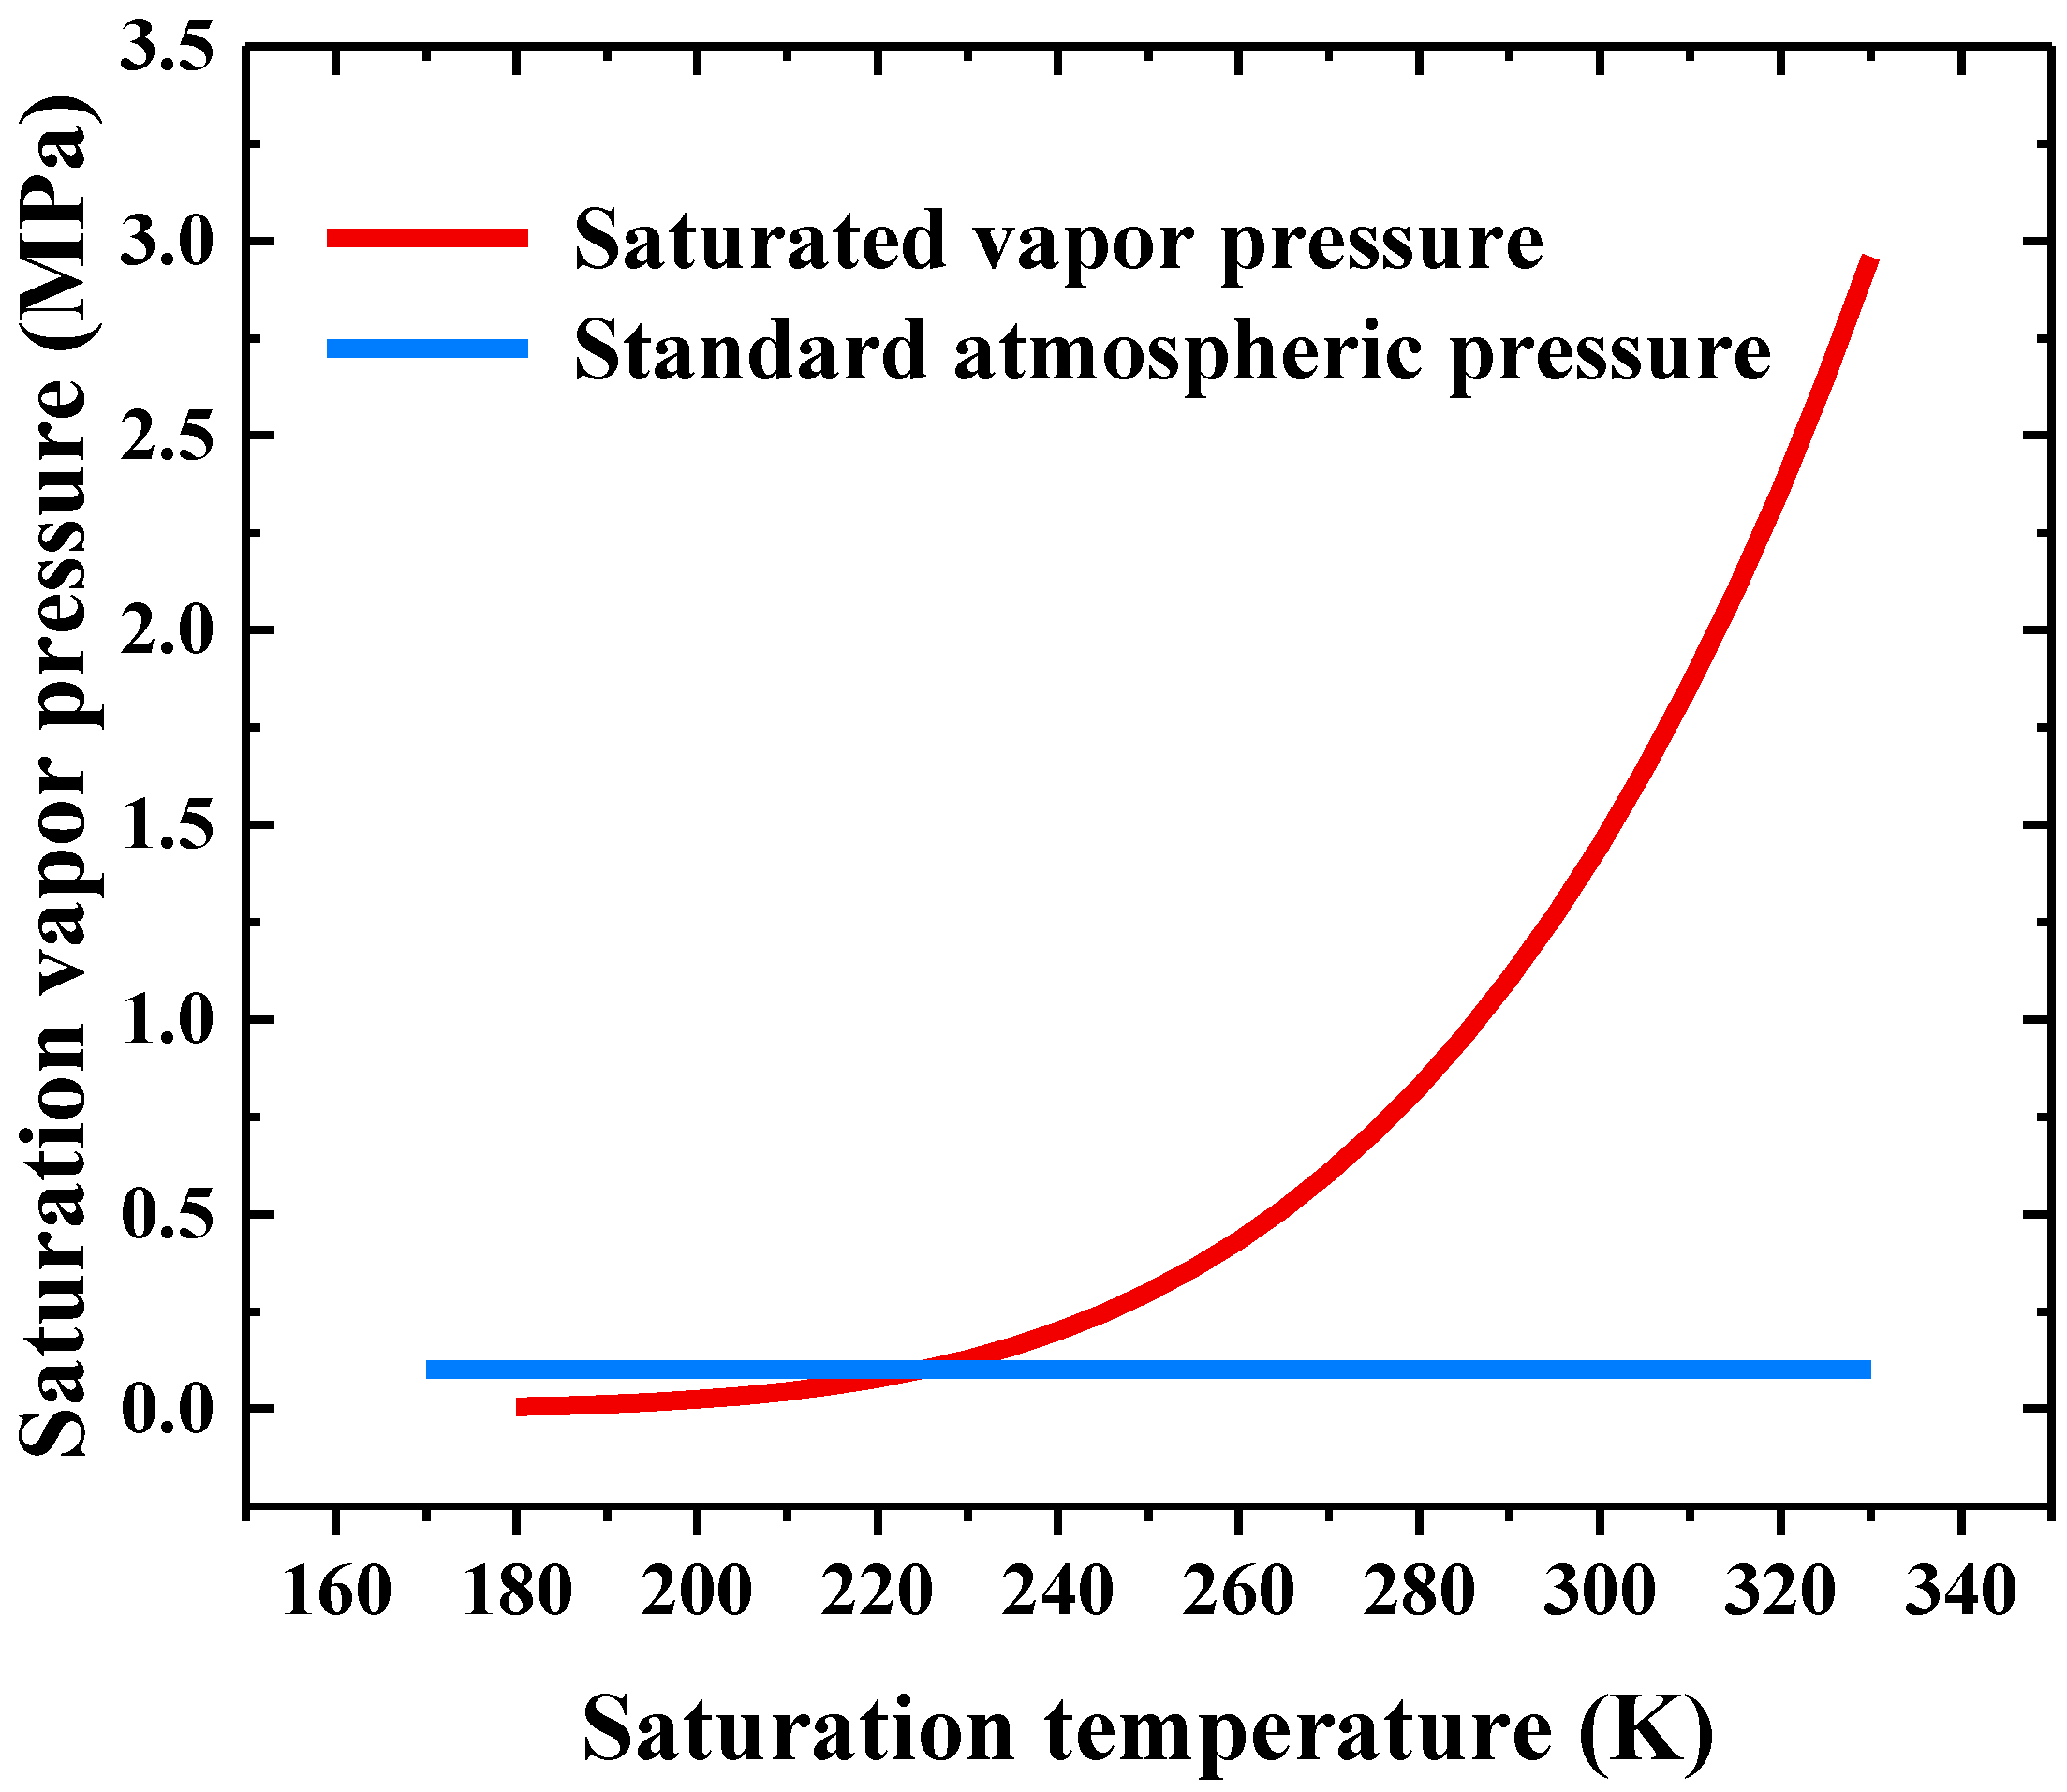
3. Fire Extinguishing Agent Properties and Experimental Conditions

HFC-125 is named pentafluoroethane, whose molecular formula is C2HF5. Its molecular weight is 120.02 and its boiling point at standard atmospheric pressure is 224.7 K. It is in a gas state under normal temperature and pressure, while it can be liquefied when it is pressured. The value of ozone depletion potential (ODP) of HFC-125 is far below 0.001, and it has been recognized as the candidate substitute for the halon fire extinguishing agents by the EPA (United States Environmental Protection Agency)’s Significant New Alternatives Policy (SNAP).
In the present study, the structure of the storage vessel and filling conditions were consistent with those of the airborne APU fire extinguishing system. The flow and diffusion characteristics of HFC-125 were studied under six release pressures of 2.41, 2.76, 3.1, 3.45, 3.79, and 4.14 MPa.

4. Results and Discussion

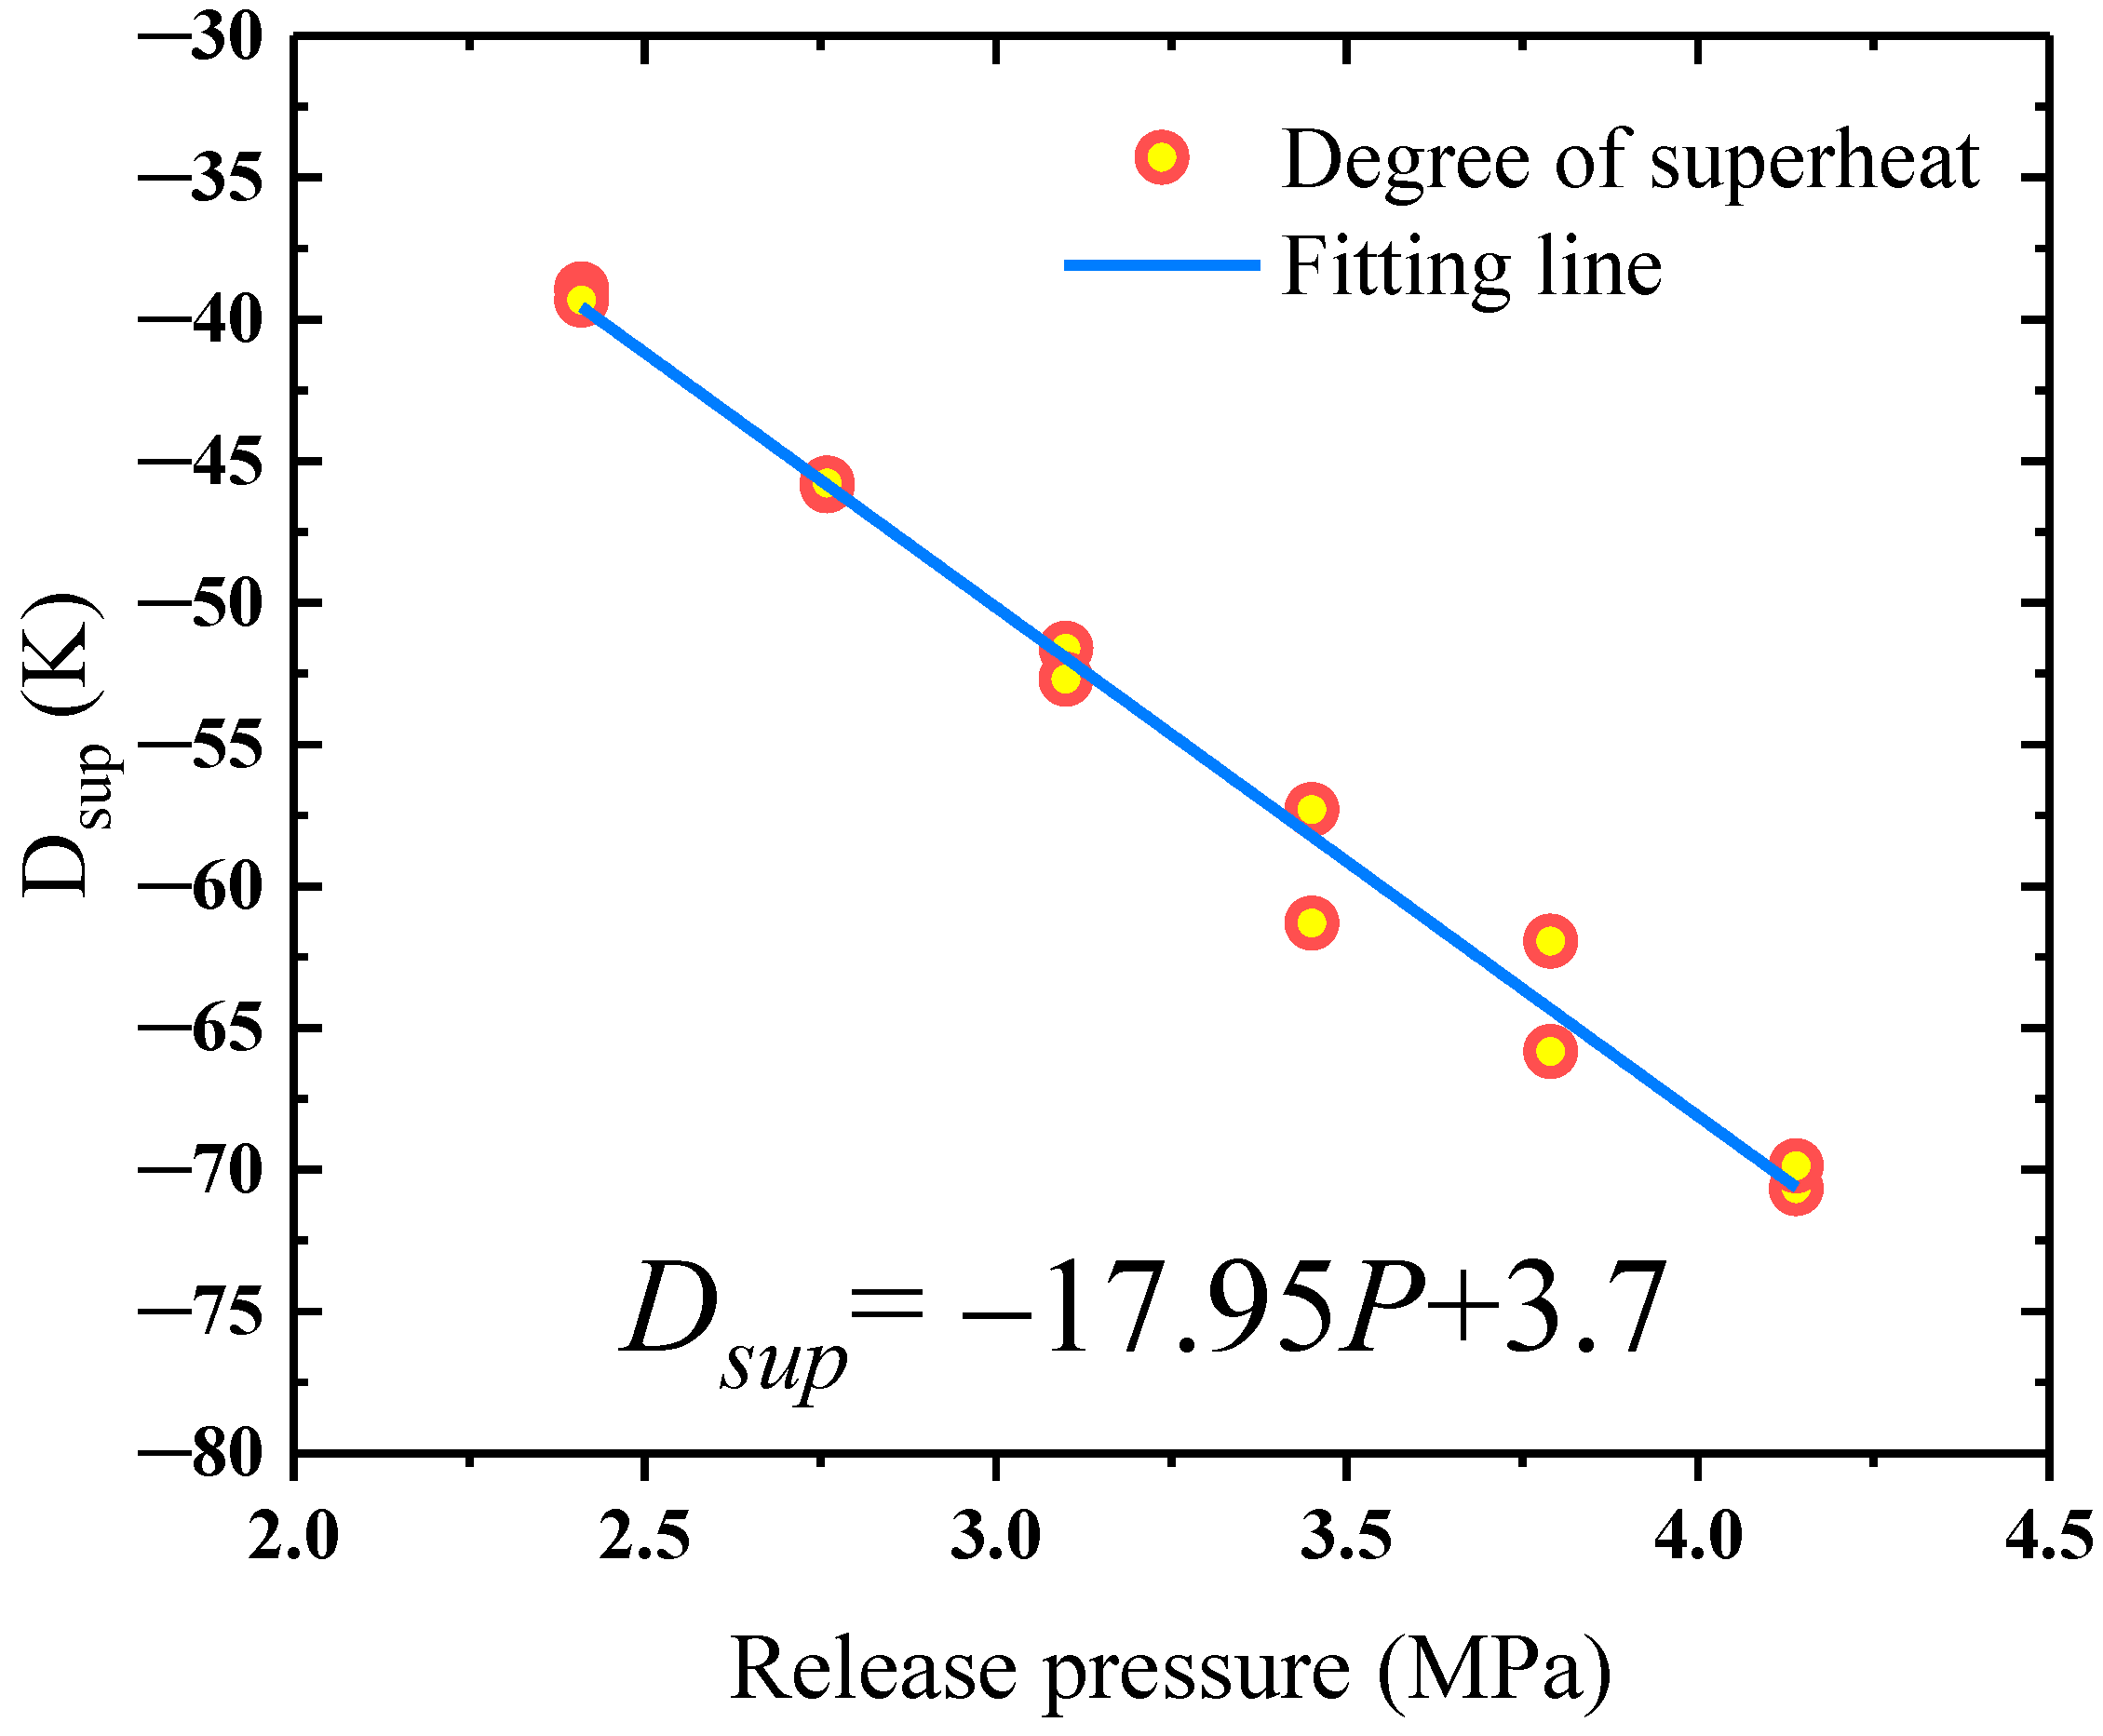
4.1. Degree of Superheat under Different Release Pressures

It is reported that the flow and diffusion characteristics will be greatly affected in a complex unsteady flow field yielded by the different release pressures [20]. Different from the conventional liquid jet, which is greatly dependent on the surface evaporation of the broken liquid droplets, the thermodynamic parameters are the main factors that affect the jet characteristics of the gas fire extinguishing agent. Figure 3 shows the relationship between the saturation vapor pressure and the saturation temperature of HFC-125; the boiling point of HFC-125 is 224.7 K (−48.45 °C). Even during the release process, the liquidus temperature of HFC-125 still greatly exceeds its boiling point. That is, the HFC-125 agent is always in the state of superheat and the phenomenon of jet expansion will occur in the release process. Since a mass of bubbles are produced due to the nucleation of the HFC-125 agent in the superheated state, the HFC-125 agent expands in the vessel. The expansion of the HFC-125 agent in the flow process is influenced by the release pressure. Meanwhile, the bubble expansion can always retard the pressure drop during the release process.
In general, the phenomenon of superheat can be quantitatively characterized in two forms, namely, the degree of superheat (Dsup) and the dimensionless degree of superheat (dsup). They are generally adopted to determine the generation and growth rate of bubbles in the liquid. There is a logarithmic relationship between them, by which they can be transformed into each other [21]. The influence of the release pressure on the expansion degree of the HFC-125 agent can be revealed by either of them. The expressions for Dsup and dsup are shown in Equations (1) and (2), respectively.
D sup = T a g e n t T s a t ,
d sup = P a i r / P s a t ,
where Dsup denotes the degree of superheat (K), dsup represents a dimensionless number, Tagent denotes the temperature of the liquid in the vessel (K), and Tsat represents the saturation temperature at the ambient pressure (K). Dsup was selected for characterizing the influence of release pressure on the degree of superheat in the current study. Figure 4 and Equation (3) exhibit the correlation of the degree of superheat of the HFC-125 agent with the release pressure.
D sup = 17.95 P + 3.7 ,
where P denotes the release pressure (MPa).
Figure 4 shows that there was a linear relationship between Dsup of and the release pressure, and Dsup decreased with the release pressure. Moreover, the value of Dsup in the case of 4.14 MPa was two times larger than that in the case of 2.41 MPa. It can be deduced that in the case of high release pressures, the nucleation and growth of the generated bubbles were relatively mitigatory, and the expansion of HFC-125 in the vessel was feebler. As a consequence, the injection of the HFC-125 agent can be completed in a short time frame in the case of high release pressures, which may indicate that the fire extinguishing efficiency of HFC-125 is higher at high release pressures compared with that at low release pressures.

4.2. Injection Duration under Different Release Pressures

The injection duration is one of the important factors that must be considered to evaluate the performance of the fire extinguishing system. It is worth noting that the injection duration obtained from the pressure change curve in the vessel and the time required to reach the extinguishing concentration differ in the description. The injection duration of the fire extinguishing system refers to the time difference between the moment of sudden pressure drop in the vessel at the dawning of injection and the moment when the pressure starts to level off. Figure 5 illustrates the injection duration of the HFC-125 agent at different release pressures. The results indicate that the injection duration of the HFC-125 agent jet in the superheated state decreased with the release pressure as an exponential decay function, and the equation is presented in Equation (4).
T i n = 3.35 exp ( P / 1.026 ) + 1.154 ,
where Tin represents the injection duration (s).
The reasons for the negative correlation between the injection duration of the HFC-125 agent and the release pressure are presented as follows. First and foremost, low pressures occurred in the pipeline and in the vessel during the early stage of the release process in the case of low release pressures. The ambient pressure of the HFC-125 agent was much lower than its corresponding saturated vapor pressure at 294.25 K when the fire extinguishing system was pressured to a lower level. As a consequence, the dimensionless degree of superheat (dsup = Pair/Psat) declined and a more intense phase transition and more bubbles were generated in the liquidus HFC-125 agent. The generation of bubbles supplemented the pressure in the vessel and the pipeline, as illustrated in Figure 6. That is, the decline of the pressure drop rate in the vessel was caused by the generation of a mass of bubbles. When the pressure in the vessel no longer declined, the HFC-125 agent in the pipeline changed from the gas-liquid phase to the gas phase. Nevertheless, when the fire extinguishing system was pressured to a higher level, which was still lower than the saturated vapor pressure at 294.25 K, the dimensionless degree of superheat (dsup = Pair/Psat) was larger than that in the case of the lower level. The expansion of the HFC-125 agent at the high release pressures was comparatively tender and would not evaporate as intensively as the case of the low release pressures. The supplement of the pressure in the vessel and pipeline was not obvious. Therefore, when the fire extinguishing system was pressured to the high level, the release pressure had little effect on the injection duration of the HFC-125 agent and the jet process was completed in less time compared with that at the low release pressures. Furthermore, the fire extinguishing system pressured in the low level meant that there was relatively little difference in the pressure between the fire extinguishing agent in the storage vessel and the environment, which led to the energy of the HFC-125 agent, which was converted into the kinetic energy, decreasing. The speed of the HFC-125 agent flow from the storage vessel to the pipeline declined consequently, and the injection duration was correspondingly prolonged.
Moreover, the bubble expansion occurred earlier when the release pressure was higher. It was close to the pressure dropping process in the storage vessel, which was mainly based on the emptying and was supplemented by the bubble expansion. In the case of the high release pressures, the pressure supplement was obviously weaker than the emptying, and a significant pressure drop occurred. On the contrary, in the case of the low release pressures, the pressure supplement was obviously strengthened, which neutralized part of the pressure drop attributed to the emptying process. The balance between the supplement and the emptying would be maintained for a longer time with the decline of the release pressure, leading to the phenomenon of the bubble expansion supplement being delayed.

4.3. Pressure Loss in Pipeline under Different Release Pressures

In the fire extinguishing system, the fire extinguishing agent cannot be transported without pipeline. However, the flow of the fire extinguishing agent in the pipeline is bound to cause energy loss because of the interaction between the agent molecules and the contact between the agent with the rough wall of the pipe and the local components. In order to study the influence of release pressure on the pressure loss in the pipeline, we compared the monitoring data of Pin pressure transmitter at the beginning of the pipeline with Pout pressure transmitter at the end of the pipeline in this section, as shown in Figure 7. At a phenomenological level, the differential pressure evolution during the two-phase (liquid and gas) release process under different release pressures exhibited the same trend.
As mentioned in Section 4.1 and Section 4.2, the phase transition definitely affected the release process of the fire extinguishing agent in the superheated state. This effect can be observed in the variations of the pipeline differential pressure as a function of time. It was found in Figure 7 that the release process of the HFC-125 agent can be divided into three phases. In the current study, in order to illustrate the three phases, we have displayed the differential pressure as a function of time in the case of 4.14 MPa in Figure 8.
(1)
Phase 1: Pipeline filling
Phase 1 denotes the filling process of the HFC-125 agent into the pipeline. In this phase, the valve in the storage vessel was opened and the HFC-125 agent was filled into the pipeline. As the storage vessel was highly pressured, the HFC-125 agent was released quickly and the Pin increased sharply. The rarefaction waves formed at the front of the jet passed through the position of the Pin and Pout pressure sensors in sequence along the pipeline. Because the Pout was far away from the storage vessel, the spread of the rarefaction wave showed a time difference between the inlet and the outlet, which caused the differential pressure to rise instantly and to reach the first peak at 2.119 s. Subsequently, the value of ΔP decreased due to the continual supplement of the HFC-125 agent to the position of the Pout pressure sensor. When the differential pressure reached a local minimum value at 2.179 s, the pipe was totally filled with the HFC-125 agent. It can be observed in Figure 8 that phase 1 merely occupied a short region of the differential pressure curve, indicating that the agent was injected into the pipeline at a quite fast speed.
(2)
Phase 2: Stable Flow
Phase 2 represents the stable jet process. Intense phase transition of the superheated HFC-125 agent happened in the pipeline ahead of the rarefaction waves of the jet that left the nozzle. Because the formed gas supplemented the pressure in the pipeline gradually, Pin was supplemented and Pout was emptied. Thus, the differential pressure between the Pin and Pout increased. Meanwhile, the release process also contained the phenomenon of the nitrogen precipitation. The peak of the differential pressure in Phase 2 was attributed to the combination of the above-mentioned two reasons. Because of the differential pressure between the fire extinguishing system and the enclosure space, the pressure in the storage vessel decreased and the fire extinguishing agent sprayed continuously when the rarefaction waves left the nozzle. In this process, the differential pressure smoothly declined with time. A dynamic balance between the release rate of the fire extinguishing agent and the rate of the gas produced by the phase transition occurred in this phase.
(3)
Phase 3: Mixed Gases Release
Phase 3 represents the release of the gas phase agent and the residual nitrogen. The liquid agent in the storage vessel was nearly emptied at the end of Phase 2. The production rate of gas was gradually deficient. In this phase, due to the emptied HFC-125 agent, the supplemented amount of the liquid HFC-125 agent at the Pin position decreased sharply, causing the differential pressure to decline rapidly. Then, it entered the stable decline process. Unlike Phase 2, this process corresponds to the smooth emptying of the mixture of gaseous fire extinguishing agent and residual nitrogen. Finally, only a little gas remained in the fire extinguishing system.
The linear increase of the mean and maximum values of the differential pressure in the pipeline with the release pressure is demonstrated in Figure 9a, and the specific functions are shown in Equations (5) and (6). In addition, Figure 9b shows that the largest value of differential pressure that occurred in Phase 2. Under all release pressures, it was found that the pipeline pressure loss mainly occurred in the phases of stable flow and pipeline filling. This was owing to the fact that a mass of bubbles was generated in these two phases due to the superheat of the HFC-125 agent, which caused the agent volume to expand and the density of the mixture of the liquid and vapor to decrease. The above-mentioned reasons caused the decline of the pressure at Pout. The differential pressure was consequently high. Moreover, the mean value of differential pressure also increased with the release pressure at each phase. The occurrence of the above-mentioned phenomena is closely related to the bubbles generated by the superheat of the HFC-125 agent, and it will be illustrated as follows.
At low release pressures, as shown in Figure 3, the saturated vapor pressure of HFC-125 at 294.25 K was much higher than its pressure in the vessel. As a result, more bubbles were generated due to the intense phase transition resulting from the smaller dimensionless degree of superheat (dsup = Pair/Psat) in the liquid agent. This caused the gas–liquid ratio in the pipeline to increase and the viscosity of the fluid to decrease. As a consequence, the pressure loss was maintained at a low level at low release pressures. On the contrary, in the case of the higher release pressures, although the saturated vapor pressure of HFC-125 at 294.25 K was still much higher than its pressure in the vessel, there were relatively less bubbles generated by the intense phase transition resulting from the relatively larger dimensionless degree of superheat (dsup = Pair/Psat) in the liquid agent compared to the case of lower release pressures. The bubble expansion occurring in the HFC-125 agent was relatively gentle. Therefore, the gas–liquid ratio in the pipeline was relatively small, which made the viscosity of the HFC-125 agent increase. The value of the pressure loss at high release pressures was higher than that at low release pressures.
δ max = 0.172 P + 0.033 ,
δ m e a n = 0.057 P + 0.143 ,
where δmax denotes the maximum value of differential pressure (MPa), and δmean represents the mean value of differential pressure (MPa).

4.4. The Variation Characteristics of the Jet Structure in Near Field

The jet angle, which is defined as the angle between the edges of the jet formed in the enclosure space, is generally used to characterize the jet structure of the fire extinguishing agent. It can be acquired by the images obtained by the high-speed camera. It is labeled as θs in the present study, as shown in Figure 10.
Figure 11 shows the variation characteristics of the jet structure with time during the ejection process of HFC-125 at 4.14 MPa. The starting moment of t + 0 ms is defined as the moment when the fire extinguishing agent jetted from the nozzle. The jet process can be roughly divided into three stages: the development stage, the stable release stage, and the rapid decay stage. The development stage is from the beginning of the release process to about 46 ms, which corresponds to the rising region of Phase 2 shown in Figure 8. The differential pressure between the inside and the outside of the nozzle outlet led to the violent phase transition of the HFC-125 agent in the enclosure space. At t + 0 ms, the “blade”-shaped jet core area could be observed in the near field near the nozzle outlet, which was due to the small amount of the HFC-125 agent and its rapid evaporation. Only the transparent “blade”-shaped jet could be observed in the high-speed images. With the supplement of the HFC-125 agent from the storage vessel, the jet of the HFC-125 agent continuously penetrated into the enclosure space, and the “blade”-shaped jet core area could be clearly observed in the near field. The liquid HFC-125 agent in the jet core area was in the state of superheat, and the intense phase transition occurred when the liquid HFC-125 agent was sprayed along the axial direction of the jet, which made the core area break up gradually with white plumes forming around the core area. With the continuous supplement of the HFC-125 agent, the jet angle increased. This was due to the fact that the jet angle increased with the degree of phase transition [22,23]. The pressure at the nozzle decreased gradually with the progress of the release, which led to the dimensionless degree of superheat (dsup = Pair/Psat) to decrease, and more severe phase transition occurred in the core area of the jet. As a result, the jet angle gradually increased and developed into a stable conical shape. After that, the ejection process entered the stable release stage (t + 46 ms~t + 612 ms), which corresponds to the falling region of Phase 2 shown in Figure 8. The jet angle reached the maximum value and remained relatively stable for about 0.5 s. The time range above t + 612 ms was the rapid decay stage of the ejection process, which corresponded to Phase 3 shown in Figure 8. In the storage vessel, the pressure decreased gradually with the advance of release, and the residual liquid HFC-125 agents entrained with the gases were gradually emptied. The jet angle decreased rapidly, and the white gas–liquid mixed jet column gradually disappeared. Finally, the ejection process ended.
Figure 12 indicates that the maximum jet angle of the HFC-125 agent decreased linearly with the release pressure, and Equation (7) was obtained. The main reason for this was that when the release pressure was low, as discussed in Section 4.1, the jet velocity of the HFC-125 agent was low, resulting in a severe phase transition. Compared with the case of liquid state, HFC-125 showed better dispersibility and was easier to move outside the jet in the form of small droplets or gas. Therefore, the jet angle was larger in the case of low release pressures compared with that in the case of high release pressures.
θ s max = 0.843 P + 9.53 ,
where θsmax denotes the maximum jet angle (°).

4.5. Concentration Distribution of HFC-125 Agent under Different Release Pressures

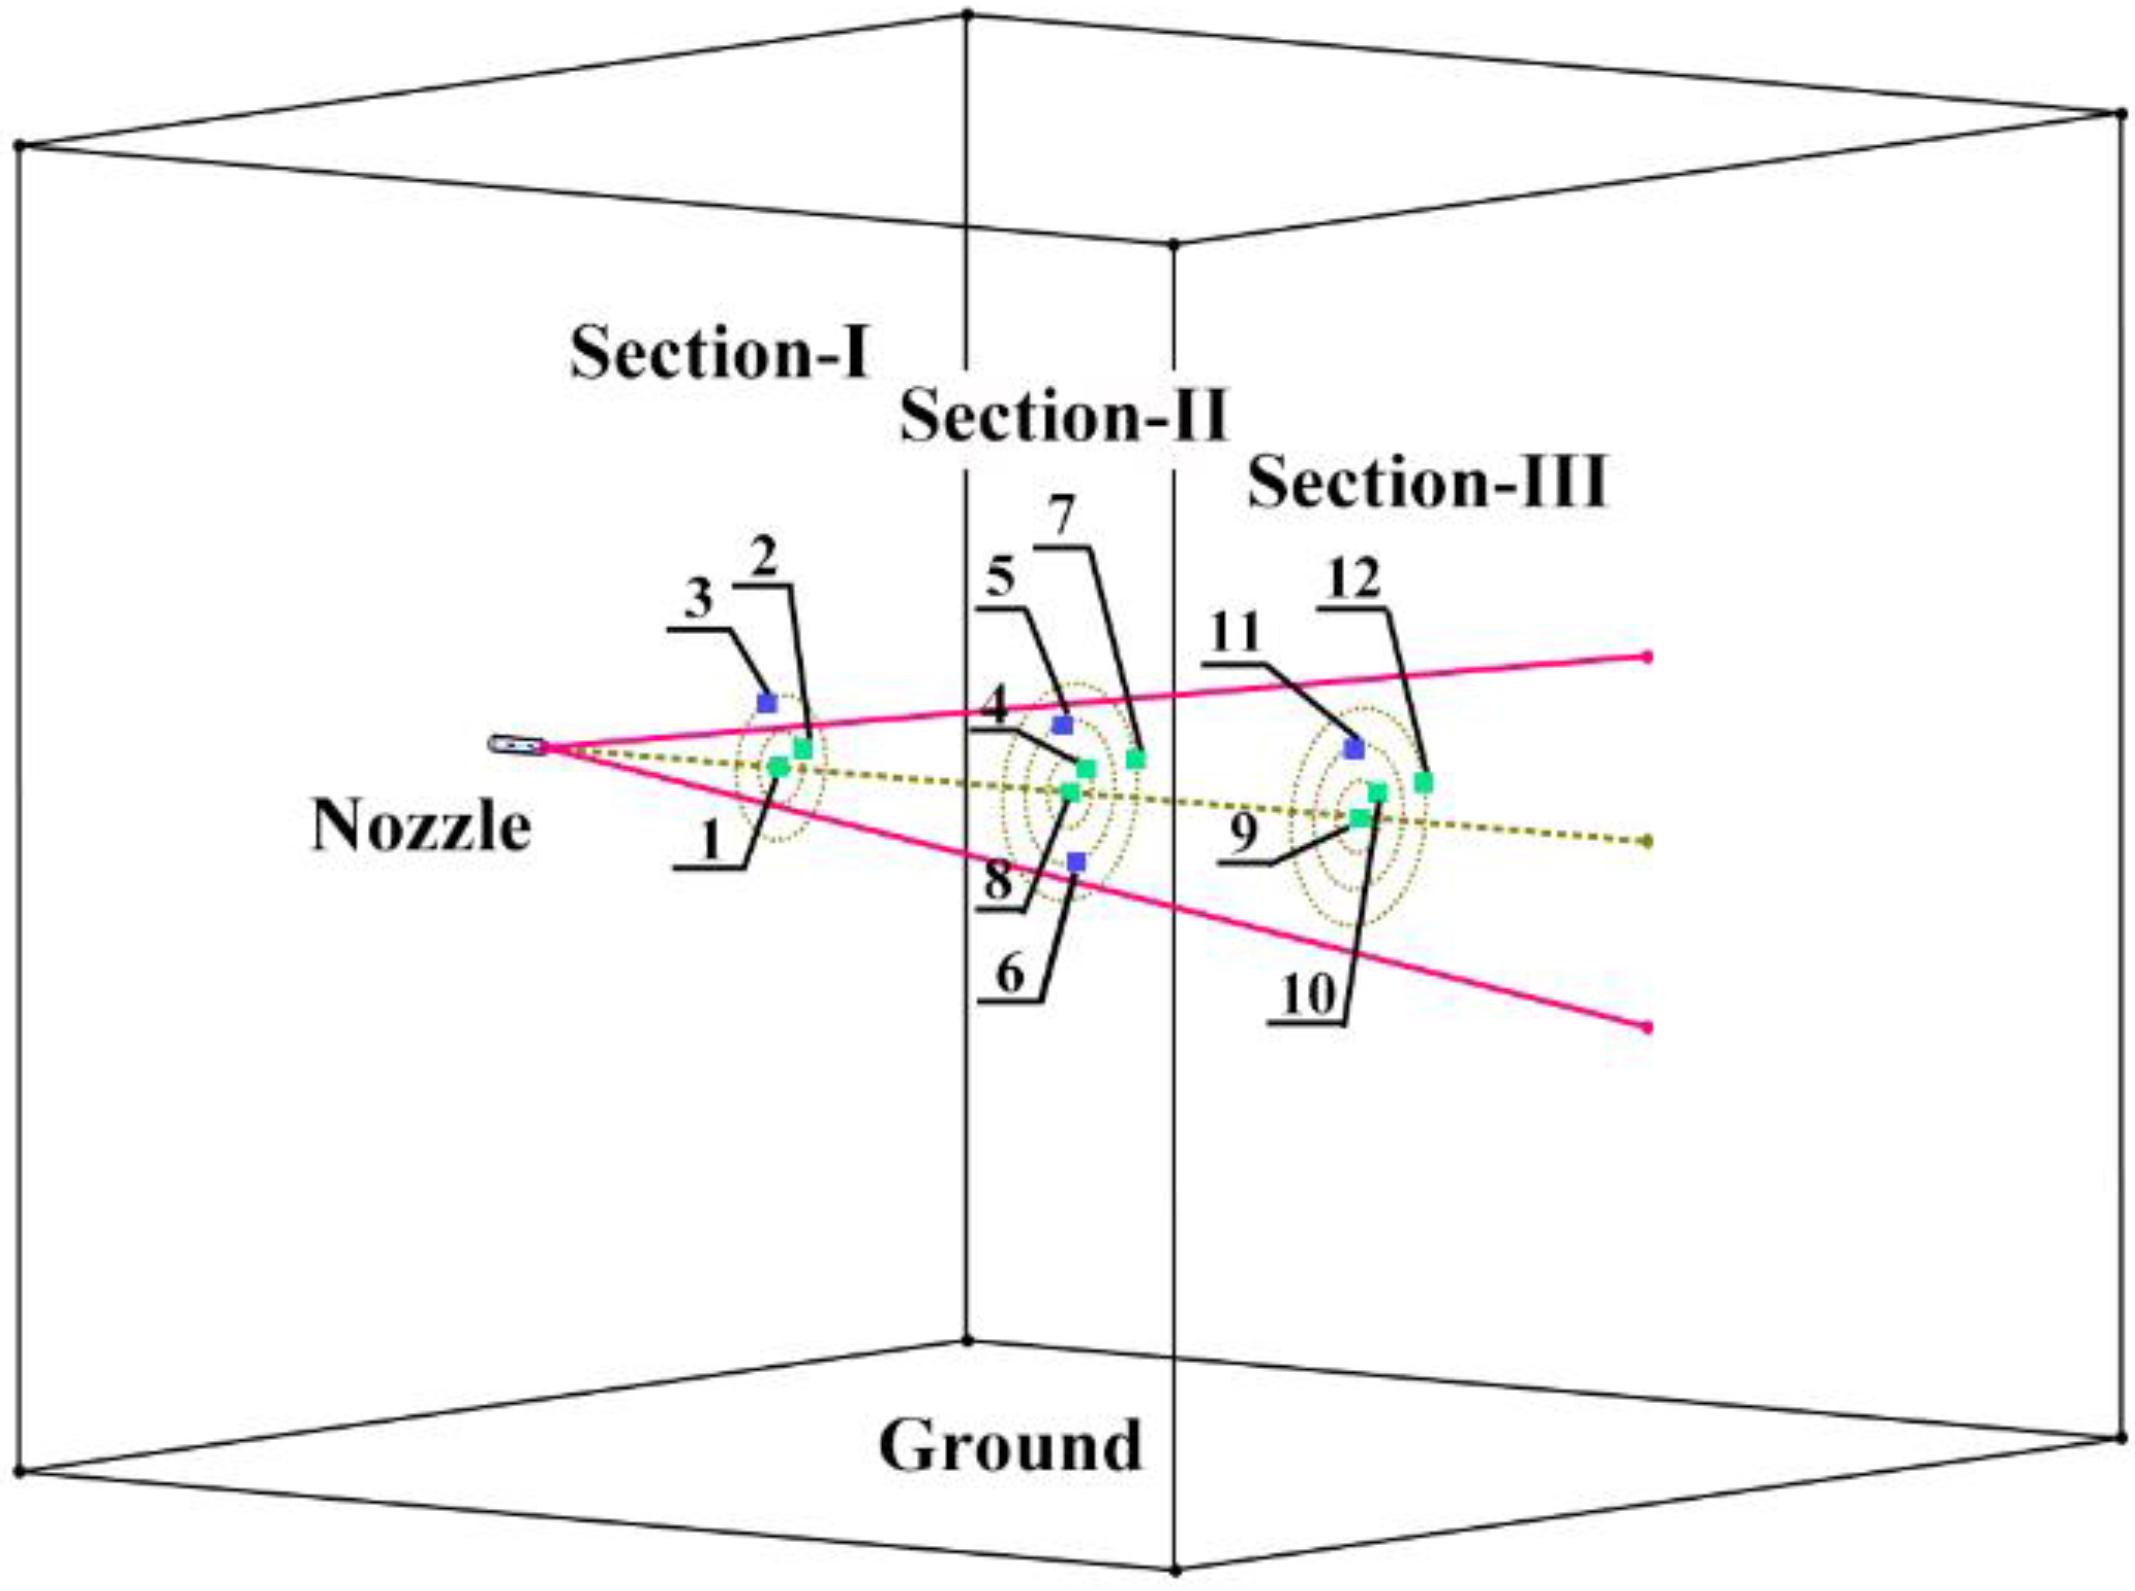
4.5.1. Concentration Distribution in Radial Section

Figure 13 and Figure 14 show the concentration distribution of the HFC-125 agent in the radical in Sections II and III in the case of 3.45 MPa, respectively. Section II is the radical annular cross section at the center of the enclosure space, and points 4, 5, 6, 7, and center point 8 are the concentration sampling positions, as shown in Figure 2. Two peaks in the variations of concentration with time were presented at points 4 and 8. The first peak at about 6 s formed because of the large differential velocity close to the nozzle caused by the front of the agent jet.
As shown in Figure 13, the variations of concentration at point 8 were similar with those at point 4. However, the maximum value at point 8 was almost three times larger than that at point 4, and only the maximum concentration of point 8 exceeded 17.6% in all points in Section II in the entire injection process. In addition, the concentrations at points 5, 6, and 7 were much lower, because they were far away from the center line. At last, the equilibrium concentration of 1.8% was achieved at each point after injection.
It is indicated in Figure 13 that, although point 5 and point 6 were symmetrically located above and below the central point, their concentration variations with time showed large differences. The value of concentration at point 5 increased earlier than point 6, and the peak value of point 5 occurred almost at the same time as point 8 and point 4. This phenomenon indicates that the buoyancy of the jet was more effective than the gravity during the injection process. For the points that were symmetrically located above and below the center line, the presentation of suppression effect in the area above the center line was earlier than that below the center line, being of great significance to the fire suppression design in the enclosure space. The trend of slight upward deflection of the jet during the development process in Figure 11 can further verify the inference of buoyancy.
In addition, as shown in Figure 2, Section III was the radical annular cross-section in the enclosure space, and points 10, 11, 12, and center point 9 were the concentration sampling positions. Figure 14 indicates that the maximum value of the concentration at point 9 was the largest, followed by that of point 10, whereas the concentration value at point 11 was the minimum. The concentration with time at points 9, 10, and 11 was quite similar. According to Fick’s law, the evaporation rate of the liquid HFC-125 agent outside the jet core area was faster than that in the core area, and the corresponding white plumes shown in the high-speed images disappeared faster. This is related to the distance from the jet core. Therefore, the concentration far away from the center line was lower than that at the center line. However, the variations of the concentration at point 12 were quite different from those at points 9, 10, and 11. It can be illustrated by the high-speed images that when the HFC-125 agent jet reached the wall, some agents turned around due to the restriction of the wall, and the backflow formed consequently, as shown in Figure 15. The backflow entrained air in the jet and mixed with the HFC-125 agent, resulting in the lower concentration of the HFC-125 agent in the area affected by the backflow.

4.5.2. Concentration Distribution along the Jet under Different Release Pressures

Figure 16a,c,d exhibits the concentration variations of the HFC-125 agent with time at points 1, 8, and 9 under different release pressures. It is indicated that the maximum concentration value decreased with the distance from the nozzle. This was due to the fact that the front end of the jet constantly entrained the air and the air mixed with the HFC-125 agent in the jet, which diluted the concentration of the HFC-125 agent and made the HFC-125 agent concentration lower in the area far away from the nozzle.
In addition, Figure 16b shows that the maximum concentration value increased with the release pressure at point 1. This may have been due to the fact that in the case of low release pressures (2.41–3.1 MPa), the jet angle decreased with the increase of release pressure, which made the distribution of HFC-125 more concentrated and the maximum concentration value increase rapidly with the increase of release pressure. However, it can be seen from Figure 16b that when the release pressure was 3.1 MPa, the concentration of the HFC-125 agent reached more than 90%, which indicates that the jet was mainly liquid. Although the jet angle was still smaller with the increase of release pressure, the phase transition of the agent was much lower than that in the case of low release pressures. Therefore, in the case of higher release pressures above 3.1 MPa, the jet mostly existed in liquid phase at point 1, which was less mixed with air compared with that at low release pressures. Therefore, the maximum concentration value at point 1 remained almost unchanged in the case of higher release pressures (3.1–4.14 MPa).
However, as Figure 16c,d shows, little effect of release pressure on the maximum concentration values at points 8 and 9 were demonstrated. A possible explanation for this is that the HFC-125 agents were nearly all transformed into the gaseous state at points 8 and 9 and mixed with air. In addition, as mentioned above, the backflow disturbance forming at point 9 may have also been responsible for this phenomenon.
In the present study, holding time was defined as the time span in which the volume concentration of the HFC-125 agent was above 17.6%. Since the volume concentration at point 9 could not reach 17.6%, Figure 17 only shows the holding time at points 1 and 8 at different release pressures. It is indicated that the holding times at point 1 all exceeded 0.5 s at all employed release pressures, and the holding time at point 8 could exceeds 0.5 s only in the case of low release pressure (2.41–3.1 MPa). It can be inferred that the holding time of the HFC-125 agent can achieve 0.5 s only in some areas with low release pressure in the jet cone, even in the center line of the jet with the most concentrated fire extinguishing agent. In the case of the release pressure of 2.41 MPa, the value of the holding time at points 1 and 8 was the closest.
In the case of point 1, which was located close to the nozzle, the holding time increased with the release pressure from 2.41 to 3.1 MPa and then tended to be flat from 3.1 to 4.14 MPa. It was similar to the variations of the maximum concentration value with the release pressure at point 1. This may have been due to the fact that in the range from 2.41 to 3.1 MPa, the holding time may have been mainly determined by the degree of phase transition. In the case of low release pressures, the dimensionless degree of superheat (dsup = Pair/Psat) was relatively small and the degree of phase transition was severe, resulting in a larger jet angle, as described in Section 4.4. As a result, the larger jet angle made the HFC-125 agent mix with more air and reduce the concentration. Therefore, the holding time was short. In addition, the jet angle decreased with the increase of release pressure, which made the distribution of HFC-125 more concentrated. Thus, the holding time increased with the increase of release pressure below 3.1 MPa. In the range from 3.1 to 4.14 MPa, the concentration of the HFC-125 agent reached more than 90%, as shown in Figure 16b, which indicates that the jet was mainly liquid. Although the jet angle was still smaller with the increase of release pressure, the phase transition of the agent was much lower than that in the case of low release pressures. Therefore, in the case of higher release pressures above 3.1 MPa, the jet mostly existed in liquid phase at point 1, which was less mixed with air compared with that at low release pressures. Therefore, the holding time in the point 1 remained almost unchanged in the case of higher release pressures (3.1–4.14 MPa).
However, as Figure 17 shows, the variations of the holding time with time at point 8 was opposite to those at point 1. The holding time decreased with the release pressure. A possible explanation for this was that point 8 was slightly far away from the nozzle. The HFC-125 agent reaching point 8 was mainly in the gaseous state. In the range from 2.41 to 3.1 MPa, the holding time was only a little longer than 0.5 s. In the range from 3.1 to 4.14 MPa, the holding time could not achieve 0.5 s. It was due to this fact that there was not much liquid HFC-125 agent left at point 8, and the effect of phase transition on holding time was weak. The holding time was only related to the injection duration. The velocity of the jet was quite high in the case of high release pressures. The HFC-125 agent in the vessel was emptied in a short period of time. The existence time of the jet in the enclosure space decreased with the release pressure. Then, the holding time decreased with the release pressure. The empirical equations of the holding time with the release pressure at points 1 and 8 can be obtained, as shown in Equations (8) and (9).
Point 1:
t h o l d 1 = 1.98 112.11 × 0.133 P ,
Point 8:
t h o l d 8 = 0.234 P + 1.19 ,
where thold 1 is the holding time of point 1 and thold 8 is the holding time of point 8 (s).

5. Conclusions

The flow and diffusion characteristics of a typical candidate substitute for the halon fire extinguishing agents, namely, HFC-125 under different release pressures (2.41, 2.76, 3.1, 3.45, 3.79, and 4.14 MPa) were investigated in the present study. A series of parameters including the degree of superheat, the injection duration, the differential pressure in the pipeline, the jet structure, and the concentration distribution in the enclosure space were measured and analyzed. The major results and conclusions are summarized as follows.
  • The degree of superheat of the HFC-125 in the storage vessel decreased linearly with the release pressure, indicating that high release pressure can assist in improving the fire suppression efficiency.
  • The injection duration approximately decreased with the release pressure as a decay exponential function. In addition, the bubble expansion can slow down the pressure drop in the storage vessel, and the bubble expansion occurred earlier with the increase of the release pressure. Moreover, the release process of the HFC-125 agent was a two-phase (liquid and gas) flow.
  • The flow process of the HFC-125 agent in the pipeline can be divided into three phases: pipeline filling, stable flow, and mixed gases release. The maximum and mean values of the differential pressure in the pipeline increased linearly with the release pressure. The pipeline pressure loss mainly occurred in the first two phases (stable flow and pipeline filling). The mean value of the differential pressure at each phase also increased with the release pressure.
  • A typical jet plume structure occurred outside the nozzle. The jet process of the HFC-125 agent in the enclosure space can be divided into three stages: the development stage, the stable release stage, and the rapid decay stage.
  • The maximum concentration value decreased with the increase of the distance from the nozzle. Moreover, the jet would deflect upward due to the effects of buoyancy. With the increase of release pressure, the maximum concentration value in the near field from the nozzle increased, and the maximum concentration value in the far field from the nozzle varied little. Furthermore, the backflow resulted by the restriction of the wall could decrease the concentration of the HFC-125 agent.
  • The concentration and holding time of the HFC-125 agent could meet the requirement of MPS in some areas. The holding time of HFC-125 could achieve 0.5 s in some areas at low release pressures in the near field of the jet cone. With the increase of the release pressure, the holding time in the near field from the nozzle increased first, and then almost remained constant, which was opposite to that in the far field from the nozzle.
It can be concluded from the present study that one nozzle is not enough to meet the requirement of MPS for HFC-125. Several nozzles and appropriate nozzle distribution design in the target enclosure space are needed.

Author Contributions

Conceptualization, J.J. and R.P.; methodology, J.J. and Q.L.; validation, R.P., Q.L., and R.C.; resources, R.P.; data curation, J.J. and X.X.; writing—original draft preparation, J.J.; writing—review and editing, R.P., Q.L., and R.C.; visualization, J.J.; supervision, R.P.; project administration, R.P.; funding acquisition, R.C. All authors have read and agreed to the published version of the manuscript.

Funding

This research was funded by the National Natural Science Foundation of China (no. 51806106) and the Natural Science Foundation of Jiangsu Province, China (no. BK20170838).

Conflicts of Interest

The authors declare no conflict of interest. The funders had no role in the design of the study; in the collection, analyses, or interpretation of data; in the writing of the manuscript; or in the decision to publish the results.

References

  1. Li, H.; Min, X.; Dai, M.; Dong, X. The biomass potential and GHG (Greenhouse Gas) emissions mitigation of straw-based biomass power plant: A case study in Anhui Province, China. Processes 2019, 7, 608. [Google Scholar] [CrossRef] [Green Version]
  2. Jung, K.; Ro, D.; Park, Y.K. Estimation, and Framework Proposal of Greenhouse Gas Emissions of Fluorinated Substitutes for Ozone-Depleting Substances by Application Area in the Republic of Korea. Sustainability 2020, 12, 6355. [Google Scholar] [CrossRef]
  3. Jou, R.-C.; Chen, T.-Y. Willingness to Pay of Air Passengers for Carbon-Offset. Sustainability 2015, 7, 3071. [Google Scholar] [CrossRef] [Green Version]
  4. Ingerson, D.A. FAA Engine Compartment Halon Replacement Project Background, Overview, and Current Status. In International Aircraft Fire and Cabin Safety Research Conference; Federal Aviation Administration: Washington, DC, USA, 1998. [Google Scholar]
  5. Ingerson, D.A. Simulating the Distribution of Halon 1301 in an Aircraft Engine Nacelle With HFC-125; Federal Aviation Administration: Washington, DC, USA, 1999.
  6. Bennett, M.V.; Bennett, J.M. Aircraft Engine/APU Fire Extinguishing System Design Model (HFC-125); Defense Technical Information Center: Fort Belvoir, VA, USA, 1997.
  7. Lu, Z.; Zhuang, L.; Dong, L.; Liang, X. Model-Based Safety Analysis for the Fly-by-Wire System by Using Monte Carlo Simulation. Processes 2020, 8, 90. [Google Scholar] [CrossRef] [Green Version]
  8. FAA. Minimum Performance Standards for Halon 1301 Replacement in the Fire Extinguishing Agents/Systems of Civil Aircraft Engine and Auxiliary Power Unit Compartments(rev04); Federal Aviation Administration: Washington, DC, USA, 2010.
  9. Williamson, H. V Halon 1301 flow in pipelines. Fire Technol. 1976, 12, 18–32. [Google Scholar] [CrossRef]
  10. Elliott, D.G.; Garrison, P.W.; Klein, G.A.; Moran, K.M.; Zydowicz, M.P. Flow of nitrogen-pressurized Halon 1301 in fire extinguishing system. JPL Publ. 1984, 84–62, 1–124. [Google Scholar]
  11. Yang, J.C.; Huber, M.L.; Boyer, C.I. A model for calculating alternative agent/nitrogen thermodynamic properties. In Proceedings of the Halon Options Technical Working Conference, Albuquerque, NM, USA, 9–11 May 1995; Volume 11. [Google Scholar]
  12. Tuzla, K.; Palmer, T.; Chen, J.C.; Sundaram, R.K.; Yeung, W.S. Development of Computer Program for Fire Suppressant Fluid Flow; Lehigh University: Bethlehem, PA, USA, 1998. [Google Scholar]
  13. Kim, J.; Baek, B.; Lee, J. Numerical analysis of flow characteristics of fire extinguishing agents in aircraft fire extinguishing systems. J. Mech. Sci. Technol. 2009, 23, 1877–1884. [Google Scholar] [CrossRef]
  14. Sarkos, C.P. Characteristics of Halon 1301 Dispensing Systems for Aircraft Cabin Fire Protection; National Aviation Facilities Experimental Center: Atlantic City, NJ, USA, 1975.
  15. Niu, X.; Xie, Y.; Hasemi, Y. Analysis of Fire Spread and Fire Extinguishing Agent Distribution in Nacelle of Helicopter under No-ventilation Condition. Procedia Eng. 2013, 62, 1073–1080. [Google Scholar] [CrossRef] [Green Version]
  16. Kurokawa, F.Y.; De Andrade, C.R.; Zaparoli, E.L. Numerical simulation of the concentration of fire extinguishing agent in aircraft cargo compartment. In Proceedings of the 10th Brazilian Congress of Thermal Sciences and Engineering, Rio de Janeiro, Brazil, 29 November–4 December 2004. [Google Scholar]
  17. Kurokawa, F.Y.; De Andrade, C.R.; Zaparoli, E.L. Modeling of aircraft fire suppression system by the lumped parameter approach. Aircr. Eng. Aerosp. Technol. 2016, 88, 535–539. [Google Scholar] [CrossRef]
  18. Zaparoli, E.L. Numerical simulation of an aircraft cargo compartment fire suppression system using cfd tool. In Proceedings of the 19th International Congress of Mechanical Engineering, Gramado, Brazil, 15–20 November 2009. [Google Scholar]
  19. Lee, J. Simulation Method for the Fire Suppression Process Inside the Engine Core and APU Compartments. In Proceedings of the Fourth Triennial International Aircraft Fire and Cabin Safety Research Conference, Lisabon, Portugal, 15–18 November 2004. [Google Scholar]
  20. Xue, R.; Ruan, Y.; Liu, X.; Chen, L.; Liu, L.; Hou, Y. Numerical Study of the Effects of Injection Fluctuations on Liquid Nitrogen Spray Cooling. Processes 2019, 7, 564. [Google Scholar] [CrossRef] [Green Version]
  21. Zeng, W. Characteristics and Mechanisms of Direct-Injection Liquid Jet and Flash-Boiling Spray; Shanghai Jiao Tong University: Shanghai, China, 2012. [Google Scholar]
  22. Geanette, P.; Arne, E.H.; George, M. General review of flashing jet studies. J. Hazard. Mater. 2010, 173, 2–18. [Google Scholar] [CrossRef]
  23. Lamanna, G.; Kamoun, H.; Weigand, B.; Steelant, J. Towards a unified treatment of fully flashing sprays. Int. J. Multiph. Flow 2014, 58, 168–184. [Google Scholar] [CrossRef]
Figure 1. The full-scale airborne fire extinguishing system.
Processes 08 01684 g001
Figure 2. The location of sampling points.
Processes 08 01684 g002
Figure 3. The saturated vapor pressure versus saturation temperature of HFC-125.
Processes 08 01684 g003
Figure 4. Dsup of the HFC-125 agent as a function of release pressure.
Processes 08 01684 g004
Figure 5. The injection duration of HFC-125 under different release pressures.
Processes 08 01684 g005
Figure 6. The vessel pressure of HFC-125 agent under various release pressures.
Processes 08 01684 g006
Figure 7. The differential pressure of HFC-125 under different release pressures.
Processes 08 01684 g007
Figure 8. Phase division determined by the differential pressure curve in the pipeline at 4.14 MPa.
Processes 08 01684 g008
Figure 9. (a) The maximum and mean values of differential pressure in the whole process. (b) The mean value of differential pressure in each phase.
Processes 08 01684 g009
Figure 10. Jet angle.
Processes 08 01684 g010
Figure 11. The injection process of HFC-125 agent obtained by the high-speed camera.
Processes 08 01684 g011
Figure 12. The maximum jet angle versus the release pressure.
Processes 08 01684 g012
Figure 13. Concentration as a function of time at points 4, 5, 6, 7, and 8 in Section II in the case of 3.45 MPa.
Processes 08 01684 g013
Figure 14. Concentration versus time at points 9, 10, 11, and 12 in Section III in the case of 3.45 MPa.
Processes 08 01684 g014
Figure 15. The backflow recorded by the high-speed camera.
Processes 08 01684 g015
Figure 16. (a) Concentration of HFC-125 as a function of time at point 1; (b) the maximum value of concentration value with different release pressure at point 1; (c) concentration of HFC-125 as a function of time at point 8; (d) concentration of HFC-125 as a function of time at point 9.
Processes 08 01684 g016
Figure 17. The holding time at points 1 and 8 at different release pressures.
Processes 08 01684 g017
Publisher’s Note: MDPI stays neutral with regard to jurisdictional claims in published maps and institutional affiliations.

