Article

Methanol Synthesis with Steel-Mill Gases: Simulation and Practical Testing of Selected Gas Utilization Scenarios

1
Fraunhofer UMSICHT, Osterfelder Straße 3, 46047 Oberhausen, Germany
2
Faculty of Mechanical and Process Engineering, Hochschule Düsseldorf, University of Applied Sciences, 40476 Düsseldorf, Germany
*
Author to whom correspondence should be addressed.
Processes 2020, 8(12), 1673; https://doi.org/10.3390/pr8121673
Submission received: 26 November 2020 / Revised: 15 December 2020 / Accepted: 16 December 2020 / Published: 17 December 2020
(This article belongs to the Special Issue Heterogeneous Catalysts for CO2 Valorisation)

Abstract

:
The utilization of CO2-containing steel-mill gases for synthesis of methanol was investigated. Four different scenarios with syngas derived from steel-mill gases were considered. A process model for an industrial methanol production including gas recirculation was applied to provide realistic conditions for catalyst performance tests. A long-term test series was performed in a close-to-practice setup to demonstrate the stability of the catalyst. In addition, the experimental results were used to discuss the quality of the simulation results. Kinetic parameters of the reactor model were fitted. A comparison of two different kinetic approaches and the experimental results revealed which approach better fits CO-rich or CO2-rich steel-mill gases.

1. Introduction

Methanol is of utmost importance both for the chemical industry and the energy sector with a worldwide demand of ca. 80–90 million tons per year [1]. It not only is the first chemical building block for many useful chemical compounds such as formaldehyde or acetic acid but also can be used as fuel, fuel additive and is a feedstock for the production of gasoline [1,2].
Currently, methanol is produced catalytically using syngas, which is produced from fossil raw materials such as natural gas or coal. Alternative syngas sources for the production of methanol are CO2-containing steel-mill gases, which are formed during the manufacture of steel. The successful establishment of a carbon capture and utilization process involving steel-mill-gases would enable not only a reduction of climate-damaging CO2 emissions but also a sustainable production of methanol [3].
Within the framework of the Carbon2Chem® joint project, in which companies from the steel, energy, and chemical sectors cooperate with academia, sustainable methanol synthesis from steel-mill gases is being investigated [4]. The change from fossil-based carbon sources to steel-mill gases makes its necessary to adapt the current process of methanol production and to integrate at the steel mill site. First, it is mandatory to produce syngas from the existing steel-mill gases that has an appropriate ratio of hydrogen to COx and contains no detrimental concentrations of minor and trace compounds which deactivate the methanol catalyst. This task requires suitable conditioning and purification processes for syngas production. Moreover, it is essential to supply the required green hydrogen for syngas production by electrolysis using electricity from renewable energies.
Figure 1 shows typical gas compositions of the main steel-mill gases: coke oven gas (COG), blast furnace gas (BFG), and blast oxygen furnace gas (BOFG) [4]. The data were taken from [5]. Not only do the individual steel-mill gases have different compositions but also the portion of each gas in the total amount of steel-mill gases produced varies greatly.
COG is a hydrogen-rich gas that also contains a significant amount of methane, while BOFG contains over 60 volume percent CO. Together, COG and BOFG account for only approx. 13% of the total amount of steel-mill gases produced. A predominant part of the steel-mill gases, with an amount of around 87%, is BFG, which contains only small amounts of hydrogen but has approximately equal quantities of CO and CO2 of about 25%.
Thus, BFG is the most important source of carbon in the comparison of all steel-mill gases for methanol synthesis. However, it should be noted that BFG has a high nitrogen content. Depending on the process design, it is possible that inert components such as nitrogen will accumulate at the reactor inlet stream if unreacted educt gas is recirculated, thus reducing the efficiency of methanol synthesis. In addition, the increased water formation due to the high CO2 concentration of syngas derived from BFG has to be considered. It can lead to unwanted reoxidation of the active components as well as hydroxylation of the surface, both resulting in severe deactivation of the catalyst [6].
The challenges addressed so far comprise a complex and highly dynamic approach of integrating steel production, methanol synthesis, and hydrogen supply with renewable energy [4]. Investigations and optimizations in terms of technological, ecological, and economic aspects require close interaction of modelling and simulation with detailed experiments using syngas derived from steel-mill gases.
In the scope of the presented work, four basic gas utilization scenarios were considered. Since, for economic reasons, methanol synthesis in the steel mill has to be performed using gas recirculation, its influence on gas composition has to be determined. Hence, a process model for industrial-scale methanol production with raw methanol/water separation and gas recirculation was used. With this model, the feed gas compositions at the reactor inlet of an industrial process were simulated for the four gas utilization scenarios in order to use them in the experimental investigation.
The influence of the four different syngas compositions on the productivity of Clariant’s methanol synthesis catalyst MegaMax®800 was then investigated using a lab-scale test rig. Different operating parameters were monitored over several weeks, and respective process parameters were determined by performing a series of long-term tests. Based on the obtained process parameters, methanol production depending on the steel-mill-gas utilization scenario and the respective feed gas composition was evaluated.

2. Materials and Methods

2.1. Simulation

For the described work, a recently developed process model for a large-scale methanol process corresponding to the Lurgi low-pressure process and a test setup for heterogeneous catalysts were applied. Methanol is formed by the following equilibrium reactions, which are implemented in the applied process model:
Formation of methanol by the exothermic hydrogenation of CO and CO2.
CO + 2 H 2       C H 3 O H                                                                 Δ H 298 K =   90,85   k J   m o l 1
C O 2 + 3 H 2       C H 3 O H +   H 2 O                                                 Δ H 298 K =   49,82   k J   m o l 1
The formed water is converted via the equilibrium-limited water-gas- shift reaction.
H 2 O + C O       C O 2 +   H 2                                                           Δ H 298 K =   41,03   k J   m o l 1
Figure 2 shows a flow scheme of the methanol synthesis process model as simulated by the Fraunhofer UMSICHT methanol process model. The model comprises a 1-dimensional reactor model of a large-scale boiling-water-cooled tube-bundle reactor, raw product separation (cooling trap), and gas recycling of the unconverted syngas. The model concept and the model environment used have been presented in detail elsewhere [5]. The process feed enters the process at point <0> in Figure 2. The composition of the process feed (make-up gas) is calculated from the considered gas utilization scenarios described in detail in the next section. For the presented investigations, the process feed always refers to an H2-enriched steel-mill gas-stream. The stoichiometric number (SN) is used to describe appropriate hydrogen content in the syngas and is given by Equation (4). For a stoichiometric number of 2.0, the process feed-gas has a stoichiometric gas composition for methanol synthesis corresponding to the chemical reactions Equations (1) and (2). A stoichiometric number above 2.0 means a stoichiometric excess of H2.
S N = [ H 2 C O 2 ] C O + C O 2
where [H2], [CO2], [CO], and [CO2] are the molar fractions in (mol/mol) in the respective gas stream. For the technical methanol process, a slight excess of hydrogen in the make-up gas is usually recommended [7]. In the following, a stoichiometric number of 2.05 in the process feed was applied for every considered case scenario. The gas recycle ratio (RR) describes the ratio between the molar flow n 6 ˙ of the recycled gas (stream <6>) relative to the molar flow n 0 ˙ of the process feed (stream <0>).
RR = n ˙ 0 n ˙ 6
The amount of unconverted syngas that is recycled in the recycle-gas loop can be adjusted in the model. The recycle ratio (RR) is given by Equation (5). The RR is an important parameter in the simulation and affects the performance of the process in terms of process efficiency and carbon utilization.
In the following, COx describes the total amount of carbon oxide (moles of CO + CO2). COx entering the process with stream <0> (cf. Figure 2) is mixed with recycle gas and converted to methanol in the reactor. The share of COx that is neither converted to methanol nor recycled leaves the process with the residual purge gas stream <22> (cf. Figure 2). One of the central targets of the overall project goals is a significant reduction of CO2 emissions of the steel mill. Therefore, a performance parameter is introduced describing the grade of COx utilization. The carbon efficiency defined by Equation (6) describes the share of carbon synthesized to raw methanol (point <3> in Figure 2) relative to the COx that enters the process with the make-up gas stream (point <0>). In the scope of parameter variation, the influence of the gas-recycle-ratio (RR) on the carbon-efficiency was investigated.
C e f f i c i e n y = M e O H r a w   m e t h a n o l C O X p r o c e s s   f e e d ,
where Cefficiency is the dimensionless carbon efficiency, and MeOHraw methanol and COXprocess feed are the respective molar flows.
However, it is important to differentiate between the gas composition that enters the process as make-up gas and the gas composition at the reactor inlet (point <1> in Figure 2). At the reactor inlet, the gas composition and the corresponding SN deviates from the make-up gas composition depending on the overall process operation. Important factors are, e.g., the grade of raw product separation; the recycle ratio; and the reaction conditions inside the synthesis reactor in terms of pressure, space velocity, and reaction temperature.
The reactor considered in the model was a boiling-water-cooled tube-bundle reactor. A cooling water temperature of 523 K outside the reactor tubes and a pressure of 8.4 MPa were assumed. The synthesis conditions with respect to reactor type and reaction conditions are related to a conventional methanol process. Table 1 gives a selection of the modelling parameters of the industrial synthesis process (from [8] for a modified reactor design). The reaction kinetics for methanol formation was modelled according to the approach of Graaf [9]. The detailed modelling approach for the methanol process including the fundamental equations of heat and mass transfer can be found in [5].

2.2. Practical Catalyst Tests

The practical tests were performed in a test setup for the conversion of syngas comprising a close-to-practice fixed-bed reactor system. The setup was developed as a modular system in which the reactor unit can be alternatively used as a fixed-bed reactor system or as a slurry reactor system [10]. For the described tests, only the fixed-bed reactor setup was applied. The syngas was mixed from pure laboratory gases at a comparatively low pressure of 0.5 MPa and was subsequently compressed with a piston compressor to synthesis pressure. The reactor has a length of 110 cm and an inner diameter of 19 mm. A three-zone heating mantle electrically heats the reactor.
Figure 3 shows a basic flow scheme of the test setup. The axial heat profile is measured with a fibre-optic heat-measurement system Siemens SITRANS TO500 [11]. The custom-made fibre-optic system comprises 15 separate measurement points inside the reactor. Nine measurement points are positioned directly in the catalytic bed, which had a height of 60 cm. The advantage of the fibre-optic system is its comparatively large number of points that can be arranged on a single sensor fibre. Only one access point at the bottom side of the reactor and only one connecting optical cable are needed. The outer diameter of the tube that supports the fibre-optic sensor is comparatively small (3 mm). Interference of the heat profile inside the fixed is reduced by the fibre-optic temperature measurement compared to a conventional heat-measurement system based on thermo-couples or electrical conductivity sensors [12]. Figure 4a depicts a schematic drawing of the applied fixed bed reactor, including the fibre-optic sensor with 15 measurement points. Figure 4b shows a picture of the test setup.
The sensor fibre was located in a protective tube with an outer diameter of 3 mm in the middle of the fixed-bed reactor. The diameter of the fibre was 1 mm. The applied catalyst was Clariant´s industrial methanol synthesis catalyst MegaMax®800. Like other industrial methanol synthesis catalysts, it was a CuO/ZnO/Al2O3 catalyst [13]. The catalyst tablets were crushed and sieved to a fraction of 1–2 mm and diluted with SiC by a ratio of 1:7. The produced gas at the outlet of the reactor was analysed via an online Gas Chromatograph (GC) with Flame Ionization Detector (FID) and a Thermal Conductivity Detector (TCD). Subsequently, the gas stream was cooled down and condensable products were separated and collected at temperature of 277.15 K and a synthesis pressure of 8.4 MPa. In addition to the GC measurement, the condensed liquid products can be used to determine the methanol productivity by a gravimetric analysis of the condensate. The methanol concentration of the liquid product was measured by a density analysis of the condensate using an oscillating U-tube density meter. It was assumed that the condensate only consists of methanol and water.
Activation of the catalyst was performed with diluted H2. A gas mixture exhibiting 5 vol. % H2 in N2 was dosed into the cold reactor at ambient pressure. The reactor was heated up with a rate of 1 K min−1 to 473 K, and afterwards, the temperature was kept constant for 24 h. Then, the pressure was raised to the synthesis pressure of 8.4 MPa. Subsequently, the synthesis gas was introduced and the reactor was further heated up to a synthesis temperature of 523 K. Due to the comparatively large test reactor, significant temperature gradients in the fixed bed might occur. The general approach of the applied reactor system is close to practice and differs from typical laboratory setups where isothermal conditions are preferred [14]. Hence, moderate temperature gradients were tolerated, as temperature gradients usually appear in technical reactor systems [15]. The degree of the appearing temperature gradients was assessed by the abovementioned temperature measurement system and was controlled by the electrical three-zone heating mantle. The specific syngas flow through the reactor was 0.136 Nl gcat−1 min−1.

3. Results

3.1. Simulated Gas Utilization Scenarios

In the scope of the methanol synthesis process simulation, four gas utilization scenarios were considered. Prior to its utilization in the methanol process, the considered steel-mill gas streams were enriched with hydrogen corresponding to a stoichiometric number (SN) of 2.05. Two scenarios relate to the unconverted steel-mill gas streams BFG and BOFG. The CO and CO2 shares remain unchanged. Additionally, a gas composition resulting from a mixture of BFG and BOFG in the ratio of 1:1 was simulated. The latter make-up gases exhibit a significant share of inert nitrogen. Furthermore, it was assumed that the CO share of BFG or BOFG was converted to CO2 in a CO shift unit. Subsequently, the CO2 fraction of the resulting gas stream was removed by a CO2 separation process. The generated pure CO2 stream, exhibiting no inert nitrogen, is the basis of another scenario. The resulting process feed gas compositions with respect to the four gas utilization scenarios are presented in Table 2. The COG was not considered as one of the basic scenarios generating methanol because it exhibits a comparatively low amount of COx. However, the COG is currently considered as a source for pure H2 due to its high H2 concentration (cf. Figure 1).
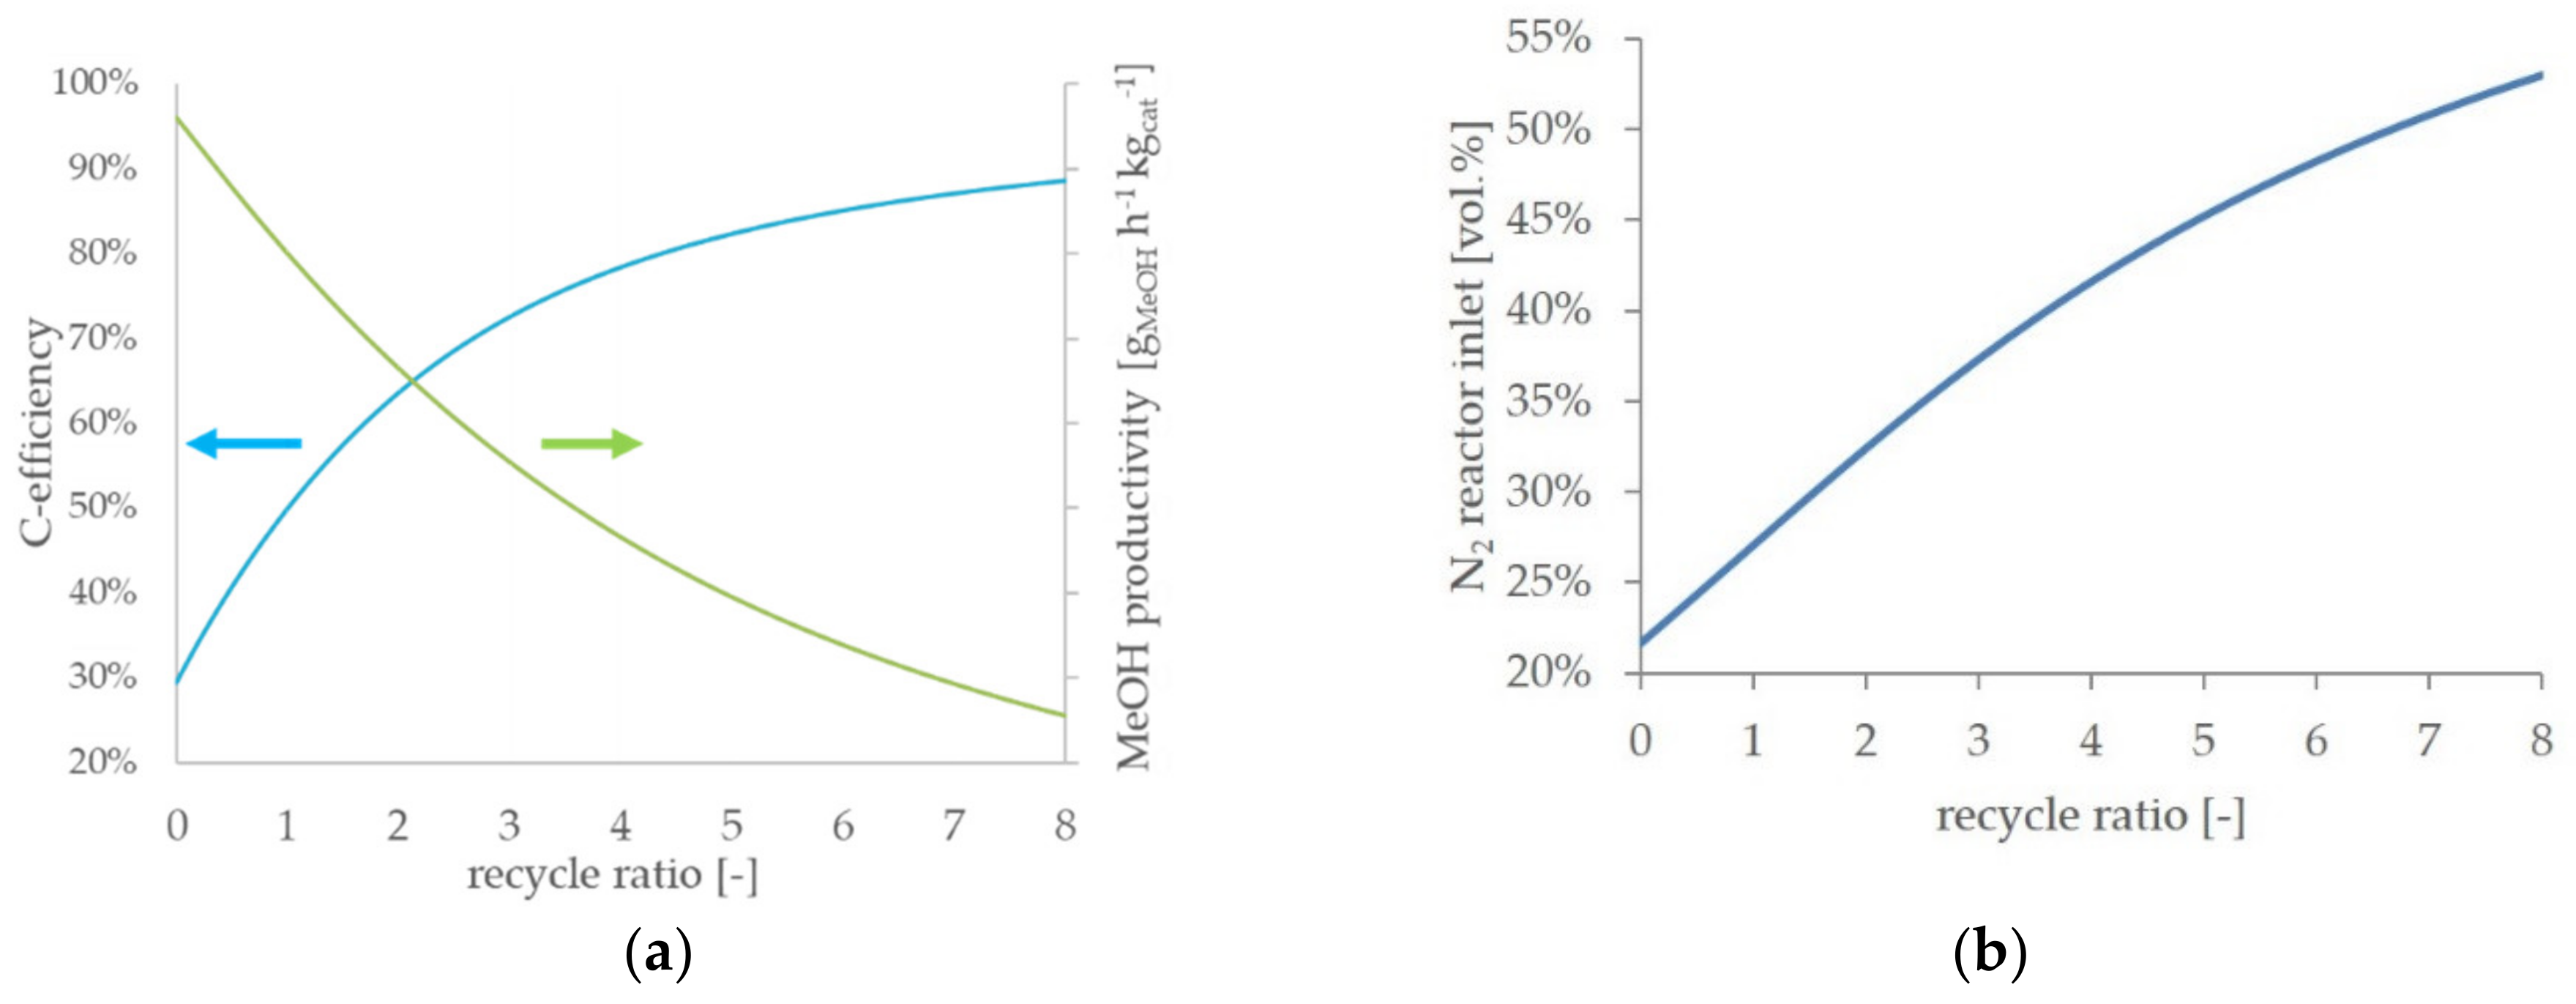
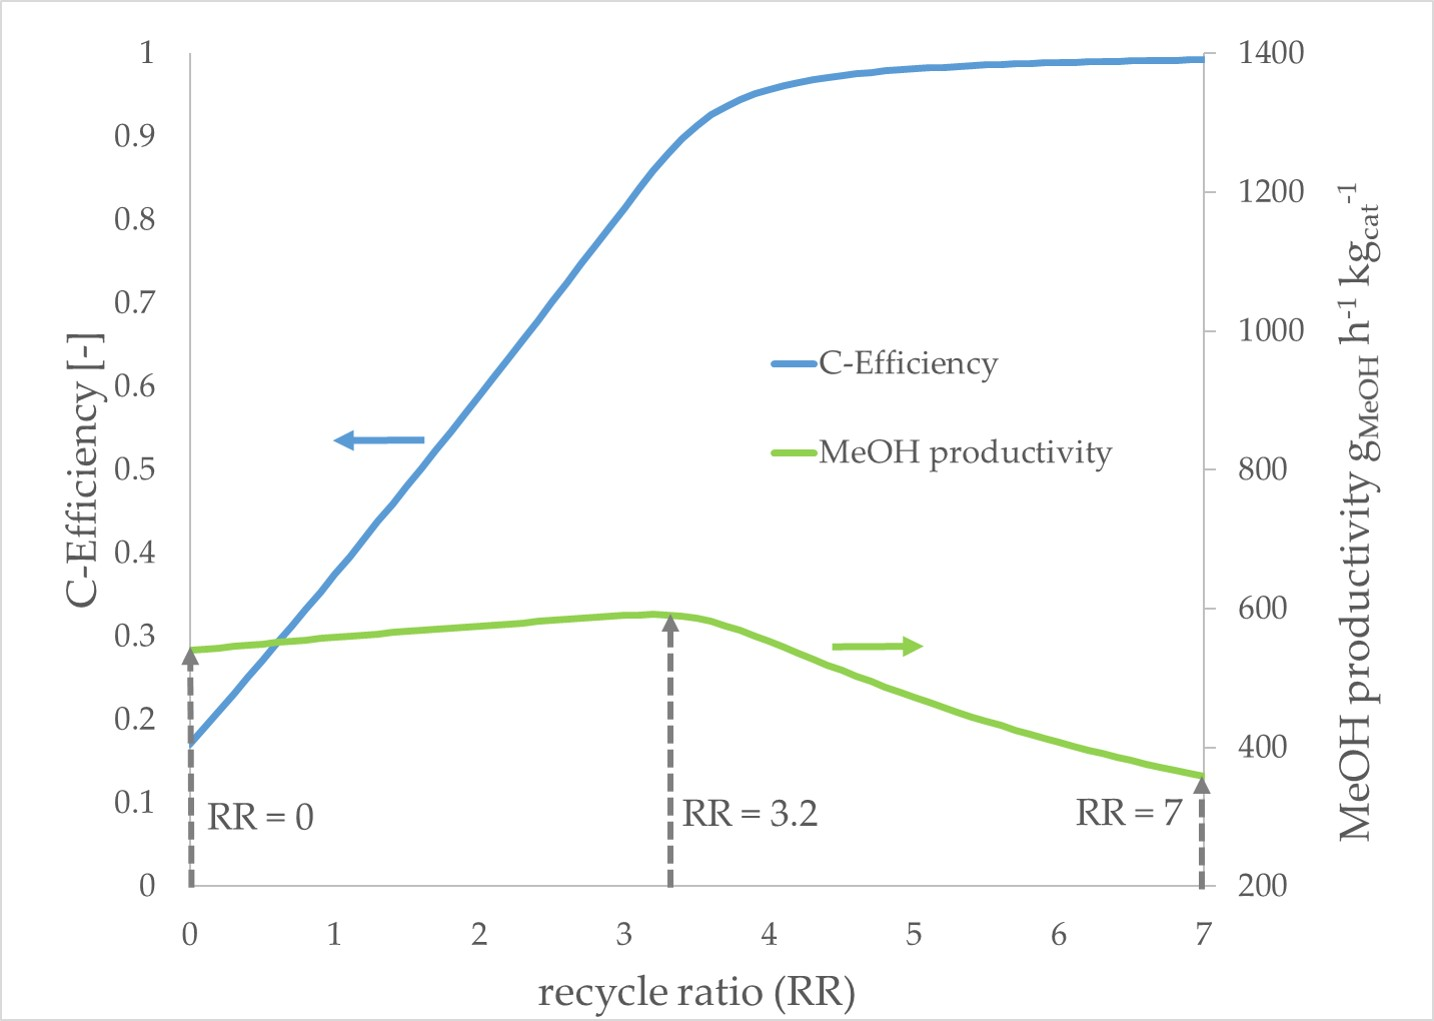
As mentioned before, the RR has a crucial effect on the process efficiency. Hence, the RR was varied and the simulation results are presented as a function of the RR. In Figure 5a, the simulation results of the BFG direct scenario are presented to point out the general effects of an increasing recycle ratio on the process efficiency. An RR of 0 corresponds to a one-pass process, and therefore, the highest methanol productivity is achieved. With an increasing RR, the methanol productivity in the reactor decreases. In contrast, the carbon efficiency increases with an increasing RR. As one of the major aims of the described work is a reduction of the CO2 emissions, an operational point with low carbon efficiency is undesirable.
On the other hand, adequate methanol productivity is required for an economically feasible process. Both a decent carbon efficiency and an acceptable grade of methanol productivity are predicted at medium values of RR in a range between two and five. In 
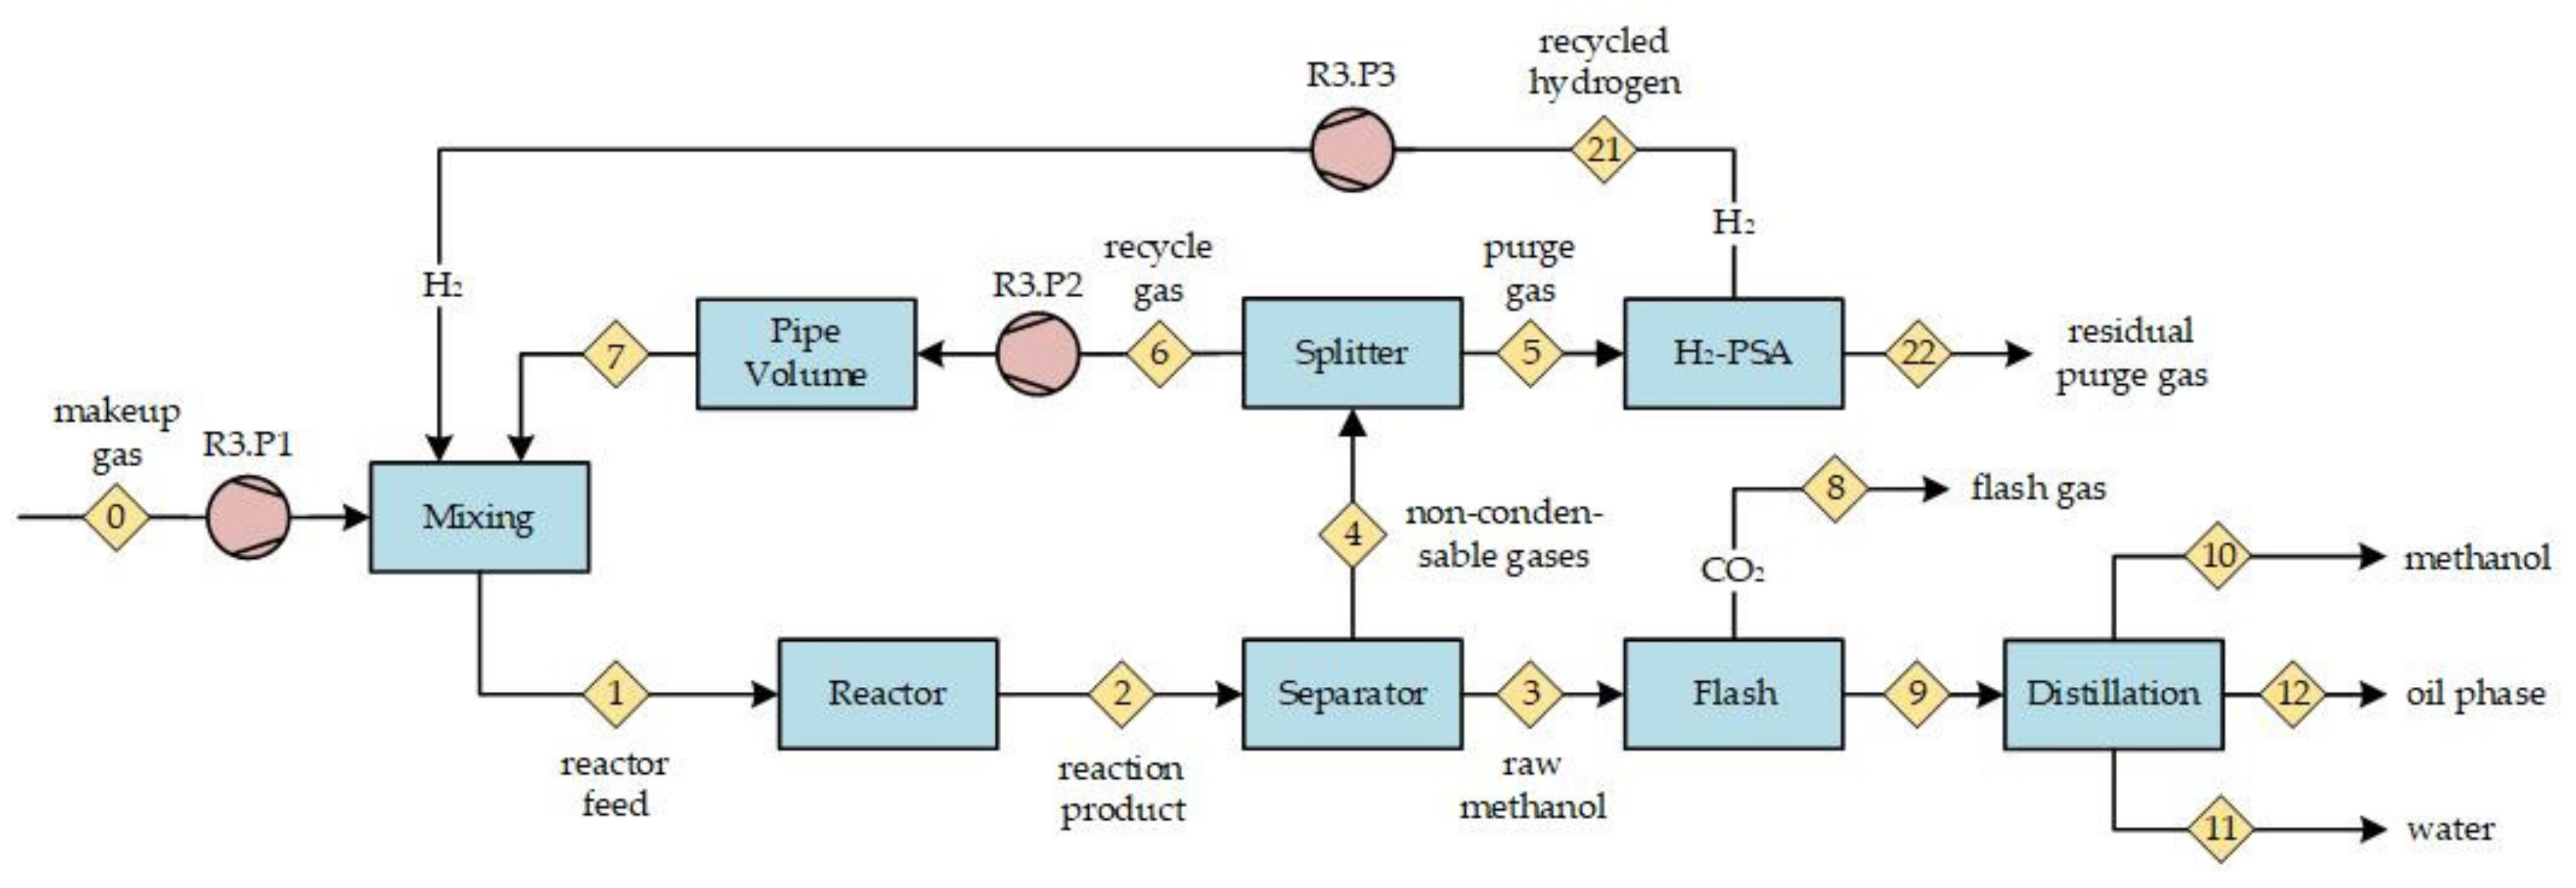
Figure 5b, the nitrogen concentration at the reactor inlet is presented. With an increasing RR, the inert nitrogen accumulates in the gas recycle loop (cf. Figure 2, point <6>) and results in successive elevated nitrogen concentrations at the reactor inlet. At an RR of five, the nitrogen content nearly doubled compared to the process feed. An increasing nitrogen share dilutes the reactive compounds in the syngas and, therefore, contributes to a decrease in methanol productivity. All scenarios with a process feed significantly containing nitrogen qualitatively show the described trends.
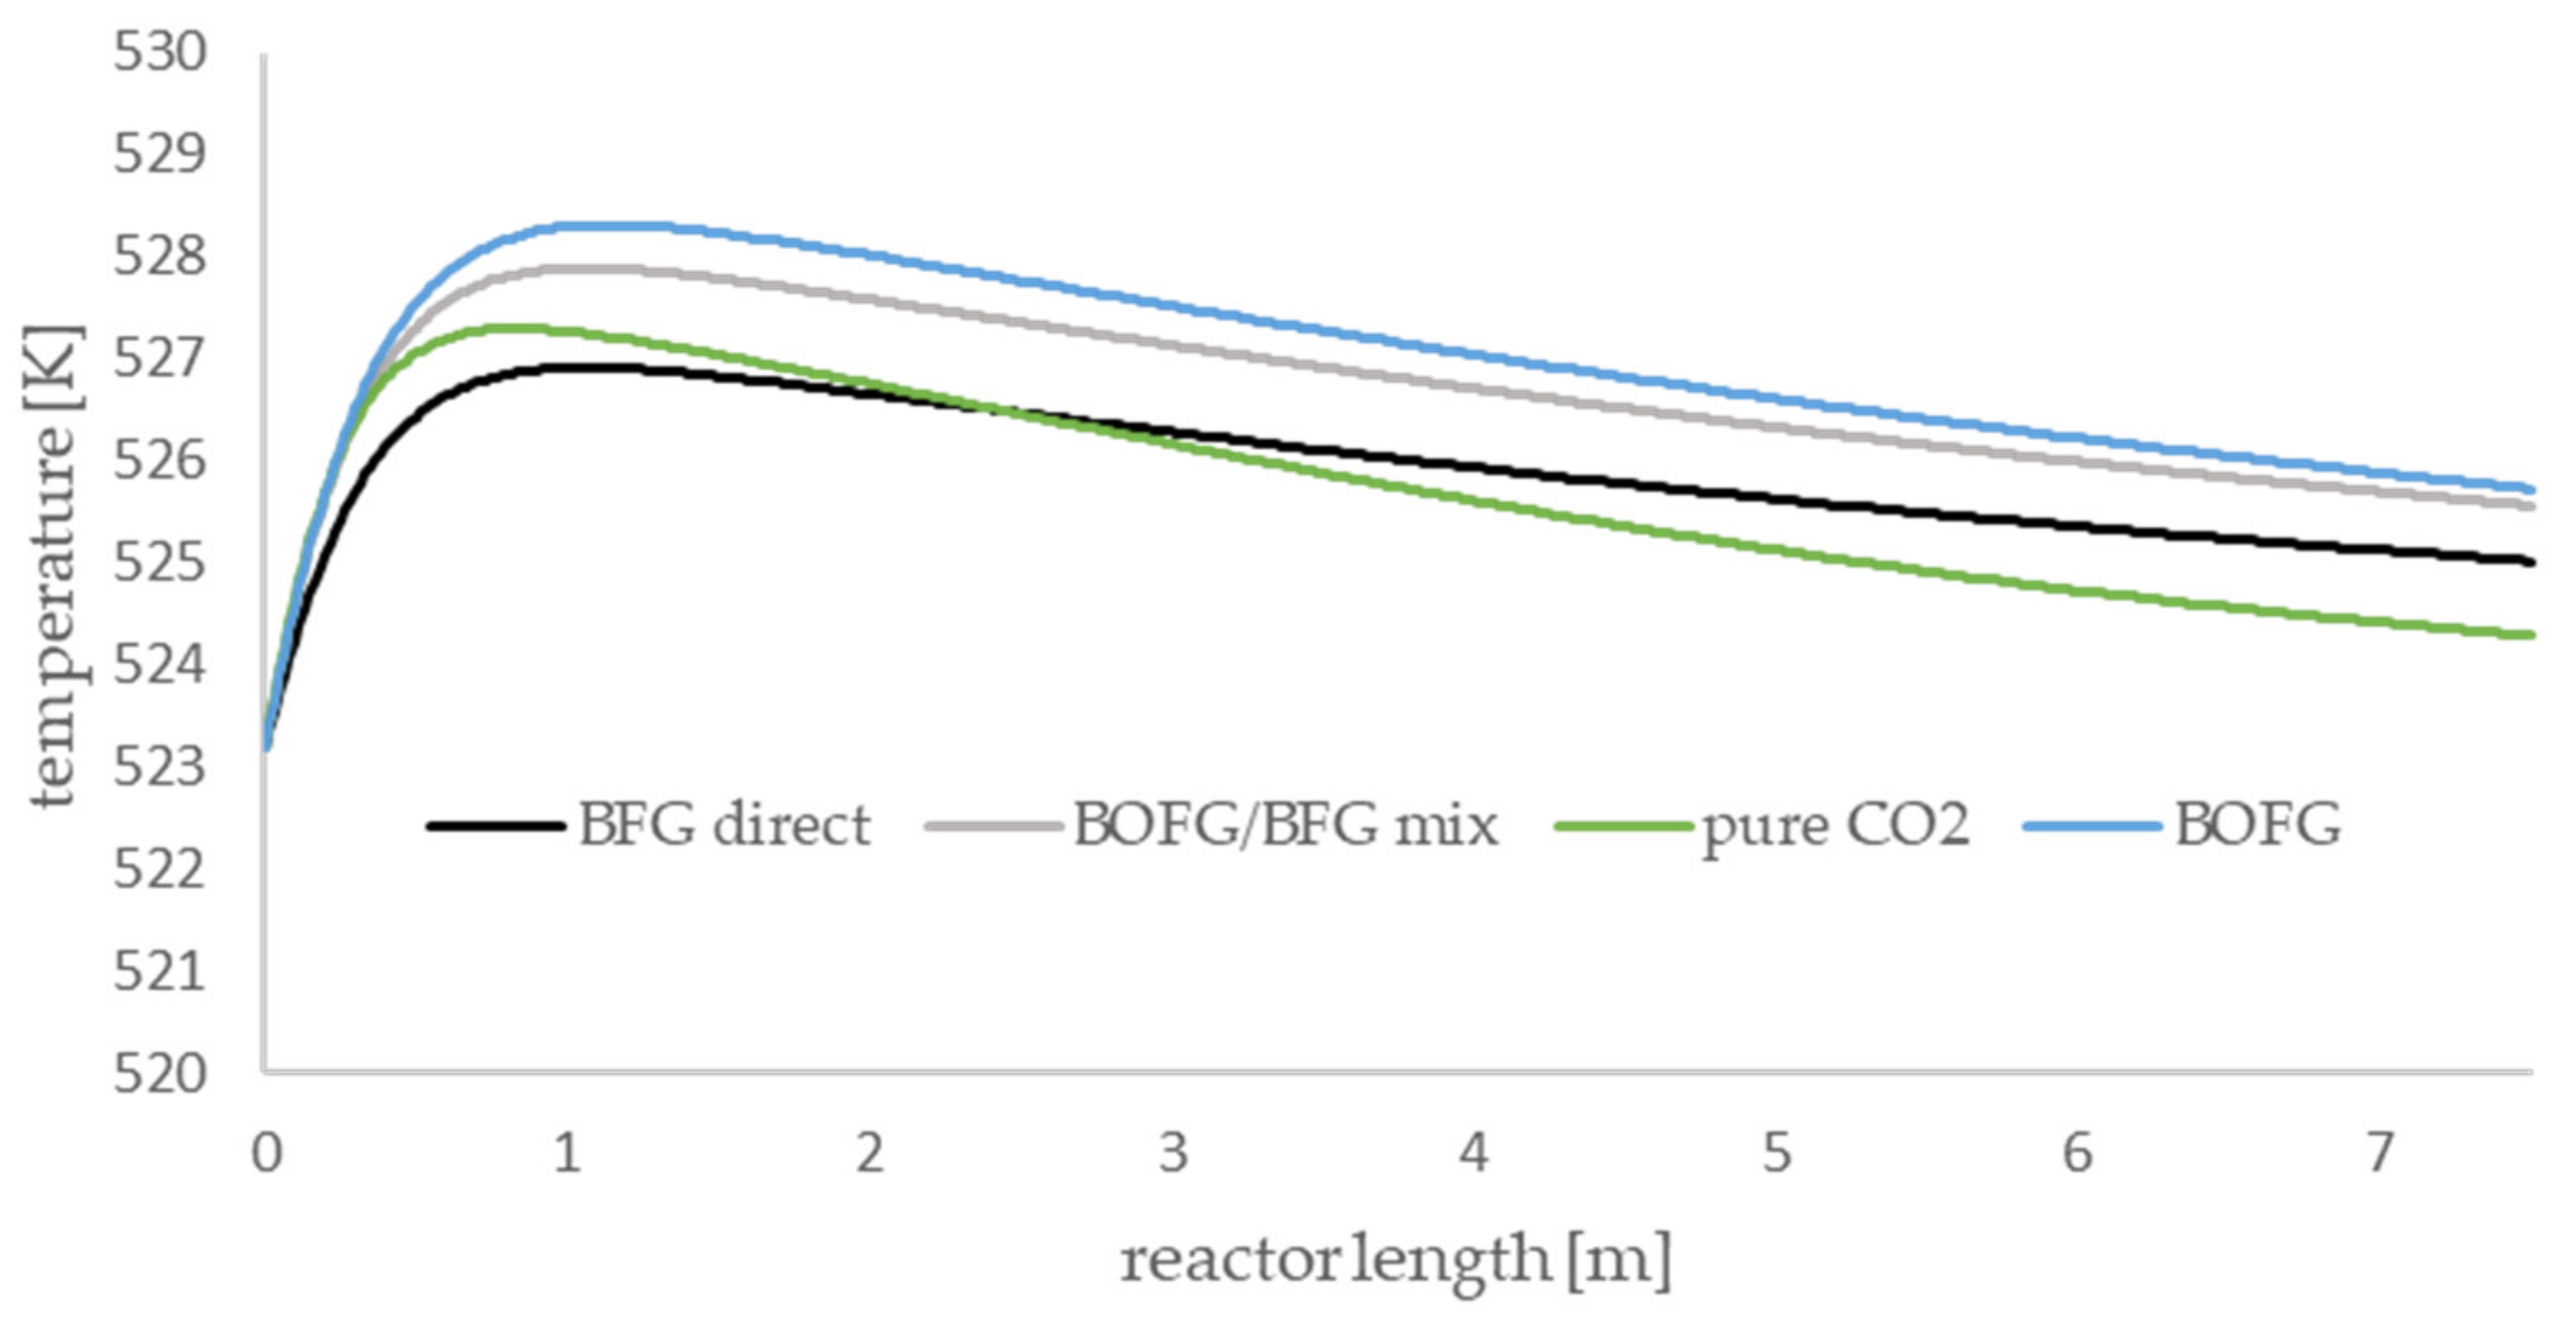
The axial temperature profiles of the methanol-synthesis reactor are presented in Figure 6. All scenarios show the same qualitative trends, and the occurring temperature gradients are comparatively small. For all scenarios, a temperature maximum is observable in the first section of the reactor. The height of the maximum depends on the gas composition of the syngas. The BOFG case exhibits the highest temperature maximum and the BFG scenario exhibits the lowest maximum. Syngas with a lot of CO produces a higher temperature maximum compared to a syngas with high amounts of CO2 and inert compounds.
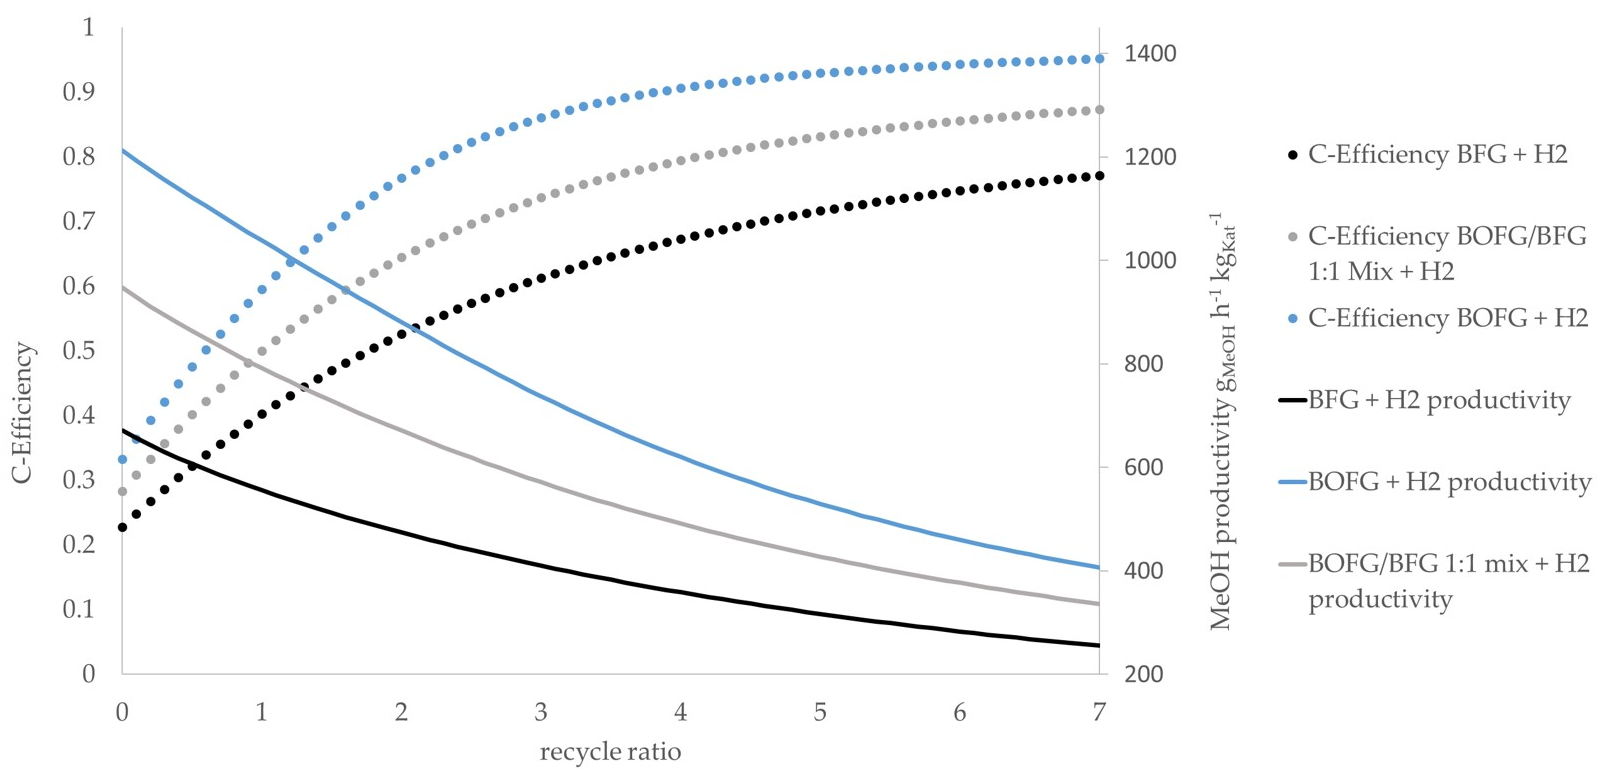
The simulation results of all scenarios are given in Figure 7. The BOFG direct scenario exhibits the highest methanol productivity, as it contains the most CO. As expected, the use of syngas with a high CO/CO2 ratio results in higher methanol productivity compared to syngas with lower CO/CO2 ratios while keeping the total amount of COx constant [16]. The BFG direct scenario shows the lowest methanol productivity as it is the syngas stream with the highest nitrogen share. Moreover, it contains higher CO2 concentrations compared to the BOFG scenario. The methanol productivity of the BOFG/BFG mix scenario is between the BOFG and the BFG scenarios. Referring to the carbon efficiency, an increasing RR leads to an increasing carbon efficiency, as described before. Above an RR of approximately three, the gain in additional carbon efficiency slows down significantly, while the reactor efficiency keeps decreasing. It is assumed that the medium RR range between three and four represents a promising operational point as it shows a high carbon efficiency as well as sufficient methanol productivity.
The pure CO2 scenario exhibits different trends compared to the prior described scenarios. With an increasing RR, the methanol productivity increases slightly until a maximum productivity is reached at an RR of 3.2. A further increase of the RR leads to decreasing productivity. The carbon efficiency increases significantly with a growing RR until an RR of 3.2 is reached. In the following, the gain of carbon efficiency decelerates faster compared to the other scenarios. In Figure 8, the simulation results of the pure CO2 scenario are presented. The maximum in methanol productivity at an RR of 3.2. is marked with a dotted line arrow.
In order to reveal the reasons for the deviating productivity trend in the case of the pure CO2 scenario, the reactor-inlet concentrations for the most productive RR of 3.2 as well as for the extreme cases of a one-pass process with an RR of 0 and a high recycle ratio of 7 are given in Table 3. At an RR of 0, the reactor-inlet exhibits a nearly stoichiometric gas composition. With an increasing RR, unconverted hydrogen is recycled and induces excess hydrogen. An accumulation of inert compounds does not occur, as there are no inert compounds present. Additionally, CO that was formed by the reverse water–gas shift reaction corresponding to Equation (3) is present at the reactor inlet.
It is assumed that a slight excess of hydrogen and an increasing CO concentration at the reactor inlet raise the reaction rate of methanol formation. A further increase of the RR leads to a very high excess of hydrogen, and the total amount of COX decreases drastically. At an RR of 7, the total amount of COx is only 4.8 vol. % compared to a COx amount of 18.4 vol. % at an RR of 3.2.

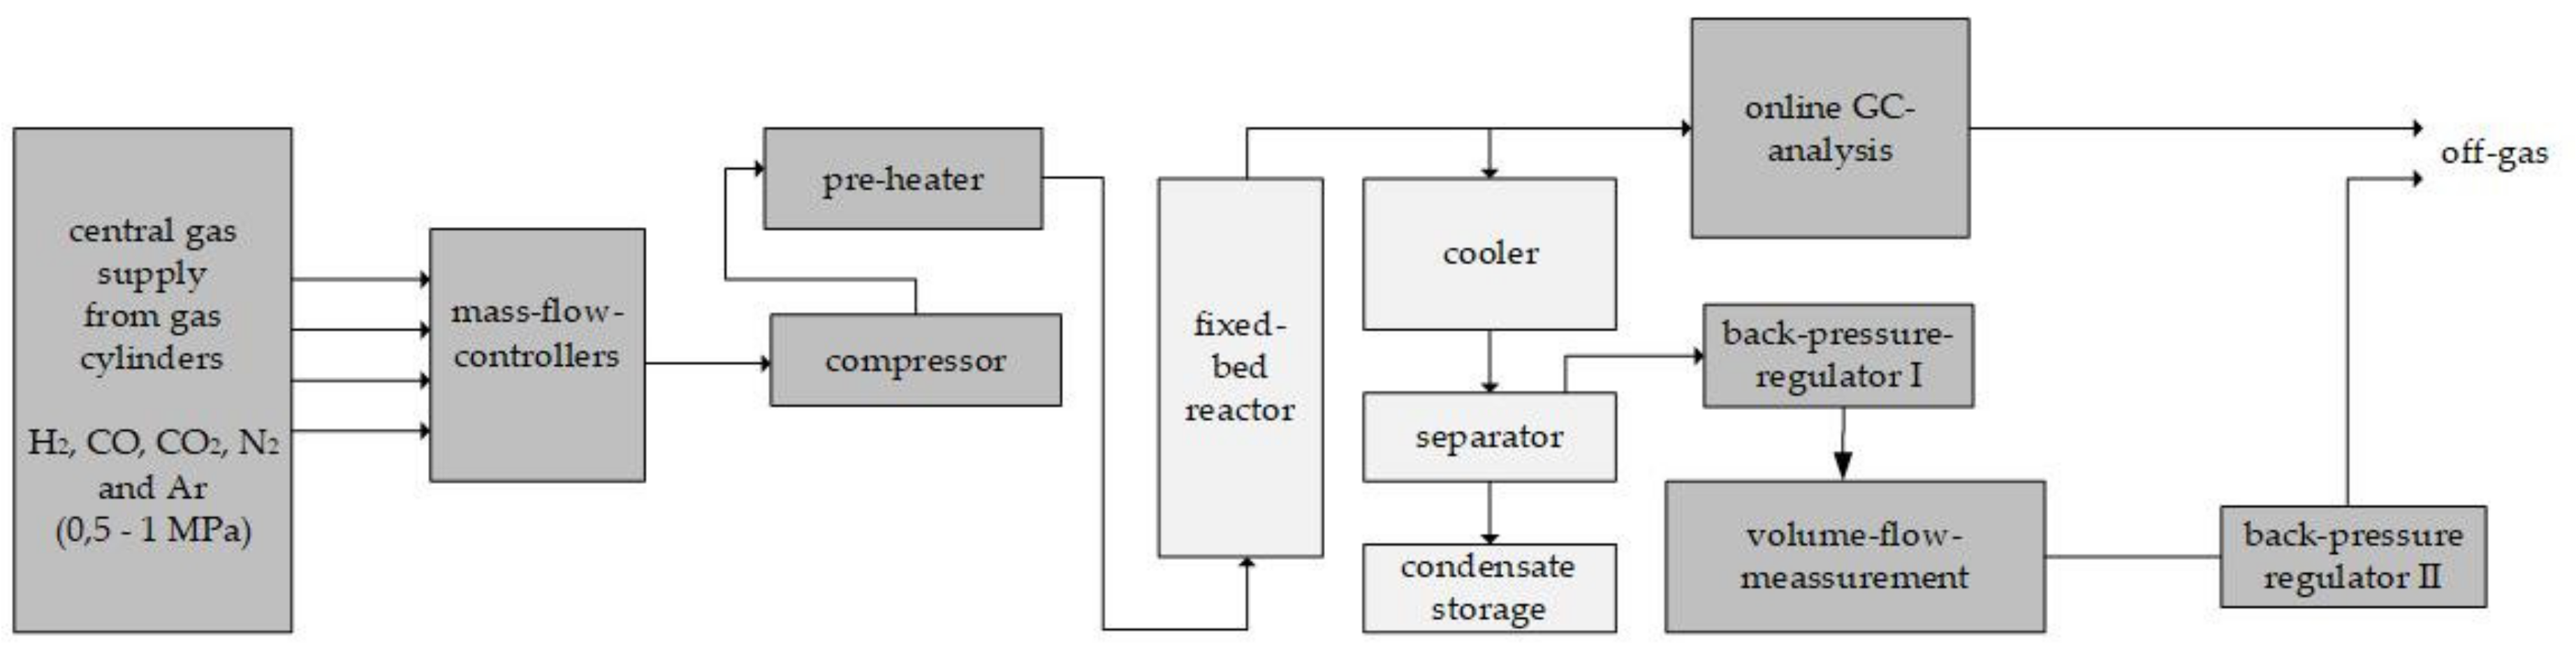
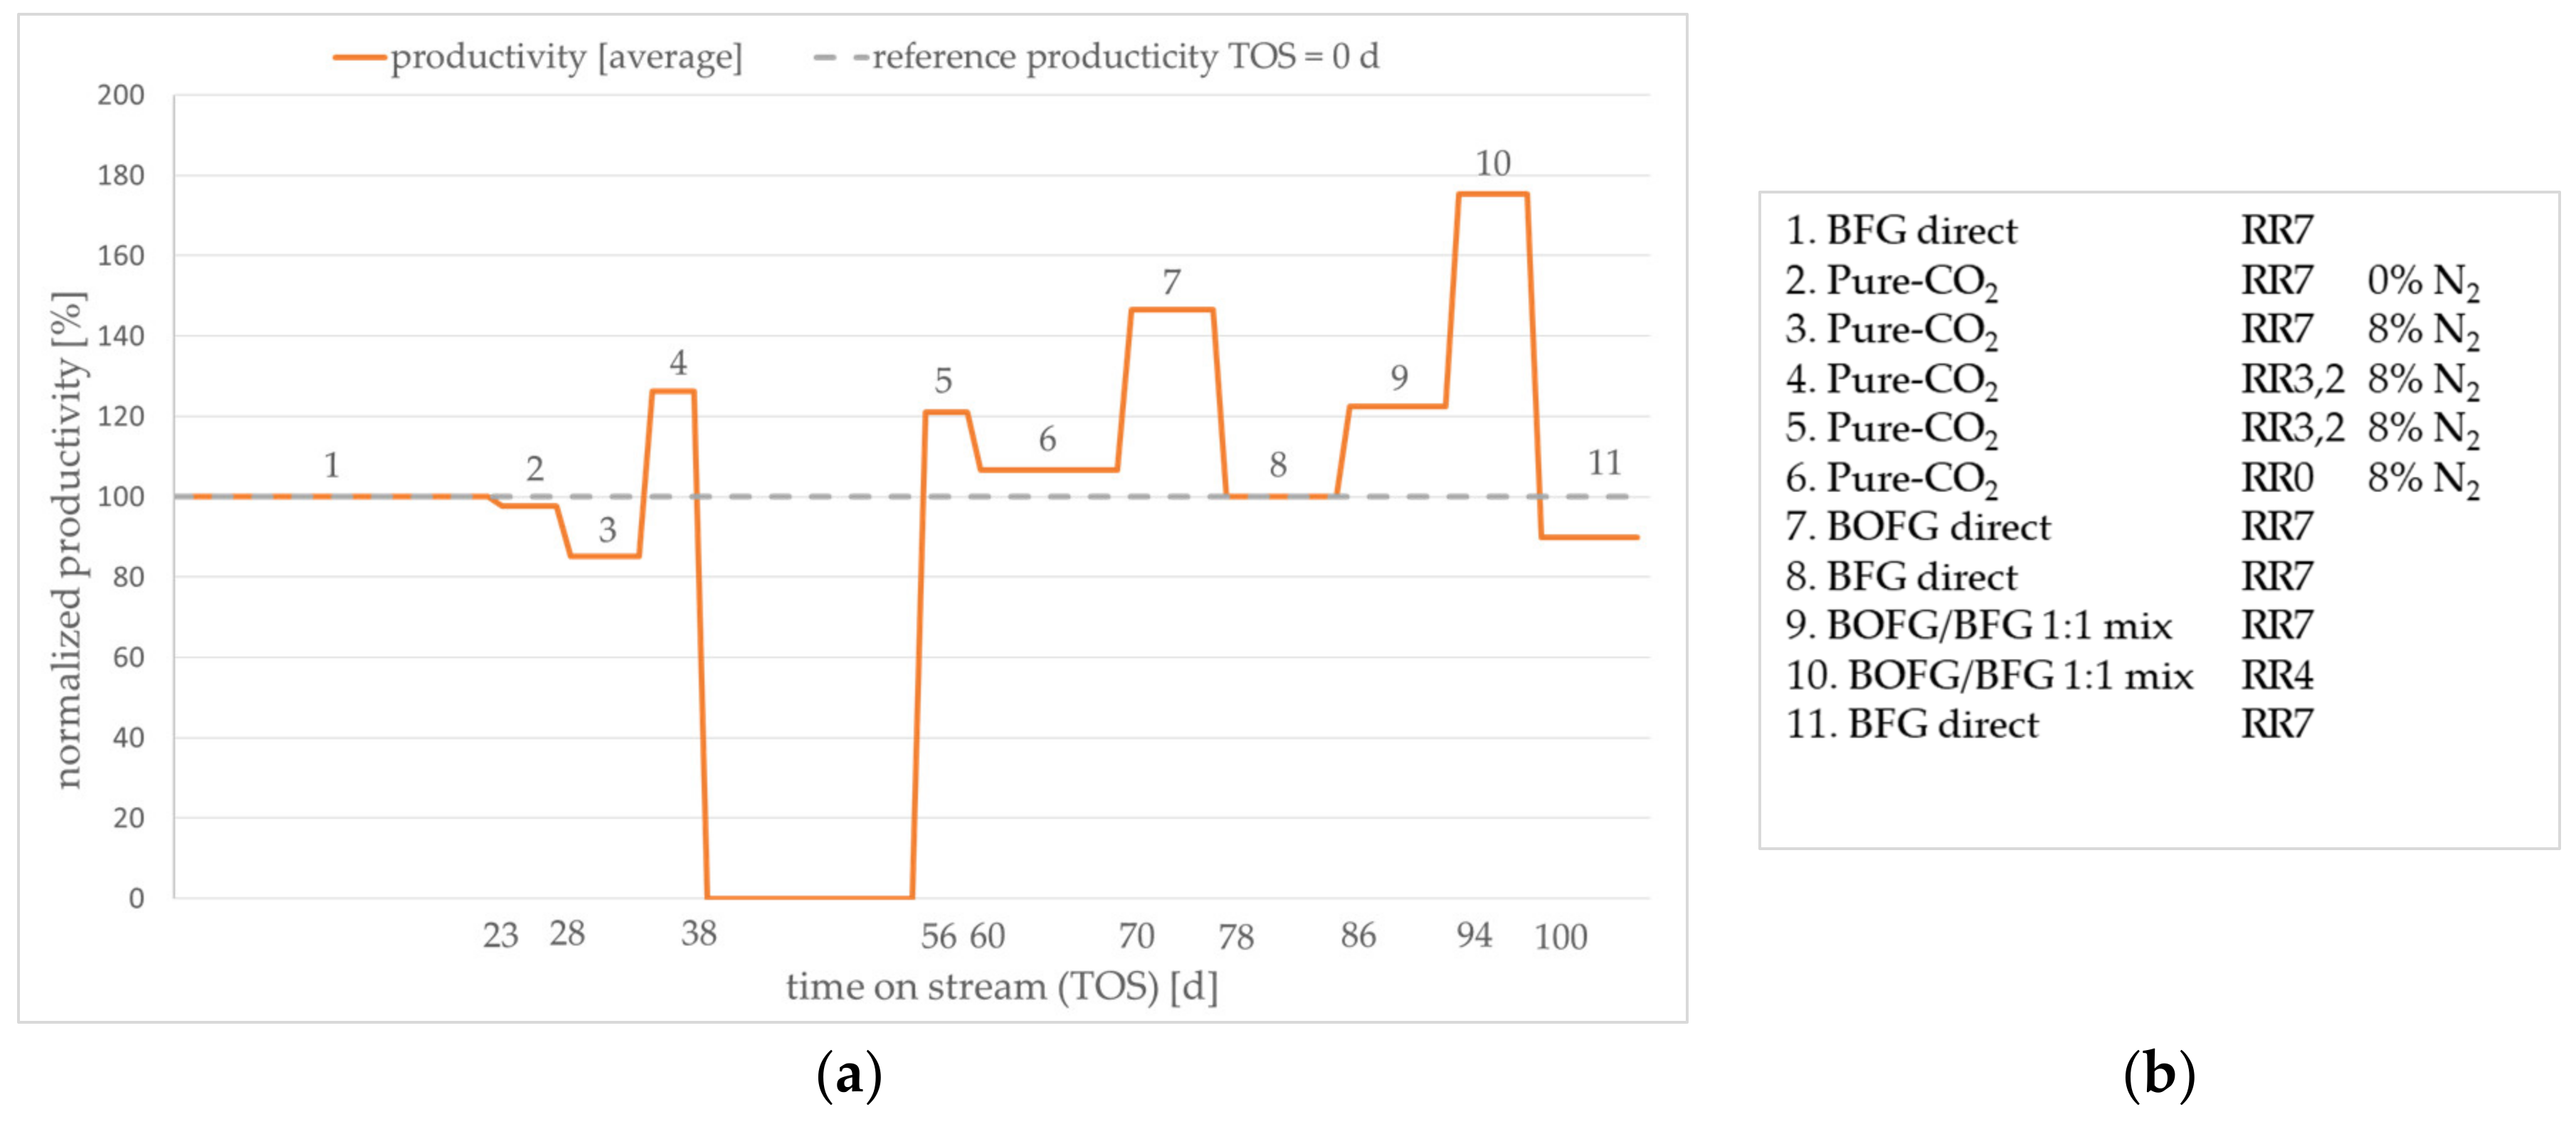
3.2. Practical Testing of Gas Utilization Scenarios

In order to obtain experimental performance data, a practical test series was performed for the considered case scenarios. The average normalized methanol productivity is given in Figure 9a. Due to nondisclosure agreements among the project partners, it is not possible to present absolute values. The order of tested scenarios and the applied theoretical RR are given in Figure 9b. The theoretical reactor-inlet gas compositions were taken from the respective simulated scenarios. The theoretical CO share of the pure CO2 scenario at the reactor inlet was added to the CO2 share as it was not possible to adjust CO concentrations below 2 vol. % in the test setup. Nitrogen was added to the pure CO2 scenario only because an internal standard was required to calculate the molar balance of the reactor.
After activating the catalyst, the start-up of test series was carried out with the BFG direct scenario for three weeks (step 1 in Figure 9b). The average productivity of this period was used as a reference for the following tests and was set to 100% productivity. The following observed changes in methanol productivity were presented relative to this value. Subsequently, the test continued with the gas composition from the pure CO2 scenario (steps 2–6). The gas compositions of three theoretical recycle ratios were applied corresponding to Table 3. The test conditions of steps 4 and 5 equal the theoretical productivity maximum presented in Figure 8 at an RR of 3.2. The two other operational points corresponding to RRs of 0 and 7 showed lower productivity. This trend is in accordance with the observed productivity trends predicted by the simulation. Thus, the assumption of an enhanced reaction rate by a slight excess of hydrogen found in the simulation was verified by the experiment. As there is no CO present in the experimental gas composition, the effect of minor CO concentrations in the reactor feed is less dominating. Subsequently, the BOFG direct scenario was experimentally examined. As expected, the productivity is higher compared to the BFG and the pure CO2 scenario. The test series proceeded with the reference scenario BFG direct (step 8) in order to determine whether the catalyst performance was permanently affected by the prior test conditions (steps 1–7). Obviously, irreversible deactivation of the catalyst did not occur. Then, the BOFG/BFG scenario was tested. The resulting productivity was between the productivity of the BOFG and the BFG scenarios, as already predicted by the simulation (cf. Figure 7). The BOFG/BFG mix scenario at an RR of 4 exhibited the highest productivity of the test series. Due to the lower RR compared to the BOFG scenario at an RR 7, the accumulation of nitrogen was lower, resulting in a slightly higher productivity. Finally, the reference conditions were applied (step 11). Here, a slight decrease of the productivity was observed. It is not clear whether deactivation occurred due to the reaction conditions of the prior test conditions. However, the drop of activity was comparatively small. Reproduction of the test series with a fresh catalyst sample might reveal permanent deactivation of the catalyst. Depending on the results, the author suggests further investigations corresponding to the applied gas compositions.
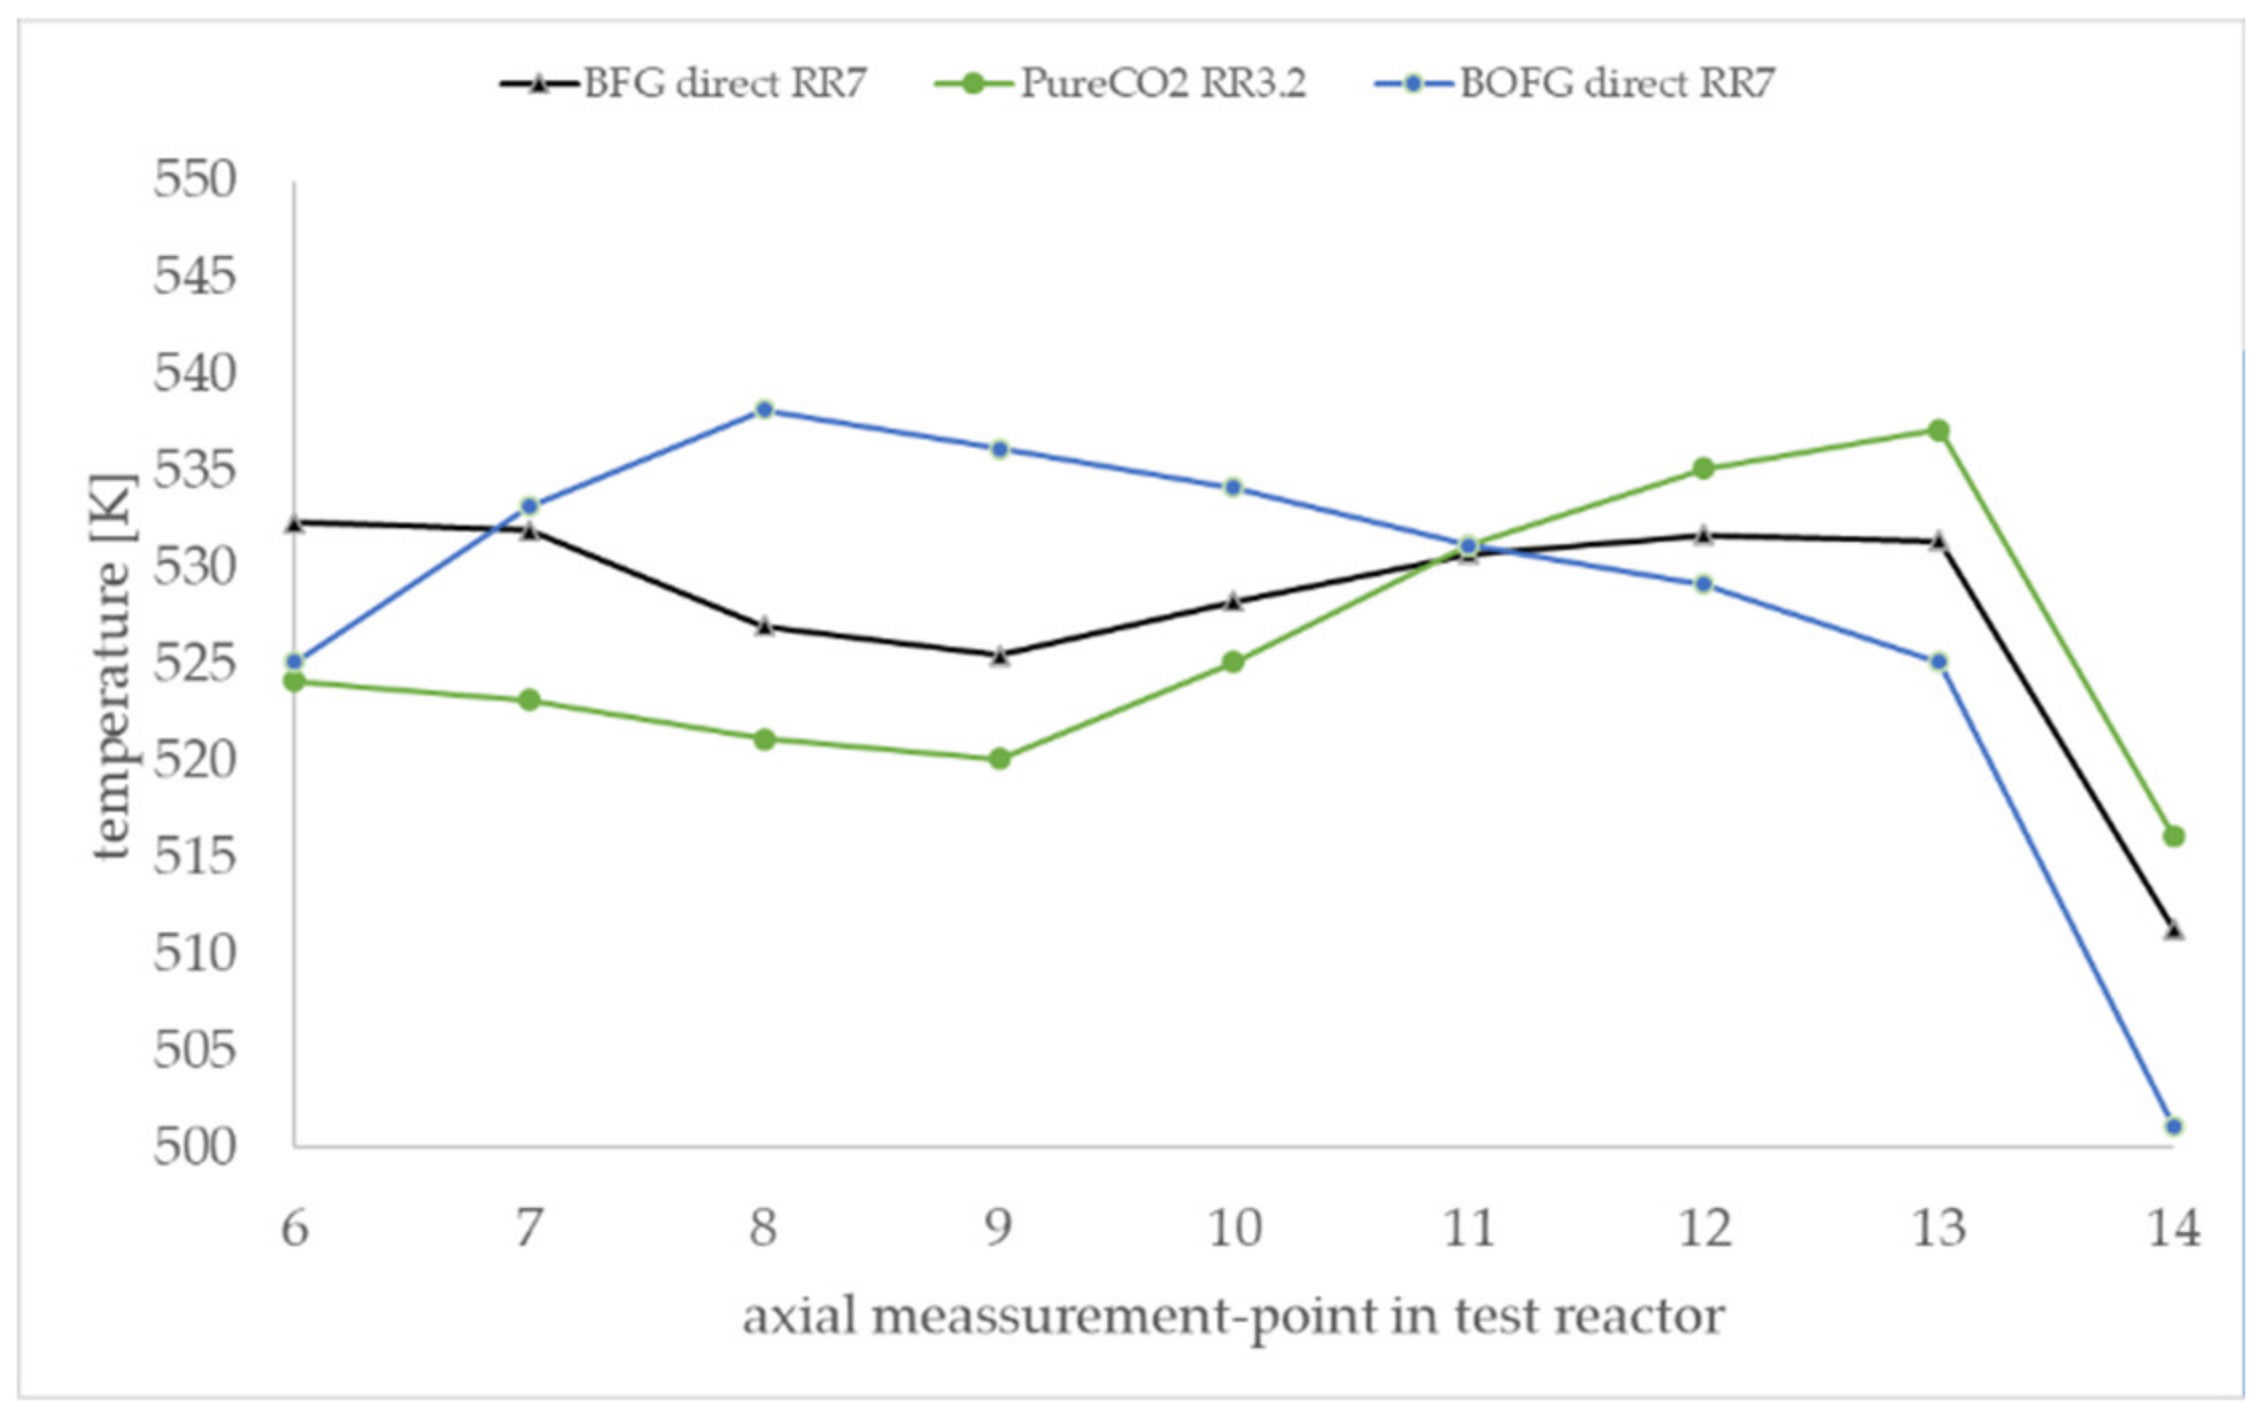
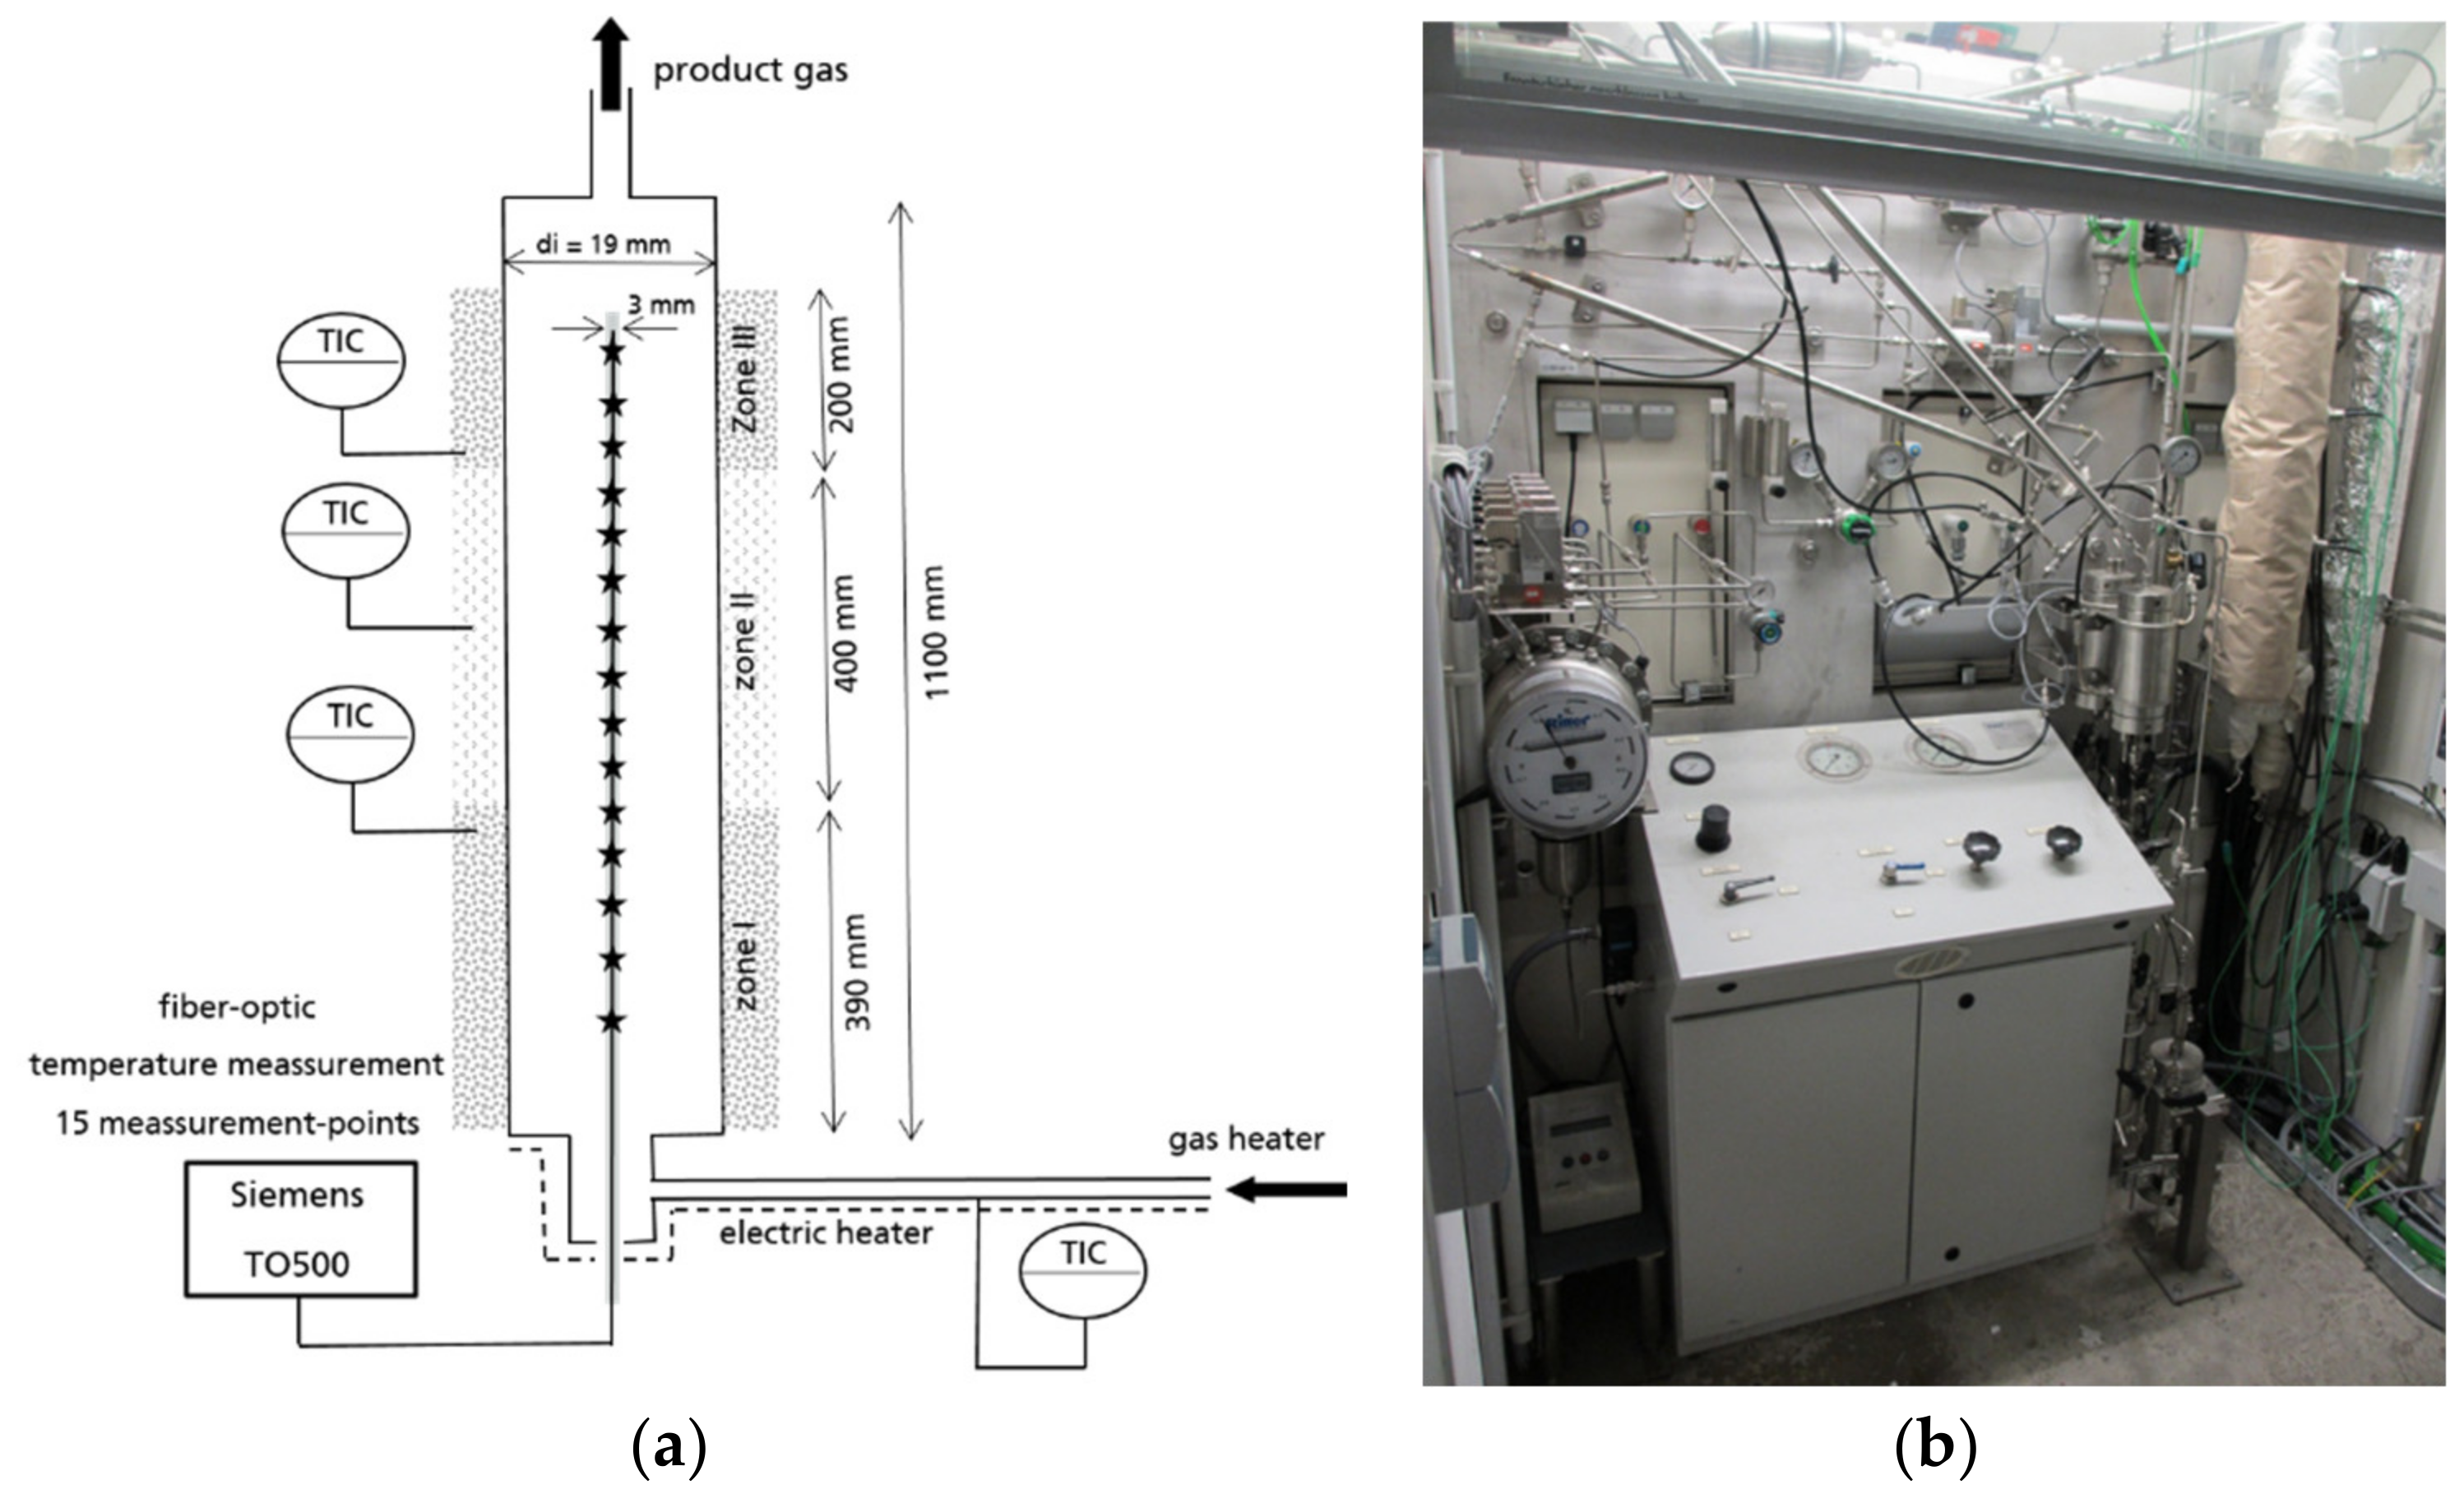
Figure 10 shows the axial temperature inside the active 60-cm catalytic fixed bed during the experiment in steady state. The measurement points 6–14 were positioned inside the active catalytic bed. The measurement points 1–6 and 14 were positioned in the inert supporting bed and are not shown in the diagram. The experimental temperature profiles are clearly influenced by the gas composition. The BOFG case exhibits a temperature maximum in the first section of the reactor. The pure CO2 case shows a temperature minimum in the first section and a maximum in the rear section of the reactor. In contrast, all simulated temperature profiles in Figure 6 show a temperature maximum in the first section. A possible reason for the differences of the temperature profiles shown in Figure 10 is discussed in Section 4.

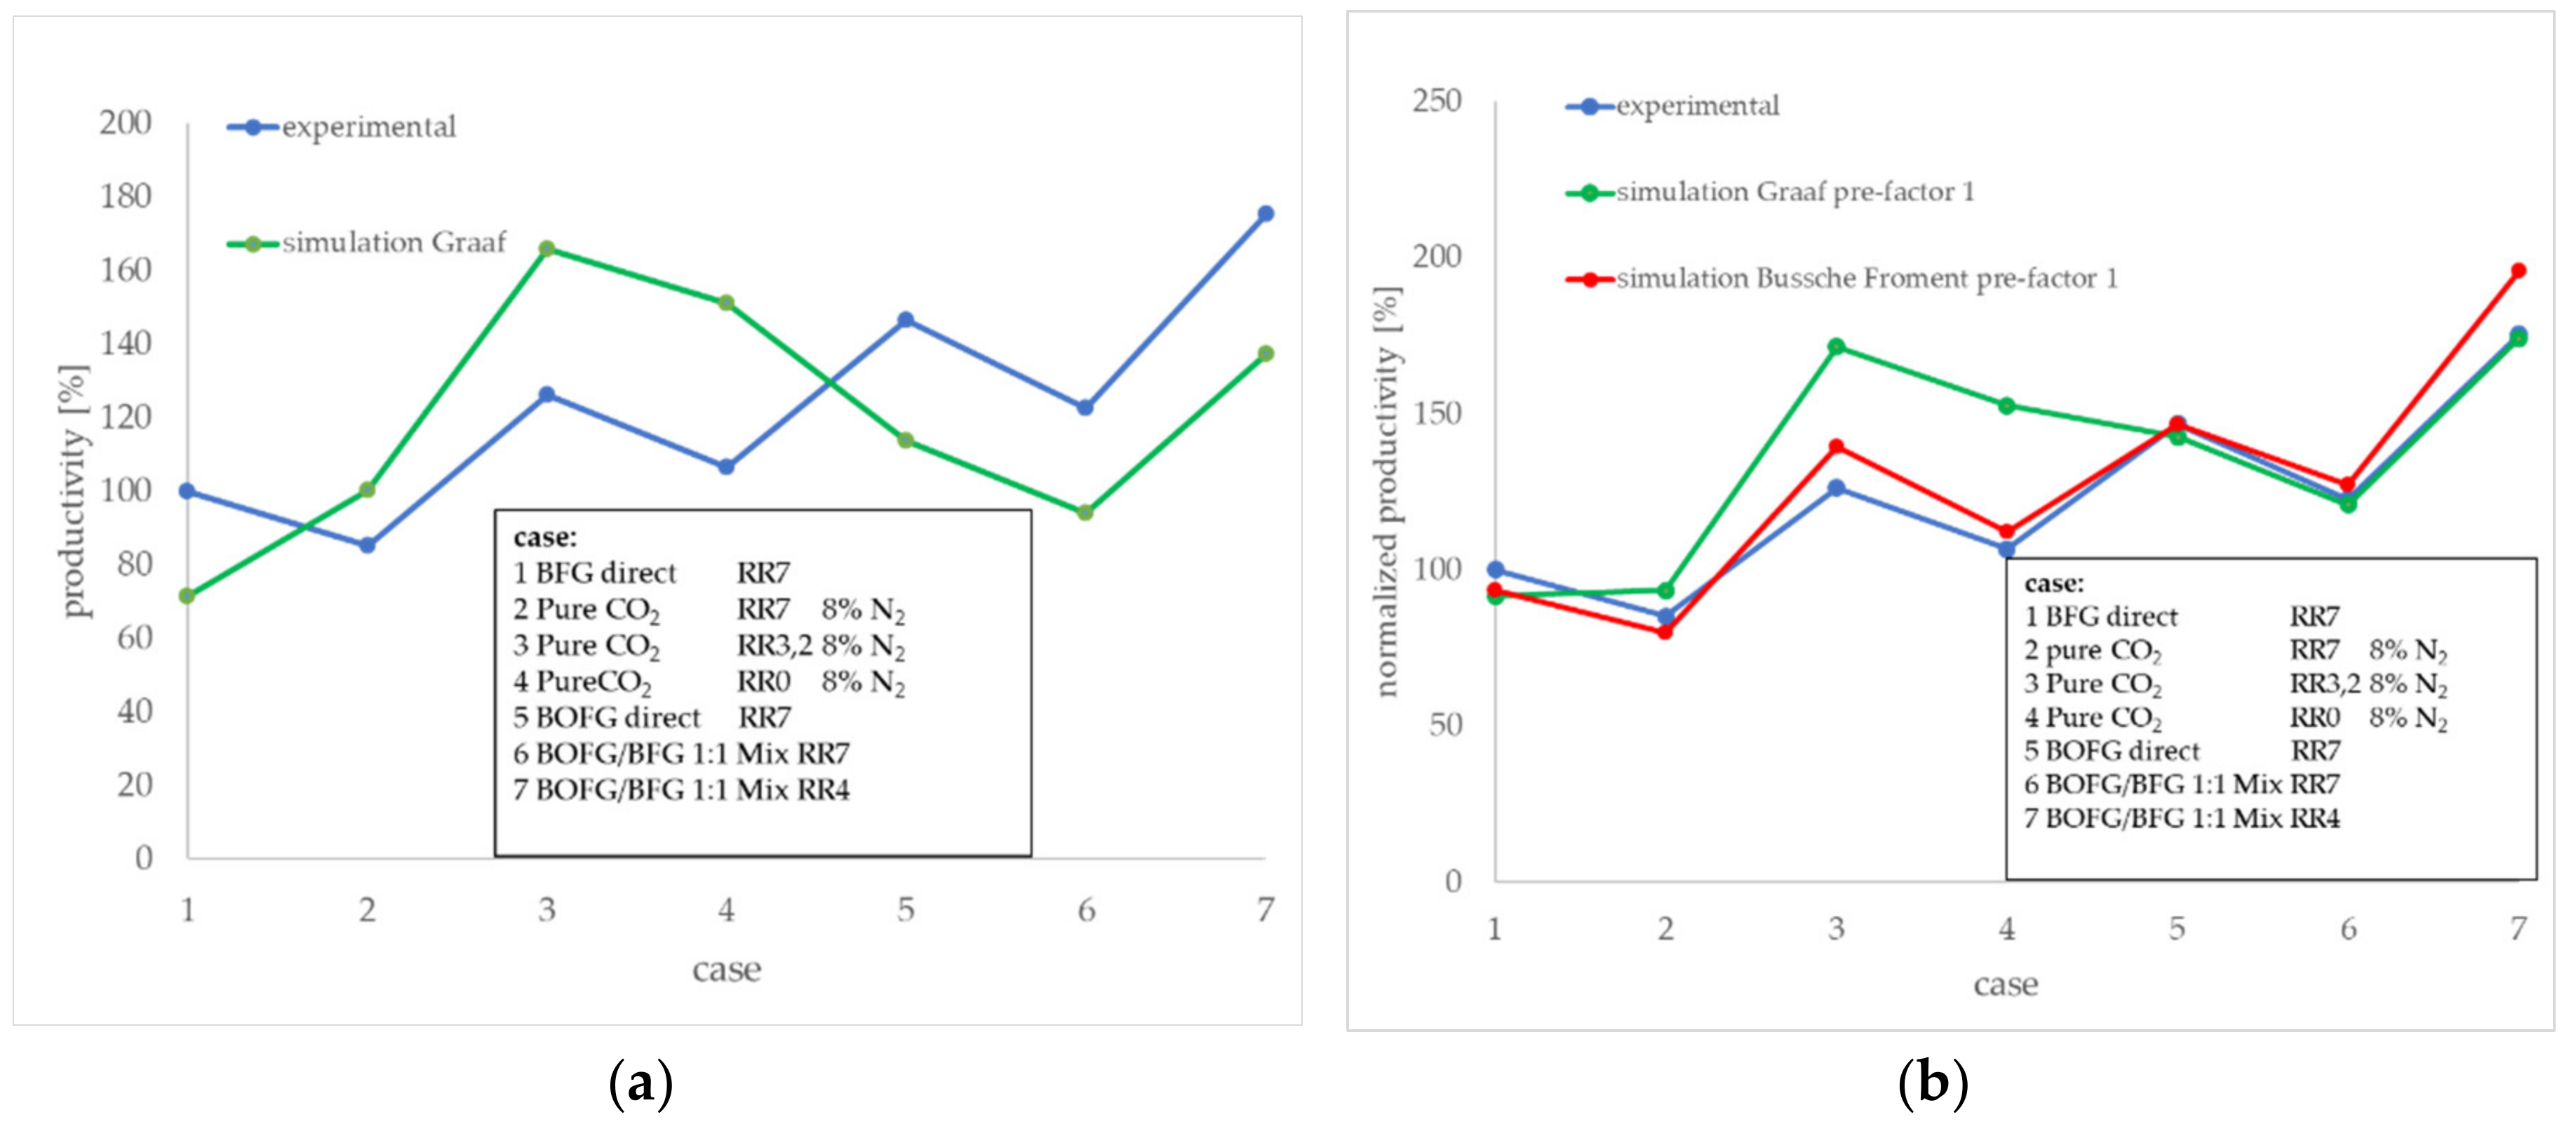
3.3. Comparison of Simulation and Practical Results

The differences between the experimental test results according to Figure 9 and the process simulation results at the respective RR and gas mixture are presented in Figure 11a. Presented here as normalized values, the experimental result of the BFG direct case at an RR of 7 (case (1)) was used as a reference point and was set to 100% productivity). Apparently, the deviation between the simulation and test results depends on the gas composition. The simulated results based on CO containing process feeds (BFG direct, BOFG direct, and BOFG/BFG 1:1 mix) showed a lower productivity compared to the experimental results. In contrast to these scenarios, the simulation results for the pure CO2 scenario exhibited higher results compared to the experimental results. Both should be discussed in the following.
The kinetic approach of the reactor model was taken from the literature according to the Graaf kinetic approach. The required kinetic parameters of the model were taken from literature [9] and diffusion limiting pre-factors were adapted to performance data from Graaf and Beenackers for an industrial methanol process [8]. The available parameters were determined for conventional syngases, based on mostly used fossil feed stocks like reformed natural gas. The gas compositions of the considered scenarios deviate from these gas compositions in terms of an inreased CO2/CO-ratio. An adapted set of kinetic parameters, obtained from kinetic studies with the applied gas composition and type of catalyst might lead to better fitting simulation results. Currently, no adapted set of parameters is available, but the pre-factors of the kinetic rate expressions according to diffusion limitation might be changed for this laboratory situation. In addition to the Graaf kinetic approach, the Bussche and Froment kinetic approach was considered in the simulation in order to compare with experimental results at different gas compositions [17]. In our experiments a broken catalyst with particle sizes much smaller than the original pellet size is used, so catalyst diffusion limitation should not arise significantly. This in mind the kinetic pre-factors of the rate expressions was set to 1.0 for all cases. In a second simulation run with equal reactor inlet conditions, and after all this approach showed good conformity to the experimental results.
Figure 11b shows a comparison of the two simulated kinetic approaches and the experimental results. The Bussche-Froment approach exhibits better conformity with regard to the pure CO2 cases (3) and (4). The gas compositions with significant shares of CO seem to be represented good by both kinetic approaches, but slightly better by Graaf. Best compliance to the experimental results was found for the Graaf kinetic approach at the high CO-containing cases (6) and (7).

4. Discussion

The gas utilization scenarios presented in this work focused on the main steel-mill gas streams and acted as a starting point for the development of further optimization of gas utilization and the integration of a methanol synthesis based on steel-mill gases. However, the derived scenarios show the general characteristics of the different steel-mill gas sources. The utilization of H2-enriched BFG exhibits the lowest productivity compared to the other cases considered. A direct utilization is considered, as the BFG is the most important steel-mill gas stream in terms of its total amount. A significant reduction of the CO2 emissions of the steel mill can only be achieved by utilization of BFG. The simulation results show that accumulation of nitrogen in combination with a high CO2 share in the BFG results in a comparatively low reactor productivity. The simulation results of the BOFG utilization scenario show that high reactor productivity in combination with a satisfactory carbon efficiency is possible, but the CO2 reduction potential of the BOFG direct scenario is expected to be low due to its low availability.
The pure CO2 scenario shows a high reactor productivity and sufficient carbon efficiency in case of a gas recycle ratio around 3.2; the respective values are only slightly lower compared to the BOFG direct scenario. The operational point with a maximum productivity at a recycle ratio of 3.2 was identified by the use of process simulation and was further validated by the experimental investigations. It turned out to be an interesting case for an economic evaluation of a process concept based on CO2. Pure CO2 is generated from BFG by water–gas shifting the CO fraction to CO2 and by subsequent sequestration in an amine scrubber process. An additional question here is the possibility of hydrogen separation from the shift gas in order to minimize the hydrogen supply to the syngas. The expenditures for the additional process steps compared to the BFG direct scenario have to be evaluated within the scope of an overall economic analysis of these two process concepts.
The deviations between the experimental test results and the reactor simulation (cf. Figure 11a) can be explained by the differences in the experimental setup and the simulated large-scale reactor. The main differences are the reactor tube and catalyst pellet size and the temperature management of the reactors. For the simulated industrial reactor, a constant boiling water temperature was assumed on the outside of the rector tube; the temperature control of the laboratory reactor was performed on an electrical heating jacket. The experimental results show that the gas composition affects whether a positive or a negative deviation between simulation and practical tests occurs. Apparently, pure CO2 syngas shows a different performance compared to CO-containing syngas. One reason might be the lower heat generation of the pure CO2 case. It is possible that the experimental reactor is locally cooler compared to the cases with CO-rich syngas. The assumption is supported by the measured temperature profiles presented in Figure 10. This would explain why the simulated productivity is higher than the experimental values.
In this context, another reason for the differences between the simulated and the practically determined results for CO2-rich gases and the CO-containing syngases might arise from the applied kinetic model and the respective set of parameters. In order to investigate the differences between the kinetic approaches and to figure out which approach better fits the respective gas compositions of the considered cases scenarios, a comparative simulation between the kinetic approach of Graaf and the approach of Bussche–Froment was done. As a successful fitting of the Bussche–Froment approach to pure CO2 was possible by neglecting the diffusional limitation for the laboratory setup with a broken catalyst, it seems to be likely that the deviations between the experimental results and the simulation results predominantly arise from the applied kinetic rate expressions.
Besides the theoretical process efficiency, it is important to validate the stability of the applied industrial methanol synthesis catalyst MegaMax®800 from Clariant. The presented experimental data prove that methanol synthesis with synthetic steel-mill gases is possible within a period of 80 days without showing a significant loss of activity. It has to be pointed out that this test period is too short to guarantee the catalyst stability in a technical process. Therefore, longer test periods are required. The applied synthetic gas compositions are pure in terms of trace compounds that might arise from the steel-mill processes. These contaminants might have a negative effect on the catalyst performance [18]. Therefore, the possibility of generating syngas streams from real steel-mill gases that do not affect the catalyst stability has to be proven. Additionally, test series with real gases for a technical relevant testing period are mandatory for a realistic evaluation of the catalyst stability.

Author Contributions

Conceptualization, K.G., H.L., and S.K.; formal analysis, K.G. and S.S.; investigation, K.G. and S.S.; methodology, H.L., S.K., and S.S.; software and modelling, S.S.; visualization, K.G.; writing—original draft, K.G., H.L., S.K., and S.S. All authors have read and agreed to the published version of the manuscript.

Funding

The German Federal ministry of Education and Research (BMBF) funded the investigations within the scope of the project Carbon2Chem®. Support code: 03EK3039F.

Acknowledgments

We thank Björn Wölk for performing the experimental investigations and simulation calculations and Torsten Hennig for supporting and performing simulation calculations. We also thank our project partners in the Carbon2Chem subproject L2 (methanol synthesis) for the trusted cooperation.

Conflicts of Interest

The authors declare no conflict of interest.

References

  1. Sehested, J. Industrial and scientific directions of methanol catalyst development. J. Catalys. 2019, 371, 368–375. [Google Scholar] [CrossRef]
  2. Sheldon, D. Methanol production—A technical history. Johnson Matthey Technol. Rev. 2017, 61, 172–182. [Google Scholar] [CrossRef]
  3. Oles, M.; Lüke, W.; Kleinschmidt, R.; Büker, K.; Weddige, H.-J.; Schmöle, P.; Achatz, R. Carbon2Chem®—Ein cross-industrieller ansatz zur reduzierung der treibhausgasemissionen. Chemie Ingenieur Technik 2018, 90, 169–178. [Google Scholar] [CrossRef]
  4. Deerberg, G.; Oles, M.; Schlögl, R. The project Carbon2Chem®. Chemie Ingenieur Technik 2018, 90, 1365–1368. [Google Scholar] [CrossRef]
  5. Schlüter, S.; Hennig, T. Modeling the catalytic conversion of steel mill gases using the example of methanol synthesis. Chemie Ingenieur Technik 2018, 90, 1541–1558. [Google Scholar] [CrossRef]
  6. Ganesh, I. Conversion of carbon dioxide into methanol—A potential liquid fuel: Fundamental challenges and opportunities (a review). Ren. Sustain. Energy Rev. 2014, 31, 221–257. [Google Scholar] [CrossRef]
  7. Ott, J.; Gronemann, V.; Pontzen, F.; Fiedler, E.; Grossmann, G.; Kersebohm, D.B.; Weiss, G.; Witte, C. Methanol. In Ullmann’s Encyclopedia of Industrial Chemistry; Wiley-VCH Verlag GmbH & Co. KGaA: Weinheim, Germany, 2000; p. 197. [Google Scholar]
  8. Graaf, G.H.; Beenackers, A.A.C.M. Comparison of two-phase and three-phase methanol synthesis processes. Chem. Eng. Process. Proc. Intensific. 1996, 35, 413–427. [Google Scholar] [CrossRef]
  9. Graaf, G.H.; Stamhuis, E.J.; Beenackers, A.A.C.M. Kinetics of low-pressure methanol synthesis. Chem. Eng. Sci. 1988, 43, 3185–3195. [Google Scholar] [CrossRef]
  10. Girod, K.; Breitkreuz, K.; Gerstner, A.; Marzi, T.; Schulzke, T.; Kaluza, S. Close-to-practice investigations of heterogeneously catalyzed syngas conversions in slurry and fixed-bed reactor systems. Chemie Ingenieur Technik 2018, 90, 690–695. [Google Scholar] [CrossRef]
  11. Siemens, A.G. A Sharp Profile Optical Determination of Temperature Gradients within the Smallest Space Enables Optimized Reaction. Available online: https://assets.new.siemens.com/siemens/assets/api/uuid:3f934d85-748a-4815-afa8-30fe583a4d79/case-study-evonik-en-sitrans-to-v1.pdf (accessed on 28 September 2020).
  12. Von Dosky, S.; Ens, W.; Grieb, H.; Hilsendegen, M.; Schorb, S. Optical fiber temperature measurement for process industry. In Proceedings of the AMA Conferences 2013, Nurnberg, Germany, 14 May 2013; pp. 578–582. [Google Scholar]
  13. Behrens, M.; Studt, F.; Kasatkin, I.; Kühl, S.; Hävecker, M.; Abild-Pedersen, F.; Zander, S.; Girgsdies, F.; Kurr, P.; Kniep, B.-L.; et al. The active site of methanol synthesis over Cu/ZnO/Al2O3 industrial catalysts. Science 2012, 336, 893–897. [Google Scholar] [CrossRef] [PubMed]
  14. Ertl, G.; Knözinger, H.; Schüth, F.; Weitkamp, J. (Eds.) Handbook of Heterogeneous Catalysis; Wiley-VCH Verlag GmbH & Co. KGaA: Weinheim, Germany, 2008. [Google Scholar]
  15. Richardson, J.T. Principles of Catalyst Development; Springer: Boston, MA, USA, 1989; ISBN 978-1-4899-3727-8. [Google Scholar]
  16. Girod, K.; Breitkreuz, K.; Hennig, T.; Lohmann, H.; Kaluza, S. Steel mills as syngas source for methanol synthesis: Simulation and practical performance investigations. Chem. Eng. Trans. 2019, 74, 475–480. [Google Scholar]
  17. Bussche, K.M.V.; Froment, G.F. A steady-state kinetic model for methanol synthesis and the water gas shift reaction on a commercial Cu/ZnO/Al2O3Catalyst. J. Catalys. 1996, 161, 1–10. [Google Scholar] [CrossRef]
  18. He, J.; Laudenschleger, D.; Schittkowski, J.; Machoke, A.; Song, H.; Muhler, M.; Schlögl, R.; Ruland, H. Influence of contaminants in steel mill exhaust gases on Cu/ZnO/Al 2 O 3 catalysts applied in methanol synthesis. Chemie Ingenieur Technik 2020, 92, 1525–1532. [Google Scholar] [CrossRef]
Figure 1. Typical gas composition in vol. % of steel-mill gases.
Processes 08 01673 g001
Figure 2. Flow scheme of the applied process model.
Processes 08 01673 g002
Figure 3. Basic flow scheme of the test setup.
Processes 08 01673 g003
Figure 4. (a) Fixed-bed reactor with fibre-optic temperature measurement and (b) photo of the test setup.
Processes 08 01673 g004
Figure 5. Carbon efficiency and reactor productivity (a), and N2-amount at the reactor inlet (b) as a function of the recycle ratio (RR).
Processes 08 01673 g005
Figure 6. Axial temperature profile of the gas utilization scenarios at a recycle ratio (RR) of 7.
Processes 08 01673 g006
Figure 7. Simulation results of four gas-utilization scenarios.
Processes 08 01673 g007
Figure 8. Carbon efficiency and methanol productivity for the pure CO2 scenario as a function of the recycle ratio (RR).
Processes 08 01673 g008
Figure 9. Practical test results of the considered case scenarios (a) and the order of the performed tests (b).
Processes 08 01673 g009
Figure 10. Axial temperature profile measured at 9 equidistant measurement points inside the catalytic fixed bed of 60 cm total length.
Processes 08 01673 g010
Figure 11. Comparison between experimental productivity and the process simulation results according to the Graaf kinetic with catalyst diffusion limitation pre-factors adapted to an industrial catalyst (a) and comparison between the experimental results and simulation results according to two different kinetic approaches without lcatalyst diffusion limitation pre-factors (b).
Processes 08 01673 g011
Table 1. Parameters of the reactor model.
ParameterValue
boiling water temperature523 K
synthesis pressure8.4 MPa
catalyst mass108 t
gas feed reactor188 Nm3 s−1
reactor pipe inner ø44.5 mm
cylindrical catalyst particle2.7 × 5 mm
reactor pipe length7.5 m
number of pipes8444
porosity of the fixed bed0.38
Table 2. Process feed gas composition in vol. % of gas utilization scenarios.
BFG DirectBOFG DirectBFG/BOFG 1:1 mixPure CO2
H256.265.861.575.3
CO11.523180
CO210.76.18.124.7
N221.65.112.40
SN2.052.052.052.05
Table 3. Simulation results: reactor inlet gas composition for the pure CO2 scenario at a certain RR.
RR03.27
CO (vol. %)01.680.39
CO2 (vol. %)24.716.84.3
H2 (vol. %)75.381.094.8
N2 (vol. %)000
Methanol (vol. %)00.40.4
SN (-)2.053.519.3
Publisher’s Note: MDPI stays neutral with regard to jurisdictional claims in published maps and institutional affiliations.

