Article

The Effect of Deinking Process on Bioethanol Production from Waste Banknote Paper

1
Department of Wood and Paper Engineering, Sari University of Agricultural Sciences and Natural Resources, Mazandaran Province, Sari 66996-48181, Iran
2
Department of Bio-refinery Engineering, Faculty of New Technologies Engineering, Shahid Beheshti University, P.O. Box 47815-168, Zirab Campus, Mazandaran, Iran
3
Chair of Biosystems Engineering, Institute of Technology, Estonian University of Life Sciences, 51006 Tartu, Estonia
*
Authors to whom correspondence should be addressed.
Processes 2020, 8(12), 1563; https://doi.org/10.3390/pr8121563
Submission received: 23 October 2020 / Revised: 25 November 2020 / Accepted: 26 November 2020 / Published: 27 November 2020
(This article belongs to the Special Issue Sustainable Development of Waste towards Green Growth)

Abstract

:
The aim of this paper is to study the effect of reinking and pretreatment of waste banknote paper on its usability in the bioethanol production process. To this end, the tensile strength of worn banknote paper was first studied at different pH values. The sample with the lowest tensile strength was considered for the next sections. In the deinking process, NaOH at different concentrations (1%, 2%, 3%, and 4%) and in combination with ultrasonic treatment was applied. After deinking the pulp, two acidic and alkaline chemical pretreatments with concentrations of 1%, 2%, 3%, and 4% were used independently and in combination with ultrasonic. Enzymatic hydrolysis, following fermentation with Scheffersomyces stipitis, and crystallinity measurements were used to confirm the efficiency of the pretreatments. RSM Design Expert software was used to determine the optimal values by considering the three variables—enzyme loading, ultrasonic loading, and contact time for waste paper deinked (WPD) and waste paper blank (WPB) pulps. The results indicated that repulping was the most efficient at pH = 2. In deinking, the highest brightness was obtained using 3% NaOH in combination with ultrasonic. Between the acid and alkaline pretreatment, the acid treatment was more appropriate according to the resulting sugar concentration and weight loss. XRD tests confirmed that the lowest crystallinity index was obtained in the sample pretreated with 4% sulfuric acid in combination with ultrasonic. The highest sugar concentration in the enzymatic hydrolysis step was 92 g/L for WPD and 81 g/L for WPB. For the fermentation at 96 h, the highest ethanol concentration and process efficiency achieved were 38 g/L and 80.9% for WPD and 31 g/L and 75.04% for WPB, respectively. Our research shows that the deinking process can widen the utilization potential of waste banknote paper in biorefinery processes.

1. Introduction

Bioindustries, such as pulp and paper industries, have a high potential for the production of value-added products, e.g., heat and power, ethanol and diesel fuels, hydrogen, polymers, and so on [1]. It is estimated that the world’s paper industry produces approximately 500 million tons of paper and cardboard annually [2]. Only a small portion of this paper is recycled, whereas major parts of paper products are buried or burned as waste [3]. The pulp and paper industry accounts for 34% of municipal waste and is the third-largest polluter of air, water, and soil [4].
In general, recycling waste paper is recommended as a priority option for its management, but there are several obstacles, including a sharp decline in the efficiency of the process and quality of the pulp and increasing volumes of effluents and solid chemical wastes [5,6]. However, some types of paper are not reusable due to their properties, such as the presence of ink, severe microbial load, humidity resistance, and other inhibiting factors [7,8]. One such paper is waste banknotes [9]. Every year, thousands of tons of waste banknotes are incinerated worldwide [10,11]. Other countries, e.g., the UK, add waste banknotes to the soil instead of burning them. This, however, creates new problems. Inductively Coupled Plasma (ICP) analysis of banknotes has indicated that banknote paper contains heavy metals. Therefore, burying waste banknotes will lead to the accumulation of these heavy metals and have a negative impact on plants and animals [11].
Banknote paper is a water-resistant paper [12,13]. Usually, formaldehyde melamine resin is used in the production of these papers. The use of this resin makes it difficult to recycle such paper, and special treatments are required for this purpose. Resins such as melamine formaldehyde are slowly hydrolyzed in an acidic environment and at high temperatures [13,14]. Another reason for the recalcitrance of banknote paper is that it is made of cotton fibers with an alpha cellulose content of 88 to 96% and a very high crystallinity level [9]. To reduce the crystallinity of the lignocellulosic biomass, a variety of pretreatment methods have been proposed [15]. Another challenge with banknote paper recycling is the presence of ink in waste paper, which can inhibit many biorefinery processes [16,17]. Soaking paper fibers using sodium hydroxide at high temperatures, followed by sieving and washing, has a clear effect on the separation of separated ink particles, nylon parts, and so on. In general, sodium hydroxide helps the swelling of the fiber and can separate the ink from the fibers through saponification or hydrolysis [18]. The use of high-frequency ultrasonic devices to break small particles of ink has also been used as a mechanical method. In fact, ultrasonic, chemical, and physical methods have been used both separately and in combination for deinking [19]. Researchers have shown different ways to produce ethanol from paper-based recycled materials; however, 1economically viable deinking processes are still under development [20,21].
One solution would be to convert waste banknotes according to the concept of biorefining through which not only higher value-added products can be achieved but also the environmental problems caused by its disposal can be reduced [9,22]. Despite numerous studies in the field of biorefining, including lignocellulosic products, a comprehensive study on the use of waste banknotes as a material with a high percentage of crystalline cellulose, ink, and polymeric resin content has not been performed. In this research, we have studied the effectiveness of deinking waste banknote paper using acid and alkali chemical pretreatments separately and in combination with ultrasonic. Weight loss, brightness improvement, the efficiency of enzymatic hydrolysis and ethanol production, and the crystallinity index were used to characterize the effectiveness of the used treatments and the pretreatment process.

2. Materials and Methods

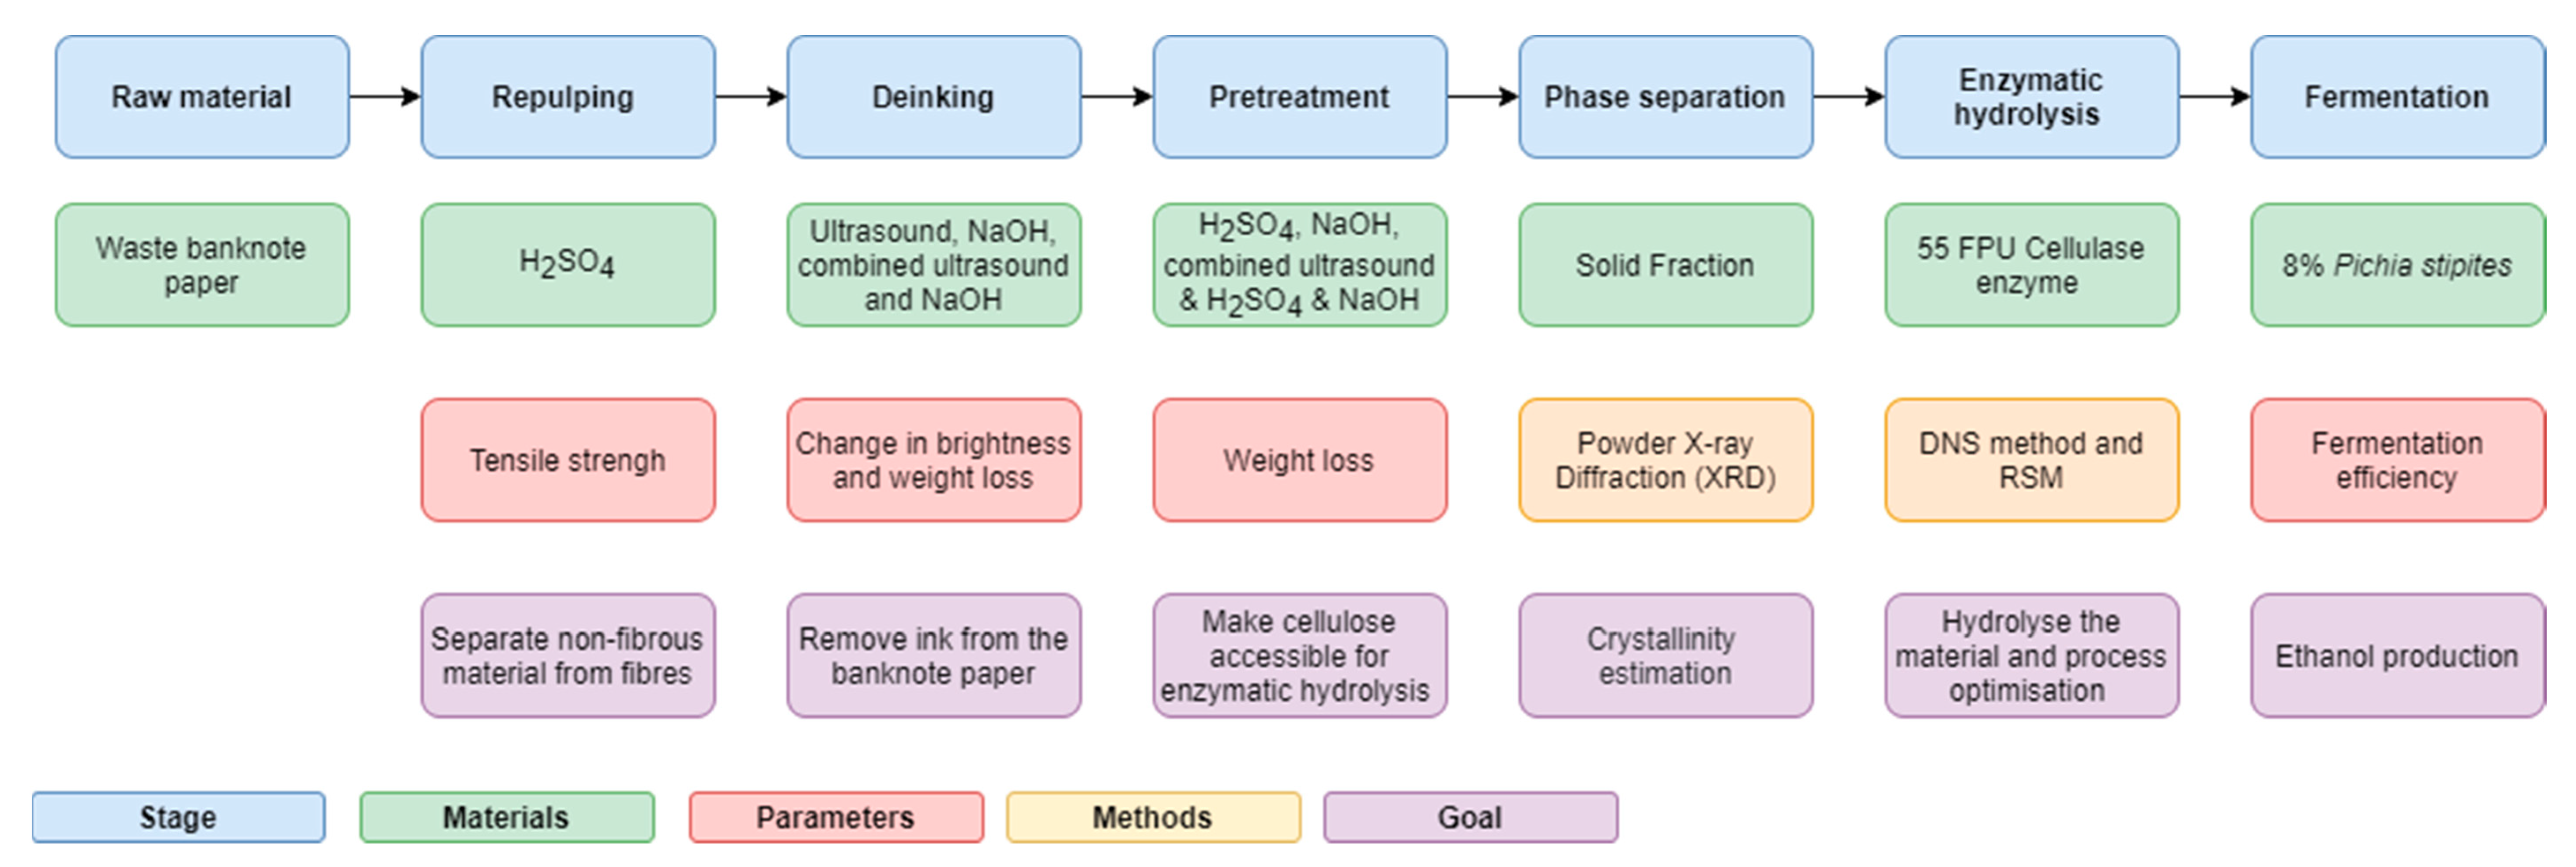
The process flow used in these experiments is illustrated in Figure 1. All experiments were performed at least in triplicate.

2.1. Raw Material

The raw material used in this study was waste banknote paper prepared in the Central Bank of Iran. Melamine formaldehyde is used in banknote paper to increase its mechanical strength and reduce water absorption. Therefore, the process of repulping this type of paper requires breaking the created cross-links in it.

2.2. Repulping

The process of pulping worn banknote paper was performed at different pH values from 1 to 12. The lowest tensile strength was considered as an evaluation index of this section. The tensile strength was measured in a horizontal tensile tester from FRANK-PTI GMBH company (Birkenau, Germany), using the Standard Method TAPPI T494 om-o6. For this, the banknote paper was cut into 2 × 15 cm pieces and inserted into the horizontal tensile tester for measurement. In the repulping process, 30 g of pulp was used, and the process was performed in 500 mL flasks (with a total working volume of 300 mL). After that, 0.5 mL of 98% sulfuric acid was added to the samples, which were further placed at a temperature of 90 °C to 95 °C for an hour and a half [13,23].

2.3. Deinking

In order to deink the used pulp, 3 g (dry weight) of pulp was added into a flask with a total working volume of 100 mL. Three different deinking methods were used: ultrasonic (Am30 loading, 5 min, 20 °C room temperature), chemical (1%, 2%, 3%, and 4% weight of NaOH at 95 °C), and a combination of NaOH and ultrasonic. The ultrasonic equipment used in this study was a Qsonica Sonicator Q700 (Newtown, CT, USA). The samples were stirred in a direct driven stirrer model FTDS 41 from Sci Finetech Co. (Seoul, Korea) at 500 rpm for 90 min. After repulping and deinking, a new paper was made in the new conditions in order to investigate the brightness and weight loss in the new conditions [9,23]. This paper is called handmade paper. The highest brightness and minimum weight loss in the deinking stage were considered as the optimal treatment method. For measuring the brightness, 1.2 g (dry weight) of pulp was inserted into a Zb-a Powders brightness colorimeter testing machine from Hangzhou Zhibang Automation Technology Co. Ltd. (Hangzhou, China).

2.4. Pretreatment

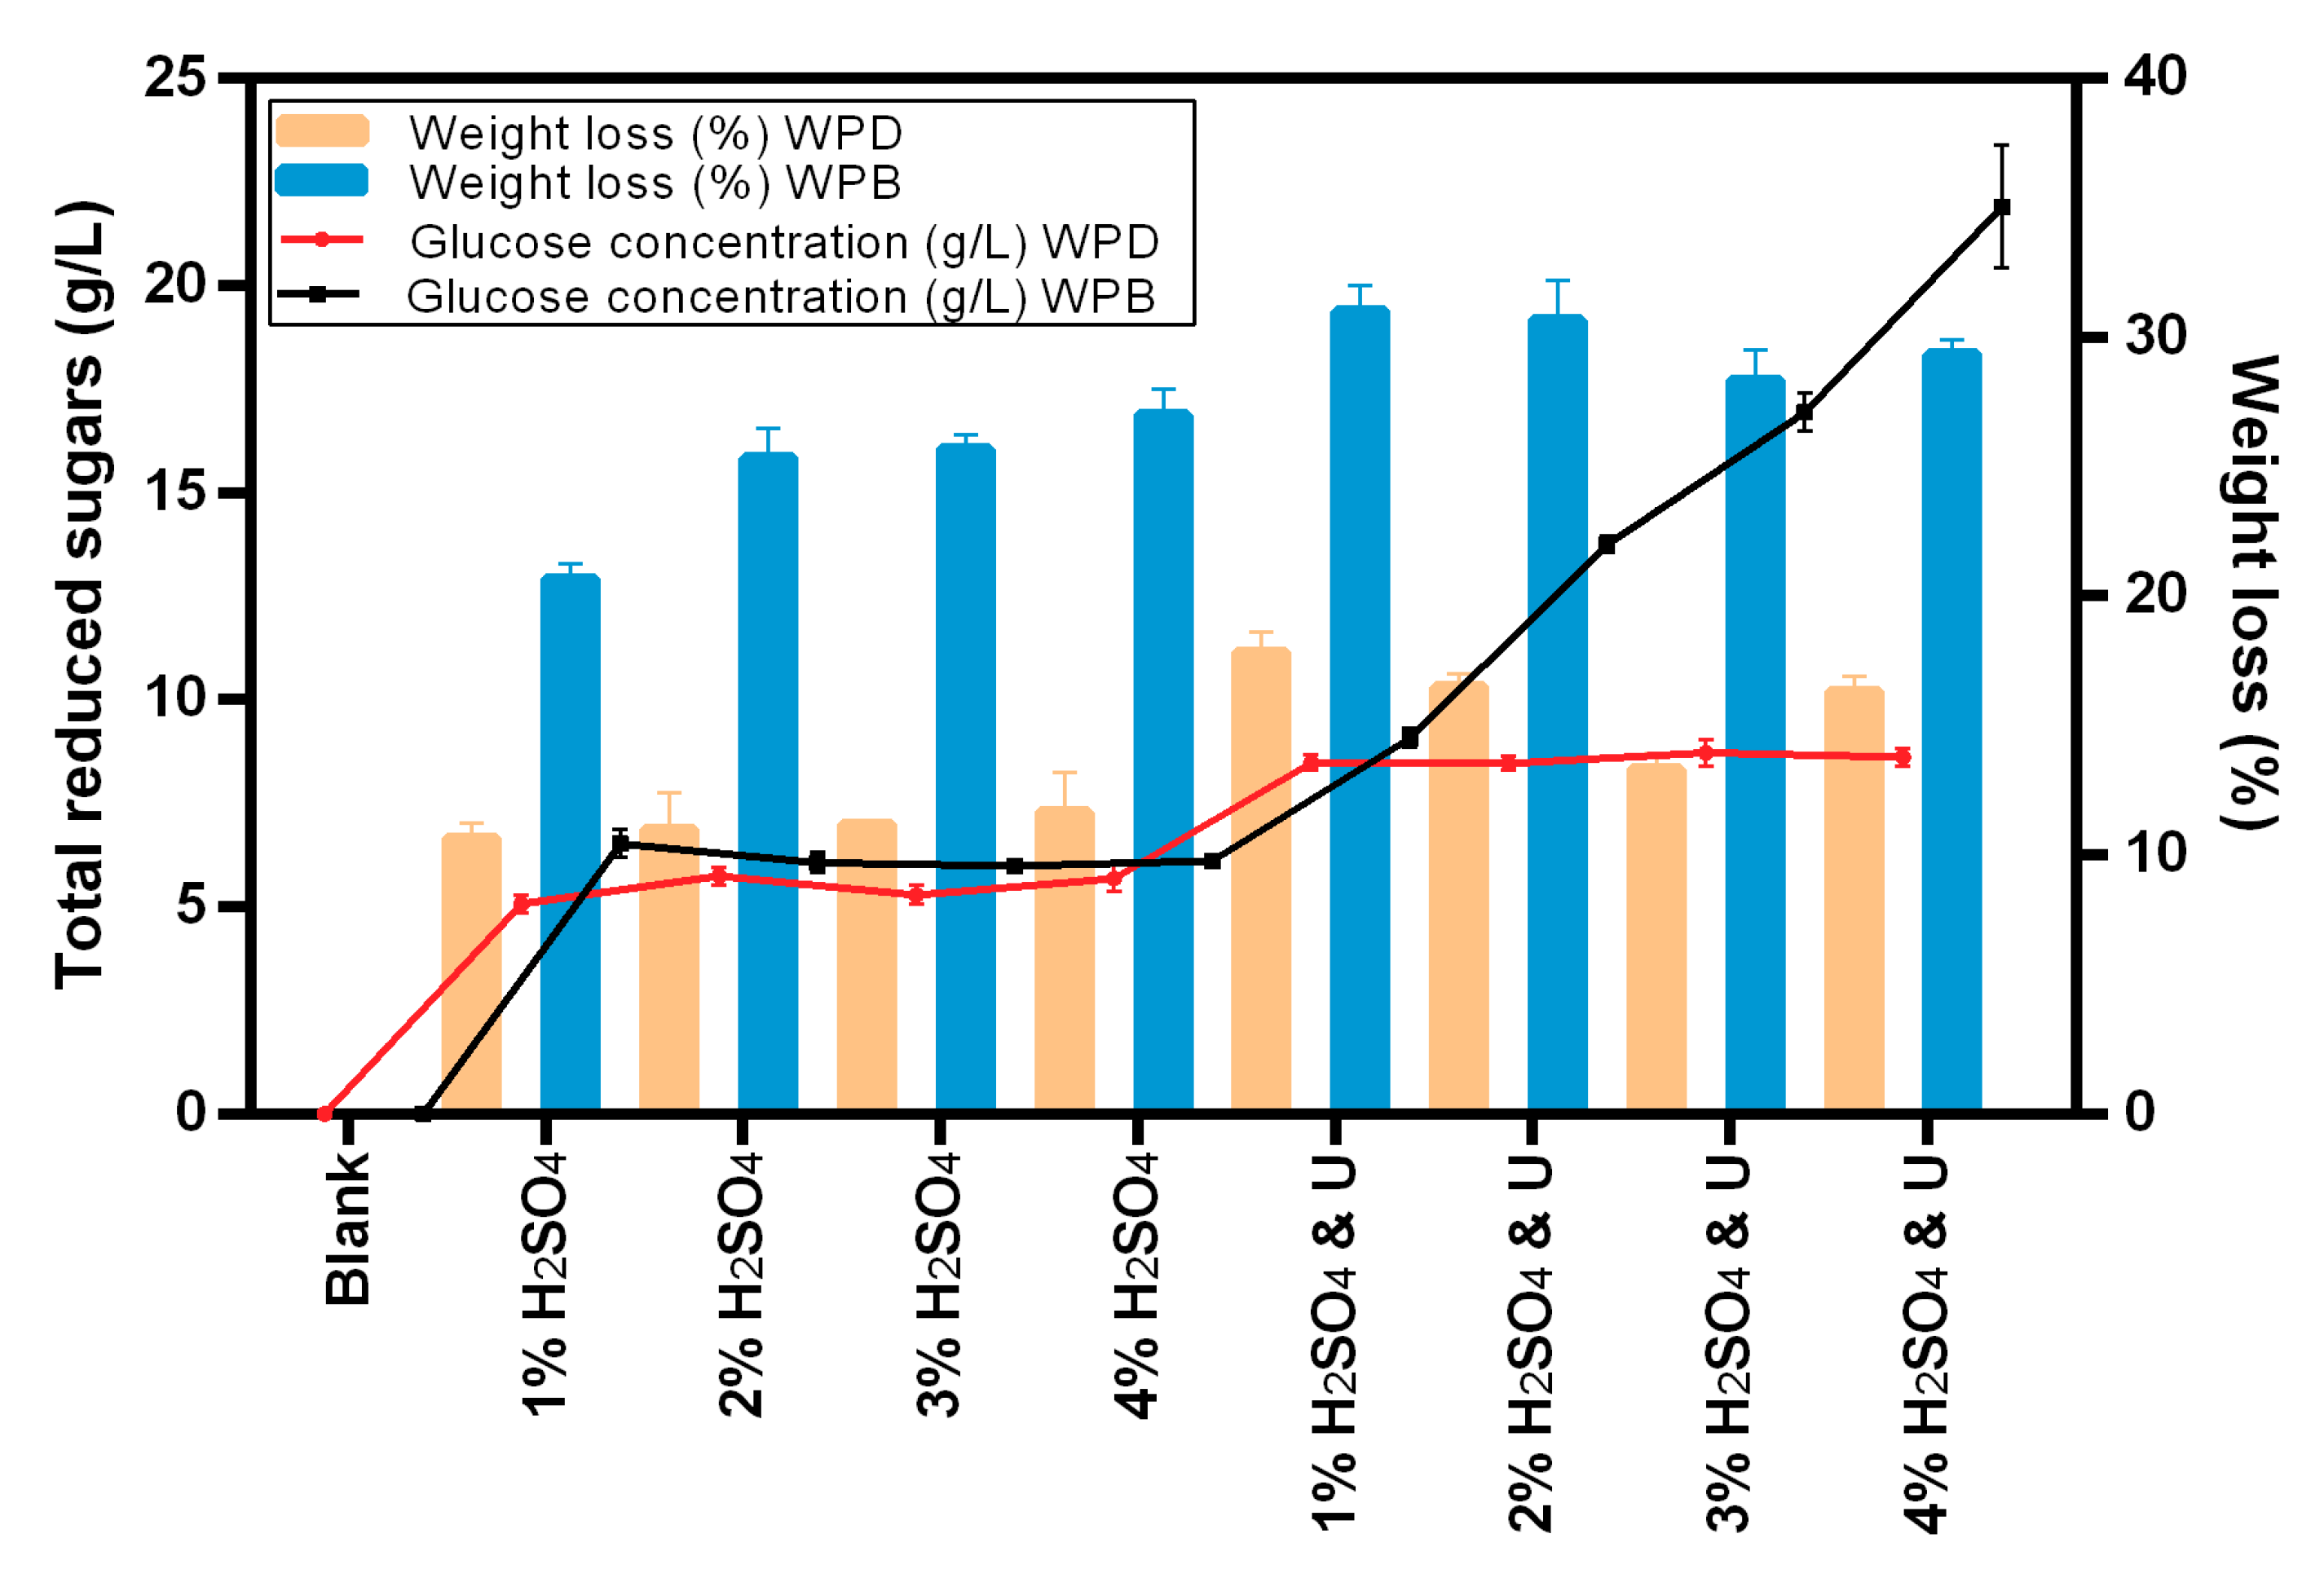
In this study, acid pretreatment with H2SO4, alkaline with NaOH, and a combination of acidic and alkaline treatments with ultrasonic treatment were used. For this, 2 g (dry weight) of both deinked (waste pulp deinked (WPD)) and non-de-inked pulps (waste pulp blank (WPB)) were added to a flask with a total working volume of 100 mL. For the acid pretreatment, 1%, 2%, 3%, and 4% solutions of H2SO4 and NaOH were added to the flask and autoclaved for 30 min at 121 °C. The pulp was exposed to ultrasonic waves with Am50 loading for 5 min, and at the end, after separating the liquid from the fibers, the weight loss percentage was calculated.

2.5. Powder X-ray Diffraction (XRD)

The solid residue from the above pretreatments was further analyzed using an XRD test. This test aims to quantify the crystallinity structure of the waste banknote paper. This test was performed at the Shahid Beheshti University of Tehran using a STOE-STADV model X-ray diffraction device (Darmstadt, Germany). The operating voltage was 40 kV, the current of the device was 40 mA, and the Ɵ 2 amplitude was 10–40 mA. The experiments were performed with an interval of 0.4 s.

2.6. Enzymatic Hydrolysis

In this study, industrial enzyme cellulase manufactured by Novozyme Company in Denmark was used (55 FPU/mL). Enzyme activity was measured according to the IUPAC standard filter paper assay (FPA) [
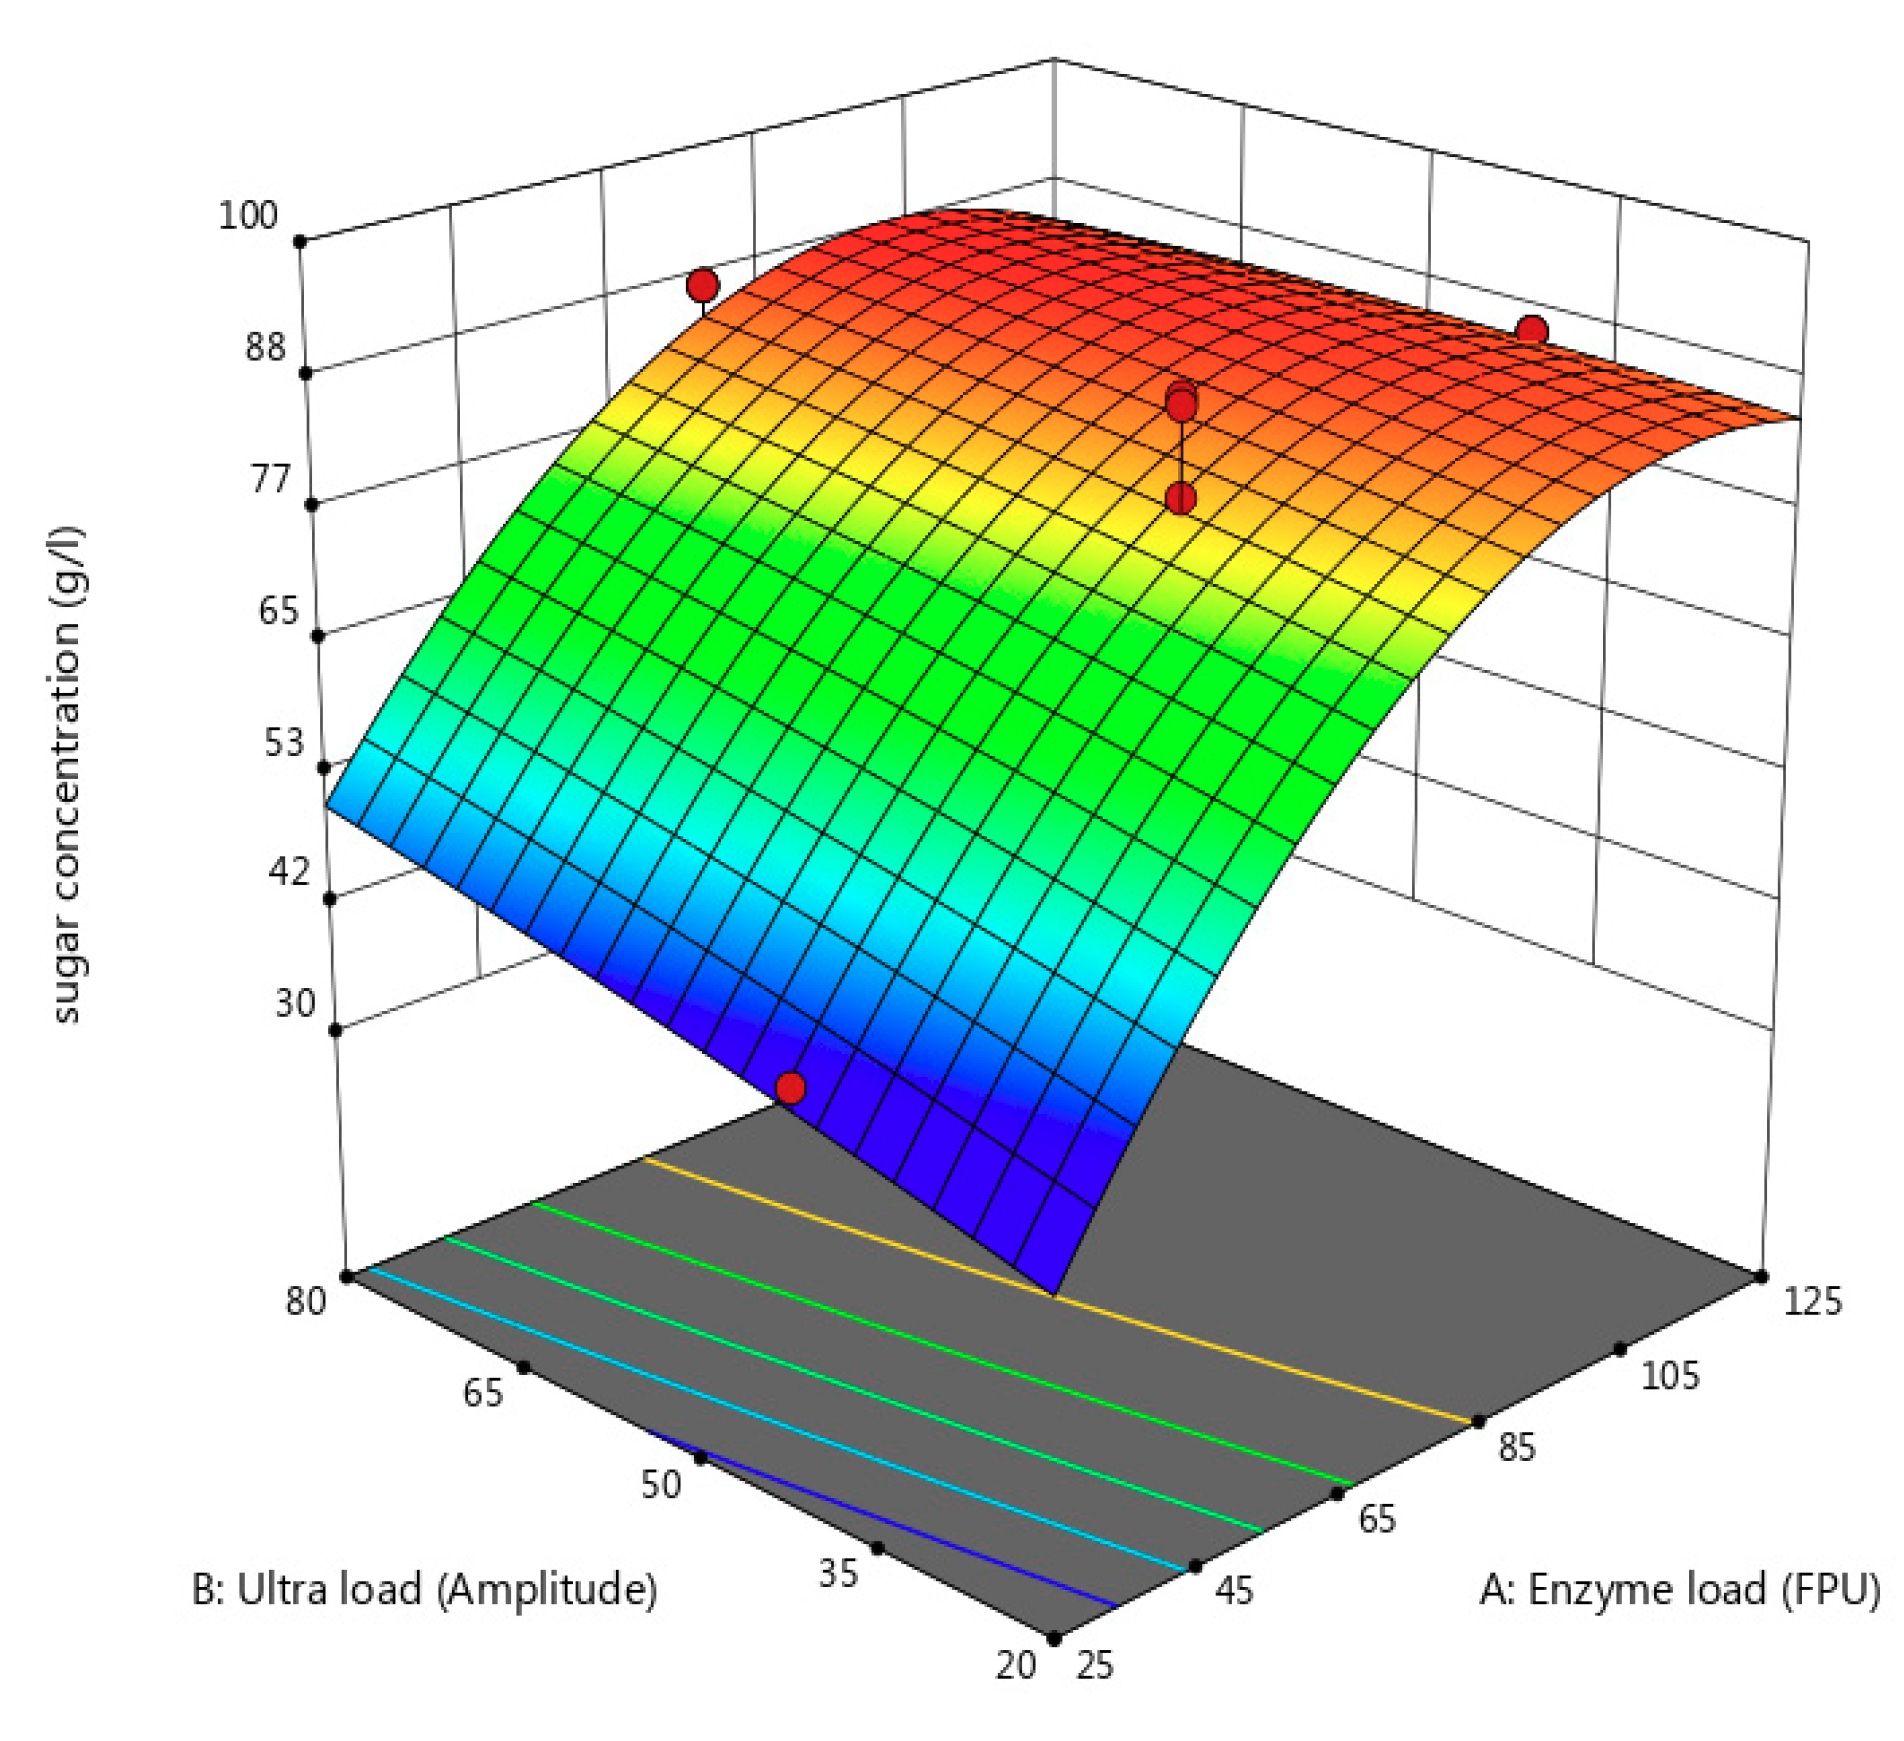
24]. Five grams of pretreated material was added into a flask with a total working volume of 100 mL. Five different enzyme loads were added to the flask (25, 50, 75, 100, and 125 FPU/mL) in order to find the optimum enzyme load. Enzymatic hydrolysis was performed at pH = 4.8 and a temperature of 50 °C at 150 rpm for 24, 48, 72, 96, 120 h under different ultrasonic loadings (Am 0, 20, 40, 60, 80). The DNS method was used to determine the amount of reduced sugars in the samples from the liquid fraction [25].

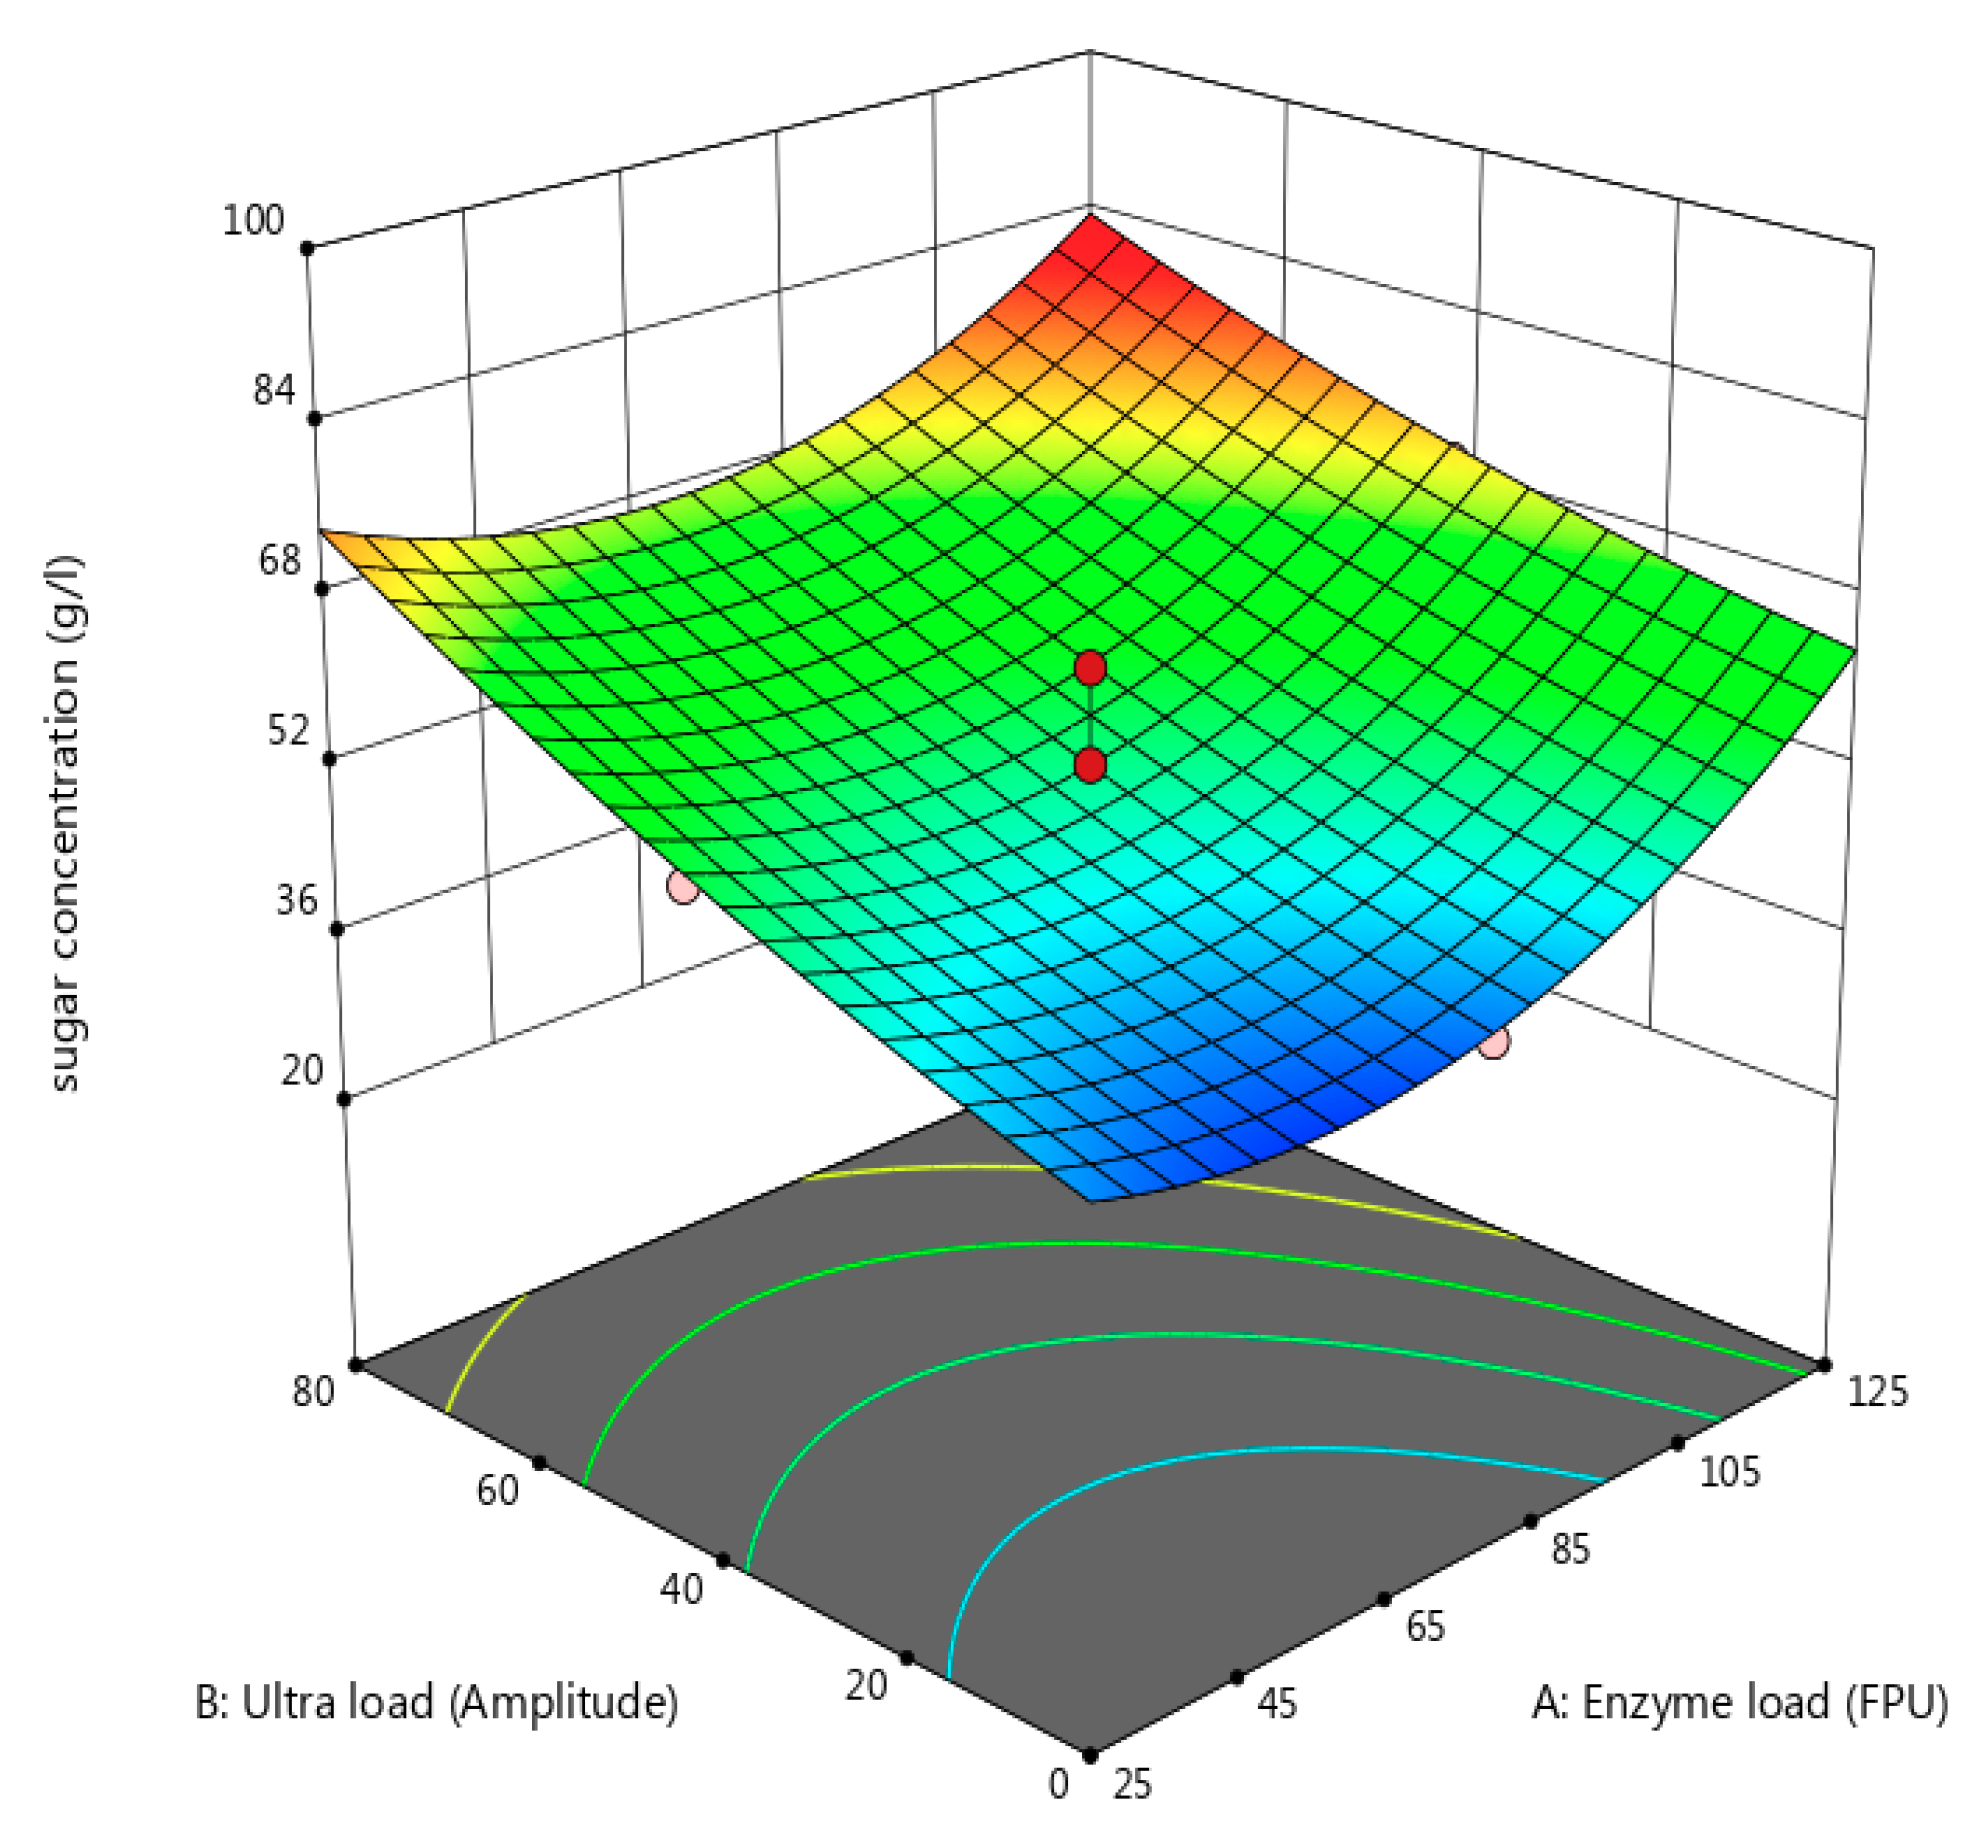
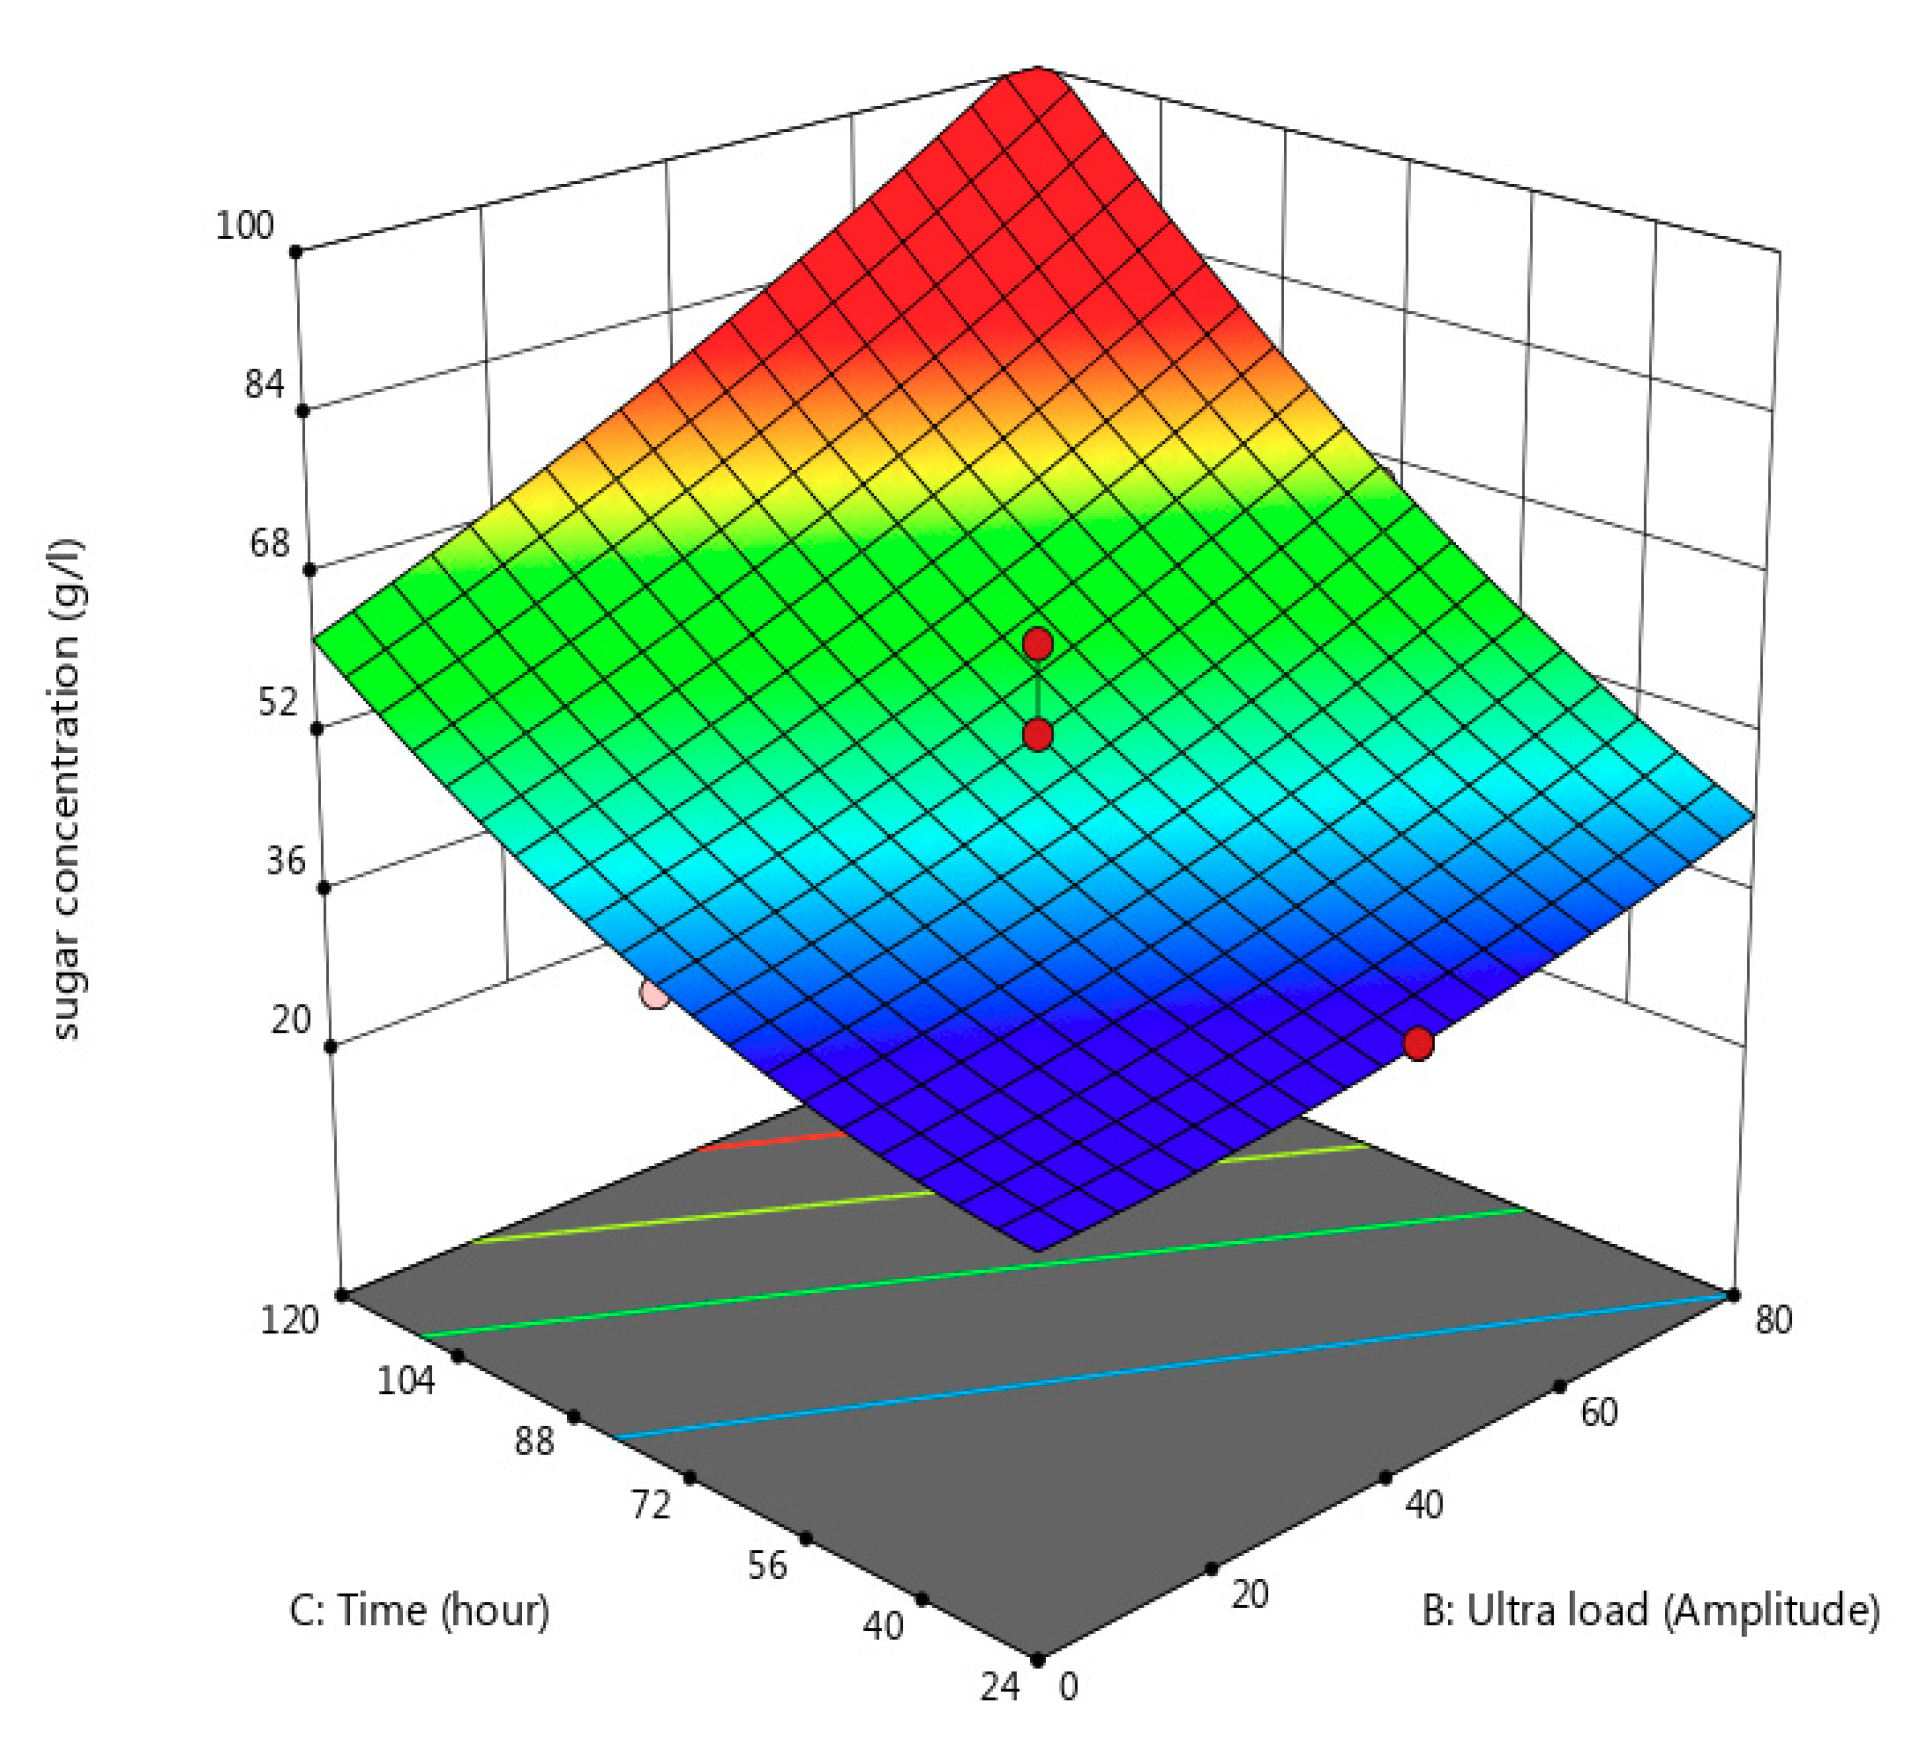
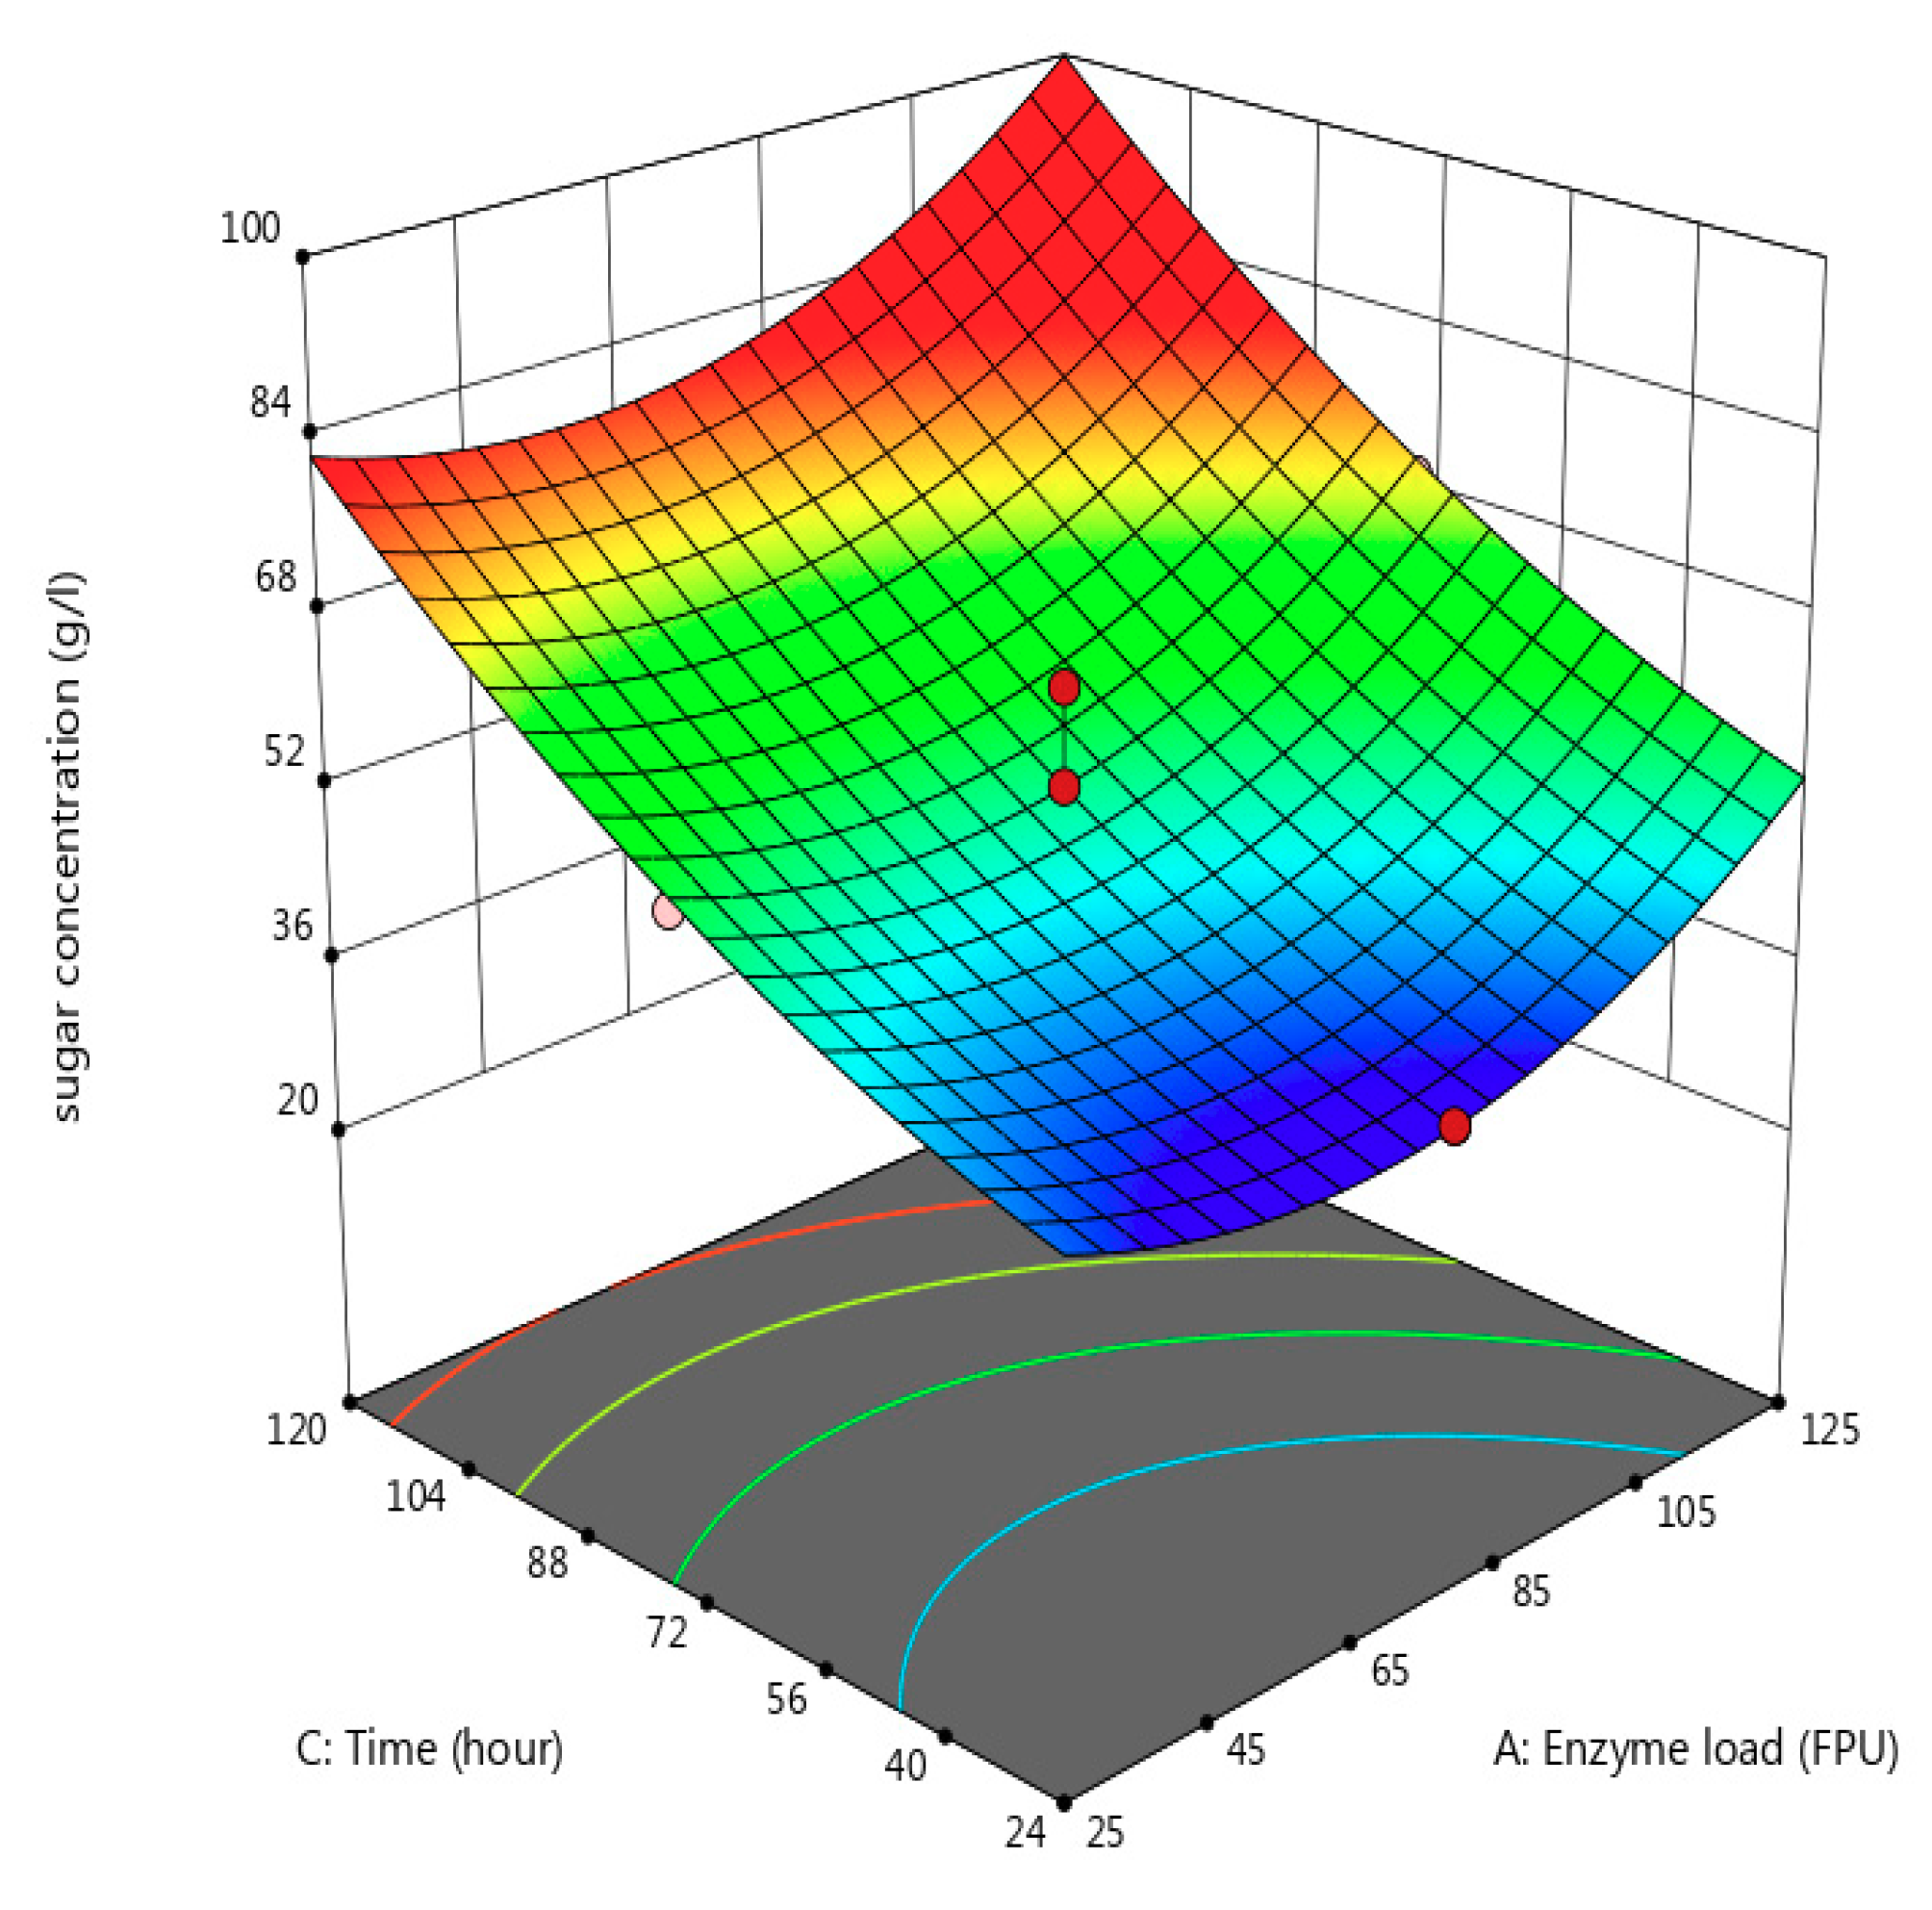
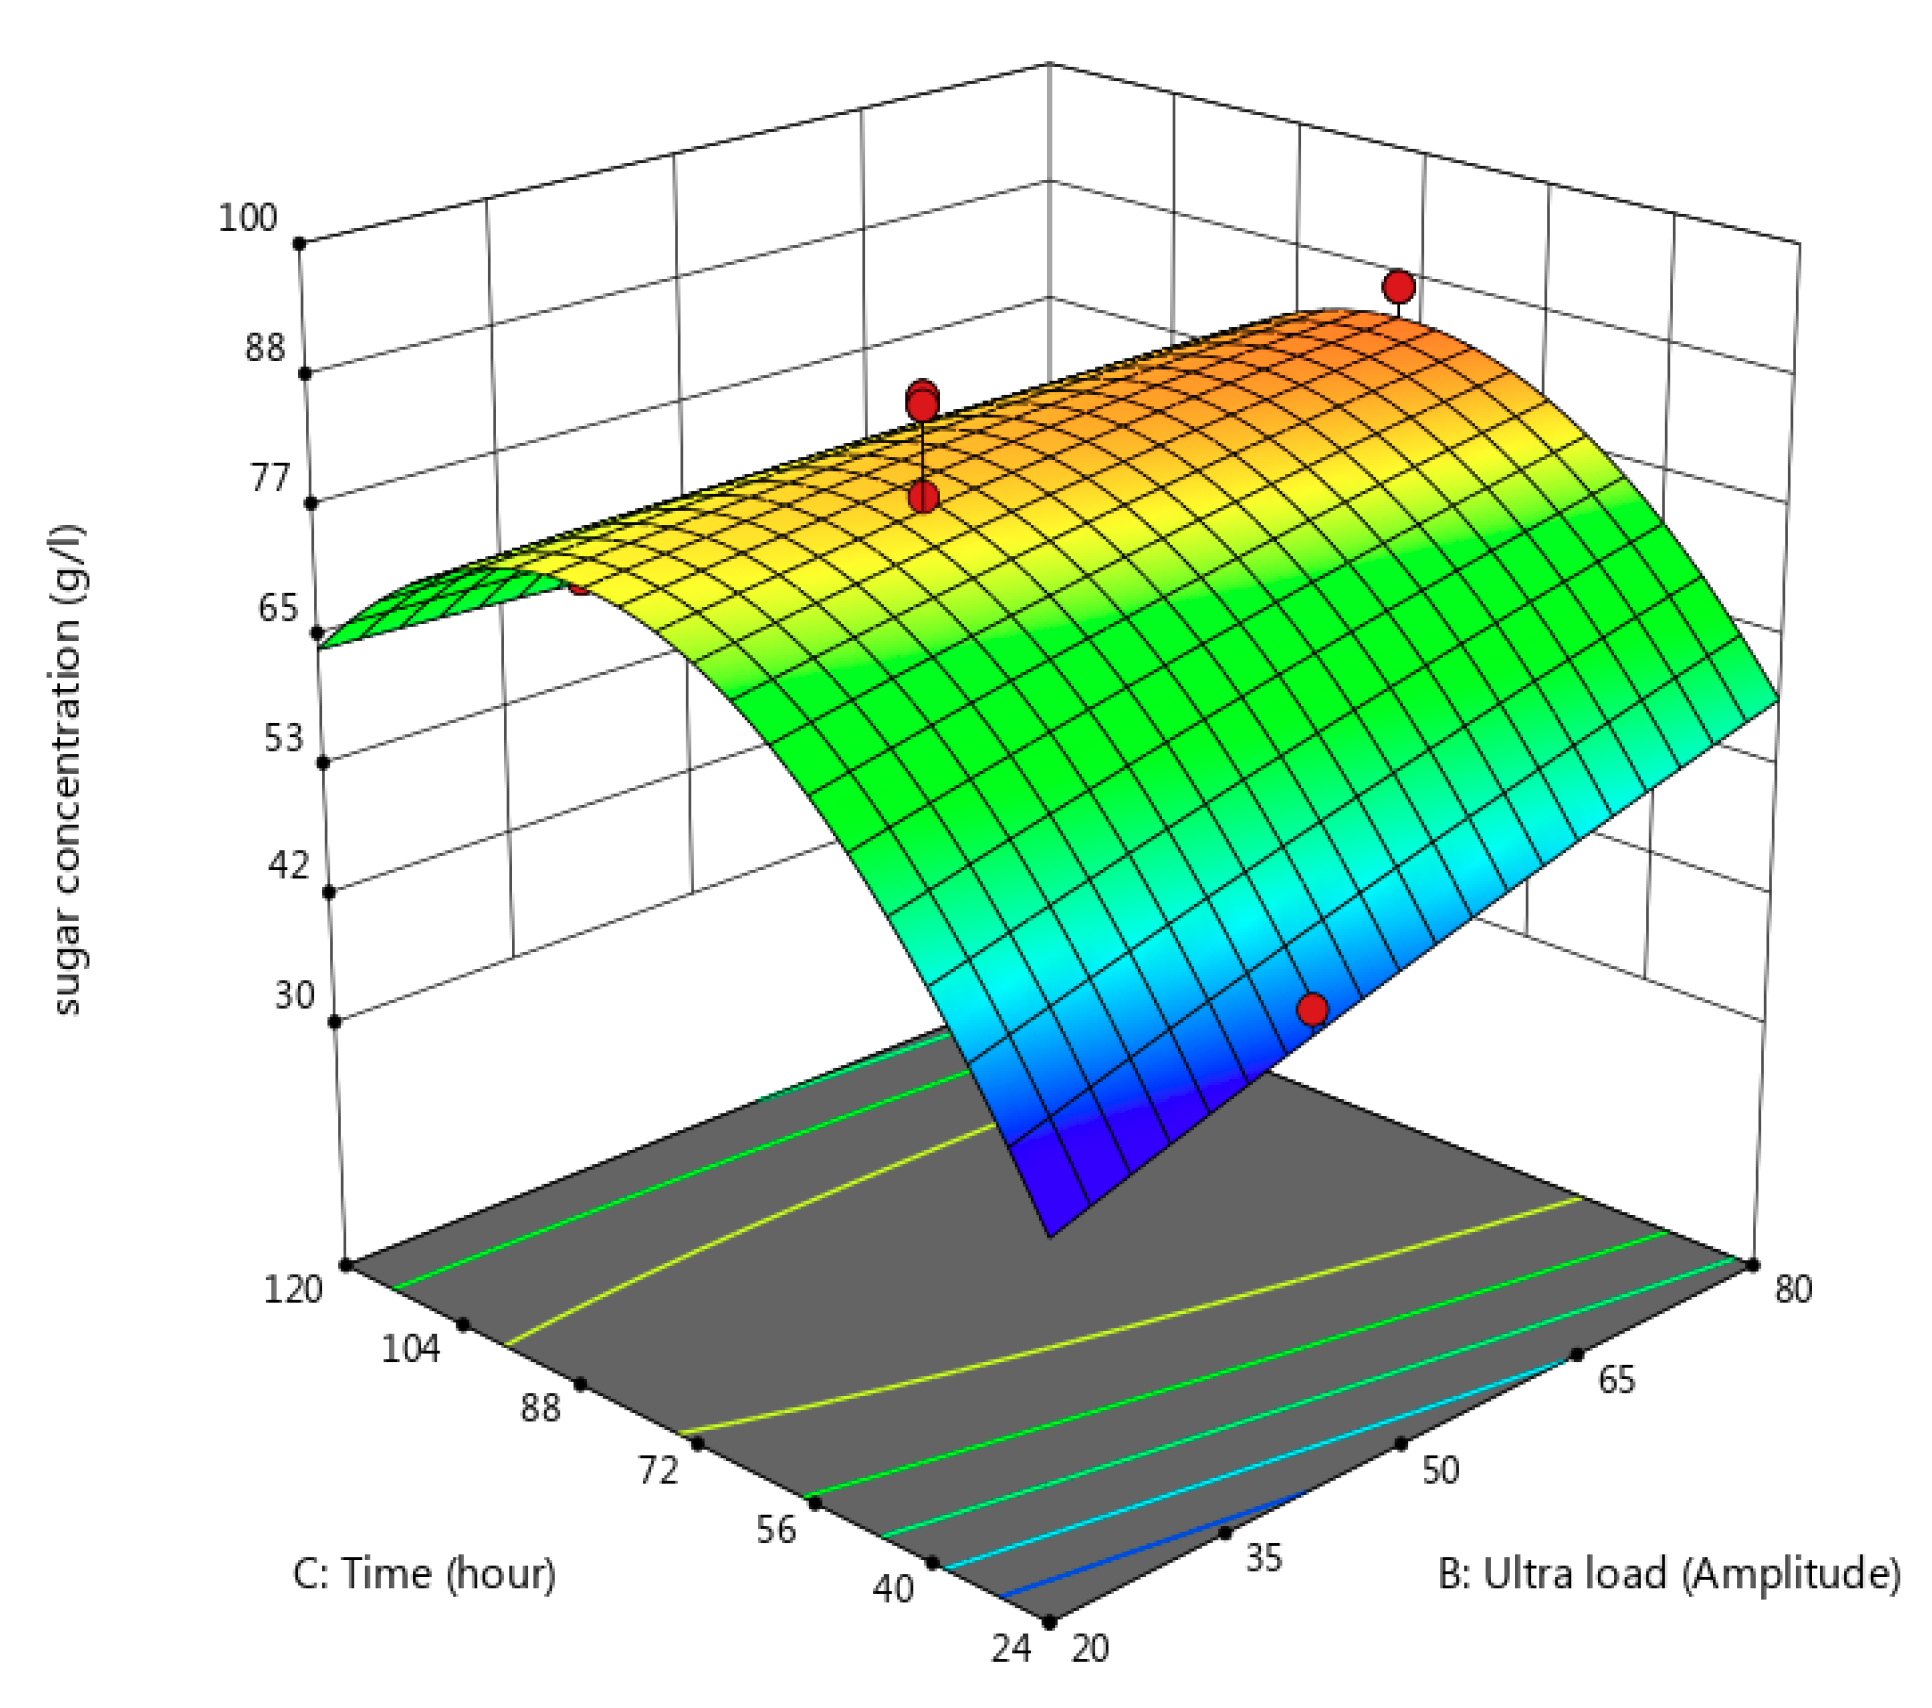
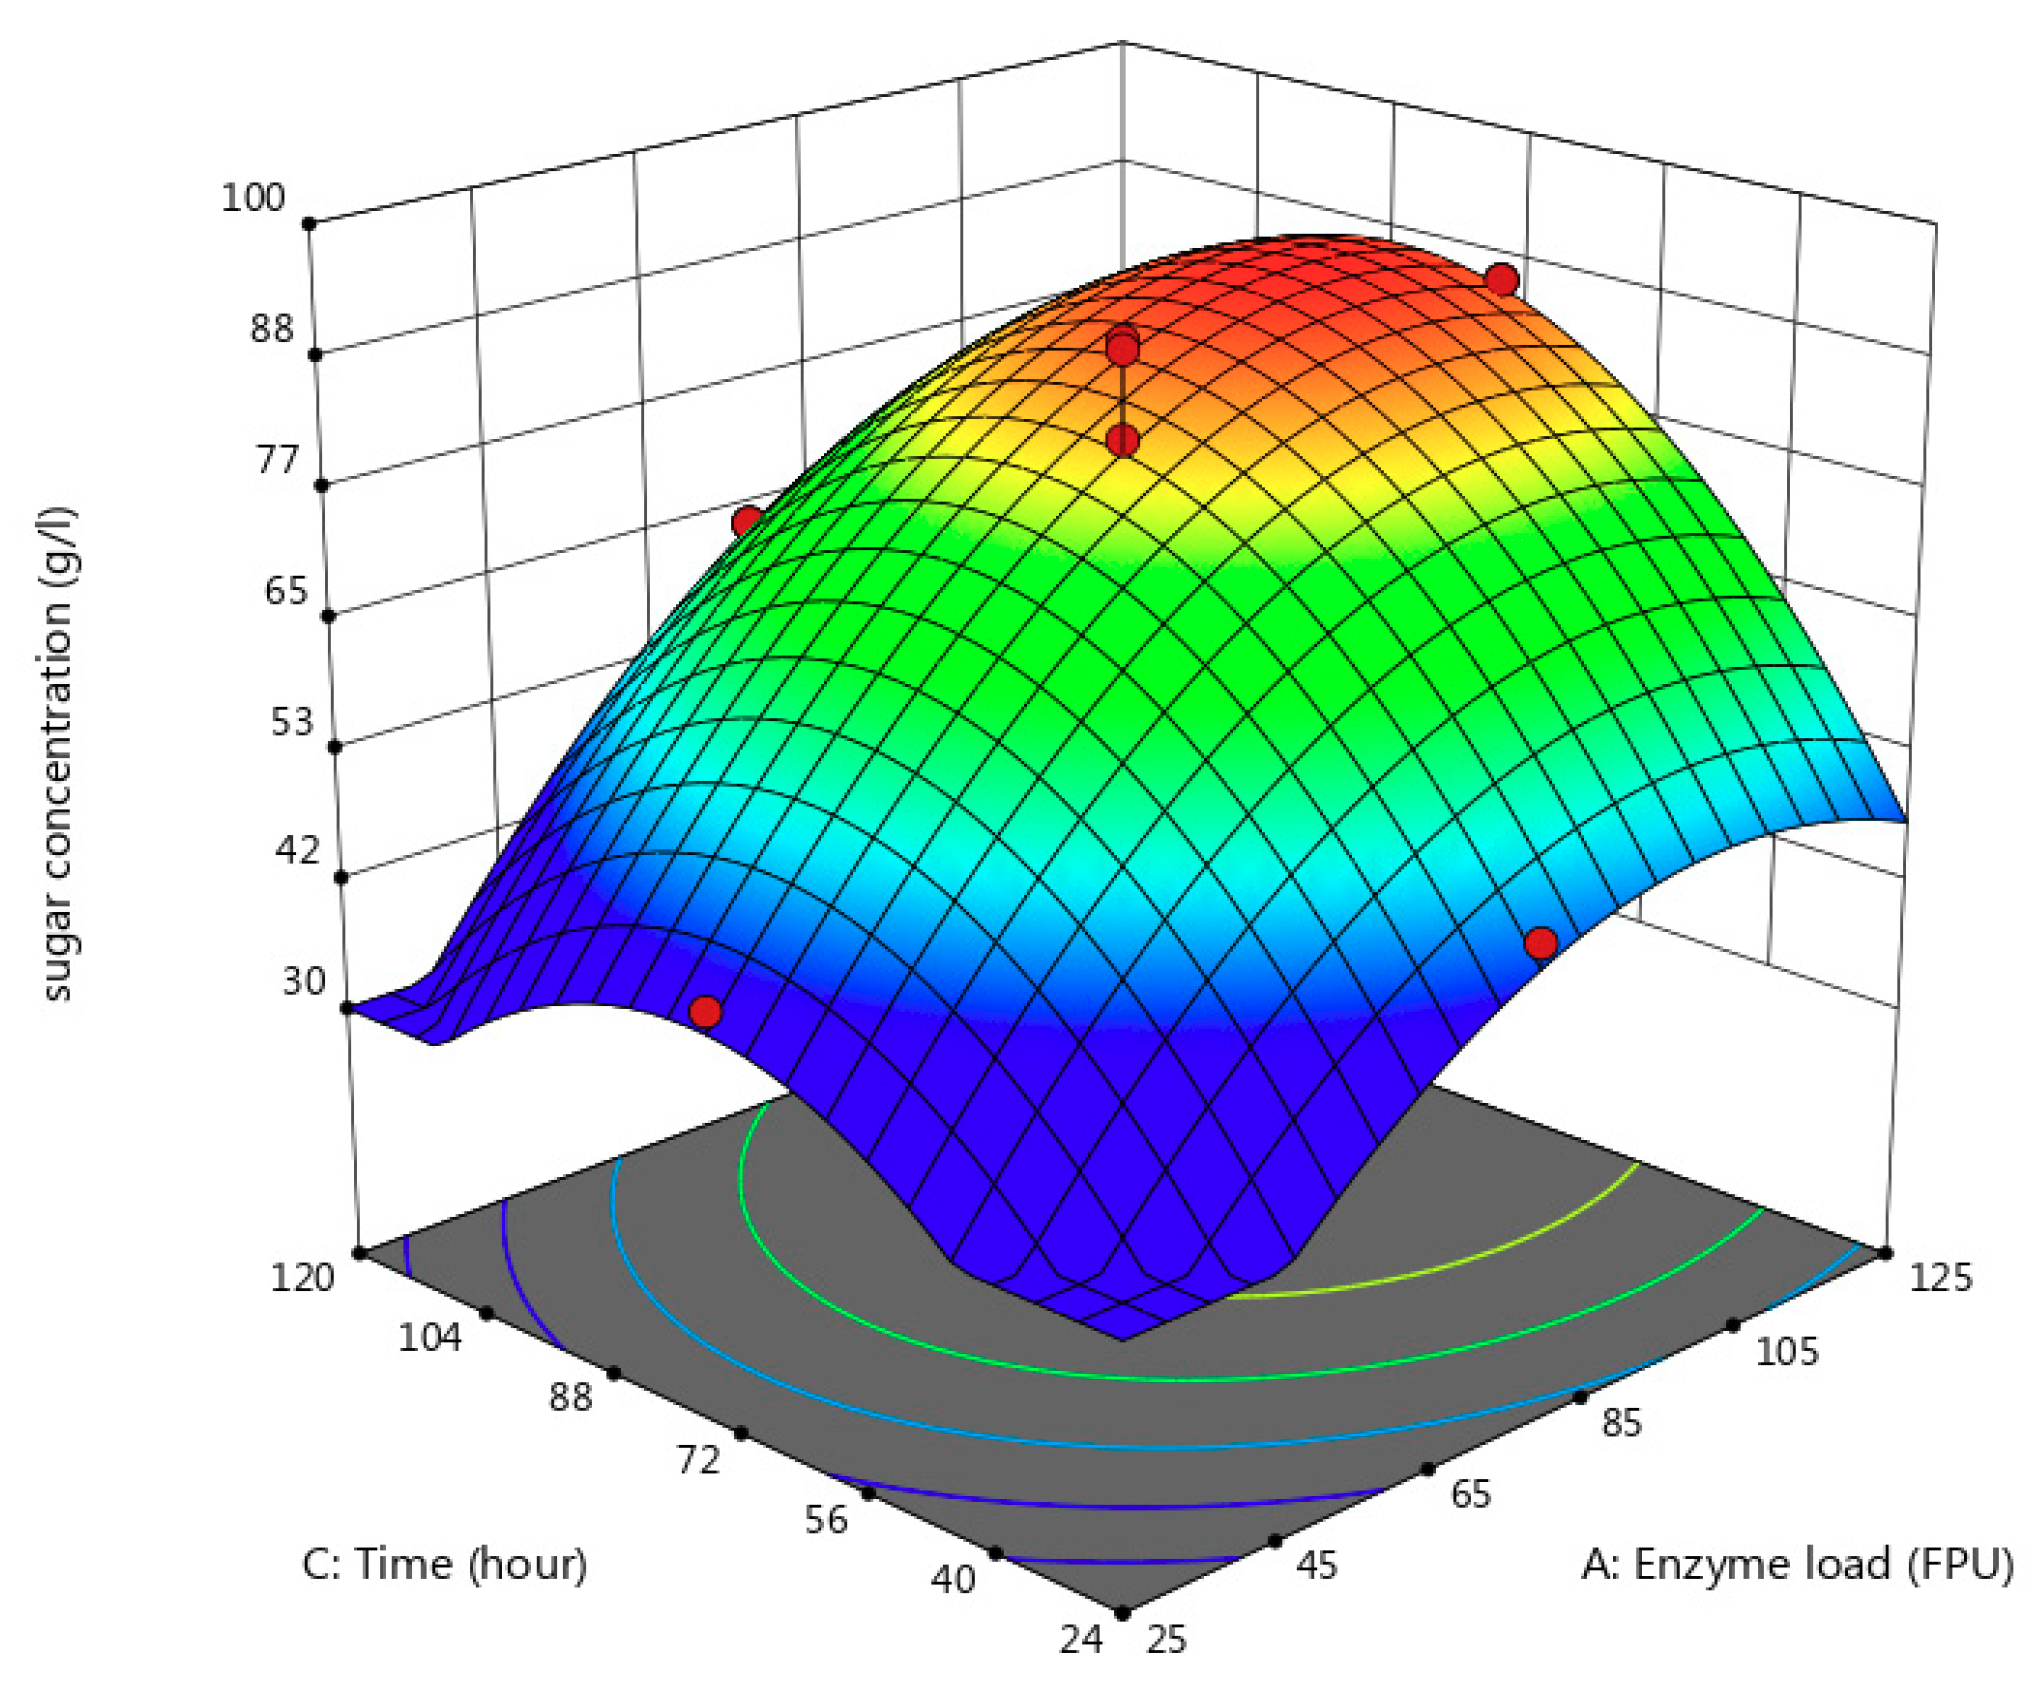
2.7. Response Surface Methodology (RSM)

The RSM Design Expert 12 software was used to investigate the interaction between: FPU/mL rate (x1), ultrasonic load (x2), and saccharification time (x3). The software enabled calculating the optimal amount of enzyme, ultrasonic load, and enzymatic hydrolysis time. In the case of enzyme load, five different loadings were used (25, 50, 75, 100, and 125 FPU/mL). In the case of the ultrasonic loading, five different amplitudes 0, 20, 40, 60, and 80) and periods of time (24, 48, 72, 96, and 120 h) were used. A quadratic model was used as a process order, and the results were statically analyzed using the analysis of variance (ANOVA).

2.8. Fermentation

The yeast used in this study was Scheffersomyces stipitis (commonly known as Pichia stipitis) (strain PTCC 5296), obtained and prepared in the Iran Scientific and Industrial Research Center (Tehran, Iran). The activation of microorganisms was performed in a culture medium containing 10 g/L glucose, 5 g/L peptone, 3 g/L malt extract, and 3 g/L yeast extract. The microorganisms were cultured for 30 h at 30 °C, and a growth curve was plotted. In this study, hydrolyzed WPD and WPB samples were fermented under the same conditions: at 8% (v/v) yeast loading, 46 mL of substrate, in a 50 mL total working volume, and a temperature of 32 °C for 24, 48, 72, 96, and 120 h.

2.9. Calculations

The efficiency of the fermentation process was calculated based on Equation (1):
E F C eth C glc · 0.51 · 100
where Cglc is the concentration of glucose in the sample, Ceth is the ethanol concentration in the sample, and 0.51 is the glucose to ethanol conversion factor calculated based on the chemical balance of the fermentation process [26].
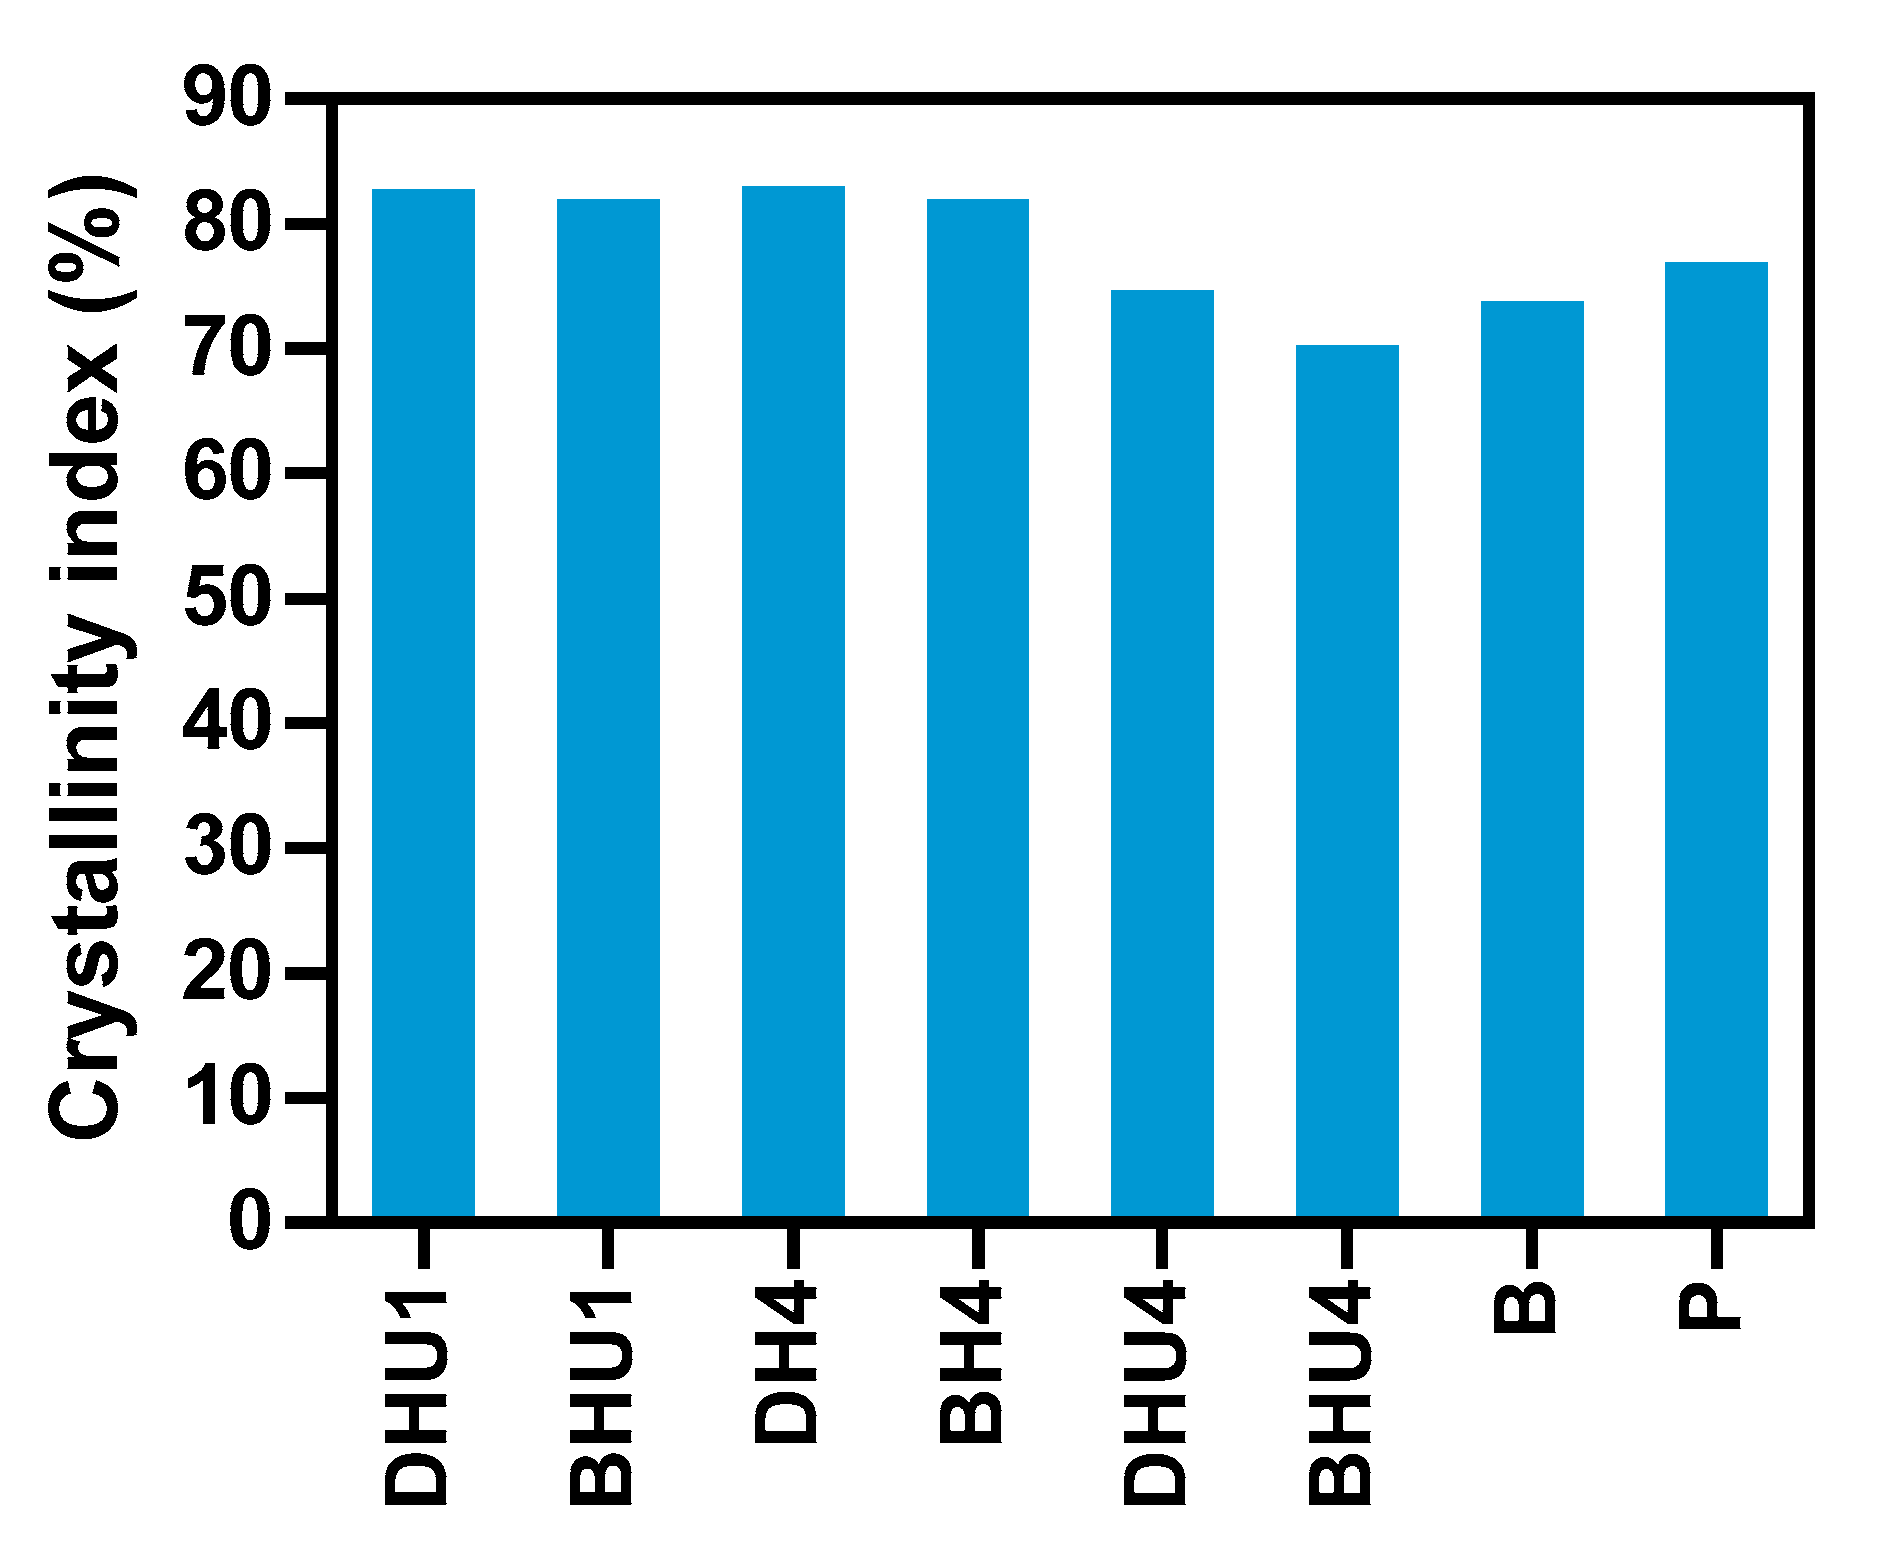
The biomass crystallization index (CrI) is defined as the percentage of crystalline matter present in the amorphous range in the biomass. This index was calculated according to the following Equation:
CrI ( % ) = ( I 002 I am I 002 ) · 100
where CrI is the crystallinity index, I002 is the maximum intensity of return peak at an angle of 2θ = 22.53°, and Iam is the intensity of the returning ray at an angle of 2θ = 18.48°.

3. Results and Discussion

3.1. Pulp Making

Determining the Optimal Conditions for Pulp Making

Table 1 shows the effect of pH on tensile strength in the pulping process of waste banknote paper. As can be seen from the table, the lowest tensile strength in wet conditions (TS = 29 N/m) was reported at pH = 2, and in acidic conditions. The highest tensile strength in wet conditions (TS = 39 N/m) was reported at neutral pH (6–7). The tensile strength in dry conditions was constant (TS = 85 N/m) for all pH values. The wet-to-dry tensile strength ratio varied between 34% (for pH = 2) and 45% (for pH = 6–7). The results obtained in this study are consistent with other related articles in this field [27].
As banknote paper is durable and resistant even under wet conditions due to its composition, the tensile strength becomes a major parameter to be considered in the pulp making process. Research has shown that lower levels of tensile strength are the most suitable conditions for this process. Thus, our results show that preferable conditions for pulp making in the case of banknote paper are highly acidic or alkaline conditions.

3.2. Deinking

In Table 2 the effect of different deinking treatment methods on brightness and weight loss of samples is presented. As it can be seen from Table 2, blank samples exhibit the lowest brightness (B = 51.75), samples that were treated with ultrasonic only have brightness of B = 56, and the brightness of samples that were treated with alkali varied between B = 61 and B = 65. Samples that were treated with combined alkali and ultrasonic treatment have brightness between B = 63 and B = 68. For samples that were treated with ultrasonic, the brightness improvement was 7.58%. For samples that were treated with alkali, the brightness improvement varied between 15.16 % and 20.38%. For samples that were treated with combined alkali and ultrasonic, the brightness improvement was between 17.85% and 23.89%. The weight loss for samples that were treated with ultrasonic was 5%. For samples that were treated with alkaline, the weight loss varied between 6.25% and 16.3%, and for those treated with combined alkali and ultrasonic, the weight loss was between 11.8% and 23.5%. The results of this study show that combined alkali and ultrasonic treatment method was the most effective in improving brightness of the samples after the deinking process. This is in line with the previous work by Giakoumakis et al [7] and Meng et al. [8], who have demonstrated the effectiveness of using ultrasonic in combination with chemical treatment, since ultrasonic is effective for removal of thermoplastic polymers while acids/alkali are effective in removing the ink.
The optimum treatment method used throughout the manuscript was selected based on the percentage of weight loss and on the percentage of brightness improvement obtained from Table 2. The sample that had the smallest percentage of weight loss and the highest percentage of brightness improvement was NaOH 3% Ultra. Therefore, this treatment method was selected as the optimal and all the following experiments were performed using this method.

3.3. Pretreatment

3.3.1. Acid

The effect of acid pretreatment on weight loss and total reduced sugars is illustrated in Figure 2. As can be seen from the figure, for samples pretreated with H2SO4, the weight loss for deinked materials varied between 10.67% and 11.67%, while for samples pretreated with combined H2SO4 and ultrasonic, it varied between 13.33% and 17.83%. The weight loss of these samples was 13% to 15% lower than the control samples. The reduced sugar concentration was lower for samples pretreated with H2SO4 (between 5.07 g/L and 5.74 g/L) and higher for samples pretreated with combined H2SO4 and ultrasonic (between 8.46 g/L and 8.72 g/L). The glucose concentration of deinked samples was 0% to 13% lower than the control samples. The results show that for samples pretreated with H2SO4, the weight loss increased with the increment of acid concentration. Statistically significant differences were found between the glucose concentration of deinked material and the weight loss of control samples (p < 0.0001). A correlation was found between glucose concentration and weight loss (r = 0.800, p < 0.01).

3.3.2. Alkaline Pretreatment

In Figure 3, the effect of alkaline pretreatment on weight loss and total reduced sugars is presented. As can be seen from the figure, samples pretreated with NaOH had a weight loss (between 2.5% and 4.5%) inferior to those pretreated with combined NaOH and ultrasonic (between 6% and 7.3%). The weight loss of the control samples pretreated with NaOH varied between 8.2% and 13.5%, whereas the weight loss of samples pretreated with combined NaOH and ultrasonic varied between 15.85 and 18.5%. Overall, the weight loss of the WPB samples was 6% to 11% higher than the WPD material. The glucose concentration for the deinked material pretreated with NaOH varied between 1.5% and 2.5%, whereas for the material pretreated with NaOH combined with ultrasonic, it varied between 4.3% and 4.7%. The glucose concentration of the WPB samples was up to 4% higher than the glucose concentration of the deinked material. As evident from Figure 3, samples pretreated with NaOH combined with ultrasonic had a higher weight loss than samples pretreated with NaOH alone. Statistically significant differences were found between the weight loss of control samples and the glucose concentration of deinked material (p < 0.0002). A correlation was found between the weight loss and the glucose concentration (r = 0.996, p < 0.00001).
Overall, these results reveal that the pretreatment methods are effective in decreasing the cellulose crystallinity and releasing soluble components, such as sugars that will be further utilized in the enzymatic hydrolysis. These structural changes can be evaluated by the weight loss since it is a ratio between the biomass obtained after drying and the biomass used for pretreatment. A high weight loss indicates that the pretreatment method was effective in reducing the crystallinity, which will increase the amount of cellulose accessible for the enzymatic hydrolysis. High amounts of cellulose will lead to high glucose and ethanol yields [28,29].
In alkaline environments, glycosidic bonds along the cellulose chain, and often hemicelluloses, are broken down by the gradual degradation mechanism, destroyed by the terminal group leaving and decomposed into its constituent sugars [30]. Under acidic conditions, cellulose is broken down randomly and regularly from different regions. Because of this, the breakdown of glycosidic bonds by alkaline is extremely slow in comparison with acid hydrolysis [31]. Therefore, the acid pretreatment methods are more effective for lignocellulosic biomass. Alkali pretreatment is comparatively suitable for lignin breakdown. The basic principles of alkali hydrolysis are based on solvation and saponification, which induce depolymerization and the cleavage of lignin–carbohydrate linkages, accordingly rendering the uneasily biodegradable substances more accessible to the extracellular enzyme. Due to the fact that cotton does not contain lignin as a raw material for making banknotes, acid pretreatment has been shown to be more effective [32]. In this regard, Mahalakshmi et al. [33] subjected these materials to acidic and alkaline pretreatments in order to obtain sugars from cotton waste. Following pretreatment, the cotton waste was enzymatically hydrolyzed by an enzyme produced by Trichoderma fungi. The results showed that acid pretreatment improved enzyme accessibility and released more sugars compared to alkaline pretreatment. The amount of released sugars increased with the increasing concentration of acid (110 mg/mL) or alkaline (70 mg/mL). In this study, the amount of sugars released during hydrolysis and the consequent weight loss show higher the efficiency of acid pretreatment than alkaline pretreatment [33]. In the present study, using 4% sulfuric acid alone (DH4) and in combination with ultrasonic (DHU4) on WPD and WPB samples and 1% sulfuric acid in combination with ultrasonic on WPD and WPB samples resulted in the highest amount of sugar and weight loss. Therefore, these treatments were evaluated with a control treatment (non-de-inked and untreated sample) for XRD testing to investigate the crystallinity index.

3.4. XRD Test

Figure 4 shows the effect of acid pretreatment on the crystallinity index. As it can be seen from the figure, the crystallinity is lower for control samples and samples that were pretreated with sulfuric acid (4%) combined with ultrasonic, and higher for samples that were pretreated with sulfuric acid (4%) alone and samples that were pretreated with sulphuric acid (1%) combined with ultrasonic.
Unlike starch and hemicellulose, cellulose has a crystalline structure. It is believed that its crystallization plays an important role in its biological degradation. Decreasing the amount of crystallinity means reducing the number of areas impermeable for enzymes, which is considered a positive factor from this perspective [34]. The crystallinity of pure cotton natural fiber is relatively high but contains little lignin or hemicellulose; therefore, the main goal of any possible pretreatment of cotton should be based on increasing the surface area and decreasing the crystalline regions with the aim of creating easier access to the enzyme [35]. To achieve this goal, the hydrogen bonds between glucans in the crystalline cellulose chain must be effectively disrupted to change its structure to amorphous. In this regard, Zhang et al. [36] pretreated waste cotton with acid to produce biofuels. The results indicated that the crystalline regions in the acidic solution changed to amorphous regions with the destruction of hydrogen bonds and resulted in higher efficiency at the enzymatic hydrolysis stage. Chandrashekhar et al. [37] used different concentrations (2%, 3%, and 5%) of sulfuric acid to pretreat raw cotton waste material to produce biofuels. The results of that study showed that 5% acid pretreatment along with high temperature produced more sugar in the enzymatic hydrolysis stage because of further reduction of crystalline regions and, ultimately, led to the production of more bioethanol by using the yeast Saccharomyces cerevisiae.

3.5. Enzymatic Hydrolysis of WPB

In Table 3, the total reduced sugars (TRS) for WPB samples are presented. The lowest amount of TRS was 35.9 g/L, obtained using an enzyme load of 75 FPU/mL, 40 amplitude, and a hydrolysis duration of 24 h. On the other hand, the highest TRS was 80.9 g/L, obtained using 100 FPU/mL of enzyme, an amplitude of 60, and a hydrolysis duration of 96 h.
From the ANOVA results in Table A1, it can be seen that the p-value, which determines the statistical significance of the model obtained from the RSM, is p < 0.0001, indicating that this model is more than 95% reliable. The F-value also shows the number 17.27, which indicates the significance of the pattern. In addition, the strength of this model can be realized from the values of the convergence coefficient R2, which is equal to 0.939 (Table A2). The adjusted R2 is equal to 0.885. The forecast R2 is 0.823, which indicates the acceptable prediction of the pattern. In general, the difference between the predicted R2 and the adjusted R2 should be less than 0.2. Adeq Precision indicates a sufficient amount of pattern accuracy. Values greater than four are desirable. In this study, the value of 13.97 was obtained, which indicated that a sufficient signal was used to plot it in the design space. As is clear from the analysis of variance table, the lack of fit is not significant, which indicates the coverage of the model on the responses.
The two-dimensional model obtained from the coding factors is given by Equation (3):
Y = 52.3 + 3.74 A + 6.54 B 11.03 C + 0.7149 A B + 0.3225 A C + 1.81 B C + 2.8 A 2 + 0.0599 B 2 + 1.39 C 2
In Figure 5, Figure 6 and Figure 7, we have presented the concurrence between ultrasonic and enzyme loadings, time and enzyme loading, and time and ultrasonic loading. According to Figure 5, enzyme loading is also one of the factors affecting the production of sugar from lignocellulosic materials. In addition, according to the 3D diagram, it can be said that the efficiency of the enzyme is improved by using ultrasonic. When the amount of time in the treatments is assumed to be constant (72 h), increasing the enzyme loading from 85 to 125 FPU/mL with ultrasonic causes a noticeable increase in TRS. From the previous research, we know that the use of ultrasonic has potential as one of the mechanical pretreatment methods to increase the conversion of polysaccharides to their constituent sugars as well as increase the overall efficiency of ethanol [38].
According to Figure 6, both time and ultrasonic loading have a positive effect on sugar production. When we compare Figure 5 and Figure 6, it is evident that the change along the x-axis is greater in Figure 6.
By examining Figure 7, it is clear that both contact time and enzyme loading have a great impact on sugar production. At constant ultrasonic loading, the maximum amount of sugars produced (51.28 g/L) was when enzyme loading was 75 and time was 72. However, close observation shows that at a constant enzyme loading (FPU/mL = 75), contact time has a bigger effect on TRS concentration than ultrasonic load. At first, the presence of crystalline regions in cotton fibers seems to make it difficult to hydrolyze and break it down into monomeric sugars [33]. Over time, the chances of enzymes’ access to hydrolyze these areas will increase. Therefore, both time and enzyme loading factors show an upward graph.

3.6. WPD

In order to optimize the process by using the response surface method (RSM), a three-factor Box–Behnken design was used for the experimental design. In the experimental design, there is a simultaneous study of the interaction of different variables and achieving optimal points by considering all available factors. Table 4 shows the results of this optimization process. According to software prediction, the best percentage of sugar can be achieved with an ultrasonic loading of 54, enzyme loading of 91 FPU/mL, and a contact time of 118 h. The software forecast was 90 g/L in accordance with the stated conditions, and after measuring the amount of sugar based on the DNS method and the standard glucose chart, the actual amount of obtained sugar was equal to 81 g/L.
The results from Table 4 show that lower enzyme loads give a lower sugar concentration. However, in some cases, a further increase of the enzyme loads does not increase sugar concentrations. Instead, they have an inhibitory effect and decrease the contact between the enzymes and the substrate, which will decrease glucose concentration [39].
According to the results of Table A3 and the analysis of variance listed in Table A4, it can be seen that the p-value determining the statistical significance of the obtained model from the RSM is equal to p < 0.0003, which indicates that this model is over 95% reliable in terms of predictability. The F-value also shows the number 11.60, which indicates the significance of the pattern. In addition, the strength of this model can be seen from the values of R2 (0.9126). Adjusted R2 showing 0.8339 and predicted R2 showing 0.8089 indicate acceptable pattern prediction. In general, the difference between the predicted R2 and the adjusted R2 should be less than 0.2. Adeq Precision shows a sufficient amount of pattern accuracy. A ratio greater than four is usually desirable. In this study, a ratio of 10.73 was obtained, which indicates that the signal is sufficient. As a result, this model can be used to draw in the design space. As is clear from the analysis table of variance, the lack of fit is not significant, which indicates the coverage of the model on the responses.
The two-dimensional model obtained from the coding factors is given in Equation (4):
Y = 80.19 + 11.03 A + 2.79 B + 4.05 C + 1.26 A B + 1.26 A C 2.15 B C 4.20 A 2 0.3329 B 2 + 6.28 C 2
In Figure 8, the relationship between contact time and ultrasonic loading in the enzymatic hydrolysis section is shown with respect to TRS production when the amount of enzyme in the treatments is assumed to be constant (75 FPU/mL). The optimal sugar production rate (89.99 g/L) is with a contact time of 72 h and an ultrasonic loading of 40 amplitude. According to the 3D diagram, as in the case of WPB, the contact time is identified as a more influential factor than ultrasonic loading in TRS changes. In addition, the highest amount of sugar is produced with a contact time between 72 and 88 h. The comparison of sugars obtained under enzymatic hydrolysis of WPD in relation to the WPB sample shows the positive effect of the deinking process. Note that with an increasing time beyond 88 h, the resulting sugar content decreases. In this regard, scientific research on the use of waste jeans to produce bioethanol (has the same raw material as banknotes) shows that the efficiency of enzymatic hydrolysis on the first day was 85% and 99% by the fourth day [40].
In Figure 9, the relationship between the enzyme loading and contact time in the production of TRS is shown. The optimal amount of sugar is produced with a contact time of 72 h and enzyme loading of 75 FPU/mL. Beyond that, with increasing time and the amount of enzyme, the amount of sugar obtained has a decreasing trend. An enzymatic hydrolysis reaction first follows a linear relationship. Due to the reduction of hydrolyzable materials, in the next step, the speed of production decreases and finally stops. In other words, the appropriate time for enzymatic hydrolysis is before reaching the part of the enzymatic hydrolysis curve [41]. According to Figure 9, the highest level of TRS can be reached in 72 h.
In Figure 10, the effect of ultrasonic and enzyme loadings on TRS production is presented. It is evident that enzyme loading had a significant effect on TRS production up to 80 FPU/mL. The effect of the enzyme loading on the process was far greater than ultrasonic loading. In order to optimize the process by using the response level method, a three-factor Box–Behnken design was applied. The best achievable TRS was with the ultrasonic loading of 74, the enzyme loading of 101 FPU/mL, and the contact time of 75 h. The software prediction was 88.8 g/L according to the conditions, which after measuring the amount of sugar according to the DNS method and the standard glucose chart, the actual amount of obtained sugar was equal to 92 g/L.

3.7. Fermentation

In order to ferment the liquid obtained from the hydrolysis of WPD and WPB samples, the yeast Scheffersomyces stipitis was used at 8% loading for 96 h at 32 °C. The results of the fermentation efficiency and ethanol concentration are shown in Figure 11. The fermentation efficiency was lower for samples fermented for 24 h (between 36.8% and 38.3%), and higher for samples fermented for 96 h (between 75.5% and 79.7%). Bioethanol production was also lower for samples pretreated for 24 h, ranging between 15.6 g/L and 18.0g/L, and higher for samples pretreated for 96 h (between 31.3 g/L and 37.3 g/L). Overall, the amount of bioethanol produced from WPD was far greater than WPB. Ethanol was produced from WPD at 38 g/L and from WPB at 31 g/L, i.e., the deinking caused the improvement in the ethanol production by 19.5%. Statistically significant differences were found between the fermentation efficiency of WPD and ethanol concentration of WPD (p < 0.05) and the fermentation efficiency of WPD and ethanol concentration of WPB (p < 0.01).
From Figure 11, it is clear that with increasing the production process time, the ethanol production increases. However, the increasing trend extends only up to 96 h, and after that it decreases. Similar results were reported by Amadi and Ifeanacho [42]. The authors concluded that the optimal ethanol production was reported at 96 h and the fermentation time influences the composition and volume of the ethanol produced. It can also be seen from Figure 11 that ethanol production efficiency in the early stages of fermentation for both papers is not very different; however, the yeast efficiency increases over time. Yeast efficiency in deinked paper is higher than the yeast efficiency in blank paper. Previous research by Sheikh et al. has indicated that the presence of metallic and toxic compounds in the fermentation medium can reduce the number of living yeast cells [17]. Yeast natural growth and performance are reduced by industrial materials in the ink. Therefore, the presence of ink in WPB can be considered a reason for the decrease in yeast efficiency by 7.3% compared to WPD and a reduction in the amount of ethanol in the control sample.

4. Conclusions

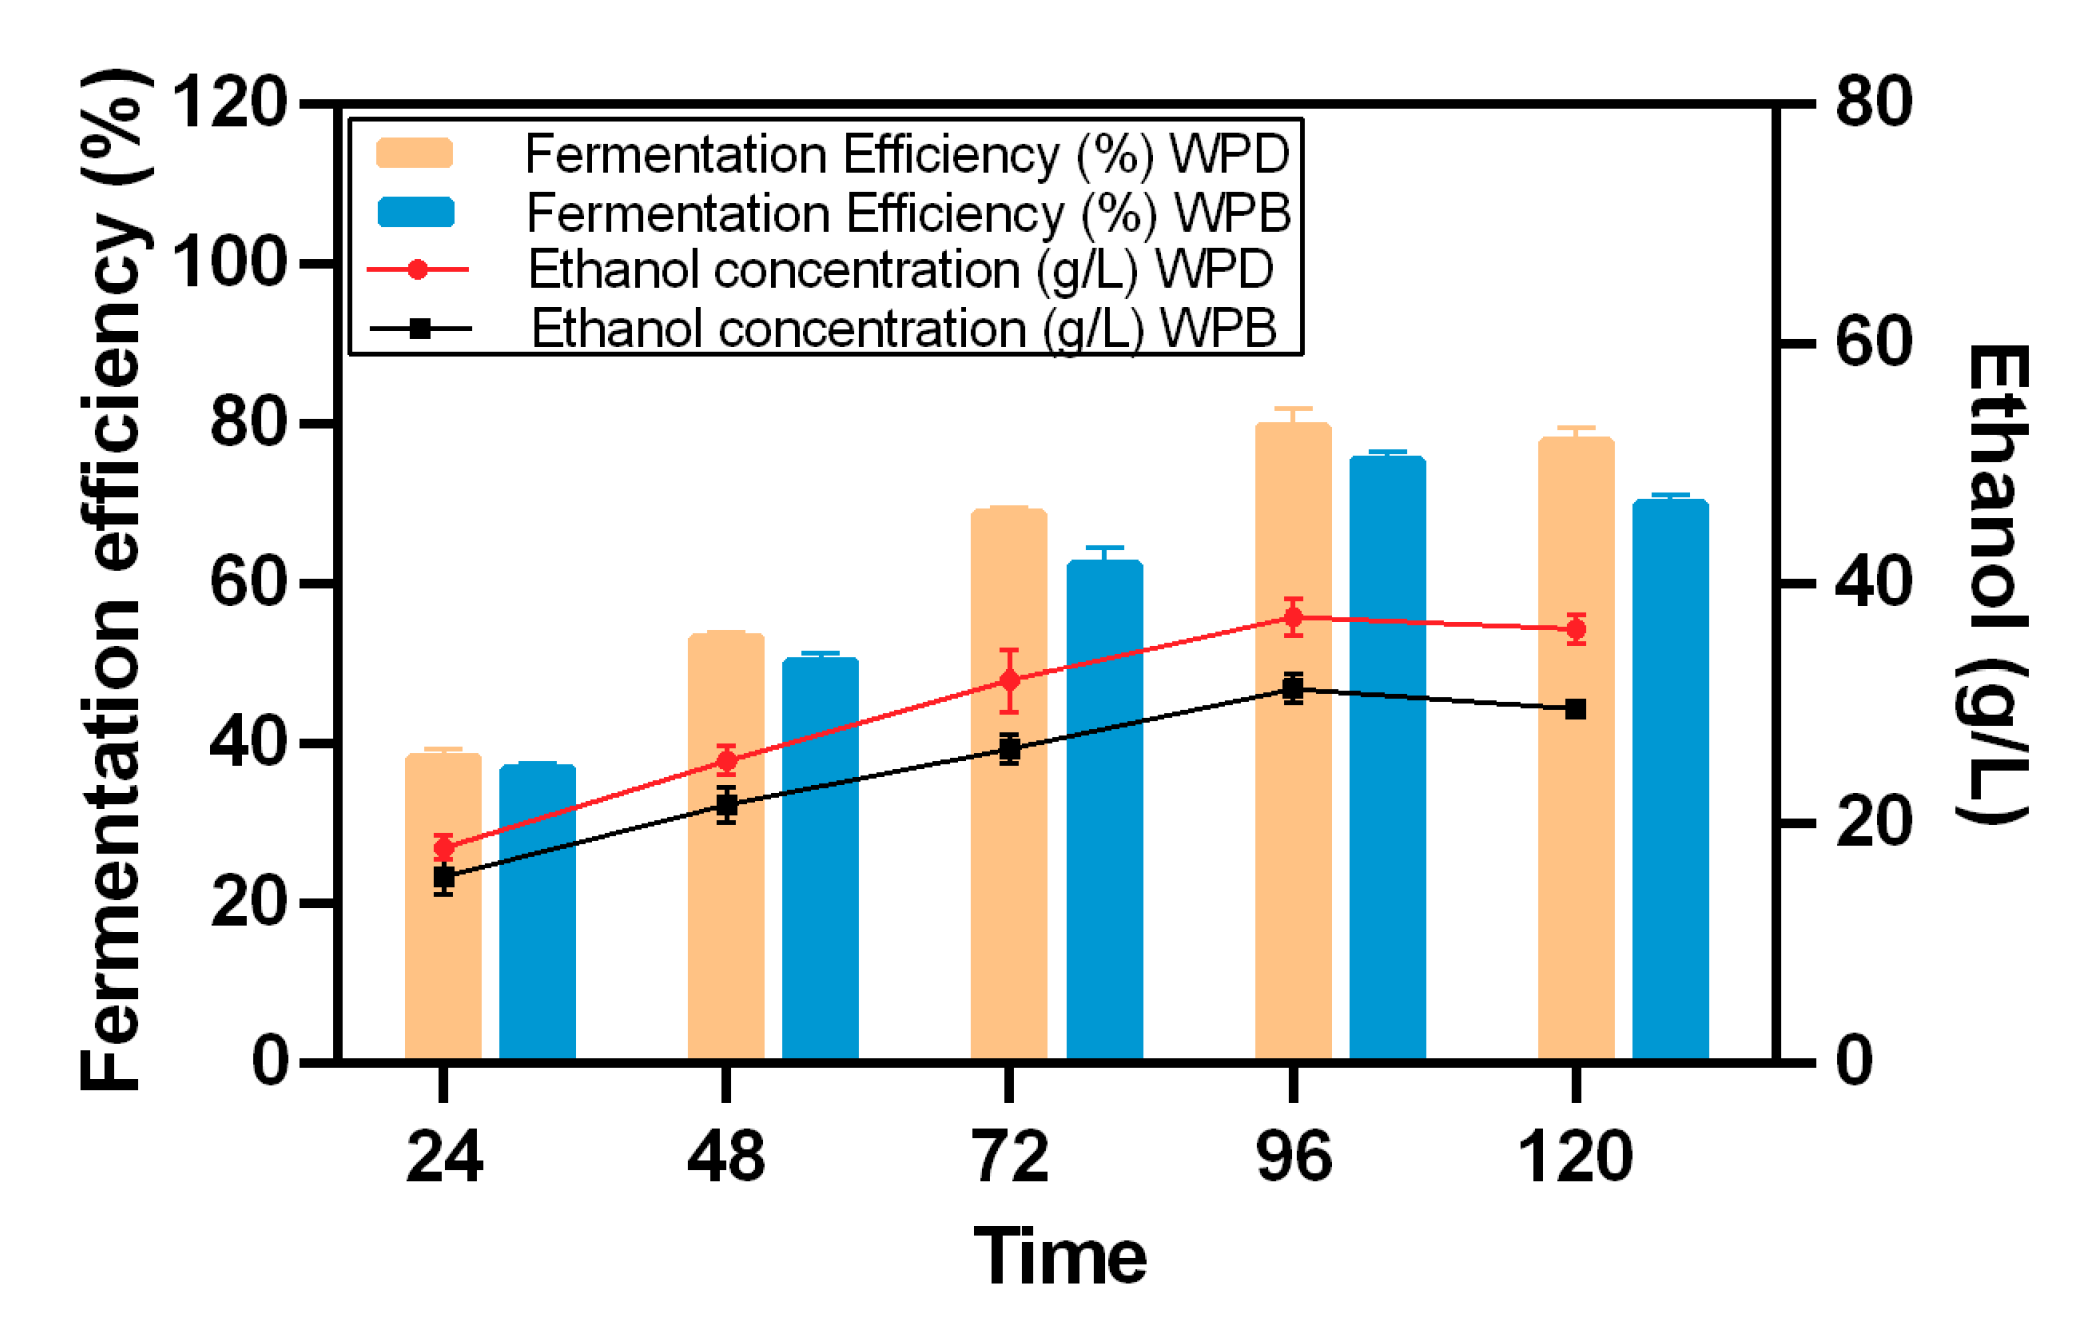
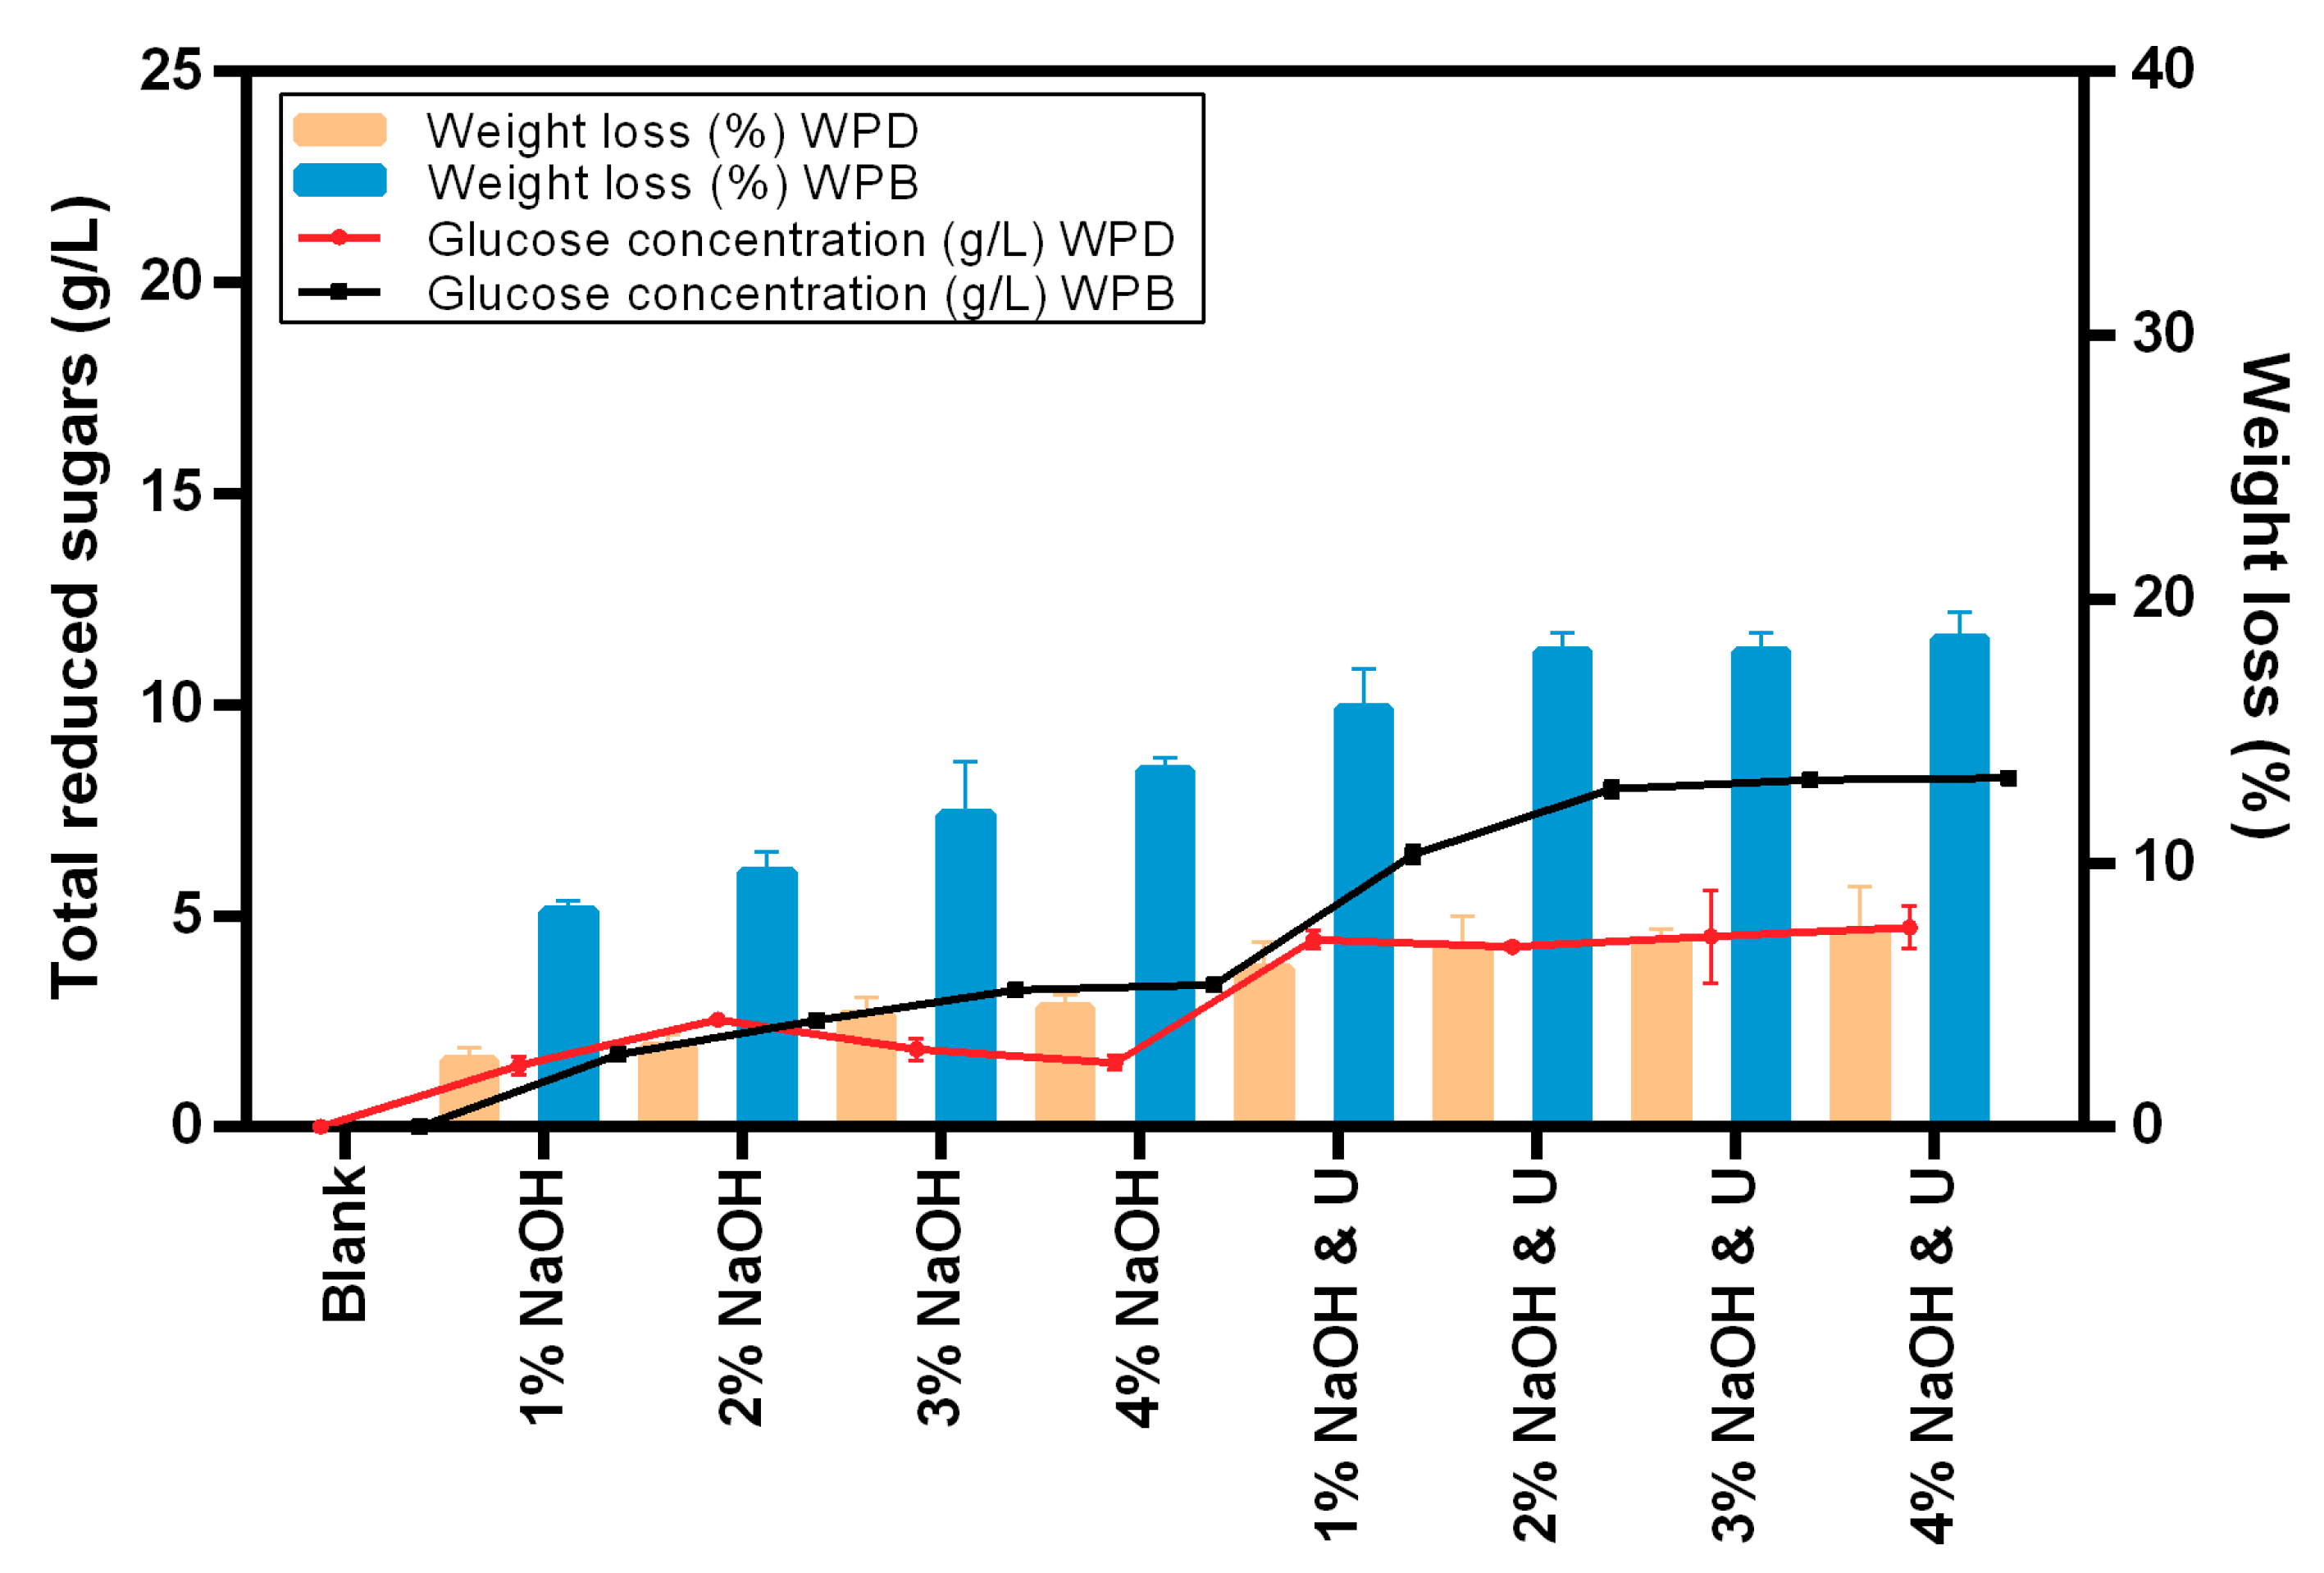
This research investigated two types of acidic and alkaline pretreatments after pulping and deinking banknote paper as a new raw material using ultrasonic treatment. The results indicated that the best pulping conditions for worn banknote paper were at pH = 2. The evaluation of the results of deinking with NaOH showed that the best brightness, considering the weight loss, was obtained by using 3% alkaline in combination with ultrasonic with a loading of 30 amplitude. Two chemical methods, i.e., acidic and alkaline, were used for pretreatment. The resulting weight loss and light density indicated the higher efficiency of acid pretreatment, which can be attributed to deinking by using NaOH. According to the results related to weight loss and optical density, the best pretreatment was obtained by using 1% of sulfuric acid and ultrasonic with a loading of 50 amplitude. In the best conditions, the rate of weight loss in acidic conditions was 17.5% for WPD and 30.5% for WPB. In alkaline conditions, these results were 7.5% for WPD and 18.5% for WPB. Between the two types of acid and alkaline pretreatments based on the resulting light density and weight loss, the acid treatment was more appropriate. Moreover, XRD tests of the biomass after acid pretreatments showed that the lowest crystallinity index was obtained by the use of 4% acid in combination with ultrasonic. Reducing the amount of crystallinity means decreasing the number of impermeable areas for enzymes. For this reason, it was considered the best type of pretreatment and thus used in the following experiments. The results of the enzymatic hydrolysis indicated that the amount of sugar produced in the step for WPD paper was higher than for WPB. In the fermentation process, the highest ethanol concentration achieved was 38 g/L for WPD and 31 g/L for WPB. The highest process efficiency was 80.9% for WPD and 75.04% for WPB. Overall, the production of bioethanol increased with increasing time to 96 h, and then the process slowed down. The ethanol production efficiency of the WPD sample was improved by 7% compared to the WPB sample due to the absence of composites (such as copper, nickel aluminum, zinc, and iron). In summary, waste banknote paper has high amounts of alpha cellulose in its composition, which makes it a suitable substrate for bioethanol production. Since waste banknote paper has high amounts of heavy metals, melamine formaldehyde, and ink in its composition, further research should be conducted in order to further increase the fermentation efficiency and ethanol concentrations and decrease the production costs of treating these residues for bioethanol production.

Author Contributions

Conceptualization, O.Y.A., G.A., and E.R.G.; methodology, O.Y.A.; software, O.Y.A. and L.R.-M.; validation, O.Y.A., G.A., E.R.G., M.Z., L.R.-M., and T.K.; formal analysis, O.Y.A. and L.R.M.; investigation, O.Y.A., G.A., and E.R.G.; resources, O.Y.A., G.A., E.R.G., M.Z., L.R.-M., and T.K.; data curation, O.Y.A., G.A., E.R.G., L.R.-M., and T.K.; writing—original draft preparation, O.Y.A., G.A., E.R.G., L.R.-M., and T.K.; writing—review and editing, L.R.-M. and T.K.; visualization, O.Y.A. and L.R.-M.; supervision, G.A., E.R.G., M.Z., L.R.-M., and T.K.; project administration, T.K.; funding acquisition, T.K. All authors have read and agreed to the published version of the manuscript.

Funding

We gratefully acknowledge the financial support of the Doctoral School of Energy and Geotechnology III, supported by the European Union, European Regional Development Fund (Estonian University of Life Sciences ASTRA project “Value-chain based bio-economy”).

Conflicts of Interest

The authors declare no conflict of interest.

Appendix A

Table A1. Analysis of variance of the quadratic response surface method (RSM) model for waste paper blank.
SourceSum of SquaresdfMean SquareF-Valuep-Value
Model30999344.417.27<0.0001
A-Enzyme load224.41224.411.260.007
B-Ultra load684.21684.234.320.0002
C-Time19461194697.61<0.0001
AB4.09014.0900.20510.7
AC0.847610.84760.042500.8
BC26.26126.261.3200.3
A2196.91196.99.8800.0
B29.00019.0000.45170.5
C248.31148.312.4200.2
Residual199.351019.93
Lack of Fit47.8459.5700.31570.9
Pure Error151.5530.30
Cor Total329919
Table A2. Fit statistics for the RSM model (waste paper blank).
Std. Dev.4.4
Mean56
C.V. %7.9
R20.94
Adjusted R20.88
Predicted R20.82
Adeq Precision14
Table A3. Analysis of variance of the quadratic RSM model for waste paper deinking.
SourceSum of SquaresdfMean SquareF-Valuep-Value
Model36649407.111.600.0003
A-Enzyme load19481194855.47<0.0001
B-Ultra load124.61124.63.5500.09
C-Time262.01262.07.4600.02
AB12.63112.630.35990.6
AC12.63112.630.35990.6
BC36.93136.931.0500.3
A2442.91442.912.620.005
B22.79012.7900.079300.8
C2991.01991.028.230.0003
Residual351.11035.11
Lack of Fit40.7558.1500.13130.9
Pure Error310.4562.07
Cor Total401519
Table A4. Fit statistics for the RSM model (waste paper deinking).
Std. Dev.5.9
Mean72
C.V. %8.3
R20.91
Adjusted R20.83
Predicted R20.81
Adeq Precision11

References

  1. Song, C.; Zhang, C.; Zhang, S.; Lin, H.; Kim, Y.; Ramakrishnan, M.; Du, Y.; Zhang, Y.; Zheng, H.; Barcelo, D. Thermochemical liquefaction of agricultural and forestry wastes into biofuels and chemicals from circular economy perspectives. Sci. Total Environ. 2020, 749, 141972. [Google Scholar] [CrossRef]
  2. Branco, R.H.R.; Serafim, L.S.; Xavier, A.M.R.B. Second generation bioethanol production: On the use of pulp and paper industry wastes as feedstock. Fermentation 2018, 5, 4. [Google Scholar] [CrossRef] [Green Version]
  3. Ioelovich, M. Waste paper—Promising feedstock for bioethanol production. J. Sci. Res. Rep. 2014, 3, 905–916. [Google Scholar]
  4. Mace, R. The Impact of Paper Production on the Environment Paperless. eFileCabinet. 2015. Available online: https://www.efilecabinet.com/impact-of-paper-production-environment-paperless-office (accessed on 8 October 2020).
  5. Hubbe, M.A. Prospects for maintaining strength of paper and paperboard products while using less forest resources: A review. Bioresources 2013, 9, 1634–1763. [Google Scholar] [CrossRef] [Green Version]
  6. Kamali, M.; Alavi-Borazjani, S.A.; Khodaparast, Z.; Khalaj, M.; Jahanshahi, A.; Costa, E.; Capela, M.I. Additive and additive-free treatment technologies for pulp and paper mill effluents: Advances, challenges and opportunities. Water Resour. Ind. 2019, 21, 100109. [Google Scholar] [CrossRef]
  7. Luján-Ornelas, C.; Sternenfels, U.M.D.C.; Güereca, L.P. Life cycle assessment of Mexican polymer and high-durability cotton paper banknotes. Sci. Total Environ. 2018, 630, 409–421. [Google Scholar] [CrossRef] [PubMed]
  8. Ameli, M.; Mansour, S.; Ahmadi-Javid, A. A simulation-optimization model for sustainable product design and efficient end-of-life management based on individual producer responsibility. Resour. Conserv. Recycl. 2019, 140, 246–258. [Google Scholar] [CrossRef]
  9. Yehia, A.; Yassin, K.E.; Eid, A. Recycling of shredded currency waste of Egyptian Central Bank for making good-quality papers. Sep. Sci. Technol. 2017, 53, 544–550. [Google Scholar] [CrossRef]
  10. Kim, J.W. How Money Gets Burned. Available online: https://www.marketplace.org/2015/03/13/how-money-gets-burned/ (accessed on 21 September 2020).
  11. Yousef, S.; Eimontas, J.; Striūgas, N.; Trofimov, E.; Hamdy, M.; AbdelNaby, M.A. Conversion of end-of-life cotton banknotes into liquid fuel using mini-pyrolysis plant. J. Clean. Prod. 2020, 267, 121612. [Google Scholar] [CrossRef]
  12. Scott, W.E.; Abbott, J.C.; Trosset, S. Properties of paper: An Introduction, 2nd ed.; TAPPI Press: Atlanta, GA, USA, 1995. [Google Scholar]
  13. Chatrath, H.; Durge, D. Repulping of Waste Paper Containing High Wet Strength. Available online: https://www.researchgate.net/publication/255967160_Repulping_of_Waste_Paper_Containing_High_Wet_Strength (accessed on 21 September 2020).
  14. Carré, B.; Magnin, L.; Galland, G. Deinking difficulties related to Ink Formulation, Printing Process, and Type of Paper. Available online: http://thedpda.org/sites/thedpda.org/files/Deinking_Difficulties.pdf (accessed on 27 September 2020).
  15. Raud, M.; Kikas, T.; Sippula, O.; Shurpali, N. Potentials and challenges in lignocellulosic biofuel production technology. Renew. Sustain. Energy Rev. 2019, 111, 44–56. [Google Scholar] [CrossRef]
  16. Brummer, V.; Jurena, T.; Hlavacek, V.; Omelkova, J.; Bebar, L.; Gabriel, P.; Stehlik, P. Enzymatic hydrolysis of pretreated waste paper—Source of raw material for production of liquid biofuels. Bioresour. Technol. 2014, 152, 543–547. [Google Scholar] [CrossRef] [PubMed]
  17. Sheikh, M.I.; Kim, C.-H.; Park, H.-J.; Kim, S.-H.; Kim, G.-C.; Lee, J.-Y.; Sim, S.-W.; Kim, J.W. Alkaline pretreatment improves saccharification and ethanol yield from waste money bills. Biosci. Biotechnol. Biochem. 2013, 77, 1397–1402. [Google Scholar] [CrossRef] [PubMed] [Green Version]
  18. Ferguson, L.D. Deinking chemistry Part 1. Tappi J. 1992, 75, 75–83. [Google Scholar]
  19. Parra, R.G.; Vargas Radillo, J.; Navarro Arzate, F.; Rutiaga Quiñones, G.J.; Becerra Aguilar, B.; Ramírez Valdovinos, E.; Ramírez Casillas, R. Ultrasonic treatment for deinking of laser paper using two frequencies, 25 and 45 khz (Destintado de papel de impresión láser mediante ultrasonido con dos frecuencias, 25 y 45 kHz). Rev. Mex. Cienc. Forestales 2015, 6, 126–141. [Google Scholar] [CrossRef] [Green Version]
  20. Jiang, C.; Ma, J. Deinking of Waste Paper: Flotation; Elsevier BV: Amsterdam, The Netherlands, 2000; pp. 2537–2544. [Google Scholar]
  21. Pathak, P.; Bhardwaj, N.; Singh, A. Optimization of chemical and enzymatic deinking of photocopier waste paper. Bioresources 2011, 6, 447–463. [Google Scholar]
  22. Al-Azkawi, A.; Elliston, A.; Al-Bahry, S.; Sivakumar, N. Waste paper to bioethanol: Current and future prospective. Biofuels Bioprod. Biorefining 2019, 13, 1106–1118. [Google Scholar] [CrossRef]
  23. Basiri, M.; Kamyar, T.A.; Madanipour, M. Investigation of the characteristics of handmade papers obtained from the recycling of waste banknote paper with emphasis on refining. Renew. Natural Resour. Res. 2014, 5, 65–76. [Google Scholar]
  24. Ghose, T. Measurement of Cellulase Activity. In Commission on Biotechnology; International Union of Pure and Applied Chemistry: New Delhi, India, 1984. [Google Scholar]
  25. Miller, G.L. Use of Dinitrosalicylic Acid Reagent for Determination of Reducing Sugar. Anal. Chem. 1959, 31, 426–428. [Google Scholar] [CrossRef]
  26. Raud, M.; Rooni, V.; Kikas, T. The efficiency of nitrogen and flue gas as operating gases in explosive decompression pretreatment. Energies 2018, 11, 2074. [Google Scholar] [CrossRef] [Green Version]
  27. Test Method TAPPI/ANSI T 456 om-15. Tensile Breaking Strength of Water-Saturated Paper and Paperboard (“Wet Tensile Strength”); Standard Method; Technical Association of the Pulp and Paper Industry: Peachtree Corners, GA, USA, 2015. [Google Scholar]
  28. Thite, V.S.; Nerurkar, A.S. Valorization of sugarcane bagasse by chemical pretreatment and enzyme mediated deconstruction. Sci. Rep. 2019, 9, 15904. [Google Scholar] [CrossRef]
  29. Zhang, H.; Wei, W.; Zhang, J.; Huang, S.; Xie, J. Enhancing enzymatic saccharification of sugarcane bagasse by combinatorial pretreatment and Tween 80. Biotechnol. Biofuels 2018, 11. [Google Scholar] [CrossRef] [PubMed]
  30. Pavasars, I.; Hagberg, J.; Borén, H.; Allard, B. Alkaline degradation of cellulose: Mechanisms and kinetics. J. Polym. Environ. 2003, 11, 39–47. [Google Scholar] [CrossRef]
  31. Shimizu, F.L.; Monteiro, P.Q.; Ghiraldi, P.H.C.; Melati, R.B.; Pagnocca, F.C.; De Souza, W.; Sant’Anna, C.; Brienzo, M. Acid, alkali and peroxide pretreatments increase the cellulose accessibility and glucose yield of banana pseudostem. Ind. Crop. Prod. 2018, 115, 62–68. [Google Scholar] [CrossRef] [Green Version]
  32. Guangyin, Z.Y.Z. Index. In Pollution Control and Resource Recovery for Sewage Sludge; Guangyin, Z., Youcai, Z., Eds.; Butterworth-Heinemann: Oxford, UK, 2017; pp. 359–375. [Google Scholar]
  33. Mahalakshmi, M.; Angayarkanni, J.; Rajendran, R.; Rajesh, R. Bioconversion of cotton waste from textile mills to bioethanol by microbial saccharification and fermentation. Ann. Biol. Res. 2011, 2, 380–388. [Google Scholar]
  34. Pena, C.A.; Soto, A.; King, A.; Rodríguez, H. Improved reactivity of cellulose via its crystallinity reduction by nondissolving pretreatment with an ionic liquid. ACS Sustain. Chem. Eng. 2019, 7, 9164–9171. [Google Scholar] [CrossRef] [Green Version]
  35. Rezania, S.; Oryani, B.; Cho, J.; Talaiekhozani, A.; Sabbagh, F.; Hashemi, B.; Rupani, P.F.; Mohammadi, A.A. Different pretreatment technologies of lignocellulosic biomass for bioethanol production: An overview. Energy 2020, 199, 117457. [Google Scholar] [CrossRef]
  36. Zhang, Y.H.; Cui, J.; Lynd, L.R.; Kuang, L.R. A transition from cellulose swelling to cellulose dissolution by o-phosphoric acid: Evidence from enzymatic hydrolysis and supramolecular structure. Biomacromolecules 2006, 7, 644–648. [Google Scholar] [CrossRef]
  37. Chandrashekhar, B.; Mishra, M.; Sharma, K.; Dubey, D. Bio-ethanol production from textile cotton waste via dilute acid hydrolysis and fermentation by Saccharomyces Cerevisiae. J. Ecobiotechnol. 2011, 3, 6–9. [Google Scholar]
  38. Subhedar, P.B.; Babu, N.R.; Gogate, P.R. Intensification of enzymatic hydrolysis of waste newspaper using ultrasound for fermentable sugar production. Ultrason. Sonochem. 2015, 22, 326–332. [Google Scholar] [CrossRef]
  39. Xin, F.; Zhang, H.; Wong, W. Bioethanol production from horticultural waste using crude fungal enzyme mixtures produced by solid state fermentation. BioEnergy Res. 2013, 6, 1030–1037. [Google Scholar] [CrossRef] [Green Version]
  40. Jeihanipour, A.; Taherzadeh, M.J. Ethanol production from cotton-based waste textiles. Bioresour. Technol. 2009, 100, 1007–1010. [Google Scholar] [CrossRef] [PubMed]
  41. Bisswanger, H. Enzyme assays. Perspect. Sci. 2014, 1, 41–55. [Google Scholar] [CrossRef] [Green Version]
  42. Amadi, P.; Ifeanacho, M. Impact of changes in fermentation time, volume of yeast, and mass of plantain pseudo-stem substrate on the simultaneous saccharification and fermentation potentials of African land snail digestive juice and yeast. J. Genet. Eng. Biotechnol. 2016, 14, 289–297. [Google Scholar] [CrossRef] [PubMed] [Green Version]
Figure 1. Process flow used for bioethanol production from waste banknote paper.
Processes 08 01563 g001
Figure 2. Effect of acid pretreatment alone and in combination with ultrasonic on weight loss and total reduced sugars of waste paper deinked (WPD) and waste paper blank (WPB).
Processes 08 01563 g002
Figure 3. Effect of alkaline pretreatment on weight loss and the glucose concentration of WPD and WPB paper.
Processes 08 01563 g003
Figure 4. The effect of acid pretreatment on the crystallinity index. DHU1: WPD pretreated with 1% sulfuric acid and ultrasonic. BHU1: WPB pretreated with 1% sulfuric acid and ultrasonic; DH4: WPD pretreated with 4% sulfuric acid; BH4: WPB pretreated with 4% sulfuric acid; DHU4: WPD pretreated with 4% sulfuric acid and ultrasonic; BHU4: WPB pretreated with 4% sulfuric acid and ultrasonic; B: WPB; P: sample of worn banknotes.
Processes 08 01563 g004
Figure 5. Response surface of the sugar concentration as a function of ultrasonic and enzyme load at a constant time (72 h) (WPB).
Processes 08 01563 g005
Figure 6. Response surface of the sugar concentration as a function of time and ultrasonic at a constant enzyme load (75 FPU/mL) (WPB).
Processes 08 01563 g006
Figure 7. Response surface of the sugar concentration as a function of time and enzyme at a constant ultrasonic (Am40) (WPB).
Processes 08 01563 g007
Figure 8. Response surface of the sugar concentration as a function of time and ultrasonic at a constant enzyme load (75 FPU/mL) (WPD).
Processes 08 01563 g008
Figure 9. Response surface of the sugar concentration as a function of time and enzyme load at a constant ultrasonic (Am40) (WPD).
Processes 08 01563 g009
Figure 10. Response surface of the sugar concentration as a function of ultrasonic and enzyme load at a constant time (72 h) (WPD).
Processes 08 01563 g010
Figure 11. Efficiency and amount of ethanol obtained from the fermentation process at different fermentation times.
Processes 08 01563 g011
Table 1. Effect of pH on tensile strength in the pulping process of waste banknote paper.
Wet-to-Dry Tensile Strength Ratio (%)Tensile Strength in Dry Conditions (N/m)Tensile Strength in Wet Conditions (N/m)pH
34 ± 085 ± 029 ± 02
38 ± 085 ± 032 ± 03
40 ± 285 ± 034 ± 04
43 ± 085 ± 037 ± 15
45 ± 085 ± 039 ± 06
45 ± 085 ± 039 ± 07
44 ± 185 ± 038 ± 18
43 ± 085 ± 037 ± 08
40 ± 085 ± 034 ± 010
37 ± 085 ± 032 ± 0 11
36 ± 085 ± 031 ± 012
Table 2. Effect of different deinking treatment methods on the brightness and weight loss of the samples.
TreatmentBrightnessBrightness Improvement (%)Weight Loss (%)
Blank52 ± 10 ± 00 ± 0
Ultra56 ± 18 ± 25 ± 0
NaOH 1%61 ± 115 ± 16 ± 0
NaOH 2%63 ± 117 ± 113 ± 0
NaOH 3%65 ± 120 ± 115 ± 0
NaOH 4%65 ± 120 ± 116 ± 0
NaOH 1% Ultra63 ± 118 ± 112 ± 0
NaOH 2% Ultra66 ± 121 ± 118 ± 0
NaOH 3% Ultra68 ± 124 ± 122 ± 0
NaOH 4% Ultra68 ± 024 ± 024 ± 0
Table 3. Total reduced sugars from WPB after enzymatic hydrolysis.
Run.EnzymeUltrasonic LoadTimeTRS
(FPU/mL)(Amplitude)(h)(g/L)
1100609681 ± 2
275407251 ± 2
3754012077 ± 3
475407251 ± 1
575407251 ± 1
6100604856 ± 0
725407255 ± 1
875807266 ± 0
950204839 ± 1
10100204845 ± 4
1150209655 ± 3
127507241 ± 1
1375407252 ± 2
14100209668 ± 2
15125407269 ± 2
1650609677 ± 2
1775407244 ± 0
1875402436 ± 1
1975407262 ± 0
2050604847 ± 3
Table 4. Results of enzymatic hydrolysis of WPD.
Factor 1Factor 2Factor 3Response 1
StdRunA: Enzyme LoadB: Ultrasonic LoadC: TimeTRS
(FPU/mL)(Amplitude)(h)(g/L)
81100609684 ± 2
13275402449 ± 2
15375407290 ± 0
64100209687 ± 2
25100204871 ± 3
1650204848 ± 2
1177507273 ± 1
17875407270 ± 1
109125407286 ± 1
1410754012064 ± 1
191175407289 ± 0
181275407275 ± 1
161375407281 ± 1
121475807287 ± 2
91525407243 ± 1
51650209659 ± 1
31750604859 ± 1
201875407278 ± 0
71950609661 ± 3
420100604877 ± 0
Publisher’s Note: MDPI stays neutral with regard to jurisdictional claims in published maps and institutional affiliations.

