Article

Predicting By-Product Gradients of Baker’s Yeast Production at Industrial Scale: A Practical Simulation Approach

by
Christopher Sarkizi Shams Hajian
1,
Cees Haringa
2,
Henk Noorman
2,3 and
Ralf Takors
1,*
1
Institute of Biochemical Engineering, University of Stuttgart, 70569 Stuttgart, Germany
2
DSM Biotechnology Center, 2613 AX Delft, The Netherlands
3
Department of Biotechnology, Delft University of Technology, 2628 CD Delft, The Netherlands
*
Author to whom correspondence should be addressed.
Processes 2020, 8(12), 1554; https://doi.org/10.3390/pr8121554
Submission received: 21 October 2020 / Revised: 21 November 2020 / Accepted: 25 November 2020 / Published: 27 November 2020

Abstract

:
Scaling up bioprocesses is one of the most crucial steps in the commercialization of bioproducts. While it is known that concentration and shear rate gradients occur at larger scales, it is often too risky, if feasible at all, to conduct validation experiments at such scales. Using computational fluid dynamics equipped with mechanistic biochemical engineering knowledge of the process, it is possible to simulate such gradients. In this work, concentration profiles for the by-products of baker’s yeast production are investigated. By applying a mechanistic black-box model, concentration heterogeneities for oxygen, glucose, ethanol, and carbon dioxide are evaluated. The results suggest that, although at low concentrations, ethanol is consumed in more than 90% of the tank volume, which prevents cell starvation, even when glucose is virtually depleted. Moreover, long exposure to high dissolved carbon dioxide levels is predicted. Two biomass concentrations, i.e., 10 and 25 g/L, are considered where, in the former, ethanol production is solely because of overflow metabolism while, in the latter, 10% of the ethanol formation is due to dissolved oxygen limitation. This method facilitates the prediction of the living conditions of the microorganism and its utilization to address the limitations via change of strain or bioreactor design or operation conditions. The outcome can also be of value to design a representative scale-down reactor to facilitate strain studies.

1. Introduction

Bioprocesses are applied for the production of a vast spectrum of commodities, from food and pharmaceuticals to bioplastic and biofuel. Although different from their chemical counterparts, transferring promising lab approaches to industrial applications is a major challenge too. The problem lies within the different scales of lab, pilot, and industrial bioreactors. Whereas, ideally, mixed homogenous conditions are easily realized at lab scale, economic and physical constraints prevent the establishment of such ideal conditions in industrial tanks. As a result, gradients of limiting substrate concentrations, by-products, pH, temperature, and shear rates are formed inevitably. Circulating microorganisms in stirred and gassed large-scale tanks respond to the permanently changing microenvironmental conditions, finally causing uncertainty of process performance, possibly deteriorating key TRY criteria (titer, rate, yield) [1,2,3,4,5,6].
Different approaches to addressing such issues have been studied by bioreactor design experts [7,8,9,10,11,12]. The investigation of cellular interaction with substrate gradients has been the basis of numerous studies. Often, deteriorating TRY values have been reported [13,14] but there are also occasional observations of improved performance values [15]. In particular, Saccharomyces cerevisiae was found to respond to fluctuating conditions with improved viability [16], adapted cAMP-mediated metabolism [17,18,19], and global regulation [20,21]. However, most of these investigations were performed at laboratory scale, mimicking industrial-scale conditions. Real industrial-scale data, important for validation, are rare. Accordingly, researchers have been employing computational fluid dynamics (CFD) combined with metabolic models with different resolutions to shed light on gradients in the bioreactor that take place at the interface of various physical and biological phenomena [6,22,23,24,25]. It is worth mentioning that shear gradients may have a significant effect on shear sensitive hosts. Simulating shear fields and calculating the frequencies of cellular exposure may be a highly valuable tool for future applications to investigate this particular large-scale impact [26].
Saccharomyces cerevisiae strains are applied for a wide range of processes, from the food industry [27,28,29,30,31] and bulk chemical production [32,33,34,35,36,37] to the pharmaceutical industry [15]. These products are manufactured in large bioreactor scales, where gradients cannot be avoided. As one of the workhorses of industrial biotechnology, this yeast is well investigated [38,39], and key traits of the “Crabtree positive” strains [40,41,42,43,44,45] are thoroughly studied. One feature is the overflow production of ethanol under aerobic conditions, mirroring how S. cerevisiae consumes more glucose than it can metabolize. [46,47,48]. Under anaerobic conditions S. cerevisiae is known to consume ethanol [49]. Apparently, such traits may gain importance under varying microenvironmental conditions affecting TRY values and effecting population differentiation [50]. Interesting short- and long-term Crabtree effects have been observed [44] that create population responses at different timescales. Furthermore, stress exposure may cause growth phenotypes different from the well-reported Monod-type kinetics using substrate supply as the growth limiting impact. To this end, obtaining information regarding the surroundings of the cell will help to identify the triggers that could set off the stress responses [51,52], finally yielding further improved prediction of large-scale performance of the yeast.
The mathematical framework requires the joint use of CFD with microbial kinetics. Whereas the first is applied to predict hydrodynamics and mass transfer in large tanks, the latter describes the cellular phenotype which is dominated by metabolic models [53,54,55,56,57]. The effects interact and are both needed to predict gradients in large-scale reactors. However, recently, efforts have been made to integrate multiple levels of cellular regulation linking metabolism with enzyme activities [9] and gene expression [6]. The integration of these hierarchical control levels expands the timescales of cellular response severely [6,21,58,59,60,61], which causes extra computational burden, challenging conventional simulation capacities. With this in mind, such biokinetic models should be linked to CFD that describe the targeted phenotype with the least computational effort.
Nowadays, CFD is one of the must-have tools for process development and troubleshooting [5,62,63,64,65]. It provides the possibility to incorporate the main aspects of the process and yield further insights into the conditions inside the bioreactor. Because of the dynamic environment faced by the cells in large-scale bioreactors, different responses of cells will give rise to a heterogeneous population, which will result in heterogeneities in substrate/by-product gradients and/or in the cell population [46,48,66,67]. Setting up a simulation by itself needs to be purpose-driven for engineering applications. The computational resources and strategies should be allocated in a way that contributes the most to the goal of the project at hand.
Currently, Reynolds-averaged Navier–Stokes (RANS) methods are the most common way to model hydrodynamics including turbulence. However, more delicate methods are surfacing [68,69,70], with drastic changes in software and hardware requirements. Most of the bioproducts are produced in aerated fermenters. Moreover, multiphase problems are addressed with numerous methods. On the one hand, Euler–Euler approaches are used for considering the impact of the ever-changing environment on cells [71]. On the other hand, one may implement the Euler–Lagrange approach [72], for instance, if individual microorganisms are incorporated, typically as massless particles.
In this work, CFD is coupled to a mechanistic biokinetic model to predict concentration gradients in a large-scale bioreactor. The process of interest is the production of baker’s yeast, Saccharomyces cerevisiae. A detailed assessment in terms of concentration gradients is undertaken. Aspects of biokinetics, mass transfer, and thermodynamics of the bioreactor are well characterized, and fundamentals are well established. Together with experimental validation, they prove to be an effective tool to shed light on the gradients within a bioreactor at industrial scale. By efficiently combining CFD with simple yet practical models, the assumption of non-limiting dissolved O 2 ( d O 2 ) is evaluated. In addition to this, dissolved C O 2 ( d C O 2 ) inhibition is known to occur at large scales [4,73] and is addressed within this work. Large-scale processes are suspected to lack real starvation in the case of overflow metabolism products that are formed near the feeding point and which are then re-consumed at the other end of the tank [4].

2. Materials and Methods

All pre-processing, solution, and post-processing were carried out with Ansys® Academic Research Workbench (2019 R1, Ansys, Canonsburg, PA, USA).

2.1. Geometry and Mesh

The reactor dimensions were based on the schematics available in the literature [25,74], as illustrated in Figure 1. For CFD simulation, a mesh with ~2.5 million hexahedron cells was generated and evaluated for turbulent kinetic energy (k) and dissipation of turbulent kinetic energy (ε) and velocity profile at the impeller heights, as discussed in the work of Haringa et al. [25].

2.2. CFD Setup

A Eulerian model with two phases was used. Turbulence was modeled with realizable k-ε using mixture formulation for calculating turbulence of the gas phase [75]. To investigate the concentration of chemical species, namely glucose, O 2 , C O 2 , ethanol, every phase was defined as a mixture. The physical properties of the liquid phase were approximated as water with volume weighted mixing law for density calculation. The gas phase was assumed as ideal gas considering an average bubble diameter 0.009 m as calculated by Haringa et al. [25]. With this assumption of single bubble size, the swarm coefficient needed to be set to −1.2 in the grace drag model [76] to reproduce the gas flow regime at the bottom impeller. Surface tension was set to that of the air–water system and was 0.072 N/m. Other interphase forces were assumed not to impose significant impacts according to Scargiali et al. [77].
Boundary conditions for walls were set with no-slip conditions for liquid phase and free slip for gas phase other than the impellers, where the no-slip conditions also apply for the gas phase to improve the reproduction of the vortices behind the impellers, as suggested by Haringa et al. [25]. Gas enters the bioreactor via a sparger through a mass flow inlet with 0.231 kg/s and leaves the system on top via a degassing boundary condition. Operating pressure was set close to the boundary to 130,710 Pa [4,25,74] and operating density was set to 0, as suggested by the Fluent manual [78]. The rotation of the impeller was modeled using multiple reference frames (MRF) at 2.22 1/s, as mentioned in previous works on this bioreactor [25]. The operating conditions are summarized in Table 1.
After setting up the phenomena describing the system, the solution methods and strategies were included. Phase coupled SIMPLE were chosen for pressure-velocity coupling and temporal (transient formulation) and spatial discretization scheme were set to first-order upwind for the first few hundred iterations to achieve solution stability and then were set to QUICK for velocity, turbulence, and volume fraction, and temporal discretization was set to bounded second-order implicit. The residuals were set to 10−6 and a time step of 0.001 s with 50 iterations was chosen.
Simulations were qualified as “accomplished” once flow velocities and turbulent kinetic energies converged to pseudo-steady states with ±5% variation. Further validation was achieved by comparing mixing time ( τ 95 ) and integral mass transfer coefficient ( k l a ) with published values. Flow fields served as basis for implementing mass transfer and biokinetics in subsequent steps.

2.3. Biokinetics

Sonnleitner and Käppeli [39] introduced a black-box model to describe the substrate uptake, growth, and by-product formation of S.cerevisiae. Glucose is considered as substrate whereas ethanol may serve as substrate or product depending on metabolic and environmental conditions. The model assumes the respiratory capacity of the yeast as key metabolic bottleneck. If glucose uptake exceeds respiratory limits, remaining electrons are channeled via reductive pathways, leading to the secretion of ethanol. Notably, the model also allows ethanol uptake under aerobic conditions. Under anaerobic conditions, ethanol is considered as dominating product. Details are as follows:
  • Aerobic growth on glucose (indexed sae)
  • Anaerobic growth on glucose (indexed san)
  • Aerobic growth on ethanol (indexed eae)
Uptake rates are assumed to follow Monod kinetics (1)–(3).
q s = q s , m a x C s K s + C s
q o = q o , m a x C o K o + C o
q e = q e , m a x C e K e + C e
To distinguish between these cases, the catabolic capacity to metabolize glucose aerobically serves as the threshold. In essence, if biomass specific glucose uptake q s exceeds the related oxygen demand for oxidation, Y s o · q o meaning (4):
q s > Y s o · q o
Aerobic ethanol formation starts. Acetaldehyde, upstream of ethanol in the fermentation pathway, serves as electron acceptor under such conditions. Accordingly, “anaerobic” carbon flux occurs and equals the remainder of the total substrate uptake (5) and (6), which will be metabolized to ethanol.
q s a e = min ( Y s o × q o , q s )
q s a n = q s q s a e
To shed light on ethanol dynamics, its consumption under aerobic conditions is also considered, prioritizing glucose [79]. Given that (7) holds true, ethanol uptake rates q e a e are calculated as shown in (8). In essence, the min modulator compares whether oxygen demands for ethanol oxidation after glucose consumption ( q o Y o s · q s a e ) Y o e exceed the Monod-type ethanol uptake kinetics q e .
q s < Y s o q o
q e a e = min ( ( q o Y o s q s a e ) Y o e ,   q e )  
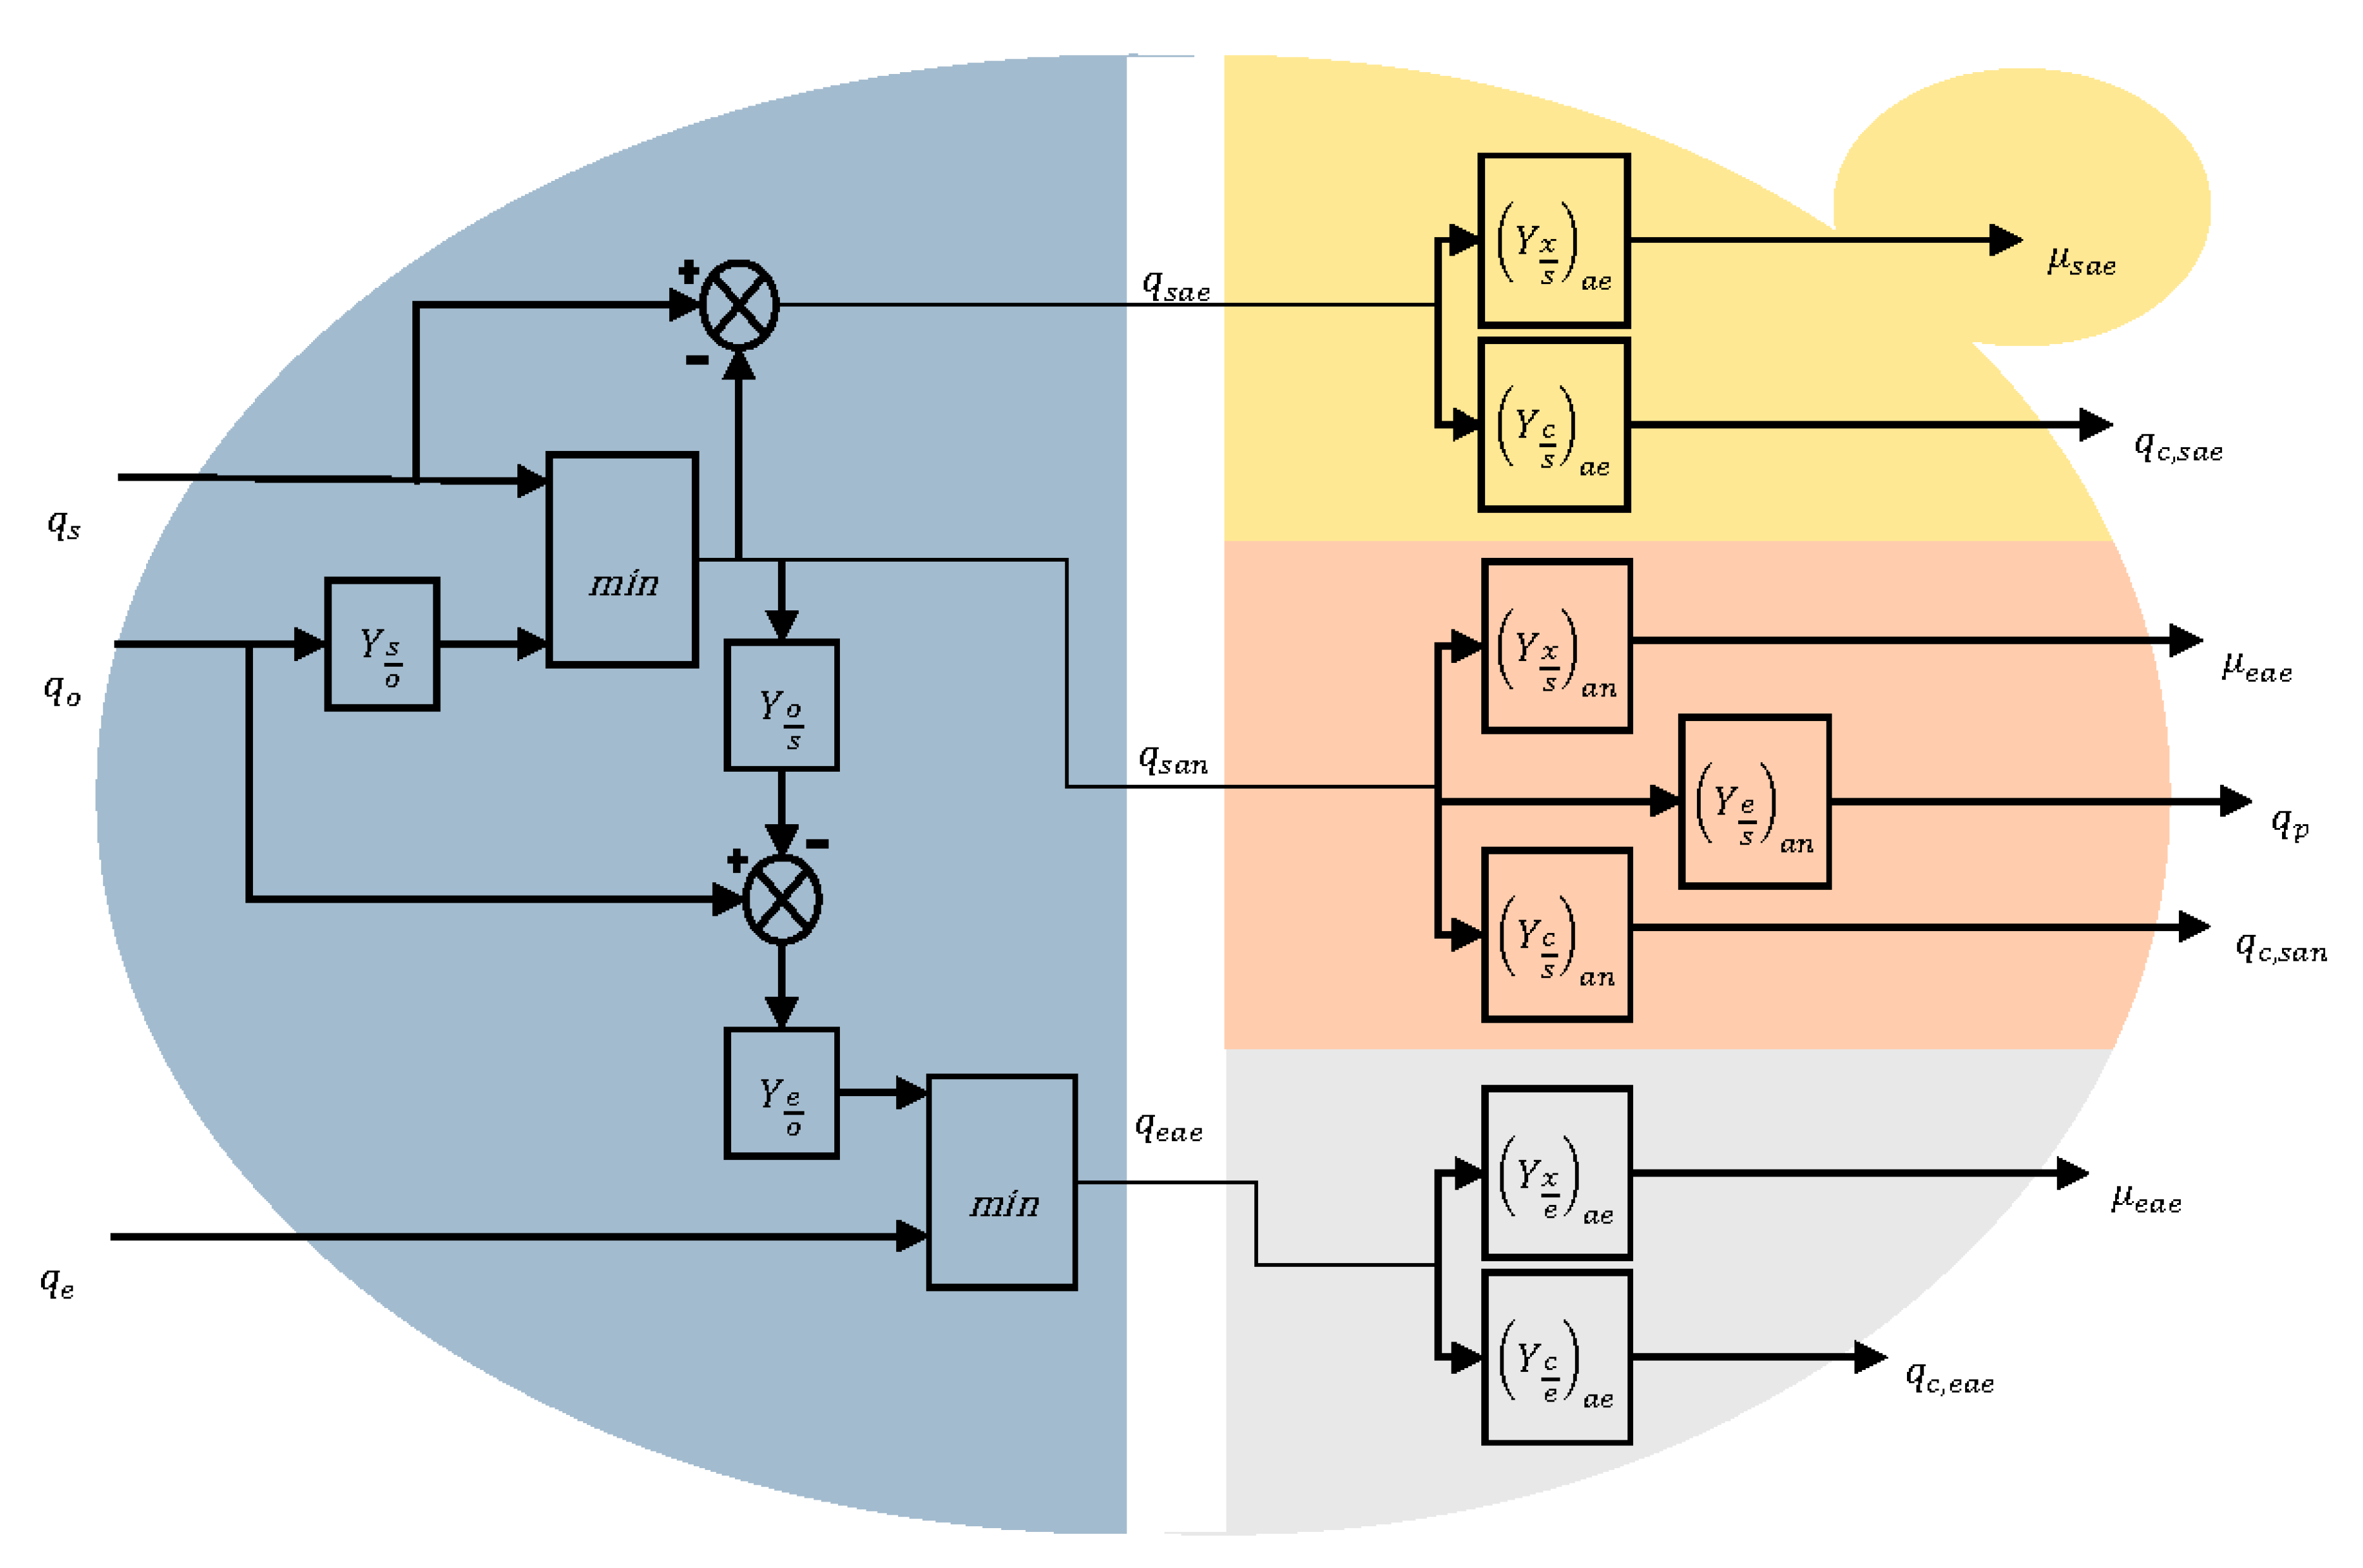
A graphical illustration of respiratory bottleneck is shown in Figure 2. The concentrations are calculated and, using Equations (1)–(3), the uptake rates are calculated, upon which the rest of the model is based. Yields for by-products are stoichiometrically approximated for every reaction.
To reveal the stoichiometry between substrates and products, elemental balances are applied to the process reaction (9), which then results in three different scenarios (10)–(12).
Process reaction
s C H 2 O + o O 2 + n N H 3 C H 1.79 O 0.56 N 0.15 + e C H 3 O 0.5 + c C O 2 + w H 2 O
Process reaction for aerobic growth on glucose ( r s a e )
s C H 2 O + o O 2 + n N H 3 C H 1.79 O 0.56 N 0.15 + c C O 2 + w H 2 O
Process reaction for anaerobic growth on glucose ( r s a n )
s C H 2 O + n N H 3 C H 1.79 O 0.56 N 0.15 + e C H 3 O 0.5 + c C O 2 + w H 2 O
Process reaction for aerobic growth on ethanol ( r e a e )
e C H 3 O 0.5 + o O 2 + n N H 3 C H 1.79 O 0.56 N 0.15 + c C O 2 + w H 2 O
The conservation of mass results in (13). Since all underlying phenomena do not disturb mass or elemental conservation, it is safe to conclude that there is no net conversion of elements. For this purpose, the matrices for elemental composition “E” (14), stoichiometry coefficients “S.C.” (15), and reaction rates “r” (16) are set up.
d ( E · C · V ) d t = E · r · V   ( Volume   of   the   element ) + E · M T R   ( Mass   Transfer   Rate )
E = s o n x e c w C 1 0 0 1 1 1 0 H 2 0 3 1.79 3 0 2 O 1 2 0 0.56 0.5 2 1 N 0 0 1 0.15 0 0 0
r = [ r s i r o i r n i r x i r e i r c i r w i ]
S . C = S . C s a e S . C s a n S . C e a e s s s a e s s a n 0 o o s a e 0 o e a e n n s a e n s a n n e a e x x s a e x s a n x e a e e 0 e s a n e e a e c c s a e c s a n c e a e w w s a e w s a n w e a e
Elemental conservation results in the following system of Equation (17):
E · r = 0
By solving this system based on growth rate and carbon source uptake rate, other rates are calculated for each reaction in the models (18)–(21).
Aerobic   growth   on   glucose :   { r c s a e = 6 r s s a e r x s a e r o s a e = 6 r s s a e 1.05 r x s a e
Anaerobic   growth   on   glucose :   { r c s a n = 2 r s s a n 0.3 r x s a n r e s a n = r s s a n 0.7 r x s a n
Aerobic   growth   on   ethanol :   { r c e a e = 2 r e e a e r x e a e r o e a e = 3 r e e a e 1.05 r x e a e
The carbon source consumption rate is calculated using Equations (5)–(8) to solve the remaining equation for a known biomass concentration. The growth rate is calculated using the yield coefficient taken from the literature [80].

2.4. Mass Transfer

The mass transfer coefficient between the two phases was considered for O 2 , C O 2 , and ethanol (21). A common assumption is to estimate the mass transfer close to the equilibrium state. The gas phase is considered well mixed (zero resistance); hence, using the film theory, one can assume the mass transfer resistance to be on the liquid side of the interface. Moreover, for dilute gases in liquid, Henry’s law (22) is implemented to calculate the equilibrium concentration “C*” on the interface [81,82].
M T R =   k l a   Δ C
C i * = P i H
H is Henry’s constant for the gas component at fermentation temperature (30 °C). k l is modeled by the surface renewal approach [83], a is the bubble surface, and both are known to be dependent on flow characteristics [84]. Mass transfer driving force ( Δ C ) differs for O 2 and C O 2 since the direction of the transport is different, which leads to (23) and (24).
Δ C c = ( C c l i q C c * )
Δ C o = ( C o * C o l i q )
For ethanol stripping, an approach by Löser et al. [85] is implemented in which ethanol transfer to gas phase is investigated. In this way, a partition coefficient (25) linking ethanol concentration in both phases to each other is available, which allows calculation of the mass transfer driving force for ethanol.
K L G = C e l i q C e g a s

3. Results

3.1. Flow Field Validation

For the validation of the represented flow field, several criteria were evaluated. τ 95 was reproduced with a virtual pulse of glucose above the top impeller and by reading its concentration at the probe location, as disclosed in [74], at 0.97 m distance from the bottom. The estimated value in the current work is 186 s, which is in agreement with the results of previous investigations [4,25,74].
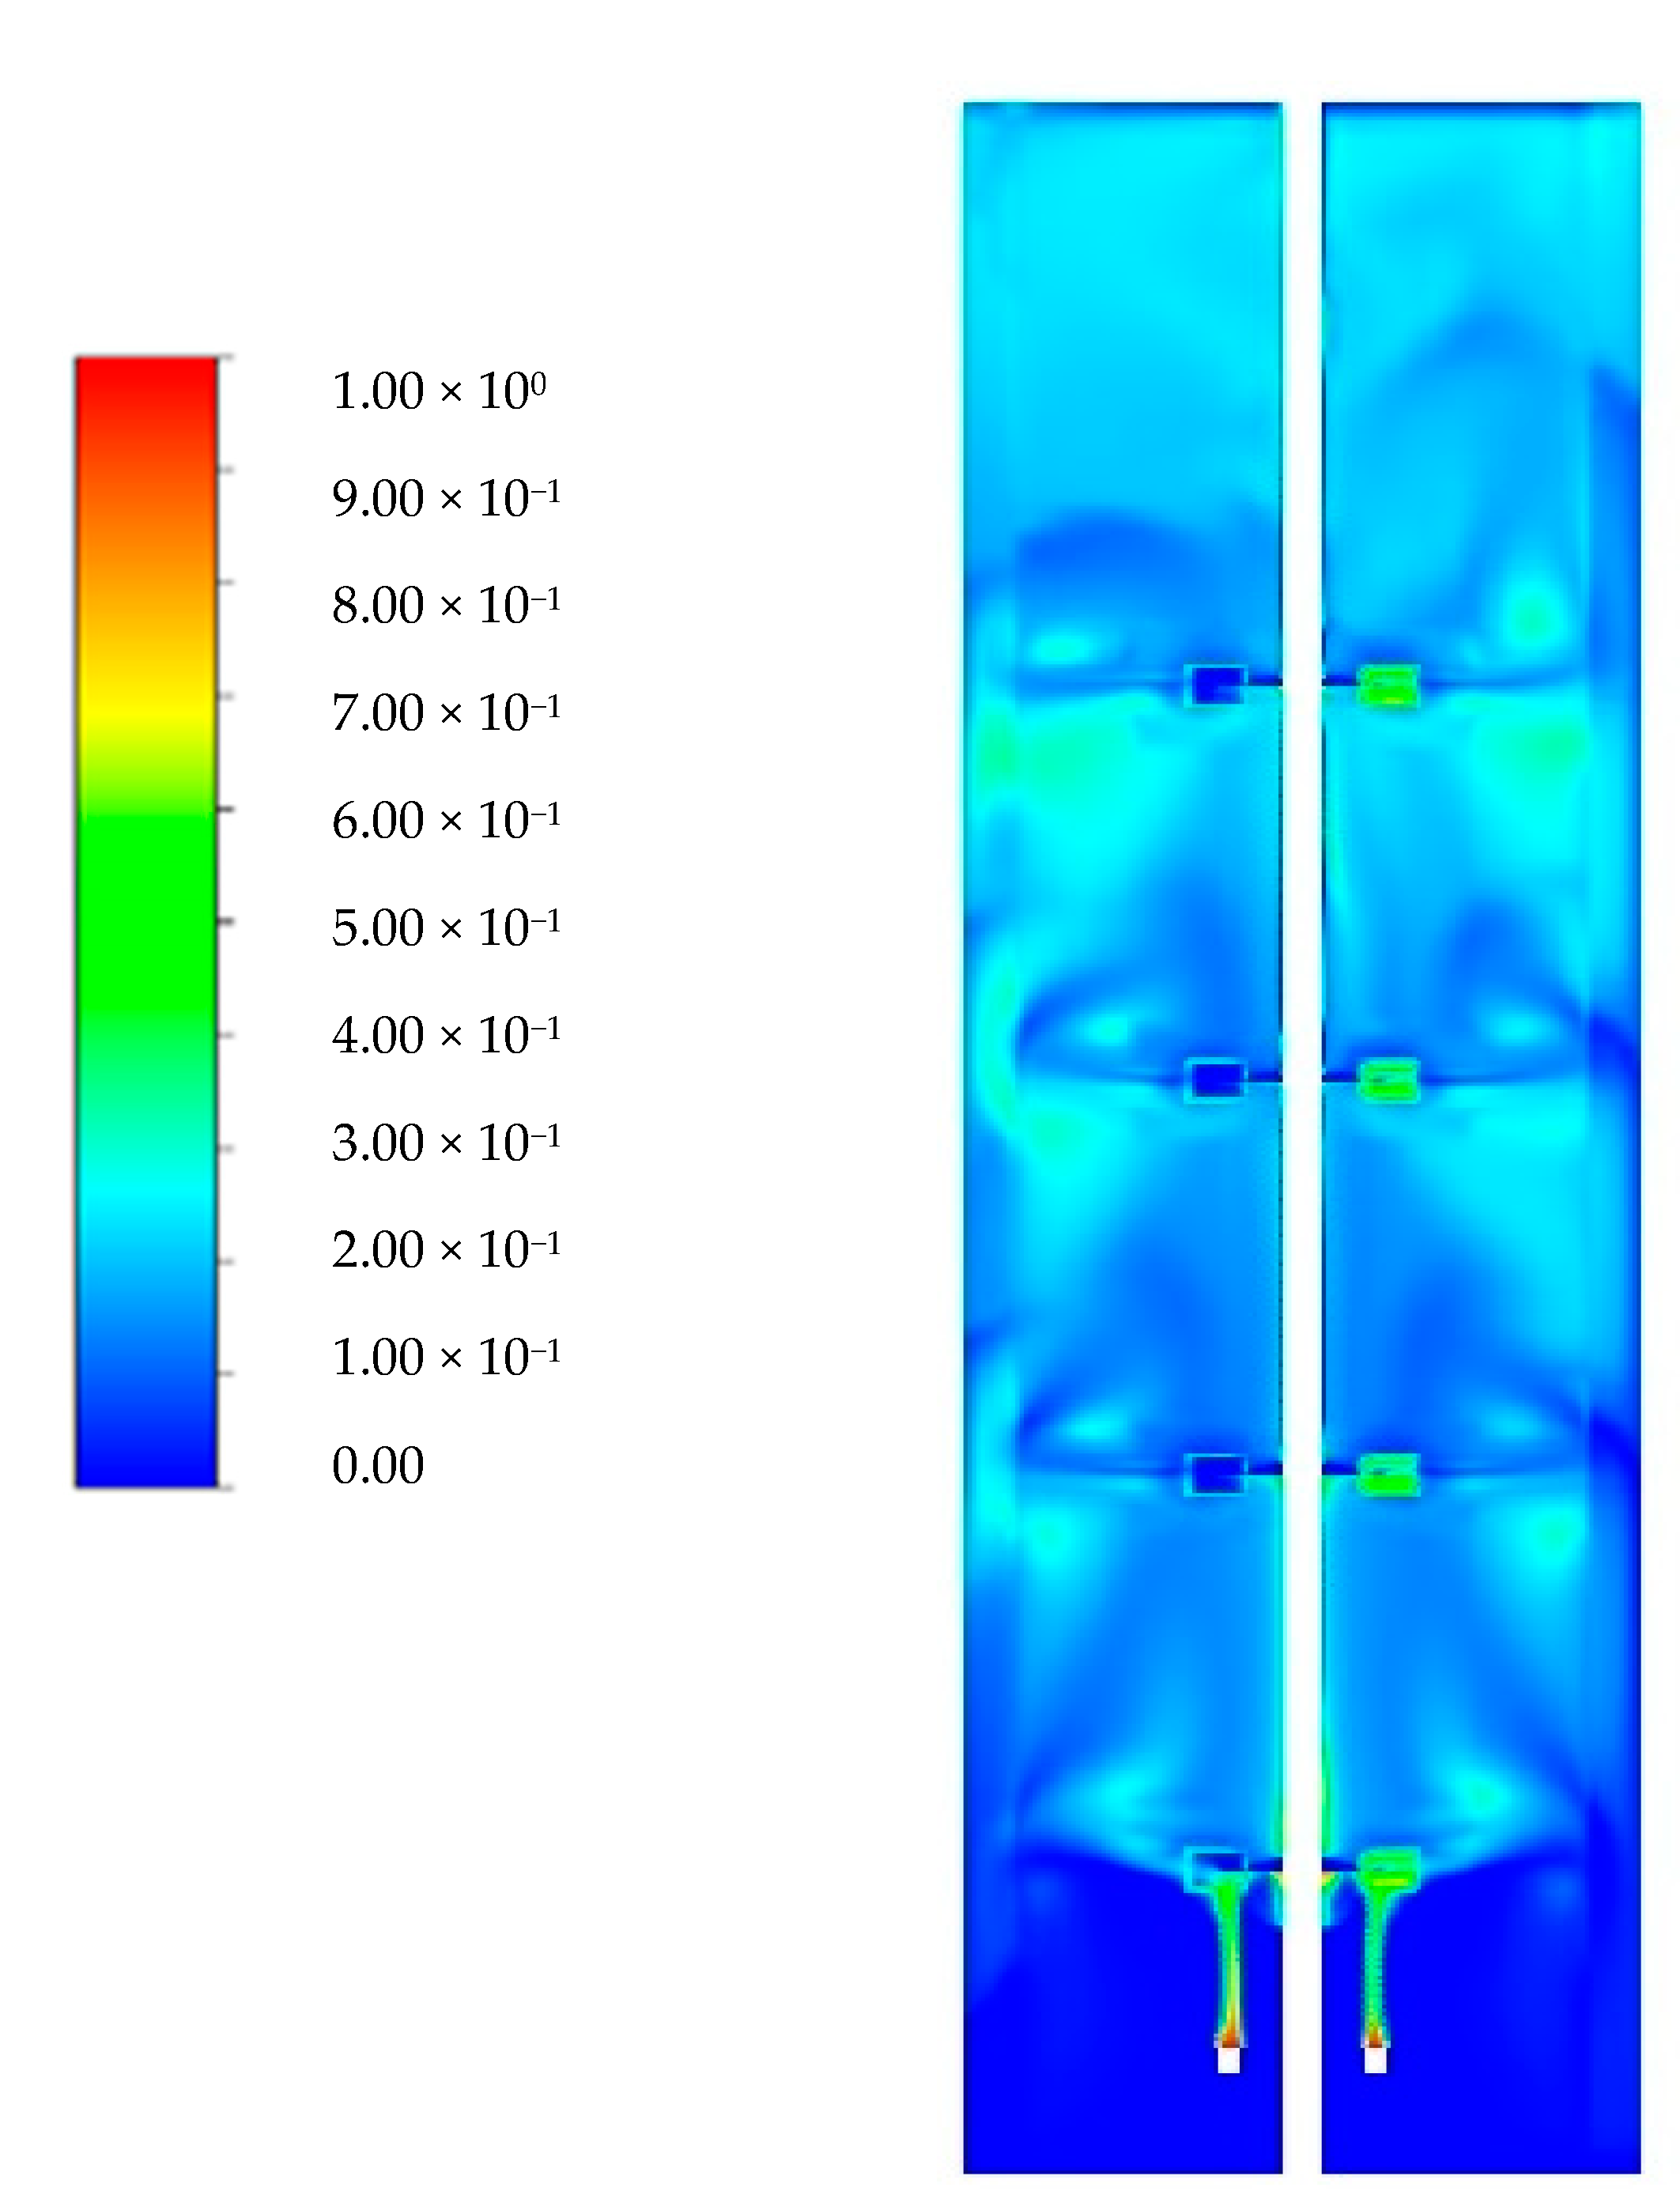
The simulated gas holdup of 19% slightly overpredicts experimental measurements (17.1%) [86] and previous numerical studies (17.6%) [25] but still falls within an acceptable range. In addition to the average holdup, gas distribution of the gas phase plays a crucial role in k l a calculations (Figure 3).
Under said conditions, k l a of 190 h−1 is estimated, which agrees well with the experimental measurements [86].

3.2. Scenario I: Experimental Fermentation

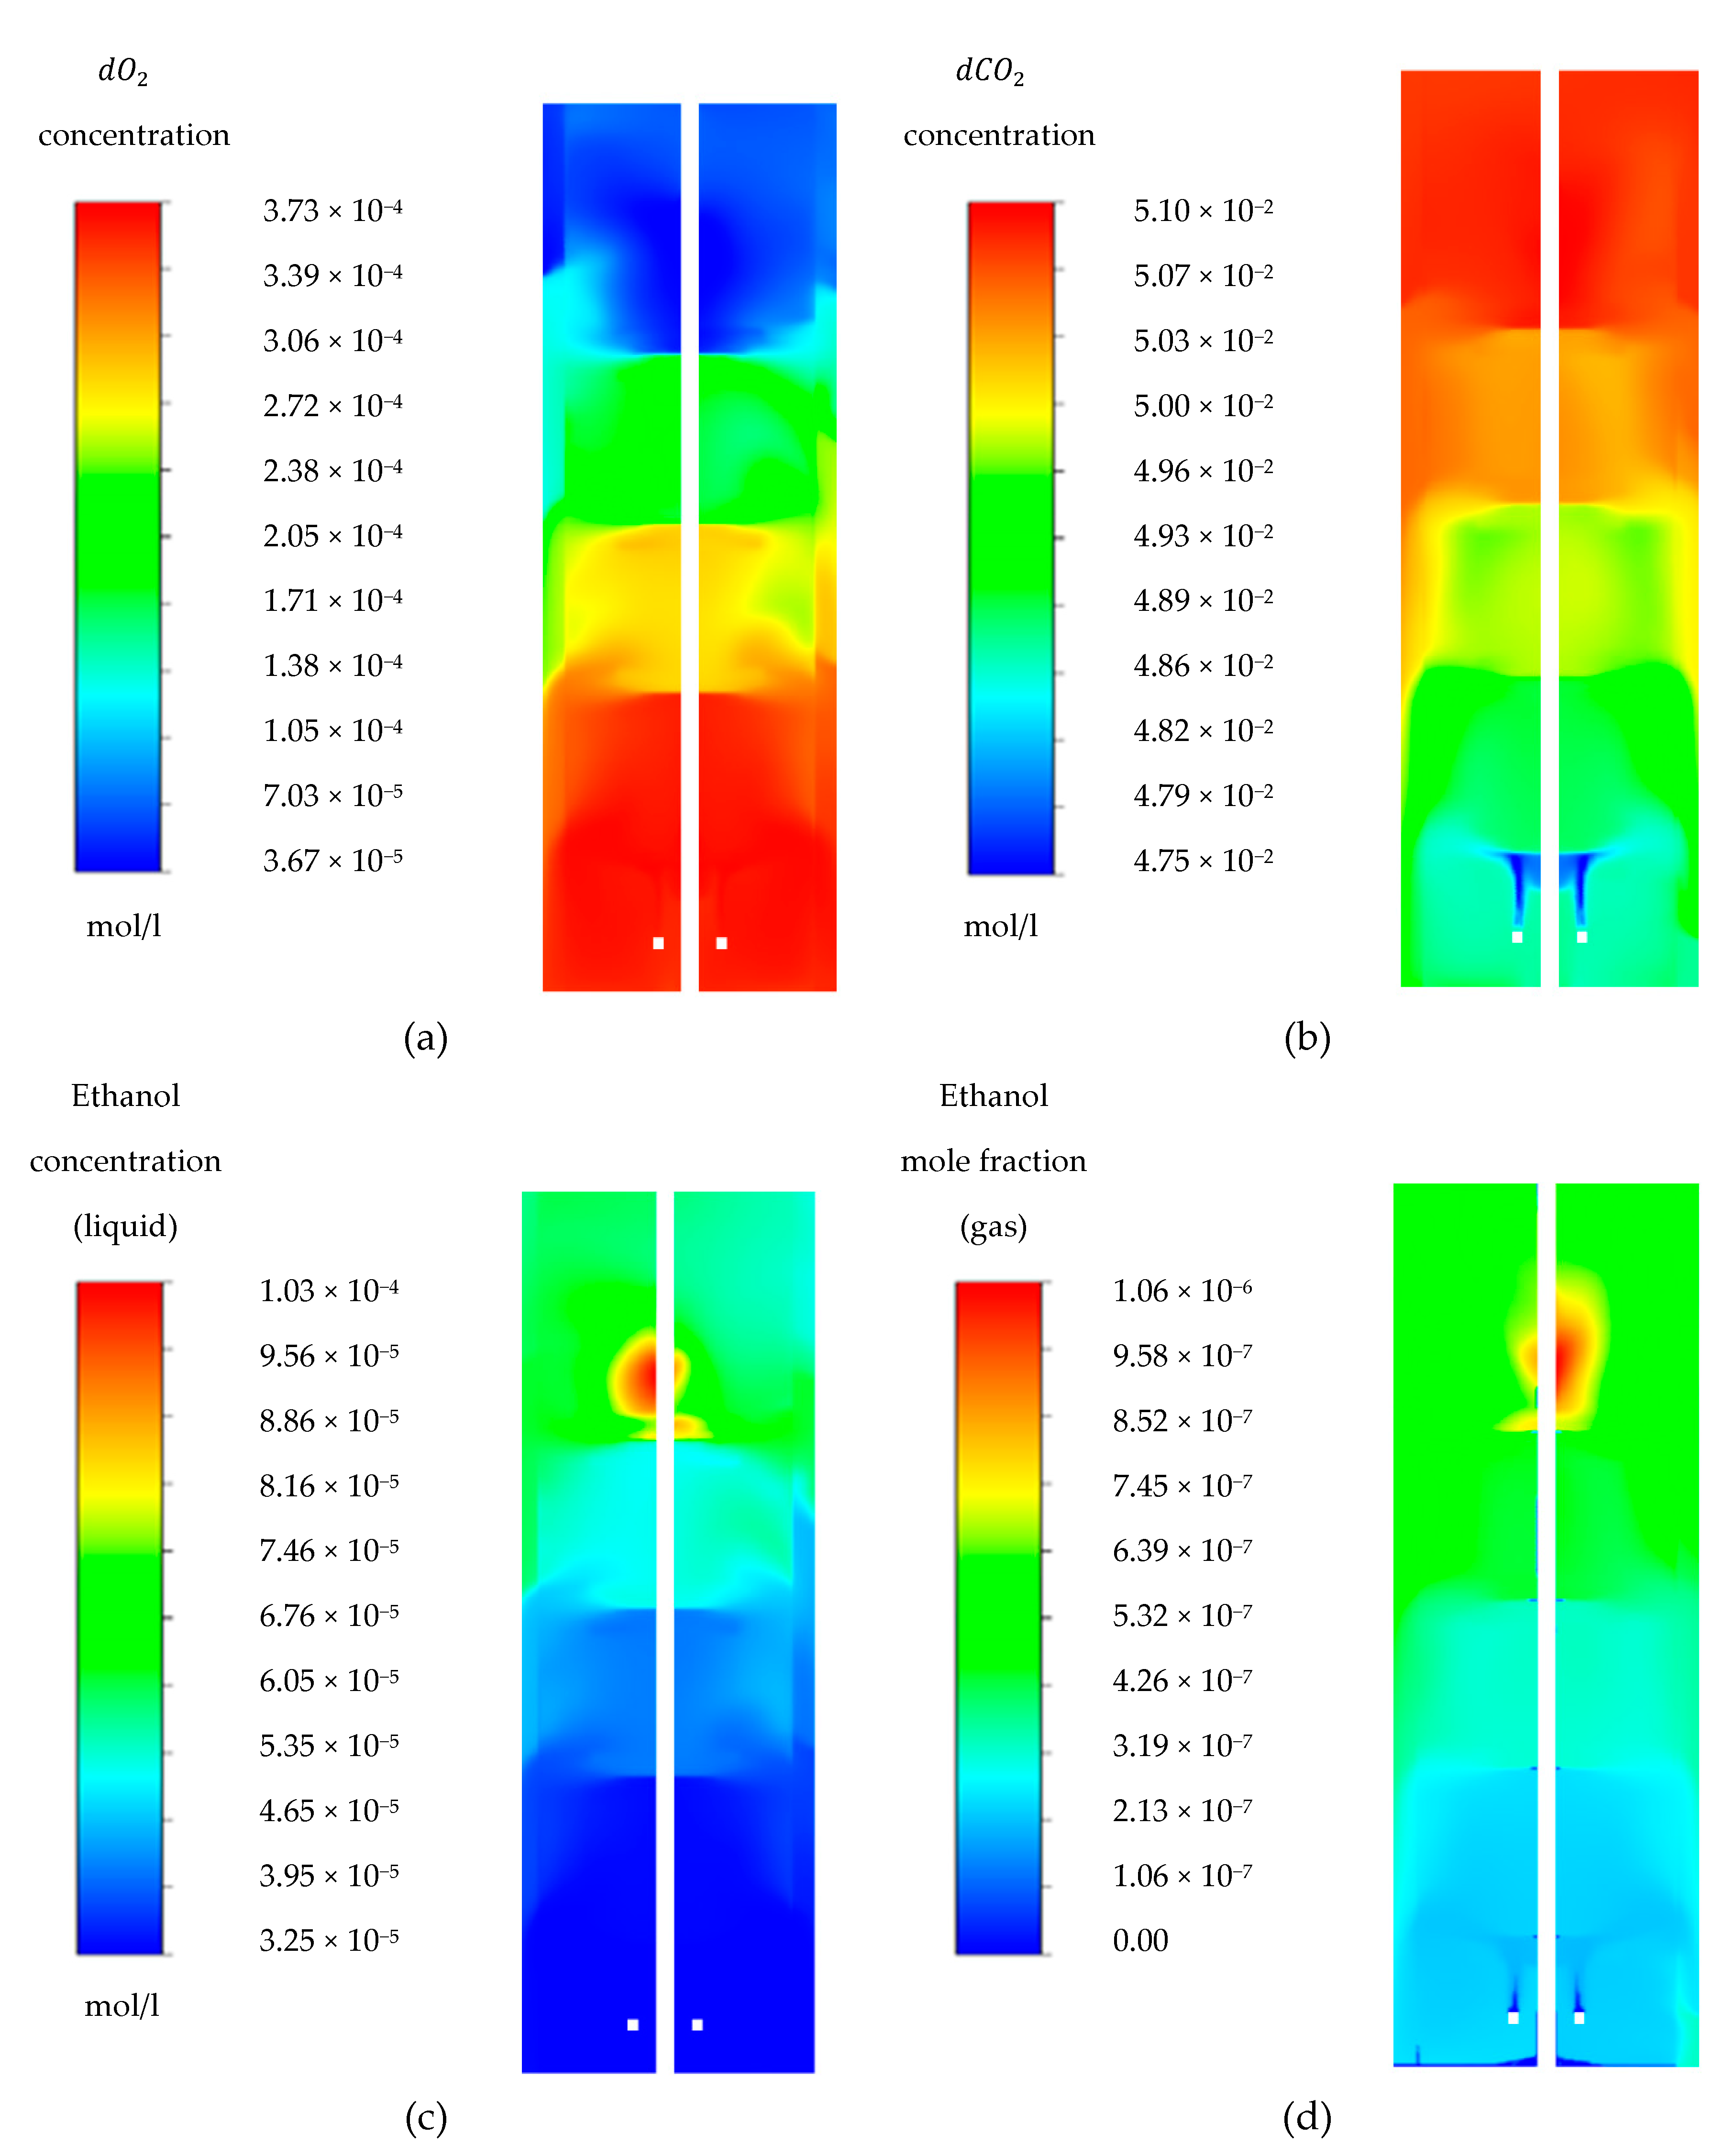
For this scenario, conditions are considered as explained by previous investigations [25,86]. Accordingly, model suitability could be checked. d O 2 concentrations are expected to show high values at the bottom of the tank for mainly three reasons: first, higher hydrostatic pressure increases the solubility of d O 2 . Second, lower metabolic activity of cells should occur due to substrate scarcity, and third, higher fraction of O 2 in gas phase close to the bottom should be observed. In contrast, opposite trends are found close to the feeding point, where the lowest d O 2 of ~3.7 × 10⁻⁵ M (~1.2 ppm) is estimated (Figure 4a). This is an order of magnitude larger than the critical value of ~4.6 × 10⁻⁶ M [87]. Furthermore, the related volume is only a negligible fraction of the entire stirred tank reactor, which gives rise to the fair assumption of “no oxygen limitation” in the bioreactor for given conditions [4,25,86].
d C O 2 concentrations are represented in Figure 4b. Interestingly, only minor d C O 2 gradients occur, varying no more than ±5% from average. Notably, CO2/HCO3 creates a buffering system that consists of around 99% C O 2 at the operational pH 5 [73,88]. Accordingly, the simplifying assumption was made that inorganic carbon only encompasses d C O 2 . The current study snapshots a pseudo-steady state of late phase yeast fermentation [82,89]. Consequently, the reasonable postulation was made that the liquid phase is saturated with respect to d C O 2 . In the gas phase, C O 2 is estimated to reach mole fractions between 2.1 and 2.9%.
Ethanol gradients are more pronounced than those of d C O 2 but less so than d O 2 . The highest values are observed proximate to the feeding point, reflecting the highest cellular product formation and reduced stripping. The lowest titer is found at the bottom of the tank (3.25 × 10⁻⁵ M, Figure 4c,d).

3.3. Scenario II: Protein Production

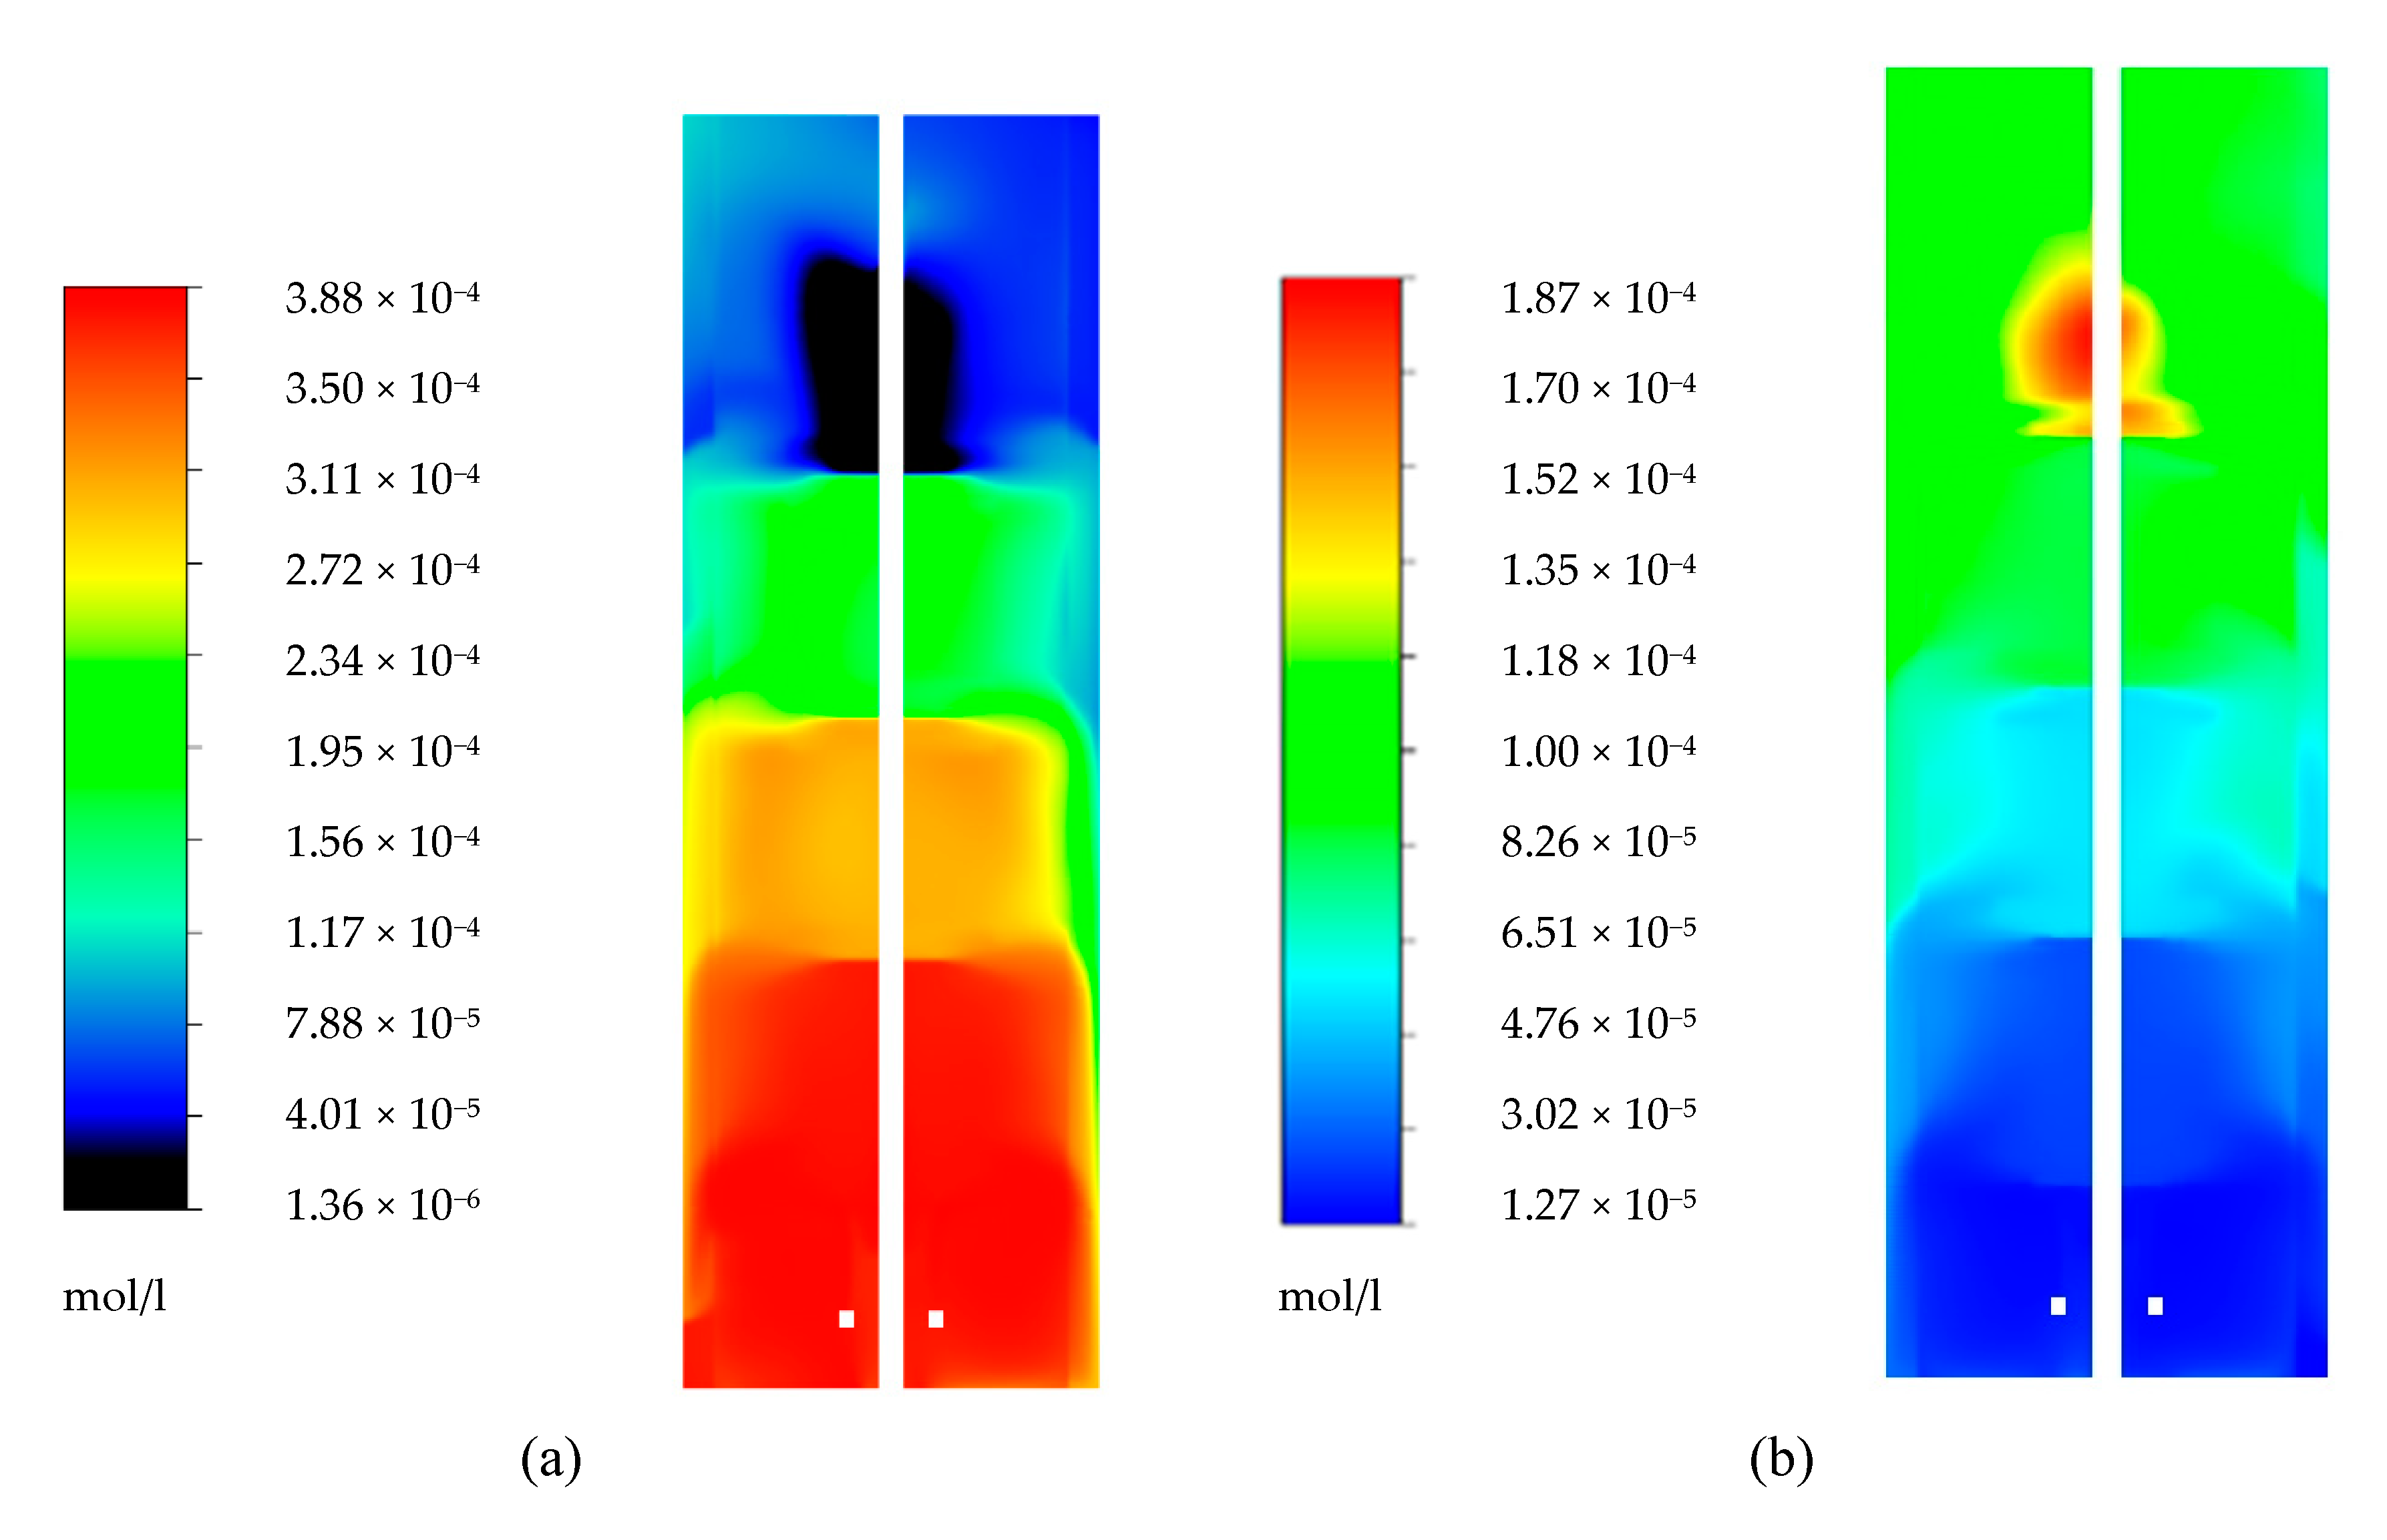
To place the model into a more industrially relevant context, biomass was increased to 25 g/L to imitate protein production [15]. For simplification, putative impacts of increased biomass concentration on the viscosity were neglected [90]. The scenario shows that a significant volume is exposed to oxygen limitation (approximately 0.37 m3) above the top impeller, considering that 10% of saturation d O 2 . d O 2 levels below 4.6 × 10⁻⁶ M were observed in a volume of 0.04 m3, which is below the d O 2 , c r i t according to the available literature [87] (Figure 5a). Notably, elevated viscosity values would have even deteriorated the oxygen supply. Increasing biomass concentrations also increased microbial substrate consumption and product formation rates. As aeration and the energy input of the bioreactor remained equal, gradients for substrates and by-products became more pronounced.
In turn, this affected the ethanol gradient twofold. First, the drop in d O 2 resulted in higher production of ethanol around the feeding point. Second, higher biomass concentration in the tank increased the volumetric ethanol consumption, causing lower ethanol concentrations at the bottom of the tank, as observed in Figure 5b.

4. Discussion

4.1. Glucose Gradient

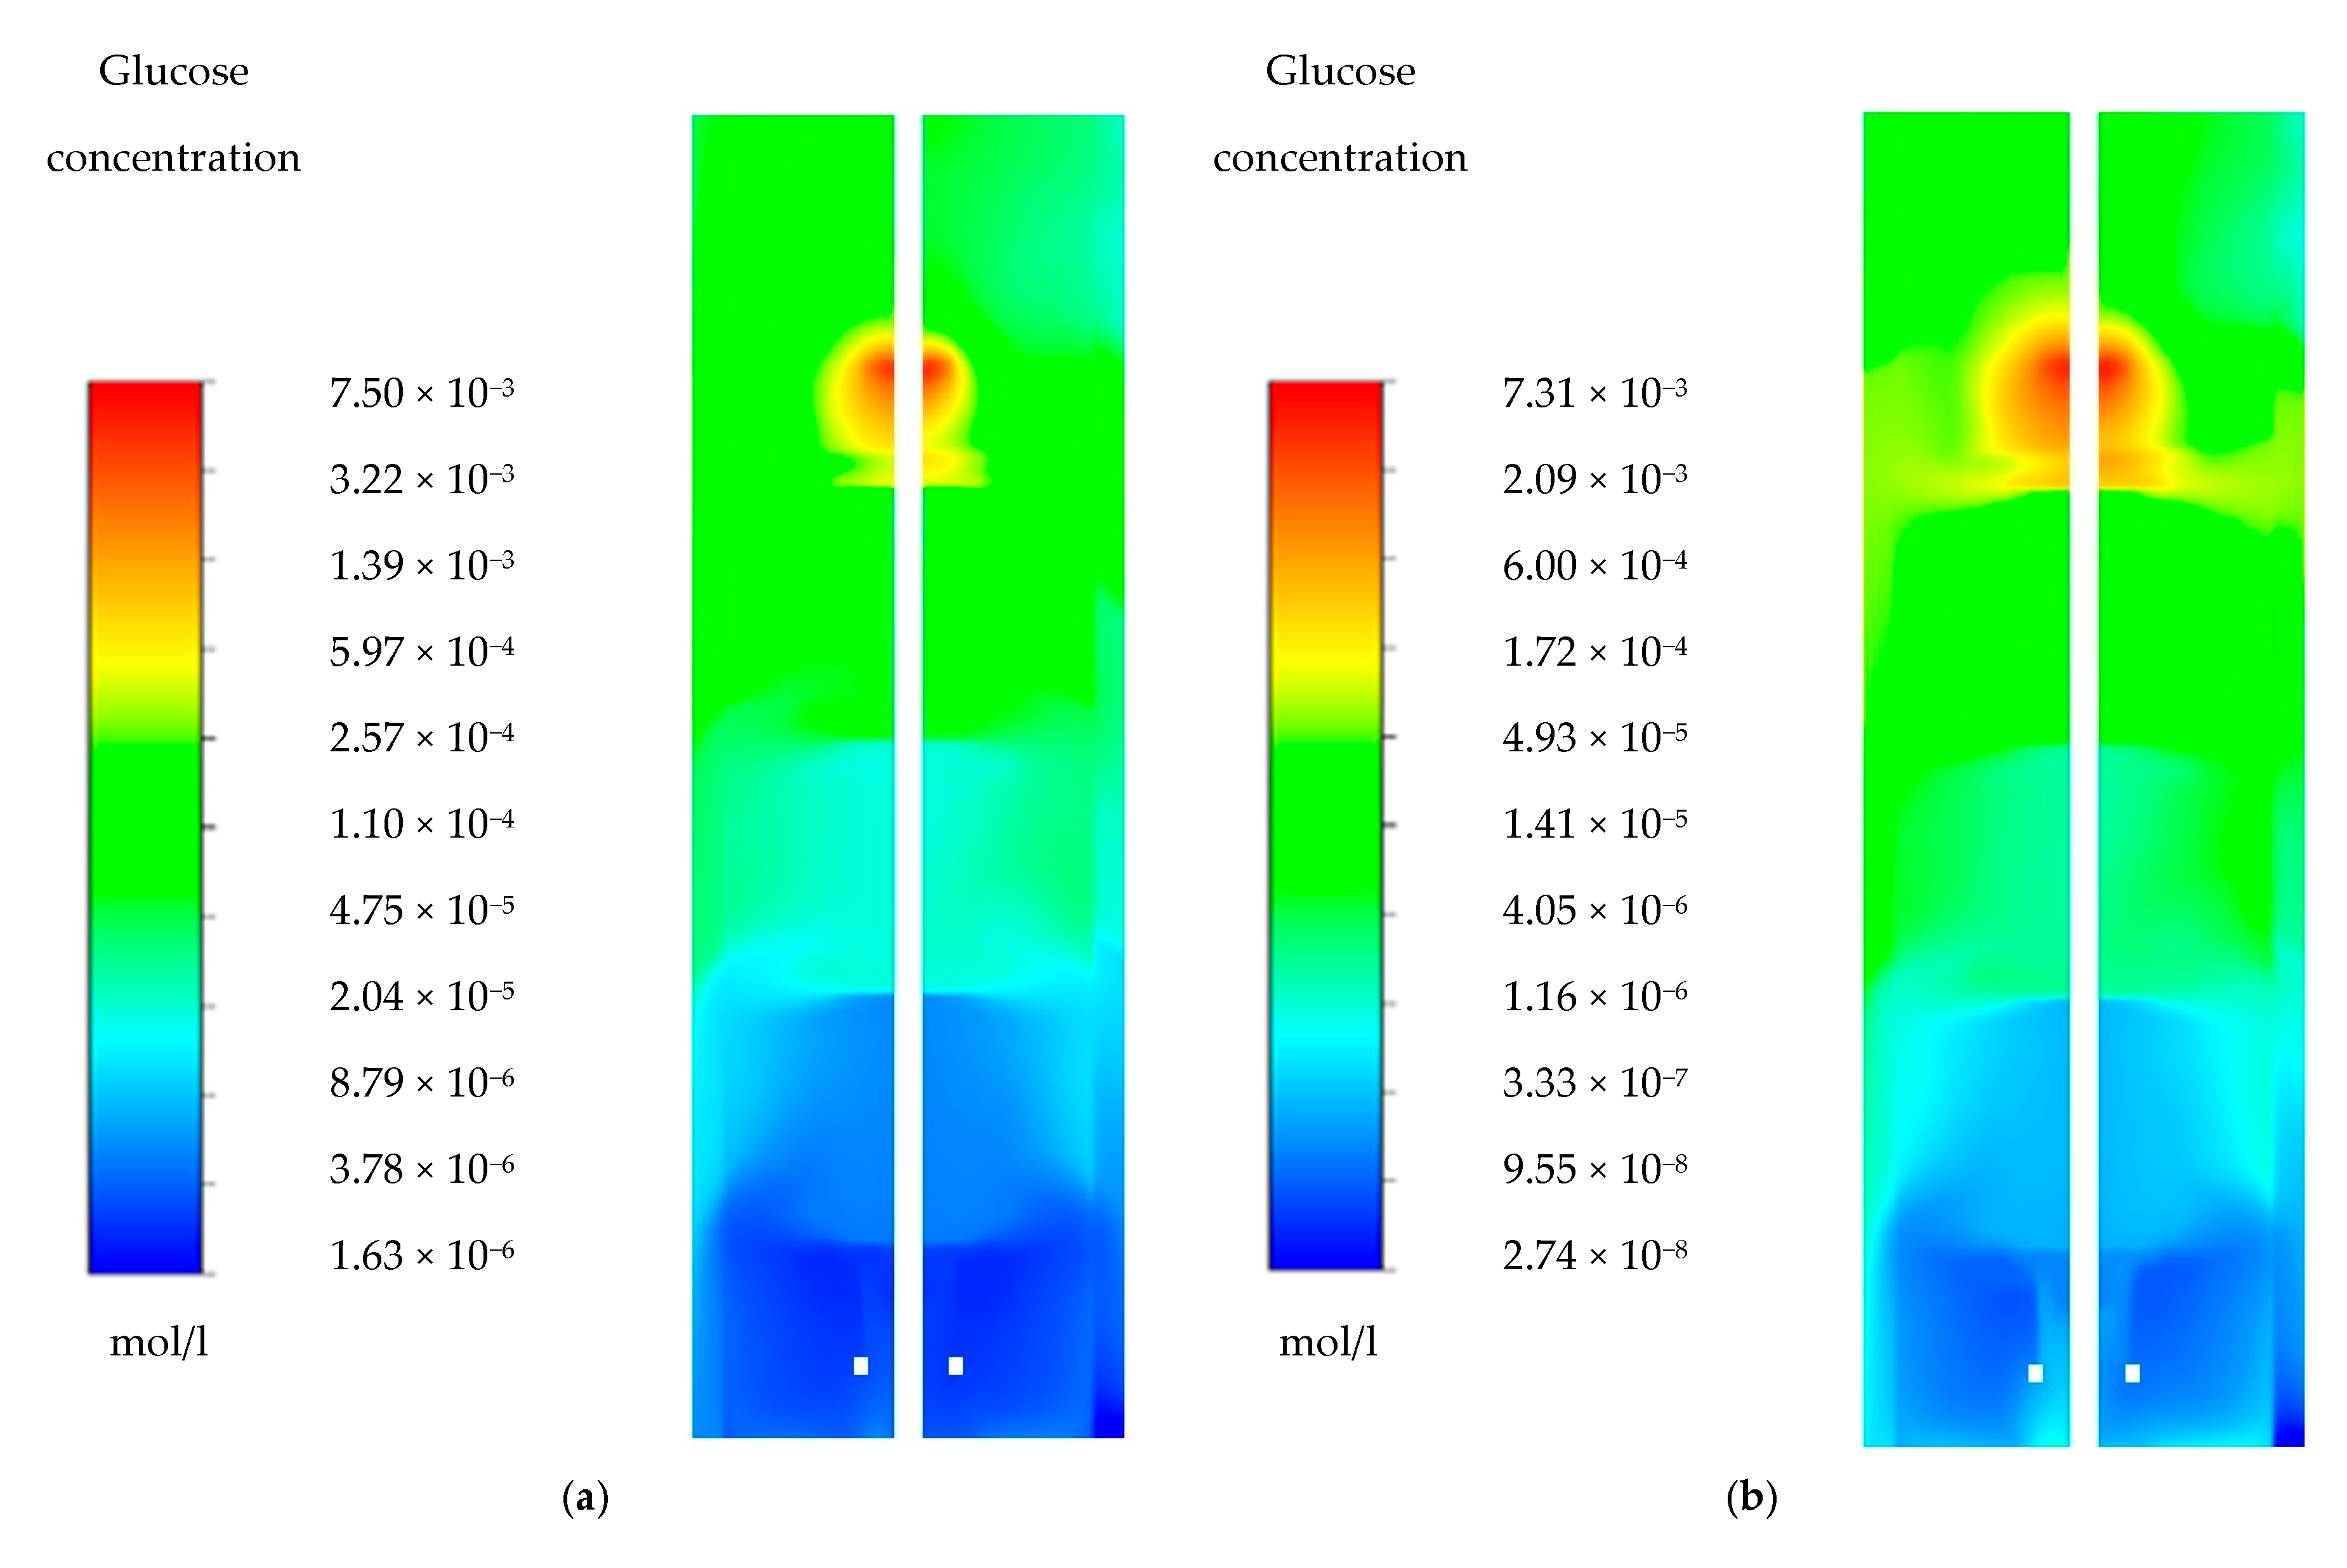
Figure A1 (Appendix A) shows the anticipated heterogeneous glucose distribution, disclosing a hotspot of high glucose concentrations close to the inlet and low values at the bottom of the bioreactor. As expected, the resulting gradients are more pronounced for the “25 g/L biomass” case than for 10 g/L. Interestingly, studies [4,73] provided experimental values sampled from the top, middle, and bottom regions of the bioreactor (Table A1). Notably, sampling was performed at the wall of the bioreactors, only giving a very restricted resolution of local conditions. On the contrary, simulated values of scenario I and II indicate average concentrations of total reactor slices calculated at the same height. Consequently, the comparison of simulated predictions with experimental values is intrinsically biased. Nevertheless, the comparison shows that scenario II comes closest to the measurements. At the top, high glucose levels were equally predicted by simulation and measurements. Notably, each value indicates saturated glucose uptake. The strongest deviations are found for the bottom region, where simulations overestimate the glucose consumption. Consequently, model refinements should be considered in the next generation of metabolic models by implementing the co-consumption of intracellular buffers (such as trehalose) as an additional, not yet considered, carbon source in nutrient-limiting regions.

4.2. Ethanol Gradient

To the best of our knowledge, this study represents the first example of considering ethanol formation and re-consumption in a CFD-linked large-scale bioreactor simulation. Figure 4c indicates the well-distributed presence of ethanol in the entire reactor, giving rise to the assumption that ethanol-based growth should be possible in large parts of the bioreactor. Based on the results, growth on ethanol is expected to take place in 97% bioreactor. The conclusion is in accordance with the work of Noorman [4], who anticipated that no real “starvation” zone might exist because of the occurrence of ethanol. The finding does have implications for the design of proper scale-down approaches [63,65,91] as suitable settings ideally should consider the co-substrate ethanol too. For scenario II, the average ethanol concentration was approximately 26% lower (3.17 × 10⁻⁵ M) compared to scenario I (5 × 10⁻⁵ M). Nevertheless, more than 90% of the tank may offer sufficient ethanol uptake within seconds according to a radiocarbon study [92]. Such levels might be enough to prevent an actual starvation scenario.

4.3. Oxygen Gradient

A conventional approach for estimating the occurrence of gradients is the comparison of critical timescales τ for substrate supply τ s s u p p l y versus substrate consumption τ s c o n s . Whereas the first may be approximated by the mixing time τ m i x or circulation time τ c i r c u l a t i o n , the latter resembles the quotient of average substrate concentration divided by volumetric substrate consumption rates (26). Regarding d O 2 , scenarios 1 and 2 anticipate the occurrence of gradients because τ o c o n s , 1 and τ o c o n s , 2 showing ~28 s and ~30 s are smaller than τ c i r c u l a t i o n ≈ 47 s ( τ m i x = 186 s). Indeed, the expectation is met by the CFD simulations.
τ o c o n s = C o ( Y o s · q s a e + Y o e · q e a e ) × C x
Assuming average values, this approach theoretically indicates that assuming the non-limiting role of d O 2 for scenario I is a reasonable approximation for the whole tank, other than a small region around the feeding point, where the d O 2 concentration is slightly above 3.67 × 10⁻⁵ M. The threshold for aerobic growth d O 2 , c r i t for S. cerevisiae is given as 4.6 × 10⁻⁶ M [87]. This allows us to make a distinction between the ethanol production caused by overflow metabolism or d O 2 limitation. Accordingly, no d O 2 limitation is observed in scenario I as mentioned; hence, all ethanol production in this case is attributed to overflow metabolism, which occurs in 1.63 m3 of the fermenter. However, this is not the case for scenario II, where 10% of the ethanol production takes place in regions with d O 2 below the critical value. The total volume associated with ethanol production in scenario II is 0.3 m3.

4.4. Carbon Dioxide Gradient

Although the d C O 2 gradient is practically absent when compared to those for d O 2 , ethanol, and glucose (Appendix A), the key observation is the generally high level inside the bioreactor due to overpressure applied in the headspace plus the hydrostatic pressure from the liquid column. This should be accounted for in experimental scale-down. It should be noticed that by using a black-box model, some inherent flaws of such models affect the results. While such models could prove to be insightful for a specific case, the assumptions upon which the model is founded limit the generalization. In this case, the process reaction (6) considers d C O 2 only as a product of a single reaction. However, multiple decarboxylating reactions exist in the cellular metabolism, showing variable activity [93,94]. This intrinsic feature needs to be included if one wishes to reproduce the respiratory quotient (RQ). Despite this, the average ethanol consumption rate is an order of magnitude smaller than the average glucose consumption rate and, as a result, an RQ value of around 1.1 is achieved. Adding another layer of detail to the biokinetic model by including lumped reactions and metabolite pools [95] might be an interesting step forward. This might be possible by combining multi-reaction models like the one used in this work with lumped metabolic models [95,96]. From another perspective, d C O 2 creates a carbonate system in the fluid and within the cell which alters the cytosolic pH and hence induces stress and increases the cellular maintenance [64,73,97] or alters the metabolism based on gas composition [98]. Based on the actual process, one can decide to include some or all of the equilibrium reaction, but this does not fall within the scope of this work since, at pH 5, more than 99% is in the form of d C O 2 . Nevertheless, using a comparatively simple approach, the results indicate that the d C O 2 gradient is rather weak compared to other species. At such levels, d C O 2 inhibition inevitably takes place at industrial scale and impacts the transcription according to recent findings [37]. Our results indicate that while fluctuations in other concentrations might be experienced by cells on short timescales, the same does not hold true for d C O 2 , where cells are exposed to high d C O 2 for long timescales. The latter requires different experimental set-ups for scale-down tests.

5. Conclusions

This work suggests that in the case of baker’s yeast production, ethanol production is inevitable around the feeding point—in this case, positioned at the top of the vessel. This causes lower growth rates above the top impeller and hence hinders the overall growth rate over the bioreactor volume and is not desirable when the final product is the biomass itself. It is possible to distinguish the ethanol production due to overflow metabolism (Crabtree effect) from d O 2 limitation (Pasteur effect). Such information can prove crucial for process optimization. d C O 2 gradients might not be as pronounced as the other species, but the fact that, in both scenarios, it reaches saturation levels hints at C O 2 stripping under real industrial conditions [4]. This points out the fact that, unlike glucose, ethanol, and d O 2 , where fluctuations might trigger a stress response, d C O 2 stress is different in nature and should be evaluated by long-term scale-down experiments. The results further suggest that a real starvation region in the lower parts of the tank might not exist because of the presence of ethanol compensating for glucose shortage. Accordingly, scale-down experiments should consider this impact, even investigating the putative benefits for long-term protein formation [15].

Author Contributions

Funding acquisition, R.T.; Investigation, C.S.S.H.; Methodology, C.S.S.H.; Resources, R.T.; Software, R.T.; Supervision, R.T.; Writing—original draft, C.S.S.H.; Writing—review & editing, C.S.S.H., C.H., H.N. and R.T. All authors have read and agreed to the published version of the manuscript.

Funding

Authors are thankful to Höchstleistungsrechenzentrum Stuttgart (HLRS) for large-scale computations and to the University of Stuttgart for providing the required funds. This work was supported by the German Federal Ministry of Education and Research (BMBF), grant number: FKZ 031B0629. C.S.S.H. is supported by ERA CoBioTech/EU H2020 project (grant 722361) “ComRaDes”, a public–private partnership between the University of Stuttgart, TU Delft, University of Liege, DSM, Centrient Pharmaceuticals and Syngulon. C.H. and H.N. are paid employees of the DSM Biotechnology Center.

Acknowledgments

Authors acknowledge the insightful comments of Wouter van Winden in the process of manuscript preparation.

Conflicts of Interest

The authors declare no conflict of interest.

Nomenclature

CConcentration matrix
C i * Concentration at the interfacemol/L
C e Ethanol concentrationmol/L
C i l i q Concentration of component “i” in liquid phasemol/L
C o Oxygen concentrationmol/L
C s Glucose concentrationmol/L
C x Biomass concentrationg/L
d b Bubble diameterm
d C O 2 Concentration of dissolved carbon dioxidemol/L
d O 2 Concentration of dissolved oxygenmol/L
d O 2 c r i t Critical concentration of dissolved oxygenmol/L
EElemental composition matrix
HHenry coefficientl·atm/mol
kTurbulent kinetic energym2/s2
K L / G Partition coefficient-
K e Monod constant for ethanolmol/L
k l a Mass transfer coefficient1/h
K o Monod constant for oxygenmol/L
K s Monod constant for glucosemol/L
MTRMass transfer ratemol/L/s
P i Partial pressure of the component “i” in gas phaseatm
q e Specific ethanol uptake ratemol/gx/s
q e a e Specific ethanol uptake rate under aerobic conditionsmol/gx/s
q e m a x Maximum specific ethanol uptake ratemol/gx/s
q o Specific oxygen uptake ratemol/gx/s
q o m a x Maximum specific oxygen uptake ratemol/gx/s
qsSpecific glucose uptake ratemol/gx/s
q s a e Specific glucose uptake rate for aerobic metabolismmol/gx/s
q s a n Specific glucose uptake rate for anaerobic metabolismmol/gx/s
q s m a x Maximum specific glucose uptake ratemol/gx/s
rReaction rate matrix
r i e a e Reaction rate of component “i” when growing aerobically on ethanolmol/L/s
r i s a e Reaction rate of component “i” when growing aerobically on glucosemol/L/s
r i s a n Reaction rate of component “i” when growing anaerobically on glucosemol/L/s
S.C.Stoichiometry coefficients matrix
τ c i r c Circulation times
τ m i x Mixing times
τ i c o n s Consumption timescale of component “i”s
τ i s u p p l y Supply timescale of component “i”s
VVolumem3
Y c s a e Carbon dioxide yield (aerobic) per mole substratemol/mol
Y c e a e Carbon dioxide yield (aerobic) per mole ethanolmol/mol
Y c s a n Carbon dioxide yield (anaerobic) per mole substratemol/mol
Y e s a n Ethanol yield (anaerobic) per mole substratemol/mol
Y o e Oxygen yield per mole ethanolmol/mol
Y o s Oxygen yield per mole glucosemol/mol
Y s o Substrate yield per mole oxygenmol/mol
Y x e a e Biomass yield (aerobic) per mole ethanolmol/mol
Y x s a e Biomass yield (aerobic) per mole glucosemol/mol
Y x s a n Biomass yield (anaerobic) per mole glucosemol/mol
ΔCconcentration driving forcemol/L
εdissipation rate of turbulent kinetic energym2/s3
νKinematic viscositym2/s
ρDensitykg/m3

Abbreviations

cAMPCyclic adenosine monophosphate
CFDComputational fluid dynamics
MRFMultiple reference frames
QUICKQuadratic Upstream Interpolation for Convective Kinematics
RANSReynolds-averaged Navier–Stokes
RQRespiratory quotient
SIMPLESemi-Implicit Method for Pressure Linked Equations
TRYTiter, rate, yield

Appendix A. Glucose Gradients

Figure A1. Glucose gradients with (a) 10 g/L and (b) 25 g/L biomass (logarithmic colormap).
Processes 08 01554 g0a1
As expected, a strong gradient for glucose as the main substrate exists in both cases, as shown in Figure A1, and also aligned with previous efforts [4,25,74]. Using a similar approach to Section 4.2. for glucose (A1) gives a timescale for substrate consumption of 7 and 17 s for 25 /L and 10 g/L biomass concentration, respectively. This still falls short of the circulation time τ c i r c u l a t i o n of approximately 47 s, meaning that supply is slower than the demand.
τ s c o n s = C s ( q s a e + q s a n ) × C x
Table A1. Comparison of glucose concentration at probe location (Top: 6.35 m, Mid.: 3.9 m, Bot.: 0.97 m from the bottom) from experimental (light blue 10 g/L biomass concentration) and simulation (light orange 10 g/L biomass concentration, orange 25 g/L biomass concentration) results from the literature and this work.
Glucose Concentration (µmol/L)
[4][74][25]This Work
Scenario IScenario II
Probe locationTop199222455356250
Mid.91.662.29732.656
Bot.4028.323.84.152.55
It is worth noticing the glucose concentration predicted in this work is in the same order of magnitude (Table A1), but it drops to concentrations that are below measured quantities. This could be an interesting topic for further investigations.

References

  1. Suarez-Mendez, C.; Sousa, A.; Heijnen, J.; Wahl, A. Fast “Feast/Famine” Cycles for Studying Microbial Physiology Under Dynamic Conditions: A Case Study with Saccharomyces cerevisiae. Metabolites 2014, 4, 347–372. [Google Scholar] [CrossRef]
  2. Suarez-Mendez, C.A.; Ras, C.; Wahl, S.A. Metabolic adjustment upon repetitive substrate perturbations using dynamic 13C-tracing in yeast. Microb. Cell Fact. 2017, 16, 1–14. [Google Scholar] [CrossRef] [Green Version]
  3. Kresnowati, M.T.A.P.; Van Winden, W.A.; Van Gulik, W.M.; Heijnen, J.J. Energetic and metabolic transient response of Saccharomyces cerevisiae to benzoic acid. FEBS J. 2008, 275, 5527–5541. [Google Scholar] [CrossRef]
  4. Noorman, H. An industrial perspective on bioreactor scale-down: What we can learn from combined large-scale bioprocess and model fluid studies. Biotechnol. J. 2011, 6, 934–943. [Google Scholar] [CrossRef]
  5. Wang, G.; Haringa, C.; Noorman, H.; Chu, J.; Zhuang, Y. Developing a Computational Framework To Advance Bioprocess Scale-Up. Trends Biotechnol. 2020, 1–11. [Google Scholar] [CrossRef]
  6. Zieringer, J.; Wild, M.; Takors, R. Data-Driven In-silico Prediction of Regulation Heterogeneity and ATP Demands of Escherichia coli in Large-scale Bioreactors. Biotechnol. Bioeng. 2020, bit.27568. [Google Scholar] [CrossRef] [PubMed]
  7. Morchain, J.; Pigou, M.; Lebaz, N. A population balance model for bioreactors combining interdivision time distributions and micromixing concepts. Biochem. Eng. J. 2017, 126, 135–145. [Google Scholar] [CrossRef]
  8. Linkès, M.; Fede, P.; Morchain, J.Ô.; Schmitz, P. Numerical investigation of subgrid mixing effects on the calculation of biological reaction rates. Chem. Eng. Sci. 2014, 116, 473–485. [Google Scholar] [CrossRef] [Green Version]
  9. Haringa, C.; Tang, W.; Wang, G.; Deshmukh, A.T.; Van Winden, W.A.; Chu, J.; Van Gulik, W.M.; Heijnen, J.J.; Mudde, R.; Noorman, H. Computational fluid dynamics simulation of an industrial, P. chrysogenum fermentation with a coupled 9-pool metabolic model: Towards rational scale-down and design optimization. Chem. Eng. Sci. 2018, 175, 12–24. [Google Scholar] [CrossRef]
  10. Haringa, C.; Mudde, R.F.; Noorman, H.J. From industrial fermentor to CFD-guided downscaling: What have we learned? Biochem. Eng. J. 2018, 140, 57–71. [Google Scholar] [CrossRef] [Green Version]
  11. Lapin, A.; Müller, D.; Reuss, M. Dynamic behavior of microbial populations in stirred bioreactors simulated with Euler-Lagrange methods: Traveling along the lifelines of single cells. Ind. Eng. Chem. Res. 2004, 43, 4647–4656. [Google Scholar] [CrossRef]
  12. Wright, M.R.; Bach, C.; Gernaey, K.V.; Krühne, U. Investigation of the effect of uncertain growth kinetics on a CFD based model for the growth of, S. cerevisiae in an industrial bioreactor. Chem. Eng. Res. Des. 2018, 140, 12–22. [Google Scholar] [CrossRef]
  13. Wang, G.; Haringa, C.; Tang, W.; Noorman, H.; Chu, J.; Zhuang, Y.; Zhang, S. Coupled metabolic-hydrodynamic modeling enabling rational scale-up of industrial bioprocesses. Biotechnol. Bioeng. 2020, 117, 844–867. [Google Scholar] [CrossRef]
  14. Lara, A.R.; Galindo, E.; Ramírez, O.T.; Palomares, L.A. Living with heterogeneities in bioreactors: Understanding the effects of environmental gradients on cells. Mol. Biotechnol. 2006, 34, 355–381. [Google Scholar] [CrossRef]
  15. Wright, N.R.; Wulff, T.; Palmqvist, E.A.; Jørgensen, T.R.; Workman, C.T.; Sonnenschein, N.; Rønnest, N.P.; Herrgård, M.J. Fluctuations in glucose availability prevent global proteome changes and physiological transition during prolonged chemostat cultivations of Saccharomyces cerevisiae. Biotechnol. Bioeng. 2020, 117, 2074–2088. [Google Scholar] [CrossRef] [PubMed]
  16. Binai, N.A.; Bisschops, M.M.M.; Van Breukelen, B.; Mohammed, S.; Loeff, L.; Pronk, J.T.; Heck, A.J.R.; Daran-Lapujade, P.; Slijper, M. Proteome adaptation of Saccharomyces cerevisiae to severe calorie restriction in retentostat cultures. J. Proteome Res. 2014, 13, 3542–3553. [Google Scholar] [CrossRef] [PubMed]
  17. Kraakman, L.S.; Winderickx, J.; Thevelein, J.M.; De Winde, J.H. Structure-function analysis of yeast hexokinase: Structural requirements for triggering cAMP signalling and catabolite repression. Biochem. J. 1999, 343, 159–168. [Google Scholar] [PubMed]
  18. François, J.; Parrou, J.L. Reserve carbohydrates metabolism in the yeast Saccharomyces cerevisiae. FEMS Microbiol. Rev. 2001, 25, 125–145. [Google Scholar] [CrossRef] [Green Version]
  19. De Winde, J.H.; Crauwels, M.; Hohmann, S.; Thevelein, J.M.; Winderickx, J. Differential requirement of the yeast sugar kinases for sugar sensing in establishing the catabolite-repressed state. Eur. J. Biochem. 1996, 241, 633–643. [Google Scholar] [CrossRef]
  20. Mans, R.; Daran, J.M.G.; Pronk, J.T. Under pressure: Evolutionary engineering of yeast strains for improved performance in fuels and chemicals production. Curr. Opin. Biotechnol. 2018, 50, 47–56. [Google Scholar] [CrossRef]
  21. Zhang, J.; Martinez-Gomez, K.; Heinzle, E.; Wahl, S.A. Metabolic switches from quiescence to growth in synchronized Saccharomyces cerevisiae. Metabolomics 2019, 15, 1–13. [Google Scholar] [CrossRef] [PubMed] [Green Version]
  22. Rizzi, M.; Baltes, M.; Theobald, U.; Reuss, M. In vivo analysis of metabolic dynamics in Saccharomyces cerevisiae: II. Mathematical model. Biotechnol. Bioeng. 1997, 55, 592–608. [Google Scholar] [CrossRef]
  23. Link, H.; Fuhrer, T.; Gerosa, L.; Zamboni, N.; Sauer, U. Real-time metabolome profiling of the metabolic switch between starvation and growth. Nat. Methods 2015, 12, 1091–1097. [Google Scholar] [CrossRef] [PubMed]
  24. Siebler, F.; Lapin, A.; Hermann, M.; Takors, R. The impact of CO gradients on, C. ljungdahlii in a 125 m3 bubble column: Mass transfer, circulation time and lifeline analysis. Chem. Eng. Sci. 2019, 207, 410–423. [Google Scholar] [CrossRef]
  25. Haringa, C.; Deshmukh, A.T.; Mudde, R.F.; Noorman, H.J. Euler-Lagrange analysis towards representative down-scaling of a 22 m3 aerobic, S. cerevisiae fermentation. Chem. Eng. Sci. 2017, 170, 653–669. [Google Scholar] [CrossRef]
  26. Kordas, M.; Konopacki, M.; Grygorcewicz, B.; Augustyniak, A.; Musik, D.; Wójcik, K.; Jędrzejczak-Silicka, M.; Rakoczy, R. Hydrodynamics and mass transfer analysis in bioflow® bioreactor systems. Processes 2020, 8, 1311. [Google Scholar] [CrossRef]
  27. Di Serio, M.; Aramo, P.; De Alteriis, E.; Tesser, R.; Santacesaria, E. Quantitative analysis of the key factors affecting yeast growth. Ind. Eng. Chem. Res. 2003, 42, 5109–5116. [Google Scholar] [CrossRef]
  28. Sweere, A.P.J.; Mesters, J.R.; Janse, L.; Luyben, K.C.A.M.; Kossen, N.W.F. Experimental simulation of oxygen profiles and their influence on baker’s yeast production: I. One-fermentor system. Biotechnol. Bioeng. 1988, 31, 567–578. [Google Scholar] [CrossRef]
  29. Sweere, A.P.J.; Matla, Y.A.; Zandvliet, J.; Luyben, K.C.A.M.; Kossen, N.W.F. Experimental simulation of glucose fluctuations—The influence of continually changing glucose concentrations on the fed-batch baker’s yeast production. Appl. Microbiol. Biotechnol. 1988, 28, 109–115. [Google Scholar] [CrossRef]
  30. Enfors, S.; Hedenberg, J.; Olsson, K. Bi0pr0cess Engineering Simulation of the dynamics in the Baker ’ s yeast process. Bioprocess Eng. 1990, 5, 191–198. [Google Scholar] [CrossRef]
  31. Sweere, A.P.J.; van Dalen, J.P.; Kishoni, E.; Luyben, K.C.A.M.; Kossen, N.W.F. Theoretical analysis of the baker’s yeast production: An experimental verification at a laboratory scale—Part 2: Fed-batch fermentations. Bioprocess Eng. 1989, 4, 11–17. [Google Scholar] [CrossRef]
  32. Raab, A.M.; Lang, C. Oxidative versus reductive succinic acid production in the yeast Saccharomyces cerevisiae. Bioeng. Bugs. 2011, 2, 120–123. [Google Scholar] [CrossRef] [PubMed]
  33. Arikawa, Y.; Kuroyanagi, T.; Shimosaka, M.; Muratsubaki, H.; Enomoto, K.; Kodaira, R.; Okazaki, M. Effect of gene disruptions of the TCA cycle on production of succinic acid in Saccharomyces cerevisiae. J. Biosci. Bioeng. 1999, 87, 28–36. [Google Scholar] [CrossRef]
  34. Otero, J.M.; Cimini, D.; Patil, K.R.; Poulsen, S.G.; Olsson, L.; Nielsen, J. Industrial Systems Biology of Saccharomyces cerevisiae Enables Novel Succinic Acid Cell Factory. PLoS ONE 2013, 8, e54144. [Google Scholar] [CrossRef] [PubMed] [Green Version]
  35. Yan, D.; Wang, C.; Zhou, J.; Liu, Y.; Yang, M.; Xing, J. Construction of reductive pathway in Saccharomyces cerevisiae for effective succinic acid fermentation at low pH value. Bioresour. Technol. 2014, 156, 232–239. [Google Scholar] [CrossRef]
  36. Nissen, T.L.; Schulze, U.; Nielsen, J.; Villadsen, J. Flux distributions in anaerobic, glucose-limited continuous cultures of Saccharomyces cerevisiae. Microbiology 1997, 143, 203–218. [Google Scholar] [CrossRef] [Green Version]
  37. Hakkaart, X.; Liu, Y.; Hulst, M.; El Masoudi, A.; Peuscher, E.; Pronk, J.; Van Gulik, W.M.; Daran-Lapujade, P. Physiological responses of Saccharomyces cerevisiae to industrially relevant conditions: Slow growth, low pH, and high CO2 levels. Biotechnol. Bioeng. 2020, 117, 721–735. [Google Scholar] [CrossRef] [Green Version]
  38. Pham, H.T.B.; Larsson, G.; Enfors, S.O. Growth and energy metabolism in aerobic fed-batch cultures of Saccharomyces cerevisiae: Simulation and model verification. Biotechnol. Bioeng. 1998, 60, 474–482. [Google Scholar] [CrossRef]
  39. Sonnleitner, B.; Käppeli, O. Growth of Saccharomyces cerevisiae is controlled by its limited respiratory capacity: Formulation and verification of a hypothesis. Biotechnol. Bioeng. 1986, 28, 927–937. [Google Scholar] [CrossRef]
  40. Postma, E.; Alexander Scheffers, W.; Van Dijken, J.P. Kinetics of growth and glucose transport in glucose-limited chemostat cultures of Saccharomyces cerevisiae CBS 8066. Yeast 1989, 5, 159–165. [Google Scholar] [CrossRef]
  41. De Deken, R.H. The Crabtree effect: A regulatory system in yeast. J. Gen. Microbiol. 1966, 44, 149–156. [Google Scholar] [CrossRef] [PubMed] [Green Version]
  42. Van Urk, H.; Voll, W.S.L.; Scheffers, W.A.; Van Dijken, J.P. Transient-state analysis of metabolic fluxes in Crabtree-positive and crabtree-negative yeasts. Appl. Environ. Microbiol. 1990, 56, 281–287. [Google Scholar] [CrossRef] [PubMed] [Green Version]
  43. Pfeiffer, T.; Morley, A. An evolutionary perspective on the Crabtree effect. Front. Mol. Biosci. 2014, 1, 1–6. [Google Scholar] [CrossRef] [PubMed]
  44. Hagman, A.; Piškur, J. A study on the fundamental mechanism and the evolutionary driving forces behind aerobic fermentation in yeast. PLoS ONE 2015, 10, e0116942. [Google Scholar] [CrossRef]
  45. Van Urk, H.; Postma, E.; Scheffers, W.A.; van Dijken, J.P. Glucose Transport in Crabtree-positive and Crabtree-negative. Yeasts 1989, 2399–2406. [Google Scholar] [CrossRef] [Green Version]
  46. Vrábel, P.; Van der Lans, R.G.J.M.; Van der Schot, F.N.; Luyben , K.C.A.M.; Xu, B.; Enfors, S.O. CMA: Integration of fluid dynamics and microbial kinetics in modelling of large-scale fermentations. Chem. Eng. J. 2001, 84, 463–474. [Google Scholar]
  47. Mazzoleni, S.; Landi, C.; Cartenì, F.; De Alteriis, E.; Giannino, F.; Paciello, L.; Parascandola, P. A novel process-based model of microbial growth: Self-inhibition in Saccharomyces cerevisiae aerobic fed-batch cultures. Microb. Cell Factories 2015, 14, 1–14. [Google Scholar] [CrossRef] [Green Version]
  48. Enfors, S.-O.; Jahic, M.; Rozkov, A.; Xu, B.; Hecker, M.; Jürgen, B.; Krüger, E.; Schweder, T.; Hamer, G.; O’Beirne, D.; et al. Physiological responses to mixing in large scale bioreactors. J. Biotechnol. 2001, 85, 175–185. [Google Scholar] [CrossRef]
  49. Kozak, B.U.; van Rossum, H.M.; Niemeijer, M.S.; van Dijk, M.; Benjamin, K.; Wu, L.; Daran, J.G.; Pronk, J.T.; van Maris, A.J.A. Replacement of the initial steps of ethanol metabolism in Saccharomyces cerevisiae by ATP-independent acetylating acetaldehyde dehydrogenase. FEMS Yeast Res. 2016, 16, fow006. [Google Scholar] [CrossRef] [Green Version]
  50. Delafosse, A.; Collignon, M.-L.; Calvo, S.; Delvigne, F.; Crine, M.; Thonart, P.; Toye, D. CFD-based compartment model for description of mixing in bioreactors. Chem. Eng. Sci. 2014, 106, 76–85. [Google Scholar] [CrossRef]
  51. Nieß, A.; Löffler, M.; Simen, J.D.; Takors, R. Repetitive Short-Term Stimuli Imposed in Poor Mixing Zones Induce Long-Term Adaptation of E. coli Cultures in Large-Scale Bioreactors: Experimental Evidence and Mathematical Model. Front. Microbiol. 2017, 8, 1195. [Google Scholar] [CrossRef] [PubMed] [Green Version]
  52. Smets, B.; Ghillebert, R.; De Snijder, P.; Binda, M.; Swinnen, E.; De Virgilio, C.; Winderickx, J. Life in the midst of scarcity: Adaptations to nutrient availability in Saccharomyces cerevisiae. Curr. Genet. 2010, 56, 1–32. [Google Scholar] [CrossRef] [PubMed] [Green Version]
  53. Larsson, C.; Påhlman, I.L.; Gustafsson, L. The importance of ATP as a regulator of glycolytic flux in Saccharomyces cerevisiae. Yeast 2000, 16, 797–809. [Google Scholar] [CrossRef]
  54. Larsson, C.; Nilsson, A.; Blomberg, A.; Gustafsson, L. Glycolytic flux is conditionally correlated with ATP concentration in Saccharomyces cerevisiae: A chemostat study under carbon or nitrogen-limiting conditions. J. Bacteriol. 1997, 179, 7243–7250. [Google Scholar] [CrossRef] [PubMed] [Green Version]
  55. Somsen, O.J.G.; Hoeben, M.A.; Esgalhado, E.; Snoep, J.L.; Visser, D.; Van der Heijden, R.T.J.M.; Heijnen, J.J.; Westerhoff, H.V. Glucose and the ATP paradox in yeast. Biochem. J. 2000, 352, 593–599. [Google Scholar] [CrossRef]
  56. Verma, M.; Zakhartsev, M.; Reuss, M.; Westerhoff, H.V. ‘Domino’ systems biology and the ‘A’ of ATP. Biochim. Biophys. Acta (BBA) Gen. Subj. 2013, 1827, 19–29. [Google Scholar] [CrossRef]
  57. Kerkhoven, E.J.; Lahtvee, P.J.; Nielsen, J. Applications of computational modeling in metabolic engineering of yeast. FEMS Yeast Res. 2015, 15, 1–13. [Google Scholar] [CrossRef] [Green Version]
  58. Almquist, J.; Cvijovic, M.; Hatzimanikatis, V.; Nielsen, J.; Jirstrand, M. Kinetic models in industrial biotechnology—Improving cell factory performance. Metab. Eng. 2014, 24, 38–60. [Google Scholar] [CrossRef]
  59. Campbell, K.; Xia, J.; Nielsen, J. The Impact of Systems Biology on Bioprocessing. Trends Biotechnol. 2017, 35, 1156–1168. [Google Scholar] [CrossRef]
  60. Campbell, K.; Westholm, J.; Kasvandik, S.; Di Bartolomeo, F.; Mormino, M.; Nielsen, J. Building blocks are synthesized on demand during the yeast cell cycle. Proc. Natl. Acad. Sci. USA 2020, 117, 7575–7583. [Google Scholar] [CrossRef]
  61. Szatkowska, R.; Albornoz, M.G.; Roszkowska, K.; Holman, S.W.; Furmanek, E.; Hubbard, S.J.; Beynon, R.J.; Adamczyk, M. Glycolytic flux in Saccharomyces cerevisiae is dependent on RNA polymerase III and its negative regulator Maf1. Biochem. J. 2019, 476, 1053–1082. [Google Scholar] [CrossRef] [PubMed] [Green Version]
  62. Delvigne, F.; Takors, R.; Mudde, R.; van Gulik, W.; Noorman, H. Bioprocess scale-up/down as integrative enabling technology: From fluid mechanics to systems biology and beyond. Microb. Biotechnol. 2017, 10, 1267–1274. [Google Scholar] [CrossRef] [PubMed]
  63. Takors, R. Scale-up of microbial processes: Impacts, tools and open questions. J. Biotechnol. 2012, 160, 3–9. [Google Scholar] [CrossRef]
  64. Takors, R. Biochemical engineering provides mindset, tools and solutions for the driving questions of a sustainable future. Eng. Life Sci. 2020, 20, 5–6. [Google Scholar] [CrossRef] [PubMed]
  65. Noorman, H.J.; Heijnen, J.J. Biochemical engineering’s grand adventure. Chem. Eng. Sci. 2017, 170, 677–693. [Google Scholar] [CrossRef]
  66. Morchain, J.; Gabelle, J.C.; Cockx, A. A coupled population balance model and CFD approach for the simulation of mixing issues in lab-scale and industrial bioreactors. AIChE J. 2014, 60, 27–40. [Google Scholar] [CrossRef]
  67. Lemoine, A.; Delvigne, F.; Bockisch, A.; Neubauer, P.; Junne, S. Tools for the determination of population heterogeneity caused by inhomogeneous cultivation conditions. J. Biotechnol. 2017, 251, 84–93. [Google Scholar] [CrossRef]
  68. Murthy, B.N.; Joshi, J.B. Assessment of standard k-ε{lunate}, RSM and LES turbulence models in a baffled stirred vessel agitated by various impeller designs. Chem. Eng. Sci. 2008, 63, 5468–5495. [Google Scholar] [CrossRef]
  69. Derksen, J.J. Direct simulations of mixing of liquids with density and viscosity differences. Ind. Eng. Chem. Res. 2012, 51, 6948–6957. [Google Scholar] [CrossRef]
  70. Witz, C.; Treffer, D.; Hardiman, T.; Khinast, J. Local gas holdup simulation and validation of industrial-scale aerated bioreactors. Chem. Eng. Sci. 2016, 152, 636–648. [Google Scholar] [CrossRef]
  71. Pigou, M.; Morchain, J. Investigating the interactions between physical and biological heterogeneities in bioreactors using compartment, population balance and metabolic models. Chem. Eng. Sci. 2015, 126, 267–282. [Google Scholar] [CrossRef] [Green Version]
  72. Sarkizi Shams Hajian, C.; Zieringer, J.; Takors, R. Chapter 15: Euler-Lagrangian simulations – a proper tool for predicting cellular performance in industrial scale bioreactors. In Digital Twins—Applications to the Design and Optimization of Bioprocesses; Herwig, C., Möller, J., Pörtner, R., Eds.; Springer Nature Switzerland AG: Cham, Switzerland, 2020. [Google Scholar]
  73. Eigenstetter, G.; Takors, R. Dynamic modeling reveals a three-step response of Saccharomyces cerevisiae to high CO2 levels accompanied by increasing ATP demands. FEMS Yeast Res. 2017, 17, 1–11. [Google Scholar] [CrossRef] [Green Version]
  74. Larsson, G.; Törnkvist, M.; Ståhl Wernersson, E.; Trägårdh, C.; Noorman, H.; Enfors, S.O. Substrate gradients in bioreactors: Origin and consequences. Bioprocess Eng. 1996, 14, 281–289. [Google Scholar] [CrossRef]
  75. Marshall, E.M.; Bakker, A. Computational Fluid Mixing. In Handbook of Industrial Mixing; Atiemo-Obeng, V.A., Calabrese, R.V., Eds.; John Wiley & Sons, Inc.: Hoboken, NJ, USA, 2004; pp. 257–343. [Google Scholar] [CrossRef]
  76. Clift, R.; Grace, J.R.; Weber, M.E. Bubbles, Drops, and Particles; (Dover Books on Engineering); Clift, R., Grace, J.R., Weber, M.E., Eds.; Dover Publ.: Mineola, NY, USA, 2005; Volume XIII, p. 381. [Google Scholar]
  77. Scargiali, F.; D’Orazio, A.; Grisafi, F.; Brucato, A. Modelling and simulation of gas—Liquid hydrodynamics in mechanically stirred tanks. Chem Eng Res Des. 2007, 85, 637–646. [Google Scholar] [CrossRef]
  78. Ansys® Academic Research Fluent, Release 2019 R1, Fluent user’s Guide; ANSYS, Inc.: Canonsburg, PA, USA, 2019.
  79. Weusthuis, R.A.; Visser, W.; Pronk, J.T.; Scheffers, W.A.; Van Dijken, J.P. Effects of oxygen limitation on sugar metabolism in yeasts: A continuous-culture study of the Kluyver effect. Microbiology 1994, 140, 703–715. [Google Scholar] [CrossRef] [PubMed] [Green Version]
  80. Sweere, A.P.J.; Giesselbach, J.; Barendse, R.; de Krieger, R.; Honderd, G.; Luyben, K.C.A.M. Modelling the dynamic behaviour of Saccharomyces cerevisiae and its application in control experiments. Appl. Microbiol. Biotechnol. 1988, 28, 116–127. [Google Scholar] [CrossRef]
  81. Kuschel, M.; Siebler, F.; Takors, R. Lagrangian Trajectories to Predict the Formation of Population Heterogeneity in Large-Scale Bioreactors. Bioengineering 2017, 4, 27. [Google Scholar] [CrossRef]
  82. Zieringer, J.; Takors, R. In Silico Prediction of Large-Scale Microbial Production Performance: Constraints for Getting Proper Data-Driven Models. Comput. Struct. Biotechnol. J. 2018, 16, 246–256. [Google Scholar] [CrossRef]
  83. Alves, S.S.; Vasconcelos, J.M.T.; Orvalho, S.P. Mass transfer to clean bubbles at low turbulent energy dissipation. Chem. Eng. Sci. 2006, 61, 1334–1337. [Google Scholar] [CrossRef]
  84. Sieblist, C.; Hägeholz, O.; Aehle, M.; Jenzsch, M.; Pohlscheidt, M.; Lübbert, A. Insights into large-scale cell-culture reactors: II. Gas-phase mixing and CO 2 stripping. Biotechnol. J. 2011, 6, 1547–1556. [Google Scholar] [CrossRef]
  85. Löser, C.; Schröder, A.; Deponte, S.; Bley, T. Balancing the ethanol formation in continuous bioreactors with ethanol stripping. Eng. Life Sci. 2005, 5, 325–332. [Google Scholar] [CrossRef]
  86. Vrábel, P.; Van Der Lans, R.G.J.M.; Cui, Y.Q.; Luyben, K.C.A.M. Compartment model approach: Mixing in large scale aerated reactors with multiple impellers. Chem. Eng. Res. Des. 1999, 77, 291–302. [Google Scholar] [CrossRef]
  87. Bailey, J.E.; Ollis, D.F. Biochemical Engineering Fundamentals. McGraw-Hill Chemical Engineering Series); McGraw-Hill. 1986. Available online: https://books.google.de/books?id=KM9TAAAAMAAJ (accessed on 26 September 2020).
  88. Blombach, B.; Takors, R. CO2—Intrinsic product, essential substrate, and regulatory trigger of microbial and mammalian production processes. Front. Bioeng. Biotechnol. 2015, 3, 1–11. [Google Scholar] [CrossRef] [PubMed]
  89. Kuschel, M.; Takors, R. Simulated oxygen and glucose gradients as a prerequisite for predicting industrial scale performance a priori. Biotechnol. Bioeng. 2020, 117, 2760–2770. [Google Scholar] [CrossRef]
  90. Mancini, M.; Moresi, M. Rheological behaviour of baker’s yeast suspensions. J. Food Eng. 2000, 44, 225–231. [Google Scholar] [CrossRef]
  91. Delvigne, F.; Destain, J.; Thonart, P. A methodology for the design of scale-down bioreactors by the use of mixing and circulation stochastic models. Biochem. Eng. J. 2006, 28, 256–268. [Google Scholar] [CrossRef]
  92. Guijarro, J.M.; Lagunas, R. Saccharomyces cerevisiae does not accumulate ethanol against a concentration gradient. J. Bacteriol. 1984, 160, 874–878. [Google Scholar] [CrossRef] [PubMed] [Green Version]
  93. Piškur, J.; Rozpedowska, E.; Polakova, S.; Merico, A.; Compagno, C. How did Saccharomyces evolve to become a good brewer? Trends Genet. 2006, 22, 183–186. [Google Scholar] [CrossRef]
  94. Thomson, J.M.; A Gaucher, E.; Burgan, M.F.; De Kee, D.W.; Li, T.; Aris, J.P.; A Benner, S. Resurrecting ancestral alcohol dehydrogenases from yeast. Nat. Genet. 2005, 37, 630–635. [Google Scholar] [CrossRef]
  95. Tang, W.; Deshmukh, A.T.; Haringa, C.; Wang, G.; Van Gulik, W.; Van Winden, W.; Reuss, M.; Heijnen, J.J.; Xia, J.; Chu, J.; et al. A 9-pool metabolic structured kinetic model describing days to seconds dynamics of growth and product formation by Penicillium chrysogenum. Biotechnol. Bioeng. 2017, 114, 1733–1743. [Google Scholar] [CrossRef]
  96. La, A.; Du, H.; Taidi, B.; Perré, P. A predictive dynamic yeast model based on component, energy, and electron carrier balances. Biotechnol. Bioeng. 2020, 117, 2728–2740. [Google Scholar] [CrossRef] [PubMed]
  97. Orij, R.; Brul, S.; Smits, G.J. Intracellular pH is a tightly controlled signal in yeast. Biochim. Biophys. Acta (BBA) Gen. Subj. 2011, 1810, 933–944. [Google Scholar] [CrossRef] [PubMed]
  98. Pham, T.H.; Mauvais, G.; Vergoignan, C.; De Coninck, J.; Dumont, F.; Lherminier, J.; Cachon, R.; Feron, G. Gaseous environments modify physiology in the brewing yeast Saccharomyces cerevisiae during batch alcoholic fermentation. J. Appl. Microbiol. 2008, 105, 858–874. [Google Scholar] [CrossRef] [PubMed]
Figure 1. Stavanger bioreactor configuration and dimensions.
Processes 08 01554 g001
Figure 2. Graphical representation of the bottleneck concept and the interplay of substrate availability in the kinetic model for ethanol consumption under aerobic conditions and overflow metabolism based on [39].
Processes 08 01554 g002
Figure 3. Gas holdup distribution can reproduce the loading regime at the bottom impeller.
Processes 08 01554 g003
Figure 4. Concentration profiles for scenario I with 10 g/L biomass for (a) d O 2 , (b) d C O 2 , (c) ethanol in liquid phase, (d) stripped ethanol mole fraction in the gas phase.
Processes 08 01554 g004
Figure 5. Concentration profiles with 25 g/L biomass concentration for (a) d O 2 and (b) ethanol.
Processes 08 01554 g005
Table 1. Operating conditions for the fermentation process.
Operation ConditionsDescriptionRef.
Primary phase~water
  • ρ = 1000 kg/m3
  • ν = 0.001 kg/m/s
[25]
Secondary phase~air
  • ρ = 1.225 kg/m3
  • ideal gas law
  • db = 0.009 m
[25]
Inter-phase forcesDrag
  • grace
  • swarm coefficient −1.2
[76,77]
Aeration rate0.231 kg/s[74]
Headspace pressure130,710 Pa[74]
Agitation rate2.22 s−1[74]
Glucose feed 52 kg/h[25]
Publisher’s Note: MDPI stays neutral with regard to jurisdictional claims in published maps and institutional affiliations.