Article

Polyphenolic Profiling of Forestry Waste by UPLC-HDMSE

1
Centre for Environmental Biotechnology, School of Natural Sciences, Bangor University, Gwynedd, Bangor LL57 2UW, UK
2
UWA School of Agriculture and Environment, The University of Western Australia, Perth, WA 6009, Australia
*
Author to whom correspondence should be addressed.
Processes 2020, 8(11), 1411; https://doi.org/10.3390/pr8111411
Submission received: 22 October 2020 / Revised: 30 October 2020 / Accepted: 1 November 2020 / Published: 4 November 2020

Abstract

:
Polyphenols constitute a diverse array of naturally occurring secondary metabolites found in plants which, when consumed, have been shown to promote human health. Greater consumption may therefore aid in the fight against diseases such as obesity, diabetes, heart disease, cancer, etc. Tree bark is polyphenol-rich and has potential to be used in food supplements. However, it is important to gain insight into the polyphenol profile of different barks to select the material with greatest concentration and diversity. Ultra-performance liquid chromatography (UPLC) was coupled with an ion mobility time-of-flight high-definition/high-resolution mass spectrometer (UPLC-HDMSE) to profile ethanol extracts of three common tree barks (Pinus contorta, Pinus sylvestris, Quercus robur) alongside a commercial reference (Pycnogenol® extracted from Pinus pinaster). Through the use of Progenesis QI informatics software, 35 high scoring components with reported significance to health were tentatively identified across the three bark extracts following broadly the profile of Pycnogenol®. Scots Pine had generally higher compound abundances than in the other two extracts. Oak bark extract showed the lowest abundances but exhibited higher amounts of naringenin and 3-O-methylrosmarinic acid. We conclude that forestry bark waste provides a rich source of extractable polyphenols suitable for use in food supplements and so can valorise this forestry waste stream.

1. Introduction

Polyphenols encompass a very broad range of compounds (e.g., flavonoids, phenolic acids, polyphenolic amides) which can be present in some foods in high concentrations [1]. Consumption of polyphenols can provide significant benefits to human health [2,3]. Most of these positive effects are attributed to their antioxidant and antimicrobial properties which may help prevent a range of diseases, such as cancer and bacterial infections [4,5]. There is also evidence that polyphenols can cross the blood–brain barrier and participate in the regulation of neuropeptides involved in mental wellbeing [6,7]. In relation to the current obesity crisis, polyphenols have also been shown to promote satiety and reduce food intake [8,9]. Specifically, dietary polyphenols have been shown to reduce the proliferation of adipocytes, suppress triglyceride accumulation, stimulate lipolysis, and reduce inflammation [10]. Polyphenols have also been shown to positively alter the gut microbiome [11]. The wide range of perceived benefits associated with polyphenols has led to calls from health agencies to both increase the consumption of polyphenol-rich foods, to breed crops with higher polyphenol contents and to potentially supplement food with polyphenols to promote human wellbeing [12]. A range of controlled trials have subsequently confirmed the benefits of these approaches [13].
One of the major challenges faced by the food industry is that over 8000 polyphenols have thus far been identified in food; however, the evidence base for the short- and long-term health effects for most of these polyphenols remains poorly understood or absent [14]. In addition, the interactive effects of polyphenol mixtures on human health remains virtually unknown [15]. Further, some polyphenols have been shown to be detrimental to human health, particularly when consumed in large quantities [16]. Greater knowledge is therefore needed about the diversity, concentration, and bioavailability of polyphenols in foods and natural products used as food supplements.
The bark, wood, seeds, and leaves of trees frequently contain large quantities of polyphenols which can be readily extracted on an industrial scale [17,18,19]. Trials have also indicated that wood-derived polyphenols may be useful in the treatment of Type II diabetes and heart disease amongst other ailments [20,21,22]. This supports historical reports of their use for treating a range of human diseases [23]. The relative abundance of forestry products, therefore, makes them a suitable target for bulk extraction of polyphenols for use in the food and beverage industry and in pharmaceutical and nutraceutical production [24,25,26]. The concentration and types of polyphenols, however, is known to vary widely between tree species [27,28]. This variation is due to intrinsic differences in secondary metabolism between species, ontological stage, and also the influence of external factors such as climate, herbivory, and soil type [29,30].
Although many approaches are available for the extraction and characterisation of phenolics in tree tissues, many of these lack sensitivity or are designed for targeted analysis of specific phenolic groups with proven bioactive properties. Advances in analytical capability, however, now allow the untargeted analysis and mass profiling of low molecular weight phenolics [31,32]. For example, a UPLC-ESI-QTOF-MS (separation achieved with ultra-performance liquid chromatography (UPLC) followed by electrospray ionization and detection via a quadrupole time-of-flight mass spectrometer) approach was used to putatively annotate 262 phenolic compounds from Moringa oleifera leaves [33] and 187 from tea leaves [34]. These approaches, however, have not been widely applied to the bioprospecting of forestry waste. The development of UPLC with ion mobility time-of-flight high definition MS (UPLC-HDMSE) provides multiple degrees of orthogonal separation and unprecedented peak capacity through the added dimension of ion mobility separation [35,36]. This approach provides increased confidence in interpreting phenolomic datasets and identifying individual compounds. The primary aim of this study was to demonstrate the use of UPLC-HDMSE for characterising the main polyphenols present in three common bark wastes which can be obtained commercially. Our second aim was to broadly compare our findings to an existing nutraceutical product.

2. Materials and Methods

2.1. Forestry Waste Samples

Representative bulk samples of bark waste were provided by a commercial forestry contractor (B.R. Warner Ltd., Amlwch, Anglesey, UK). The samples were from mature Lodgepole pine (LPP; Pinus contorta), Scots pine (SP; Pinus sylvestris), and Oak (O; Quercus robur). The commercial bark-derived dietary supplement, Pycnogenol® extracted from Maritime pine (Pinus pinaster) was used as a reference material. Reviews on the use of Pycnogenol® and its impacts on human health are presented elsewhere [37,38,39].

2.2. Sample Preparation

Changes in sample preparation methods will alter the polyphenol profile obtained in the subsequent extract. Ethanol was chosen here to provide the highest abundance of polyphenols [40] and also to comply with the EU directive for Good Manufacturing Practice (GMP) for food stuffs [41]. Briefly, each bark sample was ground to a fine powder and then 10 g placed in a glass beaker containing 100 mL of ethanol. After covering with Parafilm®, the mixture was sonicated in an ultrasonic bath for 30 min. Ethanol was chosen as a solvent due to its legislative approval for use in the food industry [41]. The mixture was then left for 24 h at 4 °C before re-sonicating for 30 min. Once the solid material had settled, the liquid layer was placed in polypropylene tubes and centrifuged (10,000 rev min−1, 30 min). The resultant supernatant was concentrated to 10 mL by gentle heating to 60 °C in a fume cupboard (i.e., 1 mL extract g−1 bark). The resultant extract was kept at −20 °C until required. The method described was repeated for each bark type in quadruplicate.

2.3. Analytical Instrumentation

An untargeted, discovery method was developed in negative ion mode using an I-class UPLC with a Synapt G2-Si in HDMSE mode (Waters UK Ltd., Wilmslow, UK). HD refers to ion mobility while MSE is a data-independent terminology for an acquisition that gathers mass spectrometer (MS) data, within a specified mass range, on all ions formed in the gas phase. These parent ions are subsequently fragmented to create product ions. The Synapt G2-Si is a quadrupole time-of-flight MS (Q-ToF) with incorporated ion mobility. A Z-SprayTM source was used in which chromatographically separated analytes arrive via one probe and the lock mass is infused via another. A metal baffle was set to switch periodically to allow either the analytes or the lock mass to enter the MS. Data were acquired and stored as continuum spectral data. Leucine enkephalin (Tyr-Gly-Gly-Phe-Leu) was the lock mass chosen for mass axis correction.

2.4. UPLC Conditions

The UPLC used was a Waters I-class instrument equipped with a Waters Cortecs UPLC C18+ 2.7 μm × 2.1 mm × 100 mm superficially porous column. This stationary phase has a positive charge present on the surface which provides better selectivity and peak shape for negatively charged analytes such as polyphenols. The use of 0.1% acetic acid as the mobile phase modifier was found to be the combination of modifier and concentration that gave the highest signal-to-noise ratio for polyphenolic compounds. Briefly, the mobile phase consisted of water modified with 0.1% acetic acid in A and MeOH modified with 0.1% acetic acid in B. The flow rate was 0.5 mL min−1, the column temperature 40 °C and the injection volume 1.0 μL. The mobile phase composition was initially 90% A with 10% B, changing linearly to 1% A with 99% B over 4 min, and finally back to the initial conditions over 0.2 min.

2.5. Synapt G2-Si Conditions

Data were acquired and stored as continuum in a mass range of 50 to 1200 Da in negative ion resolution mode. The cone voltage was set to 40 V and the scan time was set to 0.2 s using an average of 3 scans and a mass window of ± 0.5 Da. The leucine enkephalin lock mass (554.2615 Da) was acquired every 30 s throughout the run but was not used for on-the-fly correction; this mass reference was acquired and stored for later use in data processing.

2.6. Data Processing

HDMSE data were processed using Progenesis QI software (NonLinear Dynamics Ltd., Newcastle upon Tyne, UK). Firstly, the acquired data were imported, then aligned to compensate for the small drifts in retention time between runs. A between-subjects experimental design was chosen creating 3 groups for the bark extracts, 1 for the reference (Pycnogenol®), and 1 group for blank extracts. Peaks were picked to locate the analytes in the samples and then ions were deconvoluted. These ions were then compared to the ChemSpider Polyphenols database [42] with a 5 ppm precursor tolerance. Theoretical fragmentation (in silico) was also performed with a fragment tolerance of 5 ppm. Only isotope similarity scores above 90% were used and also a filter for elemental composition was set to take into account compounds with elemental composition of H, C, and O. As a result of collecting ion mobility data as well as MSE data (HDMSE mode), Progenesis QI was more able to distinguish co-eluting components due to differences in drift times of the parent ions.
Identifications made through comparison to external databases should always be treated as tentative. In Progenesis QI, data were filtered so that only the best quality data were selected for further investigation. Filters were setup to show only compounds that had ANOVA p values ≤ 0.01 and blanks were the lowest mean. All compound abundances lower than 100, with no fragmentation and showing blanks as the highest mean, were removed from the dataset. Of a maximum possible score of 60 for this experimental setup only scores above 40 were chosen for further evaluation. Metrics for retention time similarity and collision cross-section (CCS) similarity were zero.
After processing through Progenesis QI, data were then exported to EZInfo (Umetrics, Umeå, Sweden) which provided a multivariate analysis (MVA) approach to this discovery data. Multivariate data analysis was achieved by undertaking Principal Component Analysis (PCA) in EZInfo giving an overview of the sample data via a scores plot. This plot shows the observations that are likely to be most similar (close together) and also the ones that are most dissimilar (far away) allowing for the visualisation of atypical observations, trends and other patterns within the data. The heat map was produced in Matlab (MatWorks Inc., Natlick, MA, USA).

3. Results and Discussion

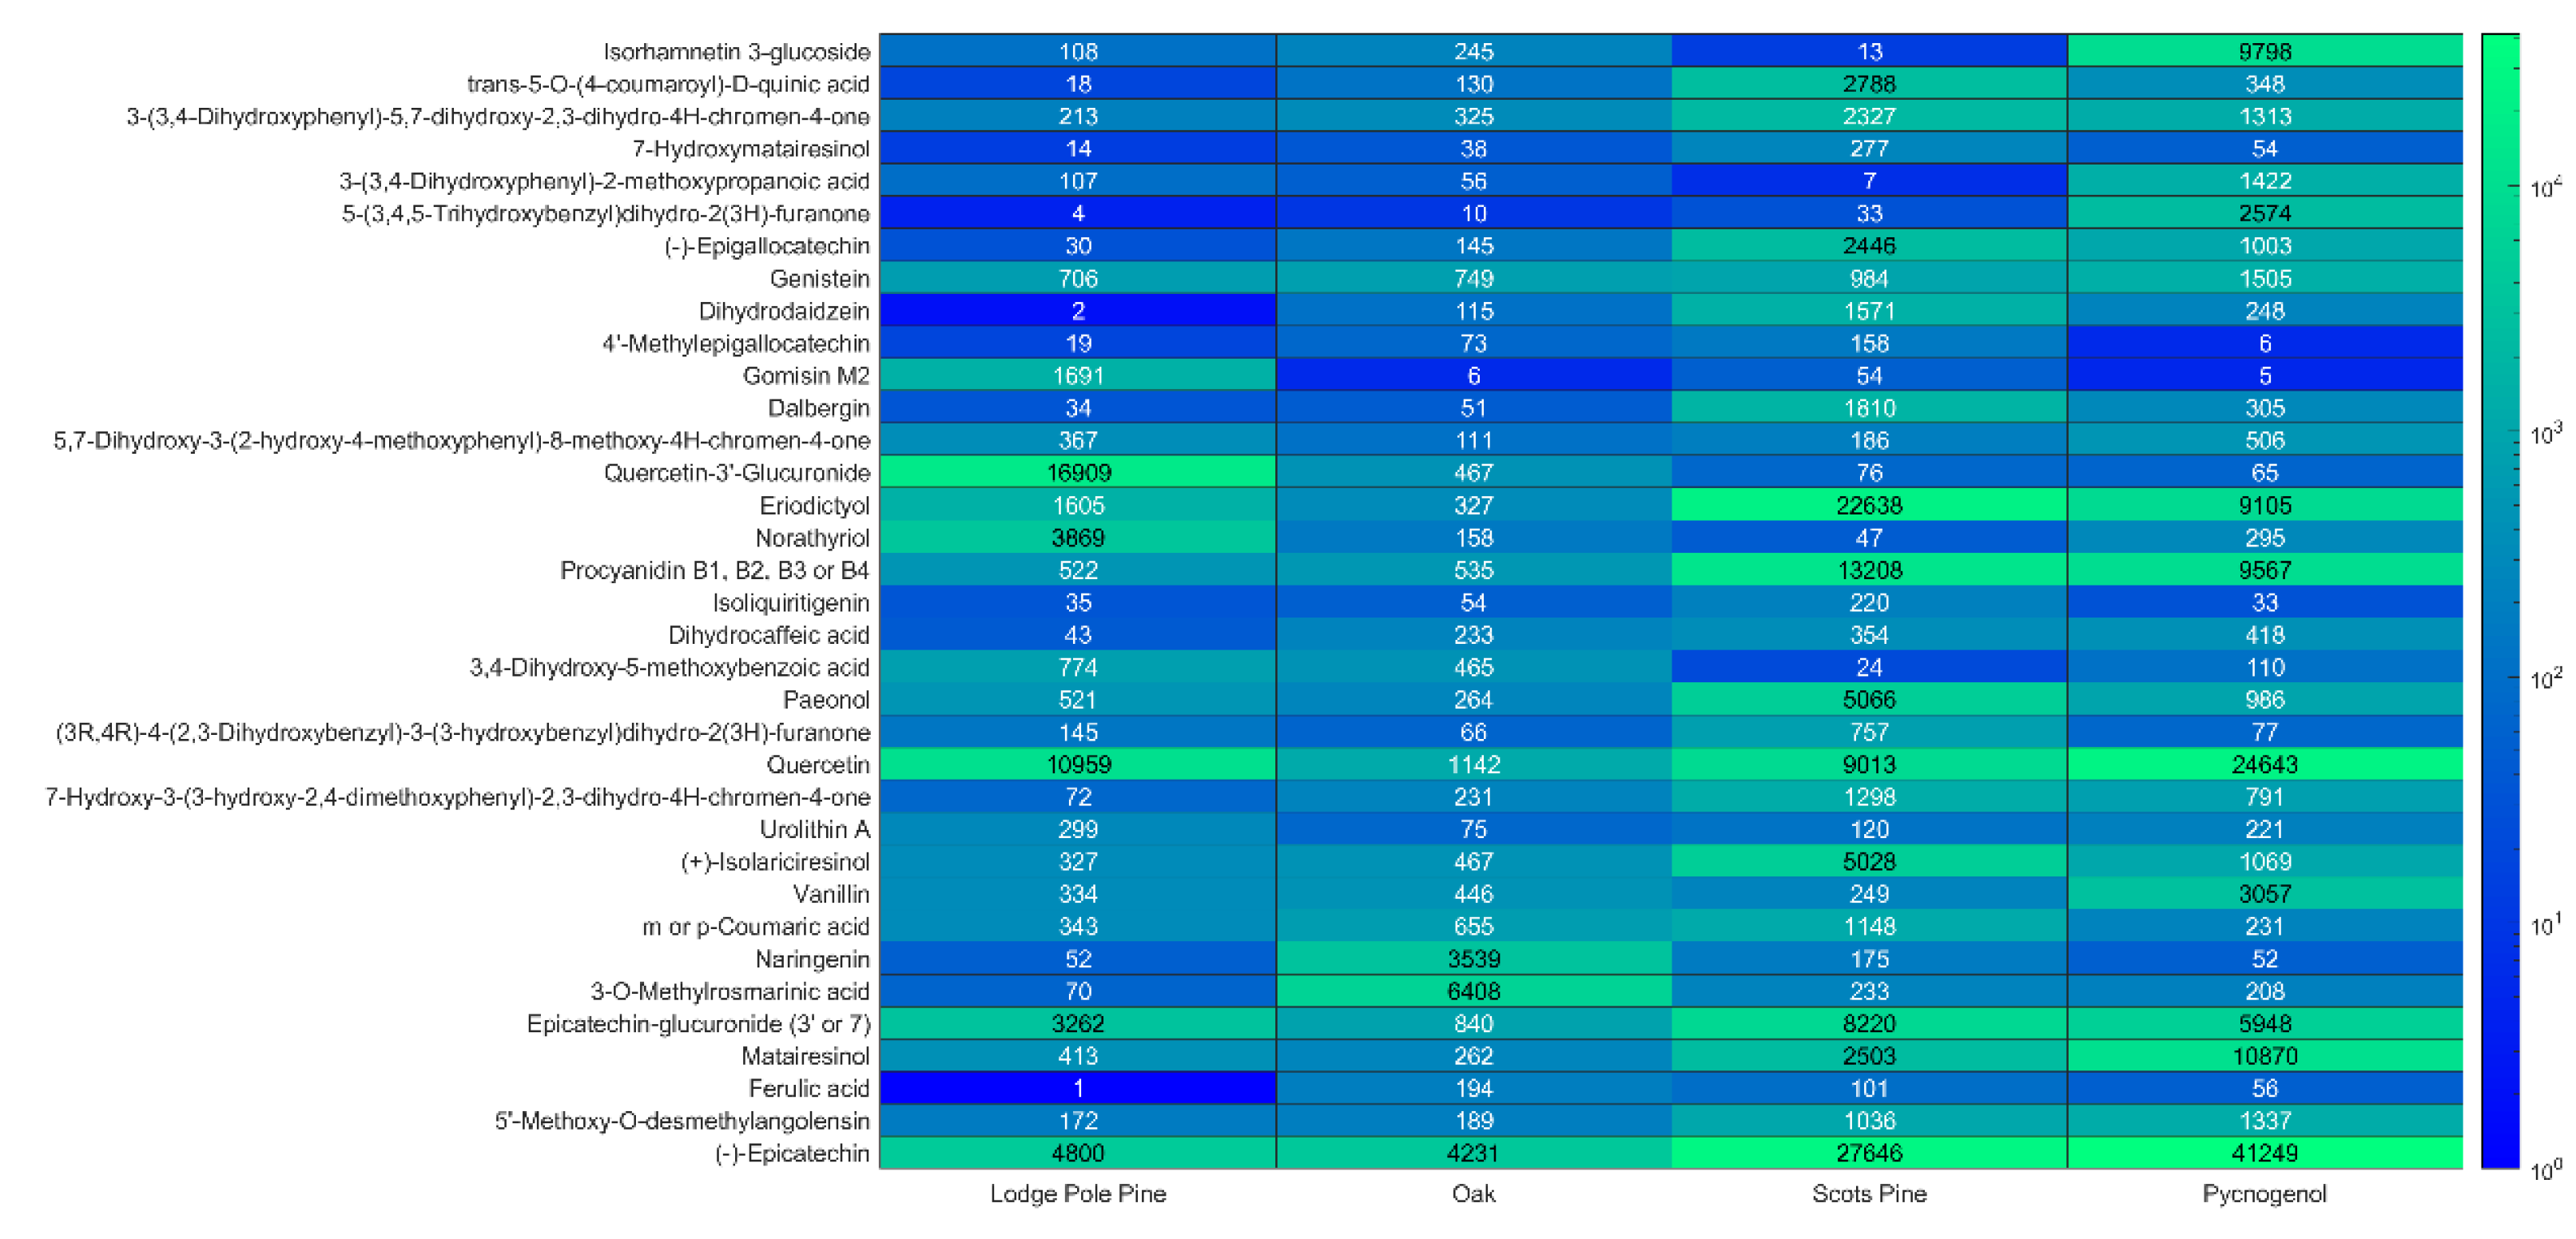
3.1. Bioactive Phenolic Compounds in Tree Bark Extracts

A summary of the results obtained from the analysis of the three bark extracts is presented in the detailed Excel file in Supplementary Materials (XL-SM). Tentative identifications for compounds are ordered with the highest scoring results from top to bottom. In summary, a total of 35 components were tentatively identified across the three bark extracts with scores of 40 or above. Accurate mass values are given for parent and main product ions plus retention time (min.), drift time (ms) and normalised abundances for all sample injections. All components showed very low ANOVA-p and q values, indicating a false discovery rate (FDR) approaching zero in many cases with a maximum FDR of 0.5%. Isotope similarity scores above 90 and mass errors of ≤ 5 ppm can also be seen. Pycnogenol®, which was used as a reference material, generally exhibited higher abundances of polyphenols than the bark extracts, which was probably due to the extraction and concentration resulting from its proprietary production process. Additional references are given for each identified polyphenol component which have been shown to have bioactive significance in terms of human health benefits. Three components which could not be distinguished from their isobaric species have their various possibilities listed, which is felt to be better than exclusion. Total ion chromatograms and ion intensity graphs to illustrate the alignment and vector editing processes, are available in supplementary materials (Figures S1–S8). Molecular structures of the 35 identified components can be found in Figure S9.
As an aid to visualisation, a heat map has been created using averaged abundances for each sample type across the 35 identified polyphenols (Figure 1). From this overview of the identifications it can be seen that the 2 Pinus sp. more closely represent the general trend of Pycnogenol® (Pinus pinaster) than does oak.
It is also noted that compound abundances are generally higher in the Scots Pine extract than in the other two bark extracts with the Oak sample showing the lowest abundances. Oak, on the other hand, does exhibit higher amounts of naringenin and 3-O-methylrosmarinic acid than the other samples. Several biological activities have been ascribed to naringenin, including antioxidant, antitumor, antiviral, antibacterial, anti-inflammatory, antiadipogenic, and cardioprotective effects. The most promising activity being related to cardiovascular disease protection, in pure form and in complex polyphenolic mixtures, and also naringenin’s ability to improve endothelial function [43]. The 3-O-methylrosmarinic acid is thought to contribute to the properties of the Cistus genus which is a plant used in traditional folk medicine for wound healing and its anti-inflammatory properties [44].
As an overview of the data, a scores plot, using principal component analysis (PCA) with Pareto scaling, was created which showed tight clustering of the bark extracts sample replicates and a general separation between bark types (Figure 2). This figure includes an expanded area view of the more closely situated clusters. This shows tight clustering within each group of replicates and clear differences between the sample types. Furthermore, also available in the supplementary material is a loadings bi-plot (Figure S11) which illustrates how the components relate to the samples i.e., the closer an ion is to a sample cluster the more this describes the sample’s composition and therefore also highlights the differences between the bark extracts.
To continue to point out the highlights of this discovery work (additional references for each compound are available in supplementary information) it can be seen in XL-SM and Figure 1 that quercetin, eriodictyol and (−)-epicatechin are compounds with significant abundance. Dietary supplementation with quercetin or plant extracts containing quercetin has been shown to attenuate high fat diet induced obesity and insulin resistance [45] and also decreases inflammation [46]. Quercetin is seen to be abundant across all 4 extracts. Eriodictyol, which is particularly prominent in Scots Pine, has been shown to stimulate insulin secretion in mice islets, improving glucose tolerance and increasing plasma insulin in non-diabetic and diabetic rats [47]. Furthermore, research shows that neuro-inflammatory response to experimental stroke is inhibited by eriodictyol [48] as is inflammation in osteoarthritis [49]. Epicatechin’s benefits have been discussed prolifically in literature with a primary focus on anti-oxidant, anti-microbial, anti-inflammatory, and anti-cancer effects [50] plus, more specifically, cardiovascular and neuropsychological health [51].
Quercetin, which is seen in all samples analysed here, and quercetin-3′-glucuronide, which is abundant in lodgepole pine bark, have both been shown to be active against human breast cancer [52]. Furthermore, also abundant in lodgepole pine is norathyriol which is noted for its potential towards suppression of skin cancers induced by UV radiation [53], as a new candidate for the treatment of hypouricaemic [54] and also its regulatory effect on lipid metabolism making it useful for protection against hepatic lipid metabolic disorders and the treatment of non-alcoholic fatty liver disease [55].
The diverse array of higher abundance components is most evident in Scots Pine; some of these components have already been mentioned. In addition, procyanidin (B1, B2, B3 or B4), is observed in Scots Pine bark in very high abundance and is also evident in the other extracts to a lesser extent. These molecules are the pigments often associated with apples, grapes, and berries and their related health benefits. Procyanidins have been reported to target diverse molecular switches in carcinogen metabolism including inflammation, cell proliferation, cell cycle, apoptosis, and the development of new blood vessels (angiogenesis) and consequently studies on Procyanidins have shown that they inhibit the proliferation of various cancer cells in vitro and in vivo [56].

3.2. Tentative Identification of Polyphenols

It is often the case that databases do not contain fragmentation data so in silico theoretical predictions are relied upon here. This can be quite effective in the context of polyphenolic compounds as their mechanisms of fragmentation are well documented. They are generally in the category referred to as Retro-Diels–Alder (RDA) reactions [57]. Furthermore, the sugar moiety, which is present in many polyphenols, may also fragment by RDA. Often, a water loss precedes the RDA fragmentation by remote hydrogen rearrangement, forming an unsaturated sugar moiety, which facilitates the RDA process. All mass spectra are available in the supplementary material (Figure S10).
The parent ion identified at 1.38 min. was m/z 477.1036 which related to [M-H] for C22H22O12 with a mass error of −0.4 ppm. This gave rise to the product ion m/z 462.0796 which indicates a further loss of CH3. This was identified as isorhamnetin-3-glucoside which has a ChemSpider ID of CSID4477169 and has the highest score of all components identified in this study. Parent ion, m/z 355.1192, was also observed at 1.38 min which corresponds to [M-H2O-H] for 7-hydroxymatairesinol but was separated from m/z 477.1036 by drift time. The former being 4.3400 ms and the latter being 3.2550 ms. The main fragment for 7-Hydroxymatairesinol produced by MS/MS was m/z 340.0948 which also indicates a loss of CH3 i.e., [M-H2O- CH3-H].
At retention time 1.04 min m/z 337.0929 [M-H] was observed which gave rise to m/z 163.0389 as the main MS/MS product ion. This indicates the loss of coumaric acid and therefore leads to the identification of trans-5-O-(4-coumaroyl)-D-quinic acid (CSID4945466). Next, 3-(3,4-dihydroxyphenyl)-5,7-dihydroxy-2,3-dihydro-4H-chromen-4-one (CSID35015212) which was present as [2M-H]. [2M-H-140.0479] was observed as the main product ion which was probably due to a fission of the C-ring.
The 3-(3,4-dihydroxyphenyl)-2-methoxypropanoic acid (CSID35015213) was identified at 0.93 min by its [M-H2O-H] ion at m/z 193.0499 which was further validated by its main product ion m/z 109.0285 which relates to C6H5O2. At 2.57 min the [2M-H] ion relating to 5-(3,4,5-trihydroxybenzyl)dihydro-2(3H)-furanone is found (m/z 447.1289) with m/z 413.1239 [C11H9O3+e+M] and m/z 343.0811 [C7H5O2-H+M] being the major product ions resulting from the loss of 34.0050 Da and 104.0478 Da, respectively. An isotope similarity score of 95.4% and a mass accuracy of −1.6 ppm gave credibility to the empirical formula C11H12O5.
The identification of (-)-epigallocatechin was achieved via observation of the [M-H2O-H] adduct at m/z 287.0557 eluting at 1.23 min and the main MS/MS fragment of m/z 259.0605 [C14H12O5-H]. Next on the table of highest scoring identifications is genistein which is apparent as the [M-H] adduct (m/z 269.0448) at 3.85 min. The main MS/MS product ions of m/z 241.0487 [C14H10O4-H] and m/z 225.0542 [C14H8O3+e] strengthen this identification.
Dihydrodaidzein (CSID154076), was elucidated via its [M-H] adduct (m/z 255.0663) at 1.95 min. Major fragments of m/z 223.0749 [C15H10O2+e] and m/z 211.0750 [C14H10O2+e] were observed in the high energy MS/MS signal although other product ions were apparent. It is noted that its drift time of 2.3870 ms differs from that of the co-eluter identified as ferulic acid ([2M-H], m/z 387.1071) whose drift time was 3.2008 ms. This illustrates the benefit of the orthogonality of ion mobility spectrometry (IMS) in separating co-eluting components. Ferulic acid also gave the main product ions m/z 326.1159 [C9H7O+e+M] and m/z 311.0921 [C8H6O-H+M] which agreed with in silico fragmentation. On top of this, further complexity is added by the co-elution of 2 more compounds at 1.95 min. These are (+)-isolariciresinol ([M-H2O-H, M-H], 360.1577Da) and dalbergin ([M-H] m/z 267.0665) which have drift times of 3.4720 ms and 2.4955 ms, respectively. Good IMS separation can be seen across all four co-eluters in this cluster at 1.95 min which would have otherwise been difficult to transform into tentative identifications. This indicates four parent ions of different size and shape and therefore different CCS values. Portable CCS values are not yet available in databases, to our knowledge, but the future potential here for assisting identification is clear. For completeness the main MS/MS product ions for (+)-isolariciresinol were m/z 341.1394 [C20H22O5-H], m/z 326.1159 [C19H19O5-H], and m/z 283.0971 [C17H18O5 -H2O-H] and for dalbergin m/z 255.0645 [C15H11O4+e] and m/z 211.0750 [C14H11O2+e] were observed.
The 4′-methylepigallocatechin was identified in Progenesis QI at 2.37 min by its [2M-H] adduct at m/z 639.1708 and main product ions of m/z 285.0759 [C16H13O5+e] and m/z 183.1017 [C9H12O4 -H]. At 2.52 min, m/z 385.1639 was identified as the [M-H] adduct for the allergic inflammation mediator, gomisin M2, which was found at its highest abundance in lodge pole pine. From the MS/MS data, m/z 181.0866 [C10H13O3+e] was observed as the base peak. The 5,7-dihydroxy-3-(2-hydroxy-4-methoxyphenyl)-8-methoxy-4H-chromen-4-one (CSID30777598) was also identified from the [M-H] adduct when compared to Phenol-Explorer, which has an accurate mass of m/z 329.0663 at 2.49 min and a base peak product ion of m/z 301.0742 which corresponds to [C16H14O6-H].
The [M-H] adduct for procyanidin can be seen at 0.99 min although which isomer this corresponds to cannot be determined by accurate mass alone. The molecule could be B1, B2, B3 or B4. m/z 577.1345 has one base peak fragment at m/z 451.1006 [C24H19O9+e]. Comparison of retention time and drift time to analytical standards would help to clarify the correct isomer, or alternatively NMR. Close in terms of drift time to this is m/z 575.1191 which elutes at 0.66 min and is suggested to be eriodictyol as the [2M-H] adduct. This has product ions of m/z 451.1031 [C24H19O9+e], m/z 407.0770 [C22H16O8-H] and m/z 289.0711 [C15H13O6+e], which is the same (−1.9 ppm) as the ChemSpider published exact mass of the (-)-epicatechin [M-H] adduct. It is also noted that the flavan-3-ol, (-)-epicatechin is observed at 0.83 min and m/z 289.0723 [M-H] and is confirmed by its familiar fragment m/z 245.0811 which is due to the loss of 44 Da [M-CH3CHO-H] [58]. This component is ubiquitous throughout much of the plant kingdom and can, therefore, be seen to be present in all of the extracts analysed.
Quercetin-3′-glucuronide is identified at 1.70 min and m/z 477.0686 ([M-H]) which has a mass error of 2.4 ppm compared to its theoretical mass. Product ions were found at m/z 449.0737 which relates to [C20H18O12-H] and m/z 286.0115 which is due to the loss of the glucuronide moiety. Furthermore, norathyriol was identified by its [M-H] adduct which was visible at 1.22 min m/z 259.0243 with main product ions in MS/MS of m/z 231.0283 ([C12H8O5-H]) and m/z 203.0334 ([C11H8O4-H]). Isoliquiritigenin (CSID553829) was observed via its [M-H] adduct, m/z 255.0657, at 1.53 min with its product ion m/z 163.0385 [C9H7O3+e] seen as a result of MS/MS. The [2M-H] adduct for dihydrocaffeic acid was identified through its accurate mass of m/z 363.1081 at 1.25 min. The main ions produced in MS/MS were m/z 331.1187 [C9H8O2+e+M] and m/z 316.0947 [C8H8O2-H+M]. The mass error was −1.2 ppm and the isotope similarity scored high at 95.3 out of 100. Similarly, the [2M-H] adduct for 3,4-dihydroxy-5-methoxybenzoic acid was identified through its accurate mass of m/z 367.0654 at 1.48 min with the main product ion being m/z 333.0628 [C8H5O3+e+M].
Paeonol, which has a wealth of health claims in current research [59,60,61,62], was identified due to the accurate mass of its [2M-H] adduct which had a mass error of −0.4 ppm and an isotope similarity of 93.96. This produced a base peak fragment of m/z 316.0947 [C8H7O3-H+M] in the high energy MS/MS spectra.
Although it is clear that there are many different arrangements of phenol groups in (3R,4R)-4-(2,3-dihydroxybenzyl)-3-(3-hydroxybenzyl)dihydro-2(3H)-furanone, a tentative identification was made for this molecule, or the five positional isomers, through the [M-H2O-M] adduct. This was found at its highest abundance in Scots Pine. The base peak product ion was m/z 269.1185 [C18H18O5 -CO2-H] following the loss of CO2 from the deprotonated parent molecule.
Quercetin, which derives its name from the oak tree, is very much a common component found in the analysis of natural plant products. From its mass spectra, the [M-H]- adduct m/z 301.0357 is seen at 1.50 min which agrees with the accurate mass expected from theory and literature (mass error 1.2 ppm). The base peak product ion m/z 125.0239 is explained by fragment [C6H6O3 -H]. Epicatechin-3’-glucuronide was identified by its [M-H2O-H] adduct at 1.99 min. but could equally be identified as epicatechin-7-glucuronide. The product ions were used to aid with confirmation of identity with the observation of m/z 289.0712 [epicatechin -H] and the familiar fragment m/z 245.0807 [epicatechin - CH3CHO -H]. m/z 177.0535 relates to the remainder of the molecule after the separation of m/z 289.0712 i.e., glucuronic acid minus a phenol group.
The 7-hydroxy-3-(3-hydroxy-2,4-dimethoxyphenyl)-2,3-dihydro-4H-chromen-4-one was identified using its [M-H]- and [M-H2O-H]- adducts at 2.02 min. The mass error was −0.86 ppm. m/z 226.0617 [C11H14O5+e] was seen as the base peak product ion in the MS/MS spectra and also m/z 285.0746 was observed which arose due to the loss of CH3O and the formation of the [C16H13O5+e] ion. Urolithin A was found to be most abundant in Lodgepole Pine. It was identified by the [M-H] adduct at 1.51 min and the product ion at m/z 183.0436 which was explained by the loss of CO2, [M-CO2-H].
The identification of vanillin was made via the [3M-H] adduct at 0.41 min. and the product ion m/z 134.0361 which is thought to be [C8H7O2 -H] i.e., the loss of H2O from the parent. Coumaric acid was also identified although whether this was para or meta could not be determined by this technique. Accurate mass of the [2M-H] adduct was used which was present at 1.65 min plus the MS/MS fragment m/z 253.0860, [C7H4+e+M] was used for confirmation. From literature, naringenin was expected to be present in oak [63] and was found in greatest abundance in the oak extract data. Naringenin was identified by the [M-H] adduct only as the fragmentation was not conclusive and would therefore require more work to make this satisfactory.
The identification of 3-O-methylrosmarinic acid was aided by an array of fragments for identification. The [M-H2O-H] was detected at 2.21 min. From the MS/MS spectra, 3 product ions were chosen to strengthen the initial identification using accurate mass. m/z 195.0658 [C10H11O4+e], m/z 135.0443 [C8H7O2+e] and m/z 121.0284 [C7H6O2-H] were the qualifiers observed with m/z 135.0443 being the base peak. Matairesinol was identified at 2.17 min by its [M-H] adduct and the MS/MS fragment m/z 342.1099 [C19H19O6 -H]. The parent ion showed a 0.44 ppm mass error compared to its theoretical mass and had an isotope similarity of 96.35. To conclude this section, 5’-methoxy-O-desmethylangolensin was identified at 1.36 min by its [M-H] adduct and the MS/MS fragment m/z 257.0808 [C15H13O4+e]. The [M-H] adduct showed a −0.42 ppm mass error compared to its theoretical mass and had an isotope similarity of 91.64.

3.3. Potential Use of Bark Waste for Nutraceutical Production

The wide spectrum of polyphenols found in these bark samples illustrates the potential to produce a nutritional supplement from a range of tree species. It also raises the possibility to blend products from different tree species to obtain a more balanced bioactive phenolic profile. This may involve the use of other tree species not investigated here which may have vastly different physical structures and chemical compositions (e.g., Betula spp., Salix spp., and Eucalyptus spp.). In addition, an expansion of this study is necessary to provide more detail on the importance of factors which may affect the polyphenol profile, such as tree stand age, harvesting season, time, and conditions of storage prior to processing. Future work should also focus on the most efficient and cost-effective extraction techniques. One such route, would be to investigate the use of supercritical fluid extraction i.e., liquid CO2 (and possibly modifiers such as ethanol) as a food-friendly alternative to the processes detailed here. The fast diffusion rate of liquid CO2 may result in more rapid extraction. Furthermore, it is shown that different enzymatic pre-treatments can facilitate control of selectivity as to which components are extracted [64]. Extraction solvents may also be recycled from batch to batch. Future work should also focus on the use of the solid waste remaining after the extraction process e.g., conversion into fuel pellets [65].

4. Conclusions

Here we demonstrate the effective use of UPLC-HDMSE for the detailed analysis of forestry waste and its application in the development of novel food nutritional supplements. In our extracts we identified 35 components with bioactive properties which have the potential to benefit human and animal health by providing a preventative measure against many life threatening conditions. Furthermore, the phenolic components can be easily extracted from low value forestry waste making the low carbon process suitable for commercialisation.

Supplementary Materials

The following are available online at https://www.mdpi.com/2227-9717/8/11/1411/s1, Figure S1: Total ion chromatogram of Lodge Pole Pine, Figure S2: Ion intensity map of Lodge Pole Pine, Figure S3: Total ion chromatogram of Oak, Figure S4: Ion intensity map of Oak, Figure S5: Total ion chromatogram of Scots Pine, Figure S6: Ion intensity map of Scots Pine, Figure S7: Total ion chromatogram of Pycnogenol®, Figure S8: Ion intensity map of Pycnogenol®, Figure S9 Molecular structures of identifications ordered from high to low score value, Figure S10 Mass spectra of identifications ordered from high to low score value, Figure S11 Loadings bi-plot of the bark extract data, XL SM is a spreadsheet of identifications, abundances and additional references.

Author Contributions

The project was conceptualized by C.M.P. who was also responsible for methodology and formal analysis. The samples were prepared and analysed by C.M.P. The first draft of the manuscript was prepared by C.M.P. and reviewed and edited by D.L.J. All authors have read and agreed to the published version of the manuscript.

Funding

This research received no external funding.

Acknowledgments

The authors are very grateful to the Welsh European Funding Office (WEFO) for funding the Centre for Environmental Technology at Bangor University. The authors also acknowledge the kind support of Brian Warner of B. R. Warner Services Ltd. and Radek Braganca at the BioComposites Centre, Bangor University. Furthermore, the kind assistance of E.S. Potter is acknowledged for her work in the creation of the heat map.

Conflicts of Interest

The authors declare that they have no known competing financial interests or personal relationships that could have appeared to influence the work reported in this paper.

References

  1. El Gharras, H. Polyphenols: Food sources, properties and applications—A review. Int. J. Food Sci. Technol. 2009, 44, 2512–2518. [Google Scholar] [CrossRef]
  2. De La Iglesia, R.; Milagro, F.I.; Campión, J.; Boqué, N.; Martínez, J.A. Healthy properties of proanthocyanidins. BioFactors 2010, 36, 159–168. [Google Scholar] [CrossRef] [PubMed]
  3. Krikorian, R.; Kalt, W.; Mcdonald, J.E.; Shidler, M.D.; Summer, S.S.; Stein, A.L. Cognitive performance in relation to urinary anthocyanins and their fl avonoid-based products following blueberry supplementation in older adults at risk for dementia. J. Funct. Foods 2019, 103667. [Google Scholar] [CrossRef]
  4. Watson, R.R.; Preedy, S.Z. Polyphenols in Human Health and Disease; Academic Press: Cambridge, MA, USA, 2014; Volume 1. [Google Scholar]
  5. Lattanzio, V.; Kroon, P.A.; Ralph, J.; Harris, P.; Dixon, R.A.; Dangles, O.; Lamotte, O. Recent Advances in Polyphenol Research; John Wiley & Sons: Hoboken, NJ, USA, 2008; Volume 1. [Google Scholar]
  6. Liu, Y.; Jia, G.; Gou, L.; Sun, L.; Fu, X.; Lan, N.; Li, S.; Yin, X. Antidepressant-like effects of tea polyphenols on mouse model of chronic unpredictable mild stress. Pharmacol. Biochem. Behav. 2013, 104, 27–32. [Google Scholar] [CrossRef] [PubMed]
  7. Panickar, K.S. Effects of dietary polyphenols on neuroregulatory factors and pathways that mediate food intake and energy regulation in obesity. Mol. Nutr. Food Res. 2013, 57, 34–47. [Google Scholar] [CrossRef] [PubMed]
  8. McDougall, G.J.; Stewart, D. The inhibitory effects of berry polyphenols on digestive enzymes. BioFactors 2005, 23, 189–195. [Google Scholar] [CrossRef]
  9. Zhang, W.L.; Zhu, L.; Jiang, J.G. Active ingredients from natural botanicals in the treatment of obesity. Obes. Rev. 2014, 15, 957–967. [Google Scholar] [CrossRef]
  10. Wang, S.; Moustaid-Moussa, N.; Chen, L.X.; Mo, H.B.; Shastri, A.; Su, R.; Bapat, P.; Kwun, I.; Shen, C.L. Novel insights of dietary polyphenols and obesity. J. Nutr. Biochem. 2014, 25, 1–18. [Google Scholar] [CrossRef] [Green Version]
  11. Alonso, V.R.; Guarner, F. Linking the gut microbiota to human health. Br. J. Nutr. 2013, 109 (Suppl. 2), S21–S26. [Google Scholar] [CrossRef] [Green Version]
  12. Espley, R.V.; Bovy, A.; Bava, C.; Jaeger, S.R.; Tomes, S.; Norling, C.; Crawford, J.; Rowan, D.; McGhie, T.K.; Brendolise, C.; et al. Analysis of genetically modified red-fleshed apples reveals effects on growth and consumer attributes. Plant Biotechnol. J. 2013, 11, 408–419. [Google Scholar] [CrossRef]
  13. Martinez-Dominguez, E.; de la Puerta, R.; Ruiz-Gutierrez, V. Protective effects upon experimental inflammation models of a polyphenol-supplemented virgin olive oil diet. Inflamm. Res. 2001, 50, 102–106. [Google Scholar]
  14. Cory, H.; Passarelli, S.; Szeto, J.; Tamez, M.; Mattei, J. The role of polyphenols in human health and food systems: A mini-review. Front. Nutr. 2018, 5, 87. [Google Scholar] [CrossRef] [PubMed] [Green Version]
  15. Vejdovszky, K.; Schmidt, V.; Warth, B.; Marko, D. Combinatory estrogenic effects between the isoflavone genistein and the mycotoxins zearalenone and alternariol in vitro. Mol. Nutr. Food Res. 2017, 61, 1600526. [Google Scholar] [CrossRef]
  16. Jain, A.; Manghani, C.; Kohli, S.; Nigam, D.; Rani, V. Tea and human health: The dark shadows. Toxicol. Lett. 2013, 220, 82–87. [Google Scholar] [CrossRef]
  17. Kumar, P.S.; Kumar, N.A.; Sivakumar, R.; Kaushik, C. Experimentation on solvent extraction of polyphenols from natural waste. J. Mater. Sci. 2009, 44, 5894–5899. [Google Scholar] [CrossRef]
  18. Bolling, B.W.; Chen, C.-Y.O.; McKay, D.L.; Blumberg, J.B. Tree nut phytochemicals: Composition, antioxidant capacity, bioactivity, impact factors. Nutr. Res. Rev. 2011, 24, 244–275. [Google Scholar] [CrossRef] [PubMed] [Green Version]
  19. Withouck, H.; Boeykens, A.; Broucke, M.V.; Moreira, M.M.; Delerue-Matos, C.; De Cooman, L. Evaluation of the impact of pre-treatment and extraction conditions on the polyphenolic profile and antioxidant activity of Belgium apple wood. Eur. Food Res. Technol. 2019, 245, 2565–2578. [Google Scholar] [CrossRef]
  20. Feldman, E.B. The scientific evidence for a beneficial health relationship between walnuts and coronary heart disease. J. Nutr. 2002, 132, 1062S–1101S. [Google Scholar] [CrossRef] [PubMed]
  21. Debeljak, J.; Ferk, P.; Čokolič, M.; Zavratnik, A.; Tavč Benković, E.; Kreft, S.; Štrukelj, B. Randomised, double blind, cross-over, placebo and active controlled human pharmacodynamic study on the influence of silver fir wood extract (Belinal) on post-prandial glycemic response. Pharmazie 2016, 71, 566–569. [Google Scholar] [CrossRef]
  22. Ogawa, S.; Matsuo, Y.; Tanaka, T.; Yazaki, Y. Utilization of flavonoid compounds from bark and wood. III. Application in health foods. Molecules 2018, 23, 1860. [Google Scholar] [CrossRef] [Green Version]
  23. Liu, J.K.; Henkel, T. Traditional Chinese medicine (TCM): Are polyphenols and saponins the key ingredients triggering biological activities? Curr. Med. Chem. 2002, 9, 1483–1485. [Google Scholar] [CrossRef]
  24. Gironi, F.; Piemonte, V. Temperature and solvent effects on polyphenol extraction process from chestnut tree wood. Chem. Eng. Res. Des. 2011, 89, 857–862. [Google Scholar] [CrossRef]
  25. Comandini, P.; Lerma-García, M.J.; Simó-Alfonso, E.F.; Toschi, T.G. Tannin analysis of chestnut bark samples (Castanea sativa Mill.) by HPLC-DAD-MS. Food Chem. 2014, 157, 290–295. [Google Scholar] [CrossRef]
  26. Câmara, C.R.S.; Schlegel, V. A review on the potential human health benefits of the black walnut: A comparison with the english walnuts and other tree nuts. Int. J. Food Prop. 2016, 19, 2175–2189. [Google Scholar] [CrossRef]
  27. Donno, D.; Boggia, R.; Zunin, P.; Cerutti, A.K.; Guido, M.; Mellano, M.G.; Prgomet, Z.; Beccaro, G.L. Phytochemical fingerprint and chemometrics for natural food preparation pattern recognition: An innovative technique in food supplement quality control. J. Food Sci. Technol. Mysore 2016, 53, 1071–1083. [Google Scholar] [CrossRef] [Green Version]
  28. Zhang, X.X.; Shi, Q.Q.; Ji, D.; Niu, L.X.; Zhang, Y.L. Determination of the phenolic content, profile, and antioxidant activity of seeds from nine tree peony (Paeonia section Moutan DC.) species native to China. Food Res. Int. 2017, 97, 141–148. [Google Scholar] [CrossRef]
  29. Mailer, R.; Ayton, J. Effect of irrigation and water stress on olive oil quality and yield based on a four year study. Acta Hortic. 2011, 888, 63–72. [Google Scholar] [CrossRef]
  30. Souza, R.T.D.A.; Silva, D.K.D.A.; Santos, M.V.F.D.; Naumann, H.D.; Magalhães, A.L.R.; Andrade, A.P.D. Association of edaphoclimatic characteristics and variability of condensed tannin content in species from Caatinga. Rev. Cienc. Agron. 2020, 51, e20196611. [Google Scholar] [CrossRef]
  31. Fraser, K.; Harrison, S.J.; Lane, G.A.; Otter, D.E.; Hemar, Y.; Quek, S.Y.; Rasmussen, S. Analysis of low molecular weight metabolites in tea using mass spectrometry-based analytical methods. Crit. Rev. Food Sci. Nutr. 2014, 54, 924–937. [Google Scholar] [CrossRef] [PubMed]
  32. Kang, K.B.; Woo, S.; Ernst, M.; van der Hooft, J.J.; Nothias, L.F.; da Silva, R.R.; Dorrestein, P.C.; Sung, S.H.; Lee, M. Assessing specialized metabolite diversity of Alnus species by a digitized LC-MS/MS data analysis workflow. Phytochemistry 2020, 173, 11229. [Google Scholar] [CrossRef]
  33. Rocchetti, G.; Blasi, F.; Montesano, D.; Ghisoni, S.; Marcotullio, M.C.; Sabatini, S.; Cossignani, L.; Lucini, L. Impact of conventional/non-conventional extraction methods on the untargeted phenolic profile of Moringa oleifera leaves. Food Res. Int. 2019, 115, 319–327. [Google Scholar] [CrossRef]
  34. Damiani, E.; Carloni, P.; Rocchetti, G.; Senizza, B.; Tiano, L.; Joubert, E.; de Beer, D.; Lucini, L. Impact of cold versus hot brewing on the phenolic profile and antioxidant capacity of rooibos (Aspalathus linearis) herbal tea. Antioxidants 2019, 8, 499. [Google Scholar] [CrossRef] [Green Version]
  35. Zhang, C.; Zuo, T.; Wang, X.; Wang, H.; Hu, Y.; Li, Z.; Li, W.; Jia, L.; Qian, Y.; Yang, W.; et al. Integration of data-dependent acquisition (DDA) and data-independent high-definition MSE (HDMSE) for the comprehensive profiling and characterization of multicomponents from panax japonicus by UHPLC/IM-QTOF-MS. Molecules 2019, 24, 2708. [Google Scholar] [CrossRef] [Green Version]
  36. Johnson, S.R.; Rikli, H.G. Aspartic acid isomerization characterized by high definition mass spectrometry significantly alters the bioactivity of a novel toxin from poecilotheria. Toxins 2020, 12, 207. [Google Scholar] [CrossRef] [Green Version]
  37. Rohdewald, P. A review of the French maritime pine bark extract (Pycnogenol (R)), a herbal medication with a diverse clinical pharmacology. Int. J. Clin. Pharmacol. Ther. 2002, 40, 158–168. [Google Scholar] [CrossRef]
  38. Mármol, I.; Quero, J.; Jiménez-Moreno, N.; Rodríguez-Yoldi, M.J.; Ancín-Azpilicueta, C. A systematic review of the potential uses of pine bark in food industry and health care. Trends Food Sci. Technol. 2019, 88, 558–566. [Google Scholar] [CrossRef]
  39. Fogacci, F.; Tocci, G.; Sahebkar, A.; Presta, V.; Banach, M.; Cicero, A.F.G. Effect of pycnogenol on blood pressure: Findings from a PRISMA compliant systematic review and meta-analysis of randomized, double-blind, placebo-controlled, clinical studies. Angiology 2020, 71, 217–225. [Google Scholar] [CrossRef]
  40. Mello, B.C.B.S.; Petrus, J.C.C.; Hubinger, M.D. Concentration of flavonoids and phenolic compounds in aqueous and ethanolic propolis extracts through nanofiltration. J. Food Eng. 2010, 96, 533–539. [Google Scholar] [CrossRef]
  41. EU. Directive 2009/32/EC of the European Parliament and of the Council of 23 April 2009 on the Approximation of the Laws of the Member States on Extraction Solvents Used in the Production of Foodstuffs and Food Ingredients. 2009. Available online: https://eur-lex.europa.eu/legal-content/EN/ALL/?uri=CELEX%3A32009L0032 (accessed on 3 November 2020).
  42. Vos, F.; Crespy, V.; Chaffaut, L.; Mennen, L.; Knox, C.; Neveu, V. Original article phenol-explorer: An online comprehensive database on polyphenol contents in foods. Database 2010, 2010, bap024. [Google Scholar] [CrossRef]
  43. Salehi, B.; Fokou, P.V.T.; Sharifi-Rad, M.; Zucca, P.; Pezzani, R.; Martins, N.; Sharifi-Rad, J. The therapeutic potential of naringenin: A review of clinical trials. Pharmaceuticals 2019, 12, 11. [Google Scholar] [CrossRef] [Green Version]
  44. Mastino, P.M.; Mauro, M.; Jean, C.; Juliano, C.; Marianna, U. Analysis and potential antimicrobial activity of phenolic compounds in the extracts of cistus creticus subspecies from sardinia. Nat. Prod. J. 2018, 8, 166–174. [Google Scholar] [CrossRef]
  45. Forney, L.; Lenard, N.; Stewart, L.; Henagan, T. Dietary quercetin attenuates adipose tissue expansion and inflammation and alters adipocyte morphology in a tissue-specific manner. Int. J. Mol. Sci. 2018, 19, 895. [Google Scholar] [CrossRef] [Green Version]
  46. Rotelli, A.E.; Guardia, T.; Juárez, A.O.; De La Rocha, N.E.; Pelzer, L.E. Comparative study of flavonoids in experimental models of inflammation. Pharmacol. Res. 2003, 48, 601–606. [Google Scholar] [CrossRef]
  47. Hameed, A.; Hafizur, R.M.; Hussain, N.; Raza, S.A.; Rehman, M.; Ashraf, S.; Ul-Haq, Z.; Khan, F.; Abbas, G.; Choudhary, M.I. Eriodictyol stimulates insulin secretion through cAMP/PKA signaling pathway in mice islets. Eur. J. Pharmacol. 2018, 820, 245–255. [Google Scholar] [CrossRef] [PubMed]
  48. de Oliveira Ferreira, E.; Fernandes, M.Y.S.D.; de Lima, N.M.R.; Neves, K.R.T.; do Carmo, M.R.S.; Lima, F.A.V.; Fonteles, A.A.; Menezes, A.P.F.; de Andrade, G.M. Neuroinflammatory response to experimental stroke is inhibited by eriodictyol. Behav. Brain Res. 2016, 312, 321–332. [Google Scholar] [CrossRef]
  49. Wang, Y.; Chen, Y.; Chen, Y.; Zhou, B.; Shan, X.; Yang, G. Biomedicine & pharmacotherapy eriodictyol inhibits IL-1β-induced in fl ammatory response in human osteoarthritis chondrocytes. Biomed. Pharmacother. 2018, 107, 1128–1134. [Google Scholar] [CrossRef] [PubMed]
  50. Prakash, M.; Basavaraj, B.V.; Chidambara Murthy, K.N. Biological functions of epicatechin: Plant cell to human cell health. J. Funct. Foods 2019, 52, 14–24. [Google Scholar] [CrossRef]
  51. Bernatova, I. Biological activities of (−)-epicatechin and (−)-epicatechin-containing foods: Focus on cardiovascular and neuropsychological health. Biotechnol. Adv. 2018, 36, 666–681. [Google Scholar] [CrossRef] [PubMed]
  52. Wu, Q.; Needs, P.W.; Lu, Y.; Kroon, P.A.; Ren, D.; Yang, X. Different antitumor effects of quercetin, quercetin-3′-sulfate and quercetin-3-glucuronide in human breast cancer MCF-7 cells. Food Funct. 2018, 9, 1736–1746. [Google Scholar] [CrossRef]
  53. Li, J.; Malakhova, M.; Mottamal, M.; Reddy, K.; Kurinov, I.; Carper, A.; Langfald, A.; Oi, N.; Kim, M.O.; Zhu, F.; et al. Norathyriol suppresses skin cancers induced by solar ultraviolet radiation by targeting ERK kinases. Cancer Res. 2012, 72, 260–271. [Google Scholar] [CrossRef] [Green Version]
  54. Lin, H.; Tu, C.; Niu, Y.; Li, F.; Yuan, L.; Li, N.; Xu, A.; Gao, L.; Li, L. Dual actions of norathyriol as a new candidate hypouricaemic agent: Uricosuric effects and xanthine oxidase inhibition. Eur. J. Pharmacol. 2019, 853, 371–380. [Google Scholar] [CrossRef] [PubMed]
  55. Li, J.; Liu, M.; Yu, H.; Wang, W.; Han, L.; Chen, Q.; Ruan, J.; Wen, S.; Zhang, Y.; Wang, T. Mangiferin improves hepatic lipid metabolism mainly through its metabolite-norathyriol by modulating SIRT-1/AMPK/SREBP-1c signaling. Front. Pharmacol. 2018, 9, 1–13. [Google Scholar] [CrossRef]
  56. Lee, Y. Cancer chemopreventive potential of procyanidin. Toxicol. Res. 2017, 33, 273–282. [Google Scholar] [CrossRef] [PubMed]
  57. Lopes, N.P. Natural product reports. Nat. Prod. Rep. 2016, 33. [Google Scholar] [CrossRef] [Green Version]
  58. Pandey, R.; Chandra, P.; Arya, K.R.; Kumar, B. Development and validation of an ultra high performance liquid chromatography electrospray ionization tandem mass spectrometry method for the simultaneous determination of selected flavonoids in Ginkgo biloba. J. Sep. Sci. 2014, 37, 3610–3618. [Google Scholar] [CrossRef]
  59. Hsieh, C.L.; Cheng, C.Y.; Tsai, T.H.; Lin, I.H.; Liu, C.H.; Chiang, S.Y.; Lin, J.G.; Lao, C.J.; Tang, N.Y. Paeonol reduced cerebral infarction involving the superoxide anion and microglia activation in ischemia-reperfusion injured rats. J. Ethnopharmacol. 2006, 106, 208–215. [Google Scholar] [CrossRef]
  60. Kim, S.H.; Kim, S.A.; Park, M.K.; Kim, S.H.; Park, Y.D.; Na, H.J.; Kim, H.M.; Shin, M.K.; Ahn, K.S. Paeonol inhibits anaphylactic reaction by regulating histamine and TNF-α. Int. Immunopharmacol. 2004, 4, 279–287. [Google Scholar] [CrossRef]
  61. Wu, J.B.; Song, N.N.; Wei, X.B.; Guan, H.S.; Zhang, X.M. Protective effects of paeonol on cultured rat hippocampal neurons against oxygen-glucose deprivation-induced injury. J. Neurol. Sci. 2008, 264, 50–55. [Google Scholar] [CrossRef]
  62. Ye, S.; Liu, X.; Mao, B.; Yang, L.; Liu, N. Paeonol enhances thrombus recanalization by inducing vascular endothelial growth factor 165 via ERK1/2 MAPK signaling pathway. Mol. Med. Rep. 2016, 13, 4853–4858. [Google Scholar] [CrossRef] [Green Version]
  63. Zhang, B.; Cai, J.; Duan, C.-Q.; Reeves, M.J.; He, F. A review of polyphenolics in oak woods. Int. J. Mol. Sci. 2015, 16, 6978–7014. [Google Scholar] [CrossRef]
  64. Mill, O.L.; Antunes-ricardo, M.; García-cayuela, T.; Ibañez, E. Enzyme-assisted in situ supercritical fluid extraction of isorhamnetin conjugates from Opuntia ficus-indica (L.) Mill Marilena Antunes-Ricardo. Inst. Food Sci. Res. 2019, 141, 71–72. [Google Scholar] [CrossRef]
  65. Arshadi, M.; Gref, R.; Geladi, P.; Dahlqvist, S.A.; Lestander, T. The influence of raw material characteristics on the industrial pelletizing process and pellet quality. Fuel Process. Technol. 2008, 89, 1442–1447. [Google Scholar] [CrossRef]
Figure 1. Heat map created using averaged abundances for each sample type across the 35 tentatively identified polyphenols.
Processes 08 01411 g001
Figure 2. Scores plot with Pareto scaling showing tight clustering of the bark extract sample replicates and separation between bark types including an expanded area view of the more closely situated clusters.
Processes 08 01411 g002
Publisher’s Note: MDPI stays neutral with regard to jurisdictional claims in published maps and institutional affiliations.

