Direct Solid Oxide Electrolysis of Carbon Dioxide: Analysis of Performance and Processes

 , ,
, ,  and
and
Abstract
1. Introduction
2. Materials and Methods
3. Results
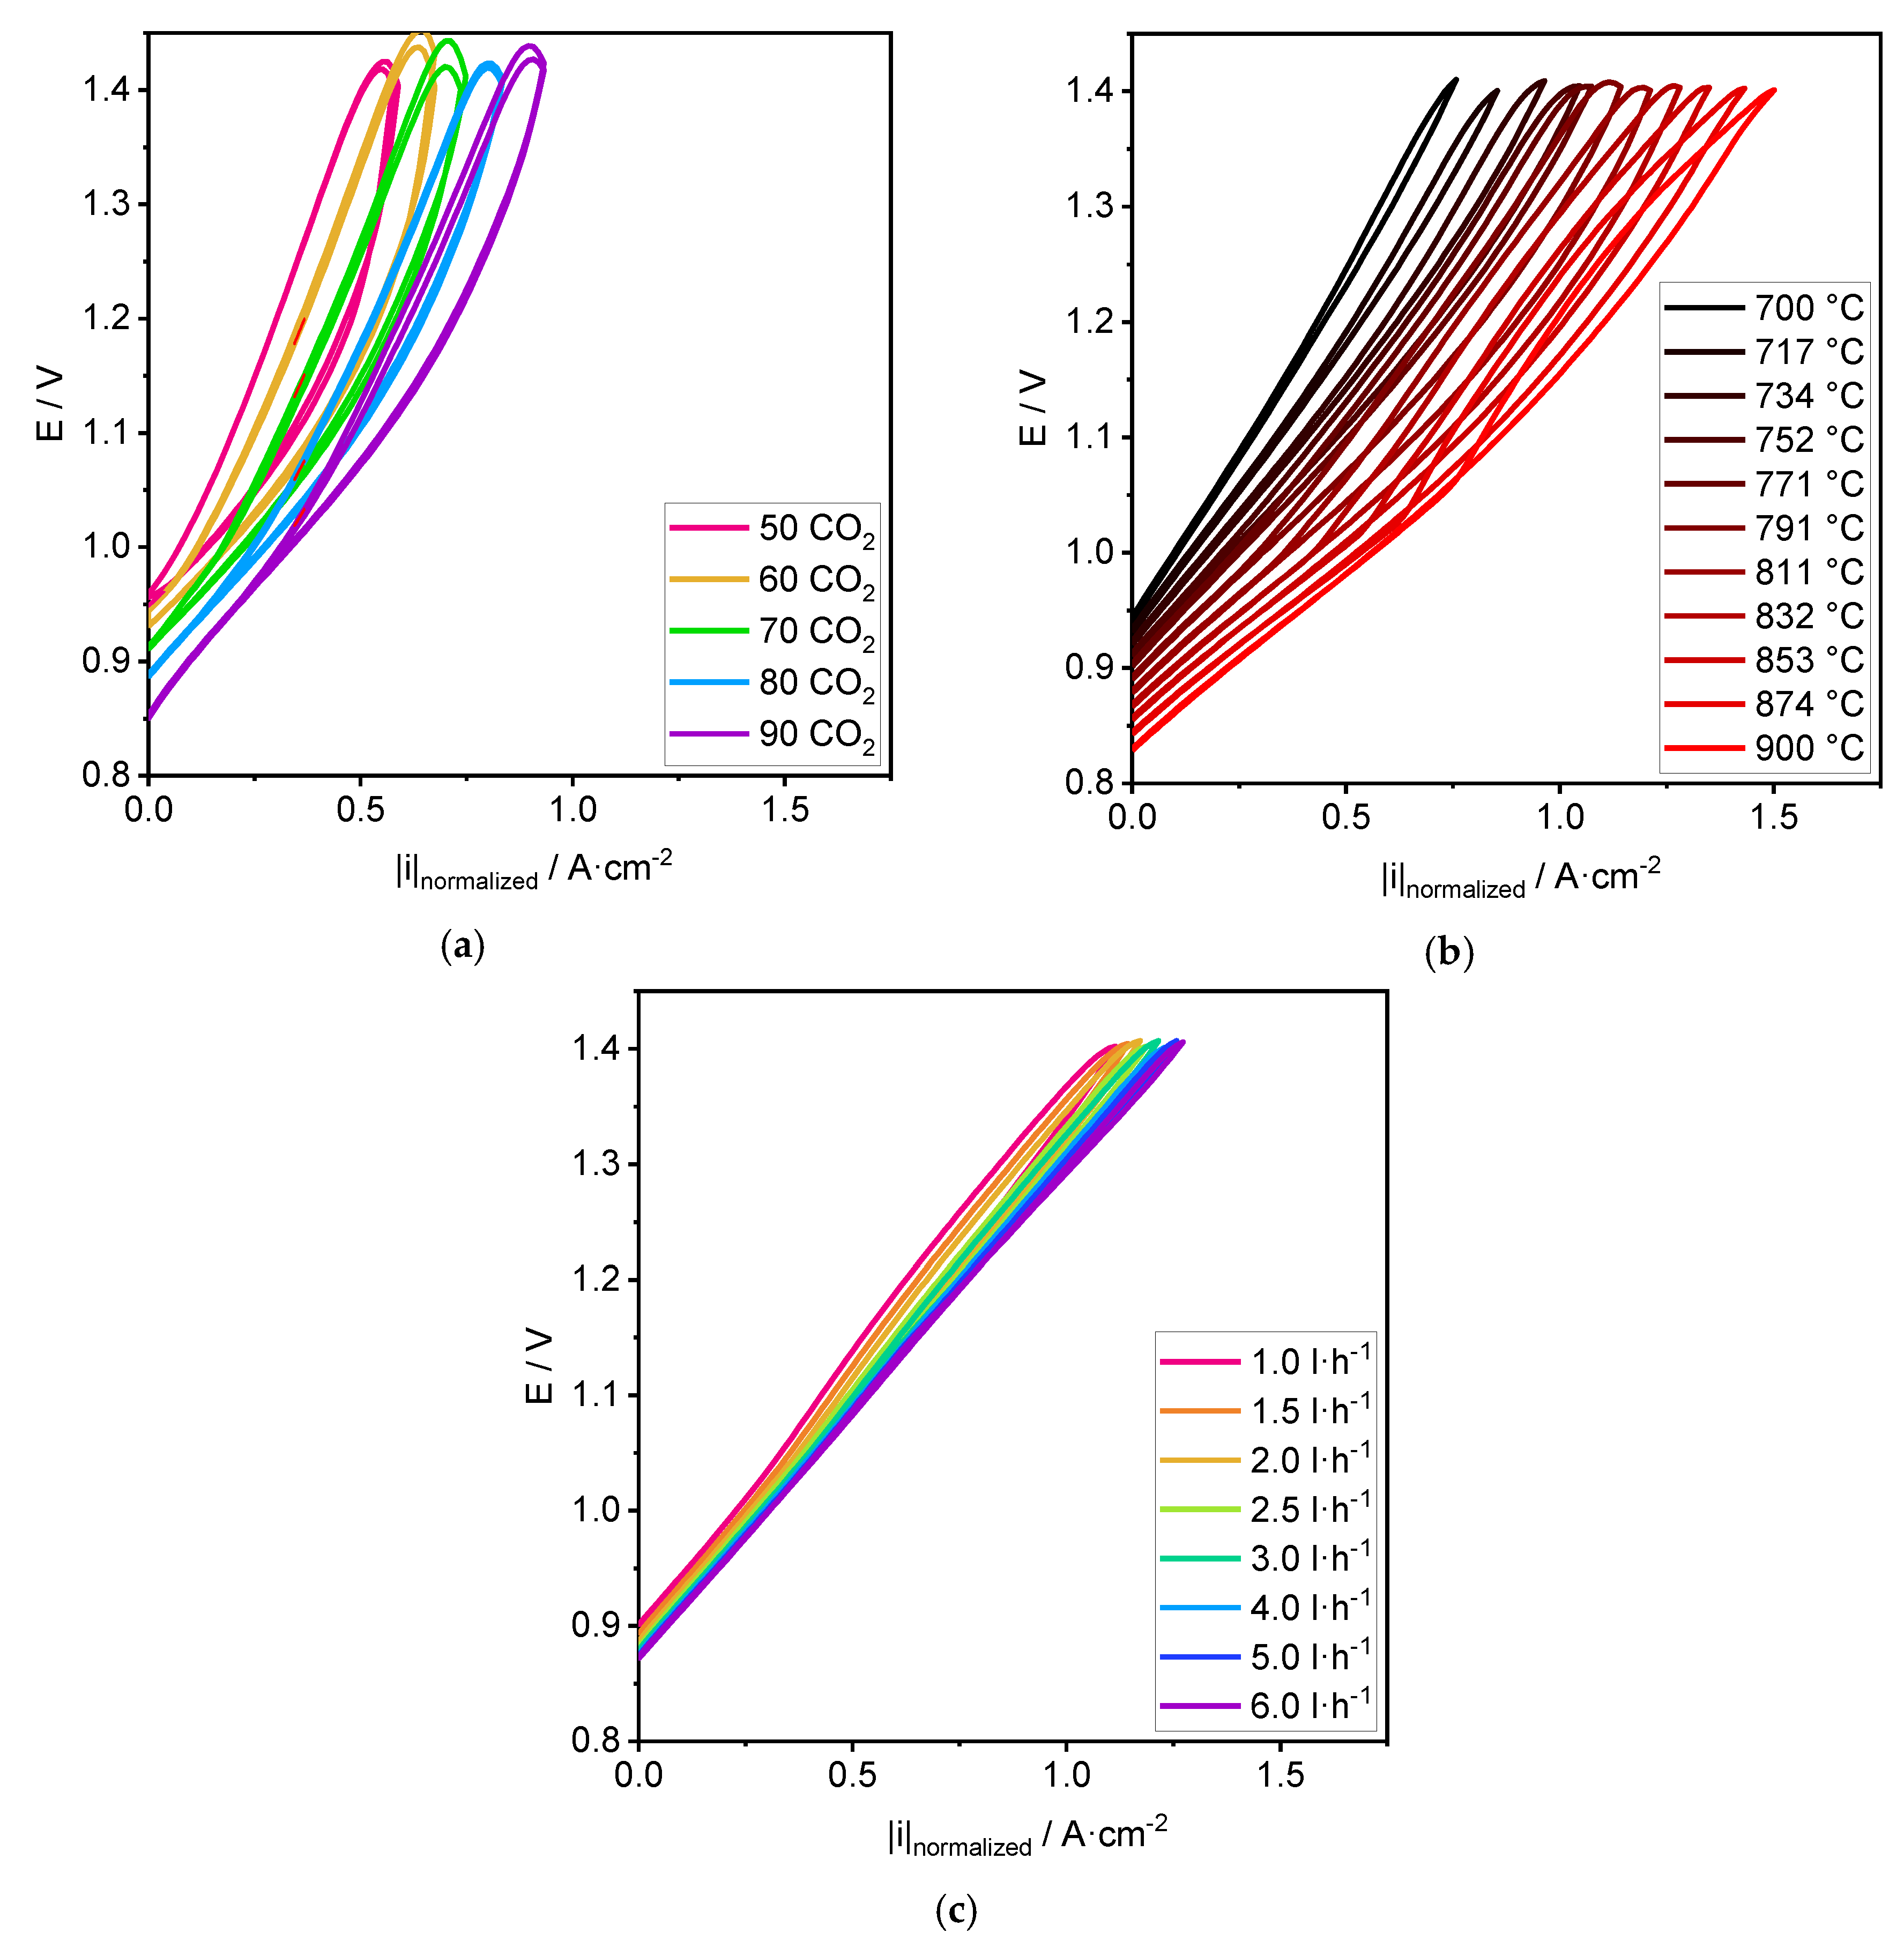
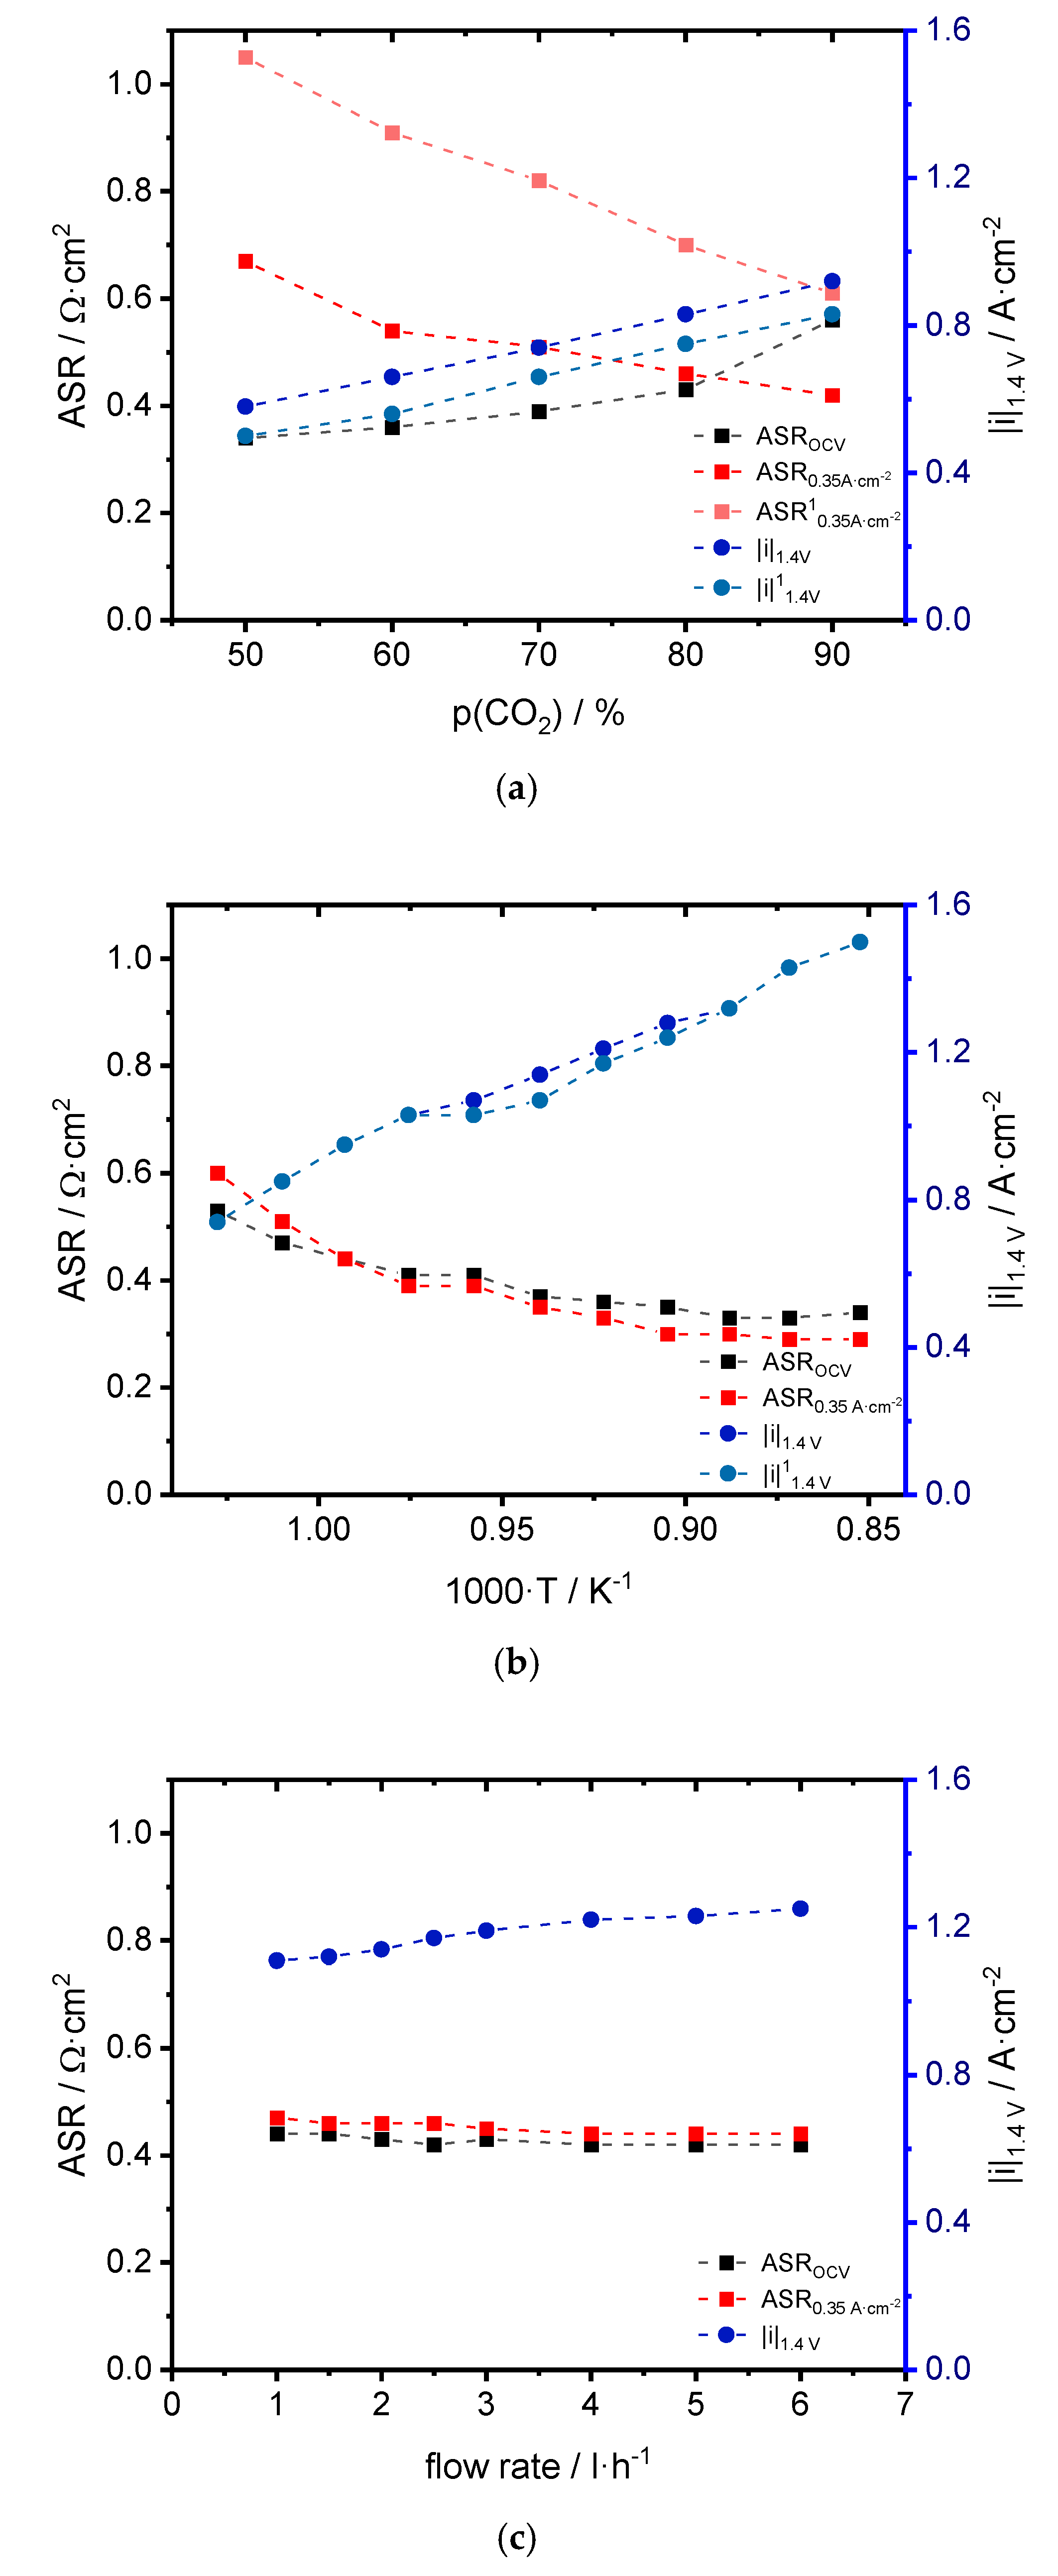
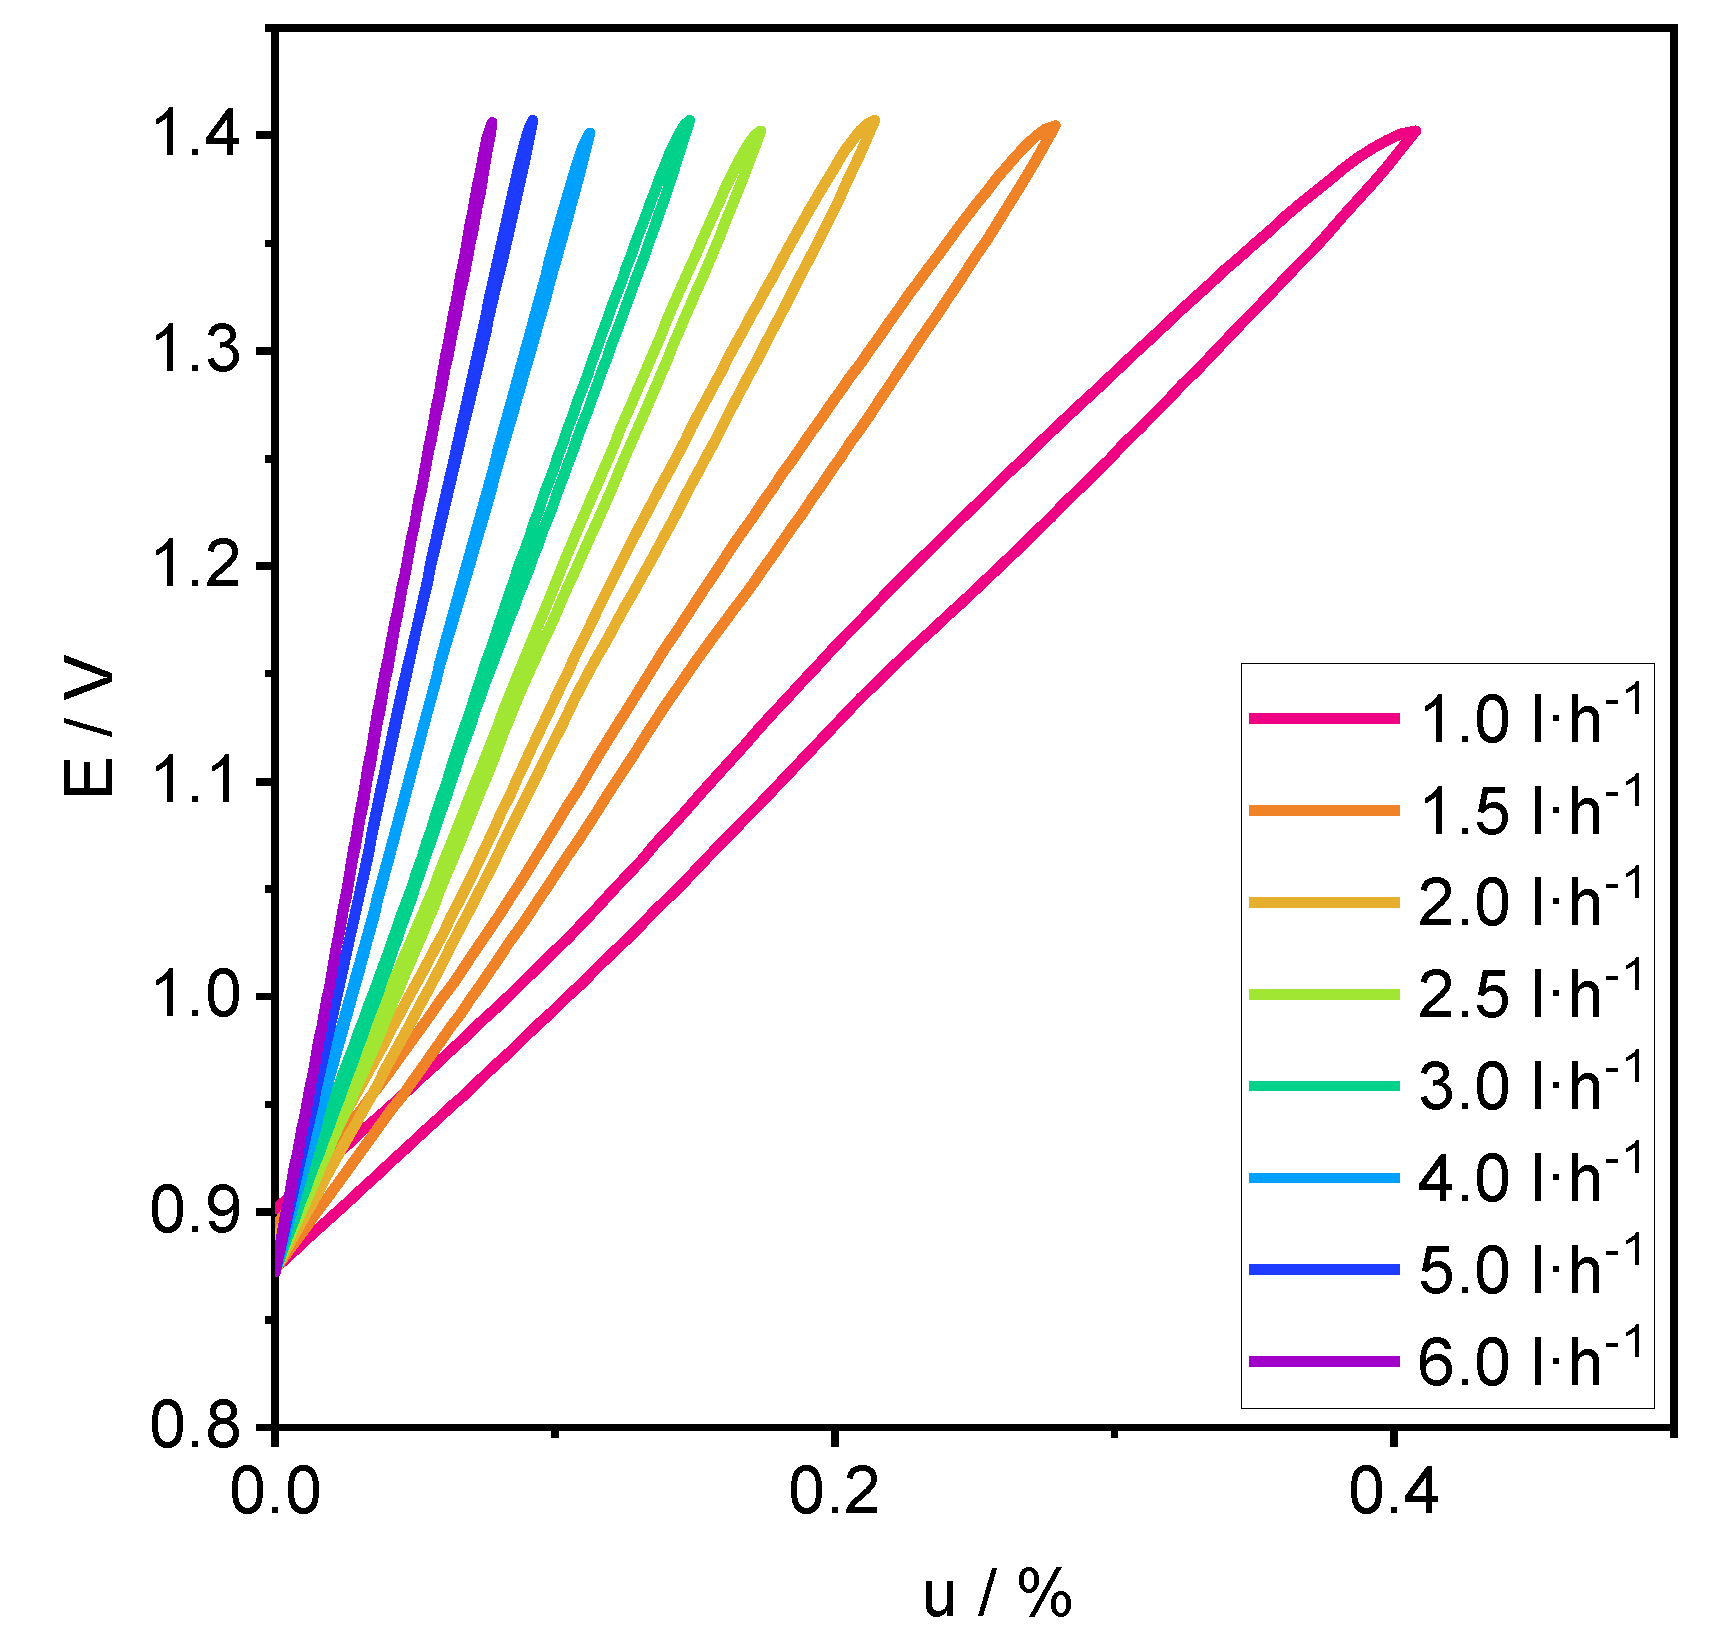
3.1. Performance
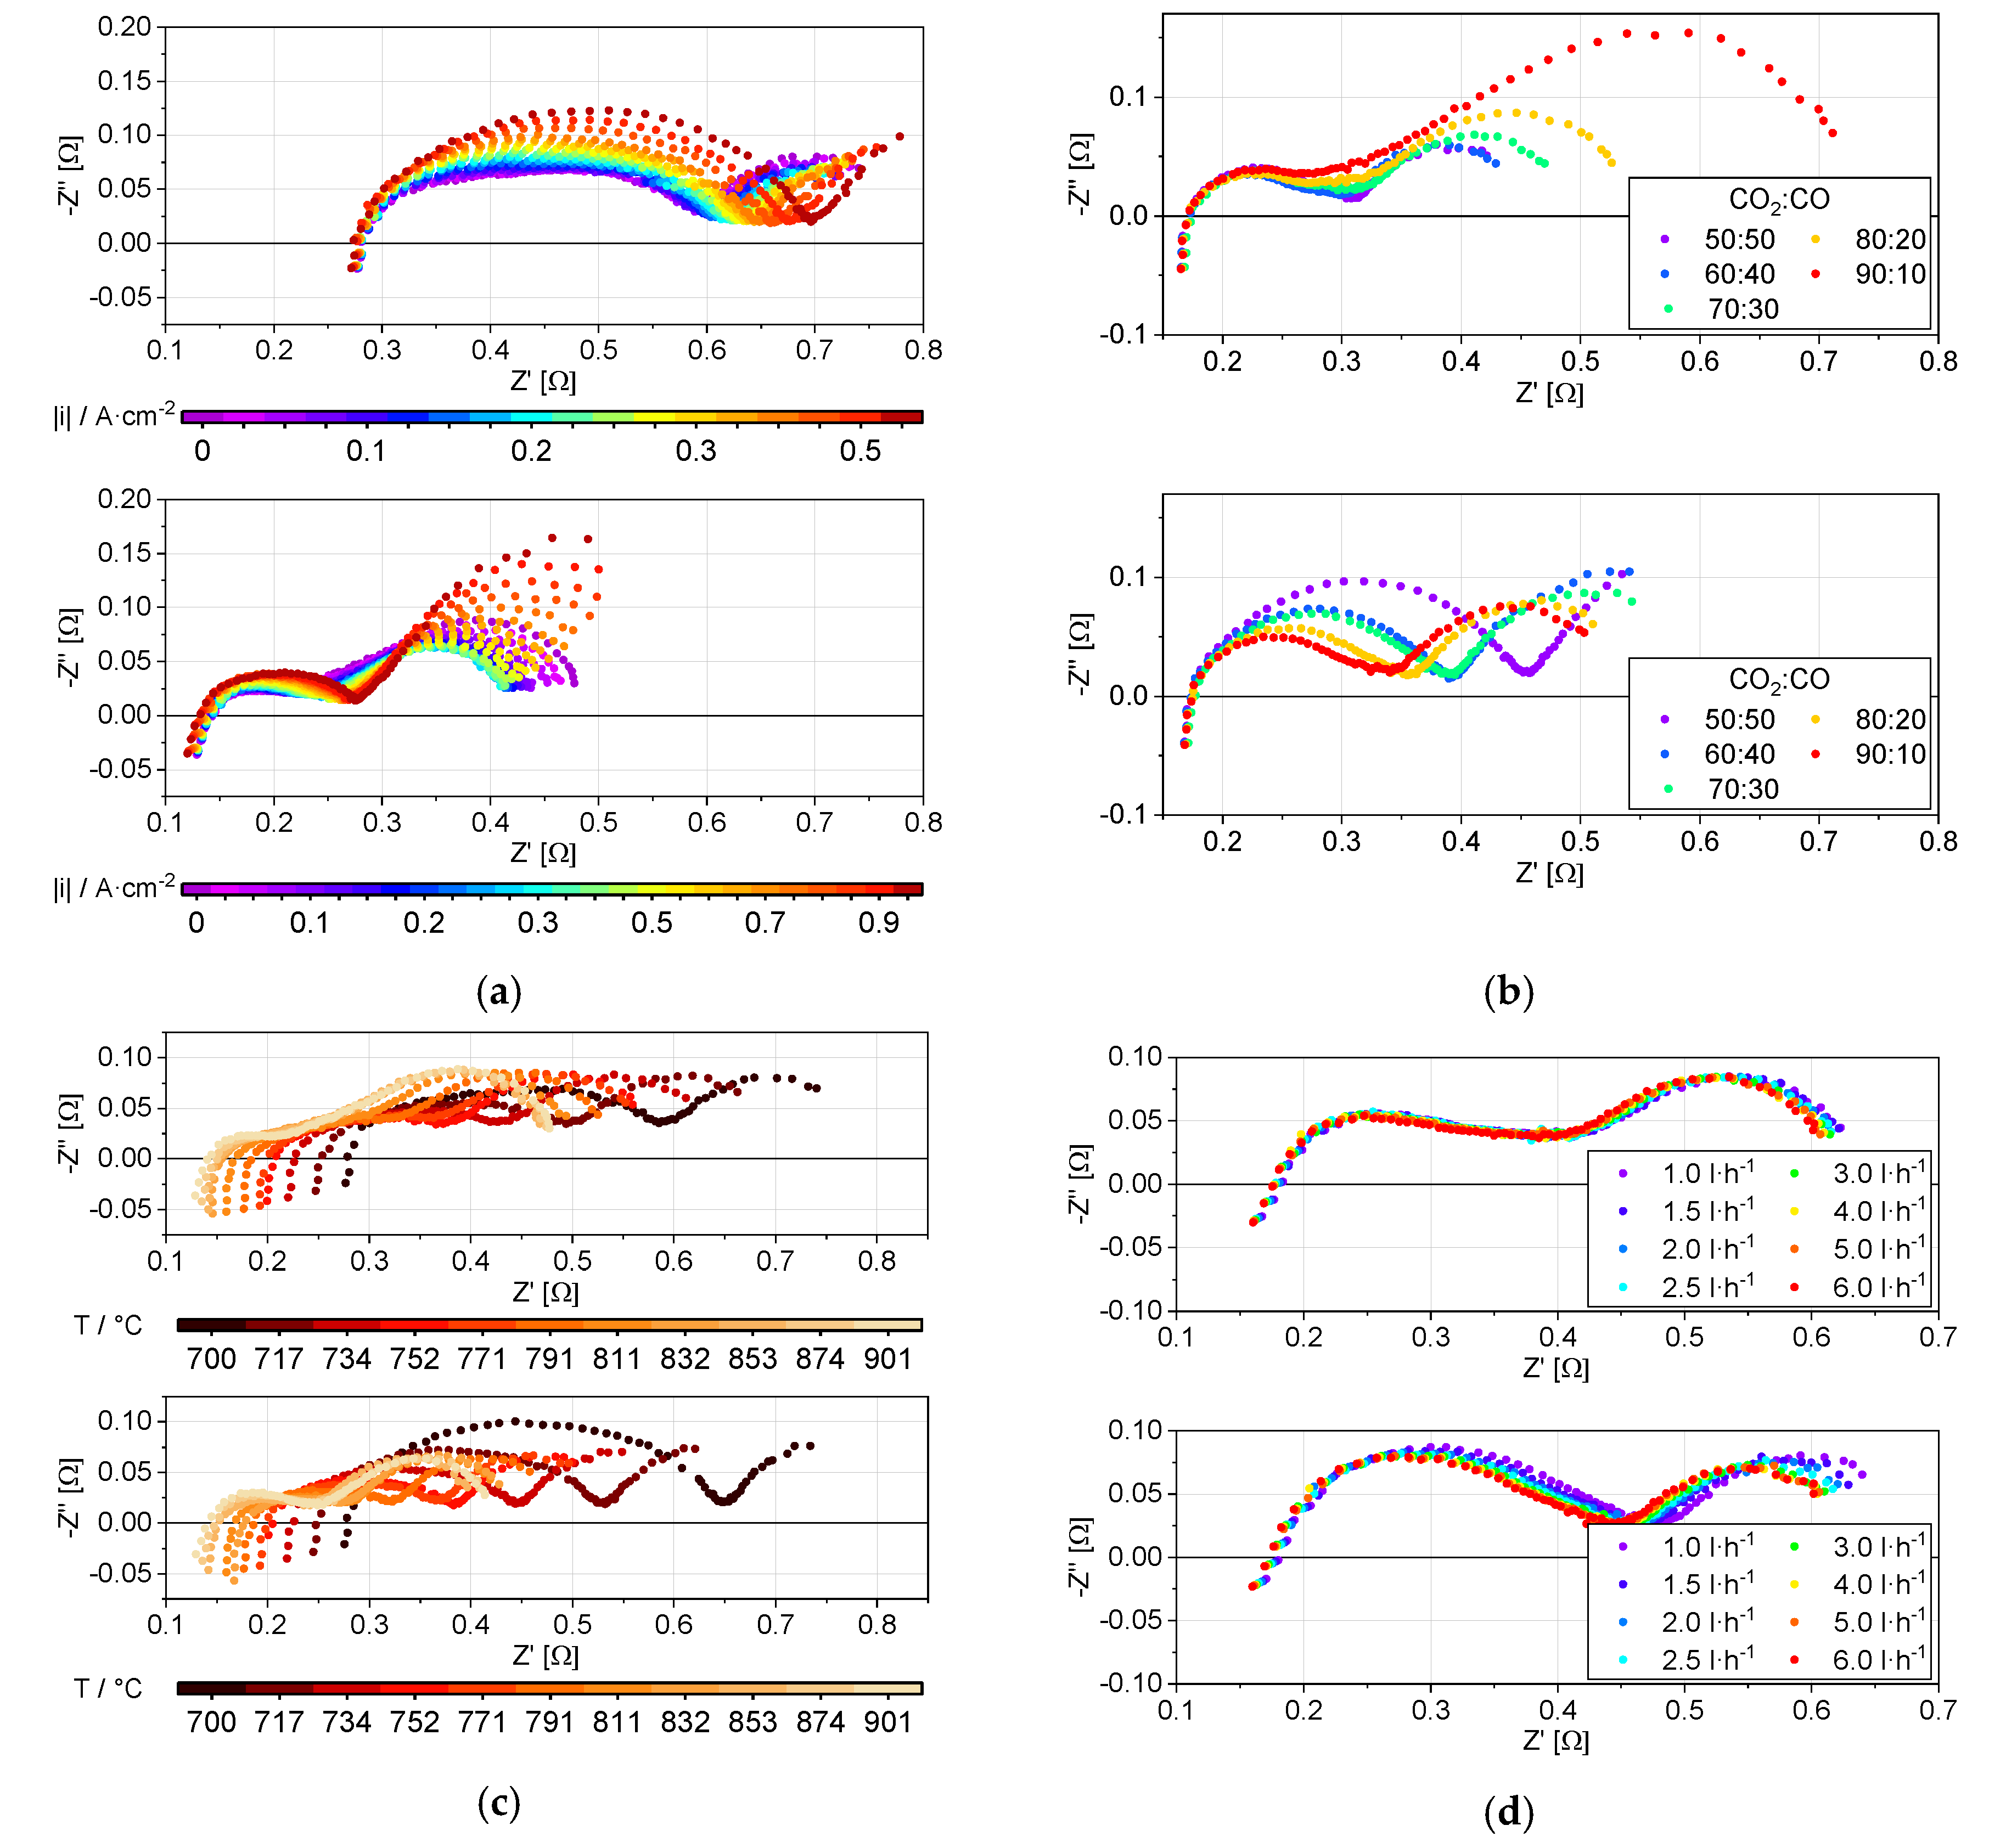
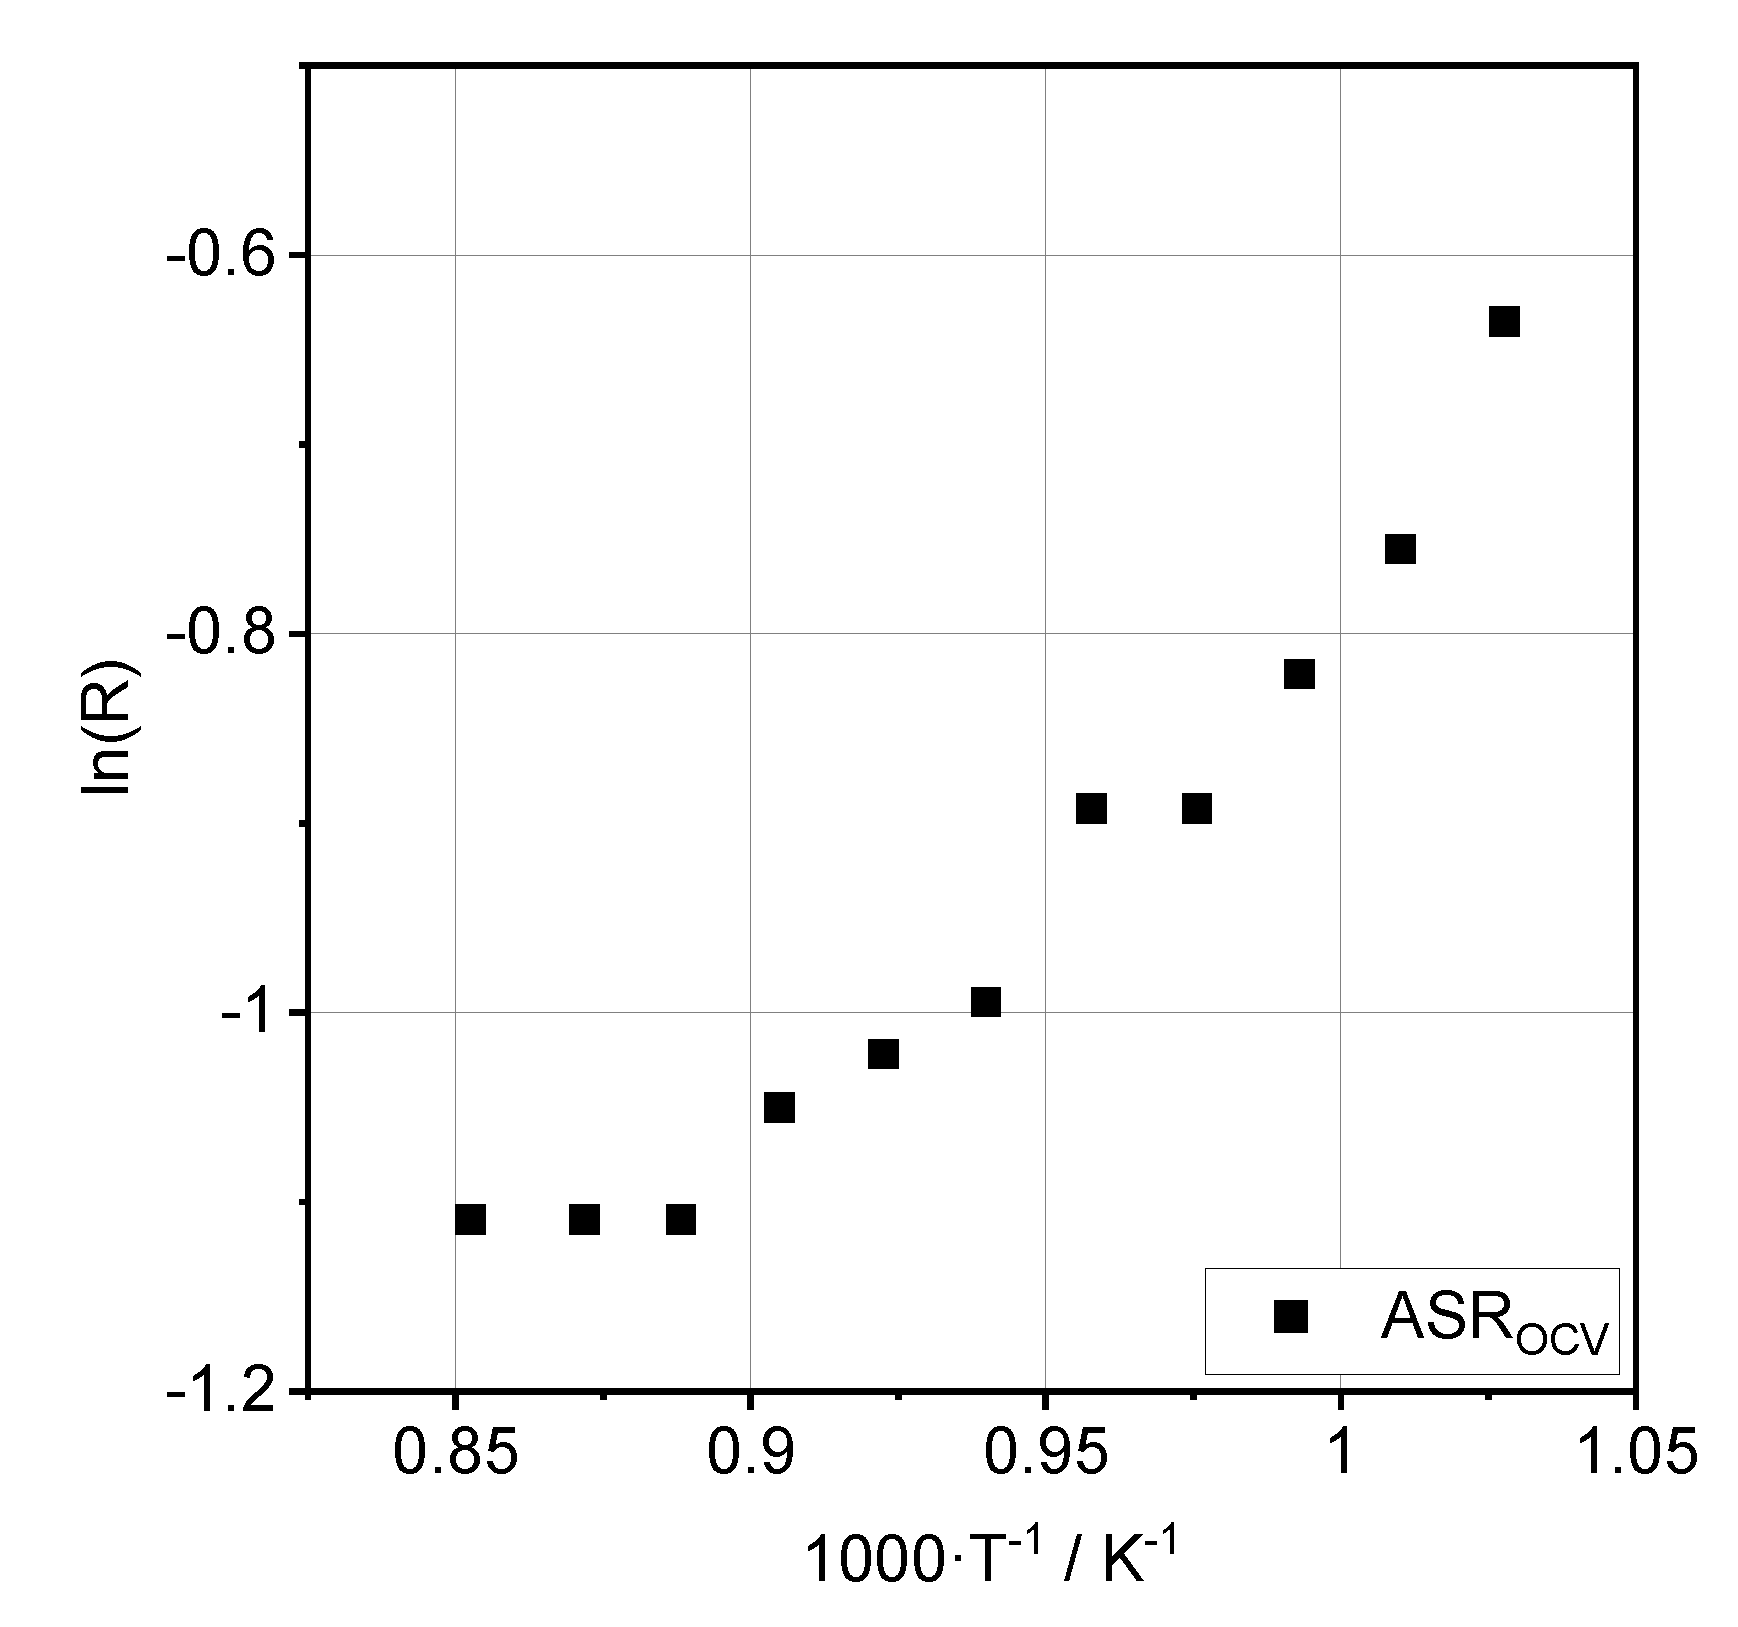
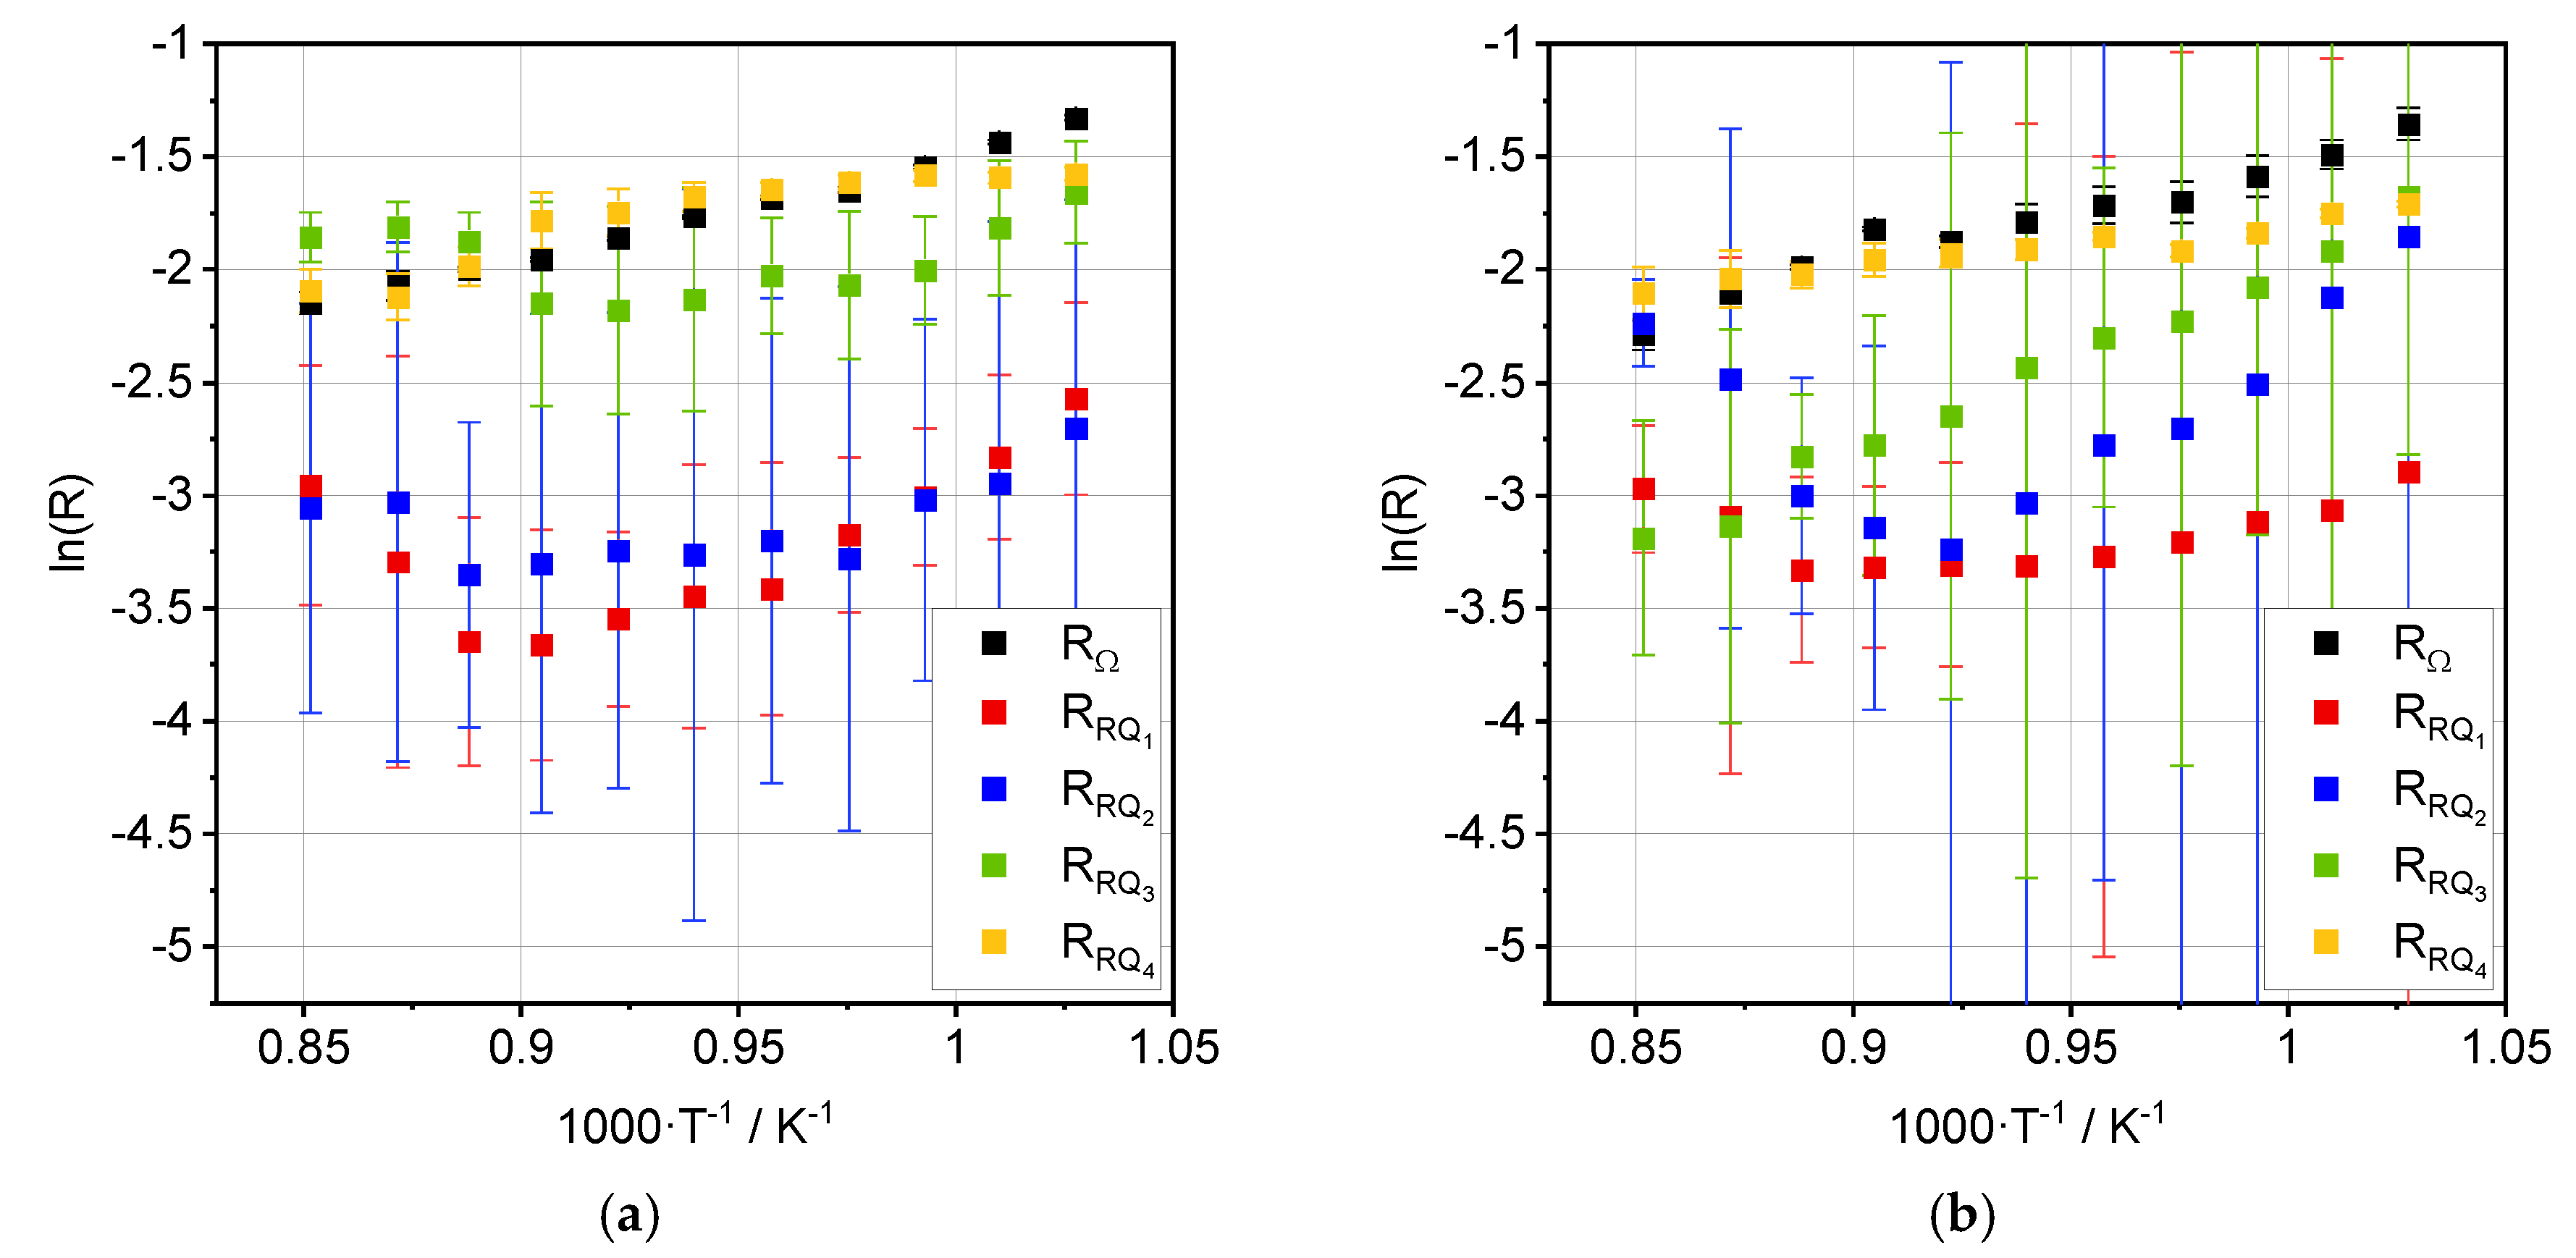
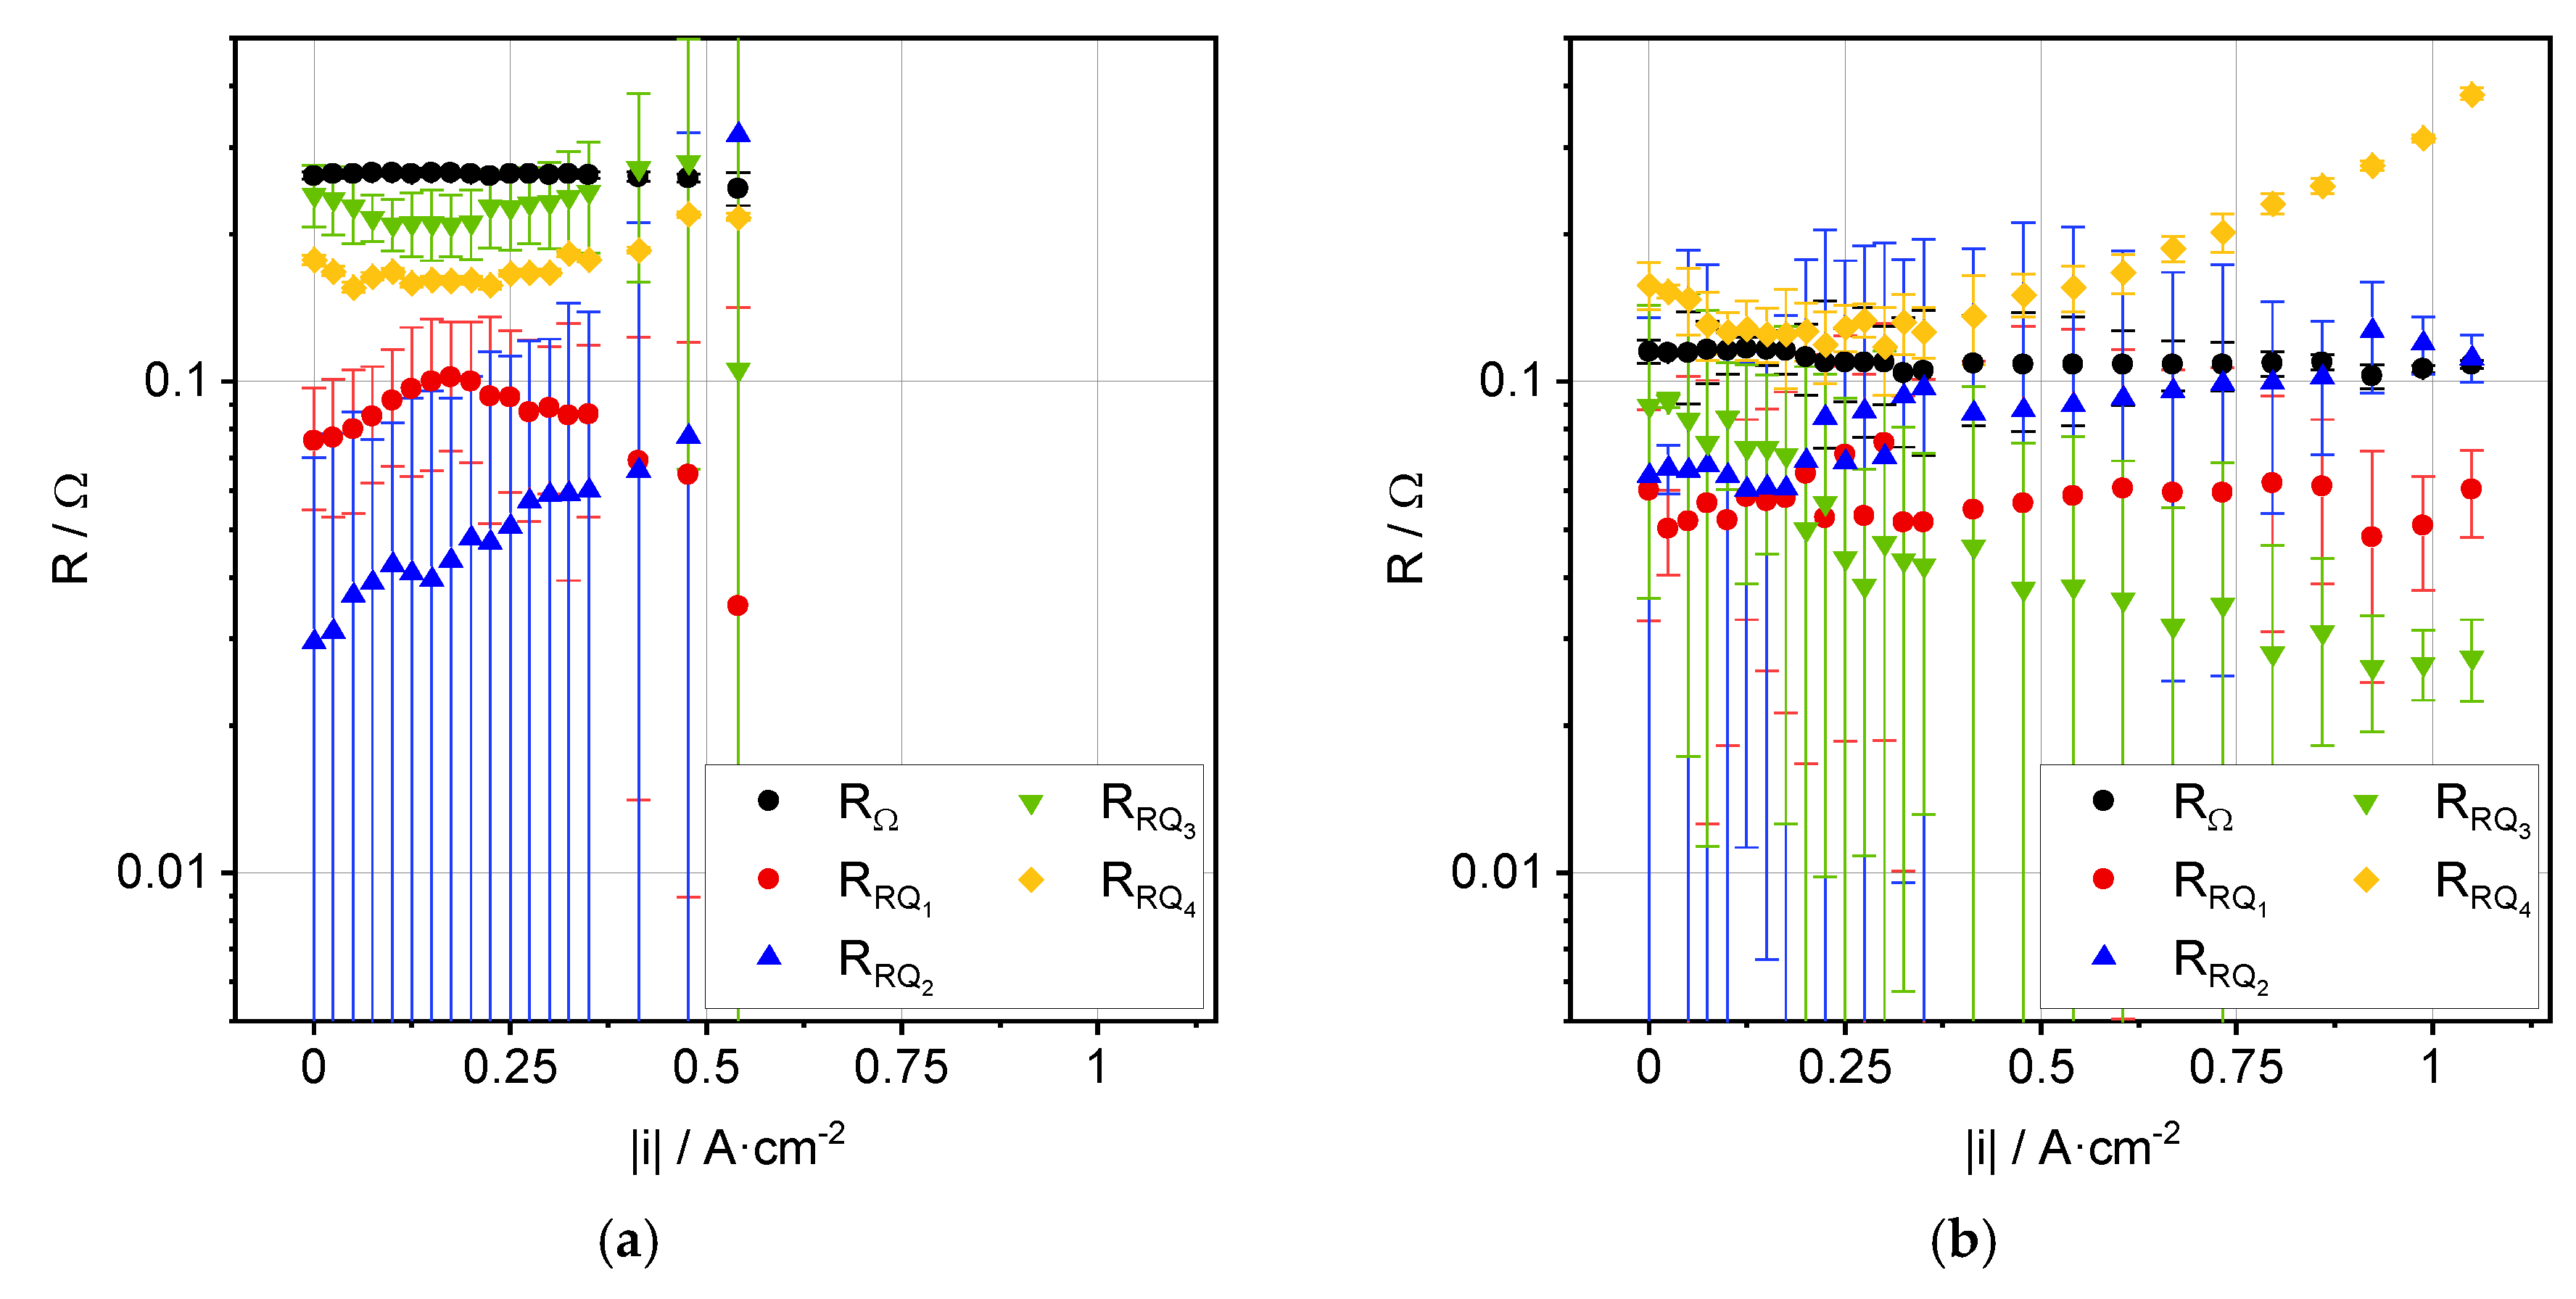
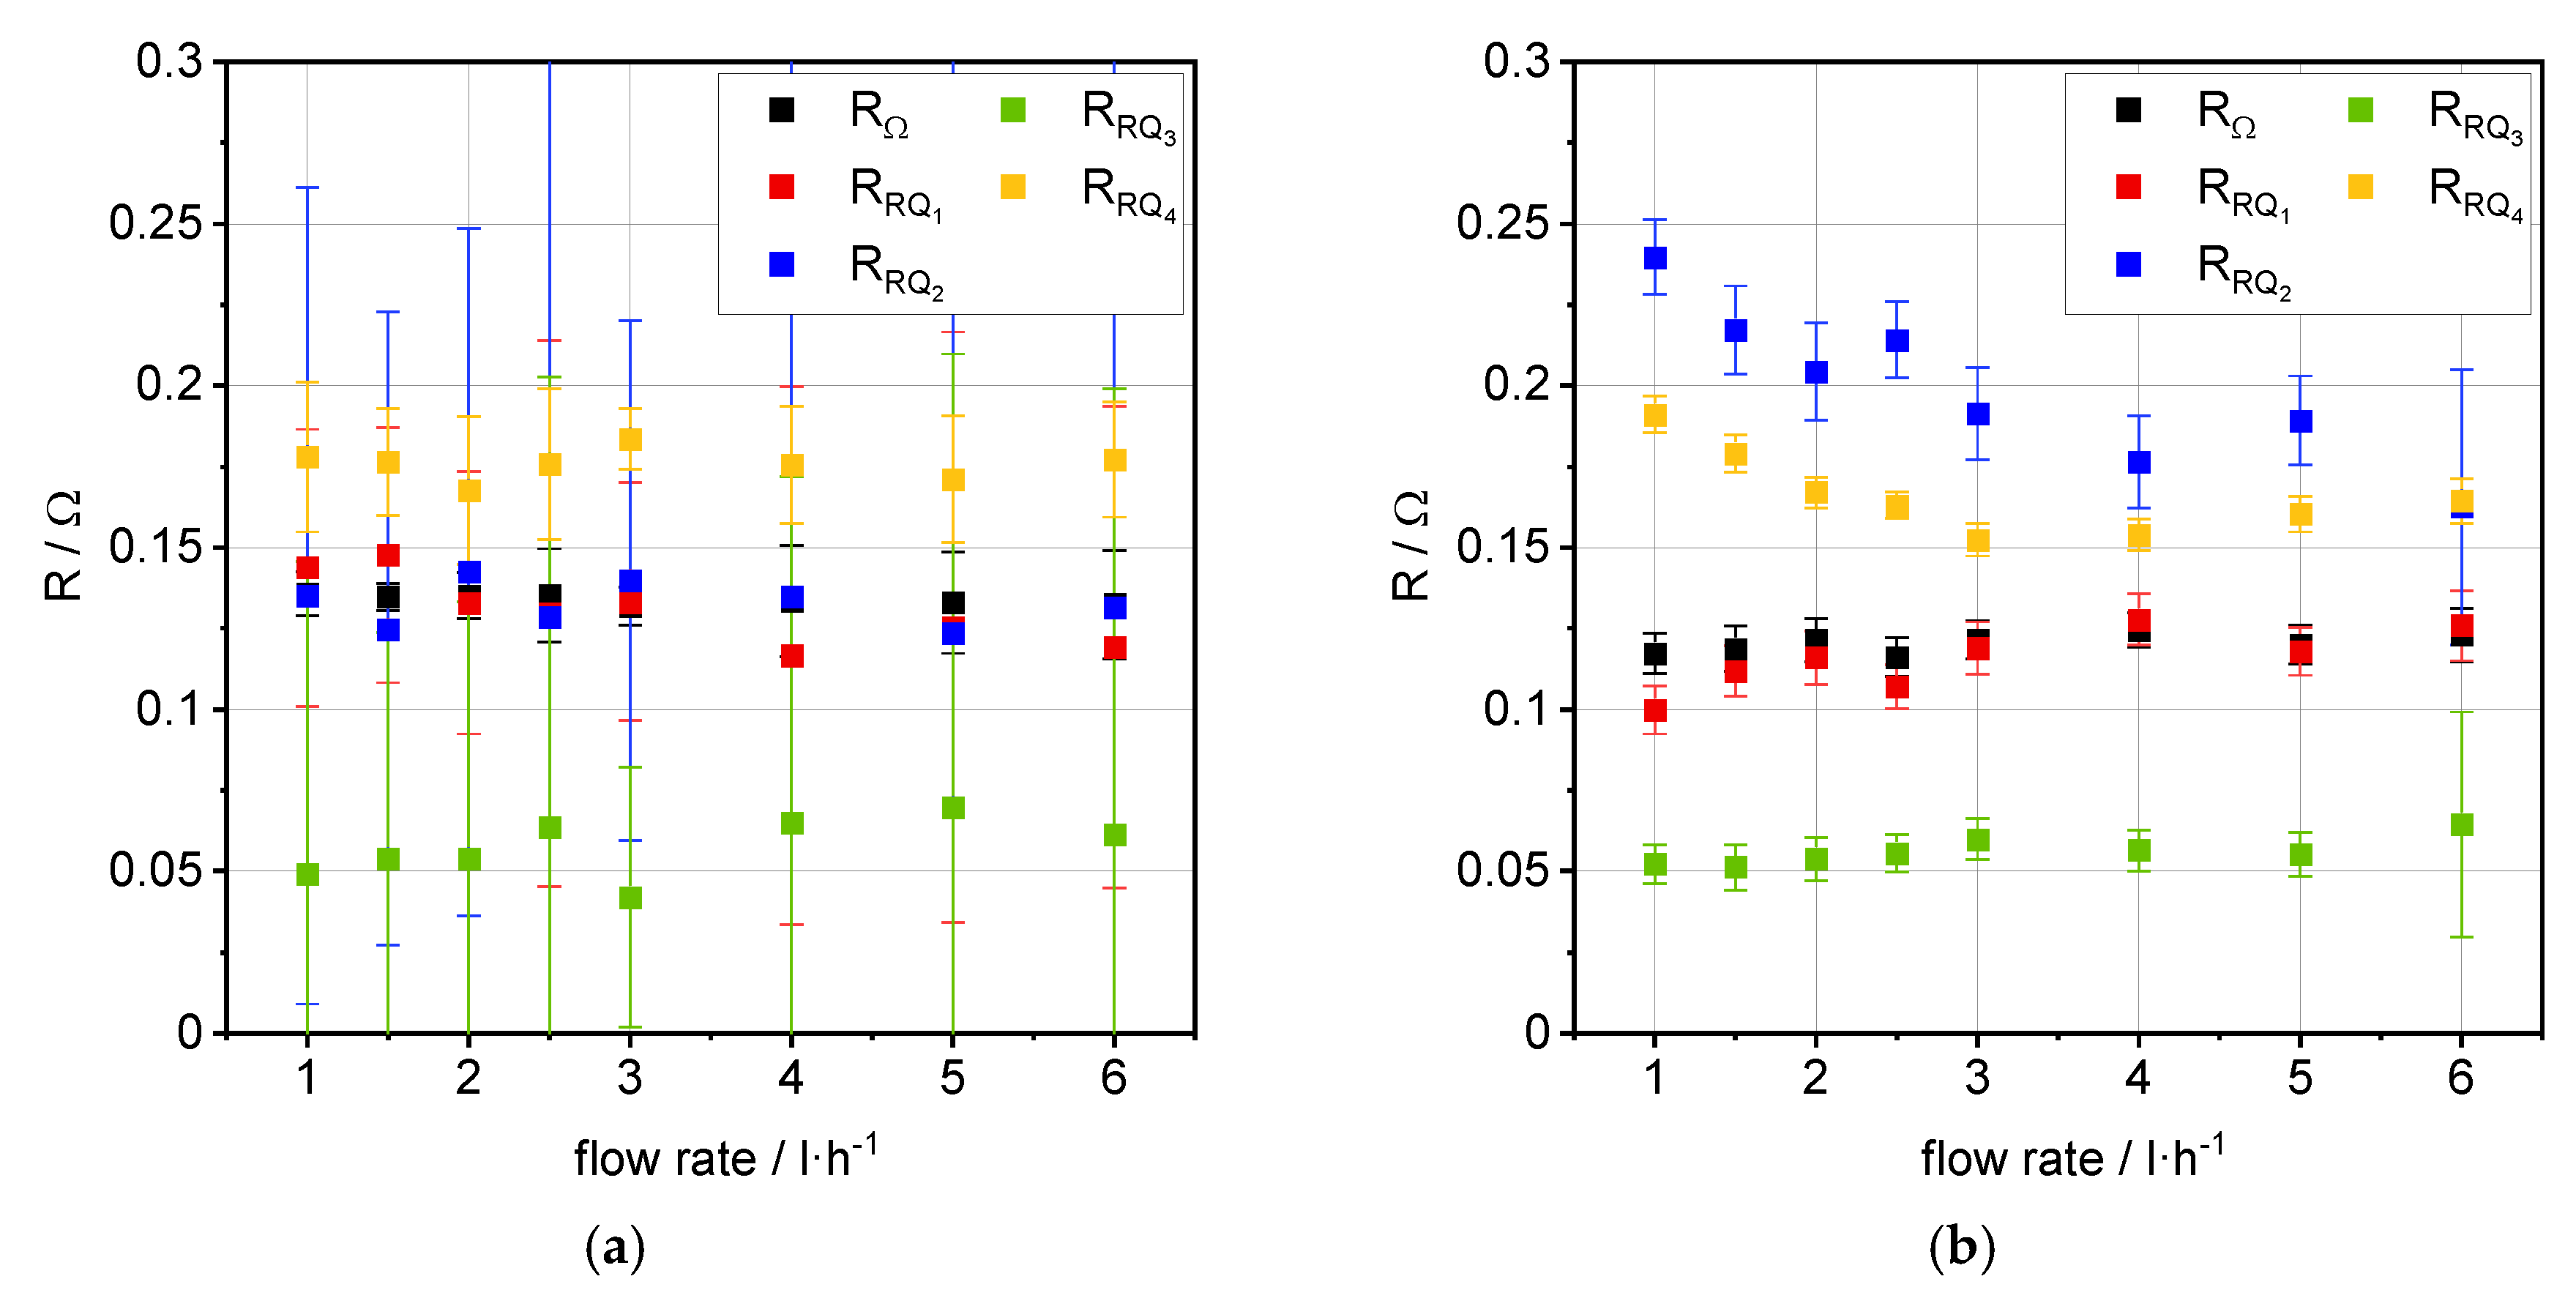
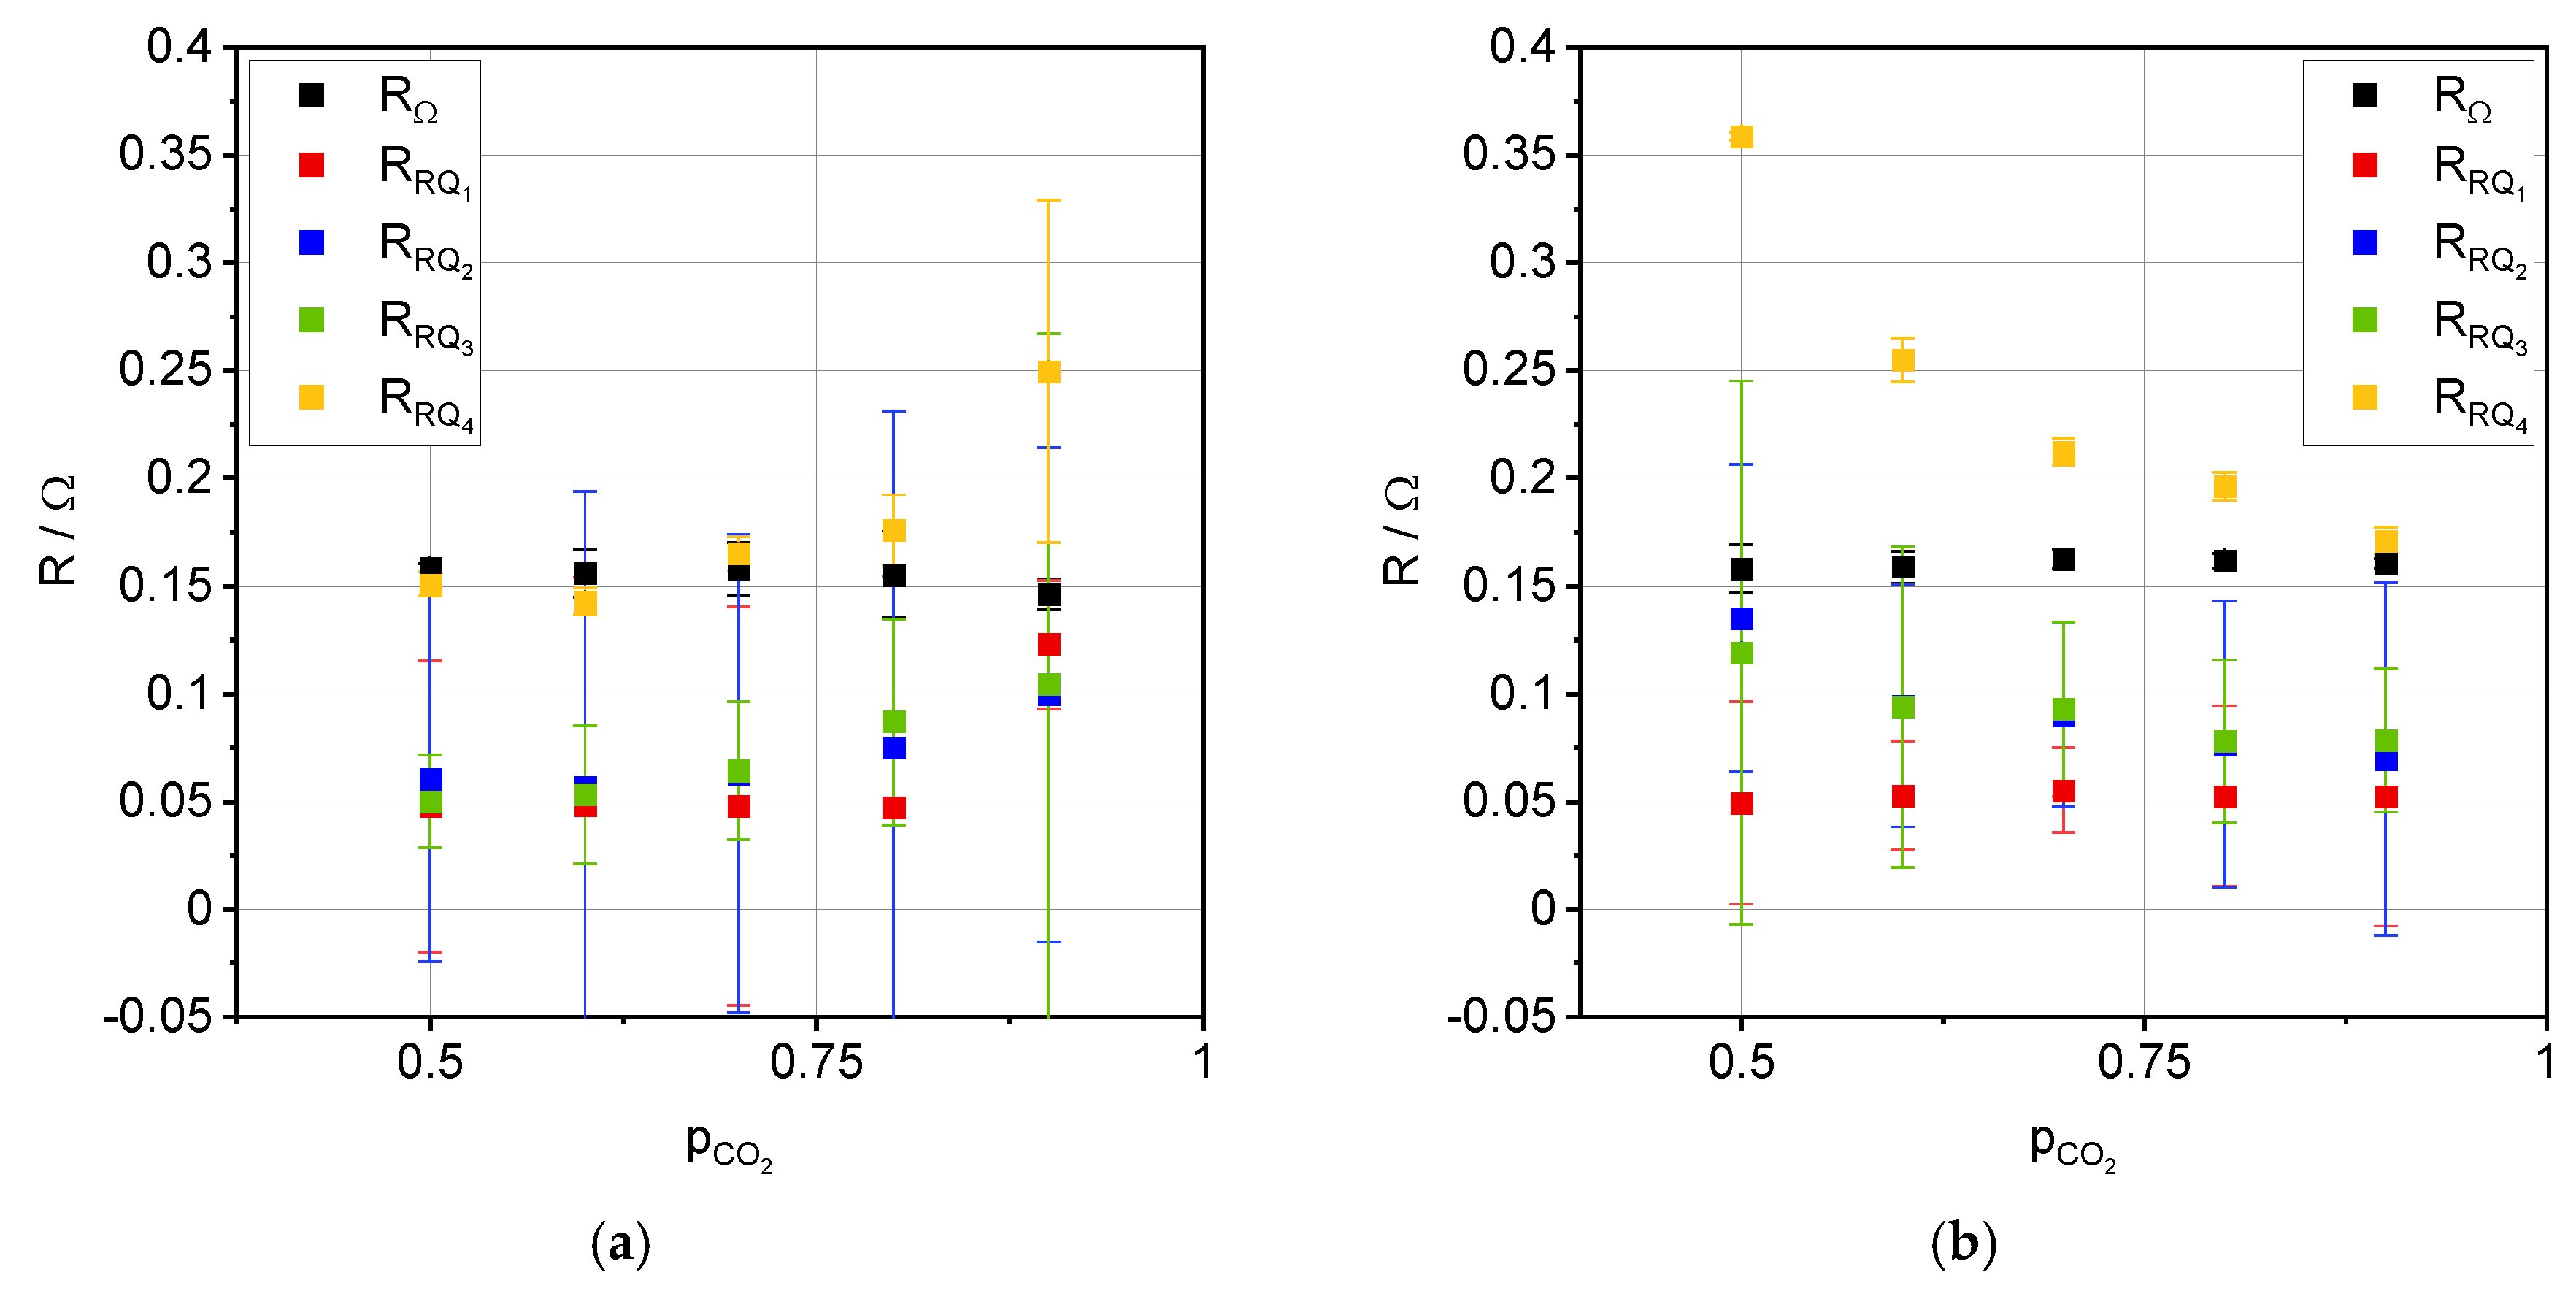
3.2. Impedance Analysis
4. Discussion
4.1. Performance
4.2. Process Analysis
5. Conclusions
Author Contributions
Funding
Conflicts of Interest
Appendix A

| CO2:CO | ASROCV [Ω·cm2] | ASR0.35 A·cm−2 [Ω·cm2] | |i|1.4 V [A·cm−2] | OCVexp [V] | OCVtheo [V] |
|---|---|---|---|---|---|
| 50:50 | 0.34 | 0.67/1.05 1 | 0.58/0.50 1 | 0.95 | 0.94 |
| 60:40 | 0.36 | 0.54/0.91 1 | 0.66/0.56 1 | 0.93 | 0.93 |
| 70:30 | 0.39 | 0.51/0.82 1 | 0.74/0.66 1 | 0.91 | 0.91 |
| 80:20 | 0.43 | 0.46/0.70 1 | 0.83/0.75 1 | 0.89 | 0.88 |
| 90:10 | 0.56 | 0.42/0.61 1 | 0.92/0.83 1 | 0.85 | 0.84 |
| T [°C] | ASROCV [Ω·cm2] | ASR0.35 A·cm−2 [Ω·cm2] | |i|1.4 V [A·cm−2] | OCVexp [V] | OCVtheo [V] |
|---|---|---|---|---|---|
| 700 | 0.53 | 0.60 | 0.74 | 0.94 | 0.94 |
| 717 | 0.47 | 0.51 | 0.85 | 0.93 | 0.93 |
| 734 | 0.44 | 0.44 | 0.95 | 0.92 | 0.92 |
| 752 | 0.41 | 0.39 | 1.03 | 0.91 | 0.91 |
| 771 | 0.41 | 0.39 | 1.07/1.03 1 | 0.90 | 0.90 |
| 791 | 0.37 | 0.35 | 1.14/1.07 1 | 0.89 | 0.89 |
| 811 | 0.36 | 0.33 | 1.21/1.17 1 | 0.88 | 0.88 |
| 832 | 0.35 | 0.30 | 1.28/1.24 1 | 0.87 | 0.86 |
| 853 | 0.33 | 0.30 | 1.32 | 0.86 | 0.85 |
| 874 | 0.33 | 0.29 | 1.43 | 0.84 | 0.84 |
| 900 | 0.34 | 0.29 | 1.50 | 0.83 | 0.83 |
| Flow Rate [L·h−1] | ASROCV [Ω·cm2] | ASR0.35 A·cm−2 [Ω·cm2] | |i|1.4 V [A·cm−2] | OCVexp [V] | OCVtheo [V] |
|---|---|---|---|---|---|
| 1.0 | 0.44 | 0.47 | 1.11 | 0.87/0.90 1 | 0.88 |
| 1.5 | 0.44 | 0.46 | 1.12 | 0.87/0.89 1 | 0.88 |
| 2.0 | 0.43 | 0.46 | 1.14 | 0.87/0.89 1 | 0.88 |
| 2.5 | 0.42 | 0.46 | 1.17 | 0.87/0.88 1 | 0.88 |
| 3.0 | 0.43 | 0.45 | 1.19 | 0.87/0.88 1 | 0.88 |
| 4.0 | 0.42 | 0.44 | 1.22 | 0.87/0.87 1 | 0.88 |
| 5.0 | 0.42 | 0.44 | 1.23 | 0.87/0.87 1 | 0.88 |
| 6.0 | 0.42 | 0.44 | 1.25 | 0.87/0.87 1 | 0.88 |
References
- Foit, S.R.; Dittrich, L.; Theuer, T.; Morgenthaler, S.; Eichel, R.-A.; de Haart, L.G.J. White Syngas by Co-Electrolysis for Industrial Chemistry. ECS Trans. 2019, 91, 2467–2474. [Google Scholar] [CrossRef]
- Dittrich, L.; Nohl, M.; Jaekel, E.E.; Foit, S.; de Haart, L.G.J.; Eichel, R.-A. High-Temperature Co-Electrolysis: A Versatile Method to Sustainably Produce Tailored Syngas Compositions. J. Electrochem. Soc. 2019, 166, F971–F975. [Google Scholar] [CrossRef]
- Theuer, T.; Schäfer, D.; Dittrich, L.; Nohl, M.; Foit, S.; Blum, L.; Eichel, R.-A.; de Haart, L.G.J. Sustainable Syngas Production by High-Temperature Co-electrolysis. Chem. Ing. Tech. 2020, 92, 40–44. [Google Scholar] [CrossRef]
- Haas, T.; Krause, R.; Weber, R.; Demler, M.; Schmid, G. Technical photosynthesis involving CO2 electrolysis and fermentation. Nat. Catal. 2018, 1, 32–39. [Google Scholar] [CrossRef]
- Dittrich, L.; Nohl, M.; Theuer, T.; Foit, S.; Vinke, I.C.; de Haart, L.G.J.; Eichel, R.-A. Co-electrolysis–A sustainable technology for syngas production. Chem. Ing. Tech. 2018, 90, 1158–1159. [Google Scholar] [CrossRef]
- Foit, S.R.; Vinke, I.C.; de Haart, L.G.J.; Eichel, R.-A. Power-to-Syngas: An Enabling Technology for the Transition of the Energy System? Angew. Chem. Int. Ed. 2017, 56, 5402–5411. [Google Scholar] [CrossRef]
- Foit, S.R.; Dittrich, L.; Vibhu, V.; Vinke, I.C.; Eichel, R.-A.; de Haart, L.G.J. Co-Electrolysis, Quo Vadis? ECS Trans. 2017, 78, 3139–3147. [Google Scholar] [CrossRef]
- van Bavel, S.; Verma, S.; Negro, E.; Bracht, M. Integrating CO2 Electrolysis into the Gas-to-Liquids–Power-to-Liquids Process. ACS Energy Lett. 2020, 5, 2597–2601. [Google Scholar] [CrossRef]
- Küngas, R. Review—electrochemical CO2 reduction for CO production: Comparison of low- and high-temperature electrolysis technologies. J. Electrochem. Soc. 2020, 167, 044508. [Google Scholar] [CrossRef]
- Zhan, Z.; Zhao, L. Electrochemical reduction of CO2 in solid oxide electrolysis cells. J. Power Sources 2010, 195, 7250–7254. [Google Scholar] [CrossRef]
- Song, Y.; Zhang, X.; Xie, K.; Wang, G.; Bao, X. High-temperature CO2 electrolysis in solid oxide electrolysis cells: Developments, challenges, and prospects. Adv. Mater. 2019, 31, 1902033. [Google Scholar] [CrossRef]
- Song, Y.; Zhou, Z.; Zhang, X.; Zhou, Y.; Gong, H.; Lv, H.; Liu, Q.; Wang, G.; Bao, X. Pure CO2 electrolysis over an Ni/YSZ cathode in a solid oxide electrolysis cell. J. Mater. Chem. A 2018, 6, 13661–13667. [Google Scholar] [CrossRef]
- Skafte, T.L.; Blennow, P.; Hjelm, J.; Graves, C. Carbon deposition and sulfur poisoning during CO2 electrolysis in nickel-based solid oxide cell electrodes. J. Power Sources 2018, 373, 54–60. [Google Scholar] [CrossRef]
- Zhang, X.; Song, Y.; Wang, G.; Bao, X. Co-electrolysis of CO2 and H2O in high-temperature solid oxide electrolysis cells: Recent advance in cathodes. J. Energy Chem. 2017, 26, 839–853. [Google Scholar] [CrossRef]
- Liu, T.; Chen, X.; Wu, J.; Sheng, Z.; Liu, G.; Wang, Y. A highly-performed, dual-layered cathode supported solid oxide electrolysis cell for efficient CO2 electrolysis fabricated by phase inversion co-tape casting method. J. Electrochem. Soc. 2017, 164, F1130–F1135. [Google Scholar] [CrossRef]
- Xu, S.; Li, S.; Yao, W.; Dong, D.; Xie, K. Direct electrolysis of CO2 using an oxygen-ion conducting solid oxide electrolyzer based on La0.75Sr0.25Cr0.5Mn0.5O3−δ electrode. J. Power Sources 2013, 230, 115–121. [Google Scholar] [CrossRef]
- Shi, Y.; Luo, Y.; Cai, N.; Qian, J.; Wang, S.; Li, W.; Wang, H. Experimental characterization and modeling of the electrochemical reduction of CO2 in solid oxide electrolysis cells. Electrochim. Acta 2013, 88, 644–653. [Google Scholar] [CrossRef]
- Bidrawn, F.; Kim, G.; Corre, G.; Irvine, J.T.S.; Vohs, J.M.; Gorte, R.J. Efficient reduction of CO2 in a solid oxide electrolyzer. Electrochem. Solid-State Lett. 2008, 11, B167. [Google Scholar] [CrossRef]
- Udomsilp, D.; Roehrens, D.; Menzler, N.H.; Bischof, C.; de Haart, L.G.J.; Opitz, A.K.; Guillon, O.; Bram, M. High-performance metal-supported solid oxide fuel cells by advanced cathode processing. J. Electrochem. Soc. 2017, 164, F1375–F1384. [Google Scholar] [CrossRef]
- Leonide, A.; Sonn, V.; Weber, A.; Ivers-Tiffée, E. Evaluation and modeling of the cell resistance in anode-supported solid oxide fuel cells. J. Electrochem. Soc. 2008, 155, B36. [Google Scholar] [CrossRef]
- Korte, C.; Peters, A.; Janek, J.; Hesse, D.; Zakharov, N. Ionic conductivity and activation energy for oxygen ion transport in superlattices--the semicoherent multilayer system YSZ (ZrO2 + 9.5 mol% Y2O3)/Y2O3. Phys. Chem. Chem. Phys. 2008, 10, 4623–4635. [Google Scholar] [CrossRef]
- Badwal, S.P.S. Zirconia-based solid electrolytes: Microstructure, stability and ionic conductivity. Solid State Ionics 1992, 52, 23–32. [Google Scholar] [CrossRef]
- Li, W.; Shi, Y.; Luo, Y.; Wang, Y.; Cai, N. Carbon monoxide/carbon dioxide electrochemical conversion on patterned nickel electrodes operating in fuel cell and electrolysis cell modes. Int. J. Hydrogen Energy 2016, 41, 3762–3773. [Google Scholar] [CrossRef]
- Hecht, E.S.; Gupta, G.K.; Zhu, H.; Dean, A.M.; Kee, R.J.; Maier, L.; Deutschmann, O. Methane reforming kinetics within a Ni–YSZ SOFC anode support. Appl. Catal. A Gen. 2005, 295, 40–51. [Google Scholar] [CrossRef]
- Sonn, V.; Leonide, A.; Ivers-Tiffée, E. Combined deconvolution and CNLS fitting approach applied on the impedance response of technical Ni∕8YSZ cermet electrodes. J. Electrochem. Soc. 2008, 155, B675. [Google Scholar] [CrossRef]
- Primdahl, S.; Mogensen, M. Gas diffusion impedance in characterization of solid oxide fuel cell anodes. J. Electrochem. Soc. 1999, 146, 2827–2833. [Google Scholar] [CrossRef]
- Ebbesen, S.D.; Sun, X.; Mogensen, M.B. Understanding the processes governing performance and durability of solid oxide electrolysis cells. Faraday Discuss. 2015, 182, 393–422. [Google Scholar] [CrossRef] [PubMed]


| Process | Ea, OCV [kJ·mol−1] | Ea, 0.35 A·cm−2 [kJ·mol−1] |
|---|---|---|
| RΩ | 40.6 ± 1.5 | 38.1 ± 2.0 |
| RRQ1 | 71.8 ± 5.4 | 18.5 ± 3.8 |
| RRQ2 | 36.2 ± 8.0 | 80.2 ± 8.4 |
| RRQ3 | 36.3 ± 7.3 | 71.8 ± 2.4 |
| RRQ4 | 10.0 ± 2.1 | 19.1 ± 3.5 |
Publisher’s Note: MDPI stays neutral with regard to jurisdictional claims in published maps and institutional affiliations. |
© 2020 by the authors. Licensee MDPI, Basel, Switzerland. This article is an open access article distributed under the terms and conditions of the Creative Commons Attribution (CC BY) license (http://creativecommons.org/licenses/by/4.0/).
Share and Cite
Foit, S.; Dittrich, L.; Duyster, T.; Vinke, I.; Eichel, R.-A.; de Haart, L.G.J. Direct Solid Oxide Electrolysis of Carbon Dioxide: Analysis of Performance and Processes. Processes 2020, 8, 1390. https://doi.org/10.3390/pr8111390
Foit S, Dittrich L, Duyster T, Vinke I, Eichel R-A, de Haart LGJ. Direct Solid Oxide Electrolysis of Carbon Dioxide: Analysis of Performance and Processes. Processes. 2020; 8(11):1390. https://doi.org/10.3390/pr8111390
Chicago/Turabian StyleFoit, Severin, Lucy Dittrich, Tobias Duyster, Izaak Vinke, Rüdiger-A. Eichel, and L. G. J. (Bert) de Haart. 2020. "Direct Solid Oxide Electrolysis of Carbon Dioxide: Analysis of Performance and Processes" Processes 8, no. 11: 1390. https://doi.org/10.3390/pr8111390
APA StyleFoit, S., Dittrich, L., Duyster, T., Vinke, I., Eichel, R.-A., & de Haart, L. G. J. (2020). Direct Solid Oxide Electrolysis of Carbon Dioxide: Analysis of Performance and Processes. Processes, 8(11), 1390. https://doi.org/10.3390/pr8111390