Article

Pressurized Liquid Extraction of Cannabinoids from Hemp Processing Residues: Evaluation of the Influencing Variables

Institute of Chemical, Environmental and Bioscience Engineering, Technische Universität Wien, Vienna 1060, Austria
*
Author to whom correspondence should be addressed.
Processes 2020, 8(11), 1334; https://doi.org/10.3390/pr8111334
Submission received: 24 September 2020 / Revised: 17 October 2020 / Accepted: 19 October 2020 / Published: 22 October 2020
(This article belongs to the Section Food Process Engineering)

Abstract

:
Cannabinoids have gained significant interest as they may have pharmaceutical and nutritional applications to treat various diseases (sclerosis, glaucoma, and epilepsy, among others). Hemp (Cannabis sativa L.) has been studied recently as a source of cannabinoids, given the low concentration of tetrahydrocannabinol and comparatively high concentration of cannabidiol. Most of the plant’s fractions are used (blossoms, stem, and seeds), but the processing of the blossom leaves a residue, threshing residues, which could still be used to extract cannabinoids, aiming for an integral usage of the plant. Different technologies have been applied for cannabinoid extraction. Among these, pressurized liquid extraction (PLE) stands out due to the ease of application and efficiency. This work evaluates the influence of temperature, pressure, extraction time, and the number of cycles for the PLE of cannabinoids from hemp threshing residues using ethanol. Results show that low pressures, 100 °C, and 60 min are sufficient to achieve extraction yields of 19.8 mg of cannabidiol per g of dry hemp, which corresponds to an extraction efficiency of 99.3%. These results show this technology’s potential for cannabinoid extraction (mainly cannabidiol) and further open the perspective to valorize the residues and other parts of hemp plants.

Graphical Abstract

1. Introduction

Over the last few years, industry and research have been pushed to develop sustainable production processes that focus on ecological, economic, and social factors, given the urgency of switching our economy from fossil-based to bio-based [1]. This switch implicates not only developing processes focused on energy production but also daily-life products. Among this wide variety of products, bioactive compounds have applications in pharmaceutics, health, and cosmetics, leading to an increasing interest in their use. These are secondary metabolites and compounds obtained from natural sources (plants, fruits, microorganisms, etc.), which can interact with living tissue components and tend to have beneficial effects on the target organism [2,3].
Phenolic compounds, carotenoids, curcuminoids, and cannabinoids are some examples of compounds that have been investigated for their bioactive applications [4,5,6,7]. Within the group of phenolic compounds, resveratrol, quercetin, gallic acid, chlorogenic acid, dihydrochalcones, and lignin are examples of the considerable number of bioactive compounds currently being studied [8,9,10]. Phytocannabinoids are terpenophenols, which have been highlighted due to their pharmaceutical applications to treat neuroinflammatory, neurodegenerative, psychological, and psychiatric disorders, Alzheimer’s and Parkinson’s diseases, sclerosis, glaucoma, schizophrenia, and epilepsy, among others [7,11,12,13,14,15].
Hemp/industrial hemp (Cannabis sativa L.) is one of the plants with the oldest reports of use in food, fiber, and material applications [7]. Different parts of the plant have been used for various purposes as seed oil, fibers for textiles, and composite materials from the stem [16]. Recently, the interest in hemp increased remarkably due to cannabinoids, mainly contained in the blossoms. It contains more than 90 different cannabinoids [17]; some examples of these compounds are cannabigerol (CBG), cannabidiol (CBD), and cannabidivarin, which have been studied for their pharmaceutical applications [18]. Tetrahydrocannabinol (THC) is the most widely known cannabinoid due to its psychoactive effect on the endocannabinoid system, which has caused the strict control and prohibition of the commercialization and growth of cannabis plants. Around 48 countries worldwide (e.g., United States, most of the European Union, Canada, Brazil, Colombia, South Korea, just to name some) allow industrial hemp crops with strict control of THC concentration, in most cases below 0.3 wt% and others even below 0.1 wt% [18]. Currently, the blossoms are the part of the hemp plant used for the extraction of cannabinoids, as this is where the plant accumulates most of these compounds. Other fractions of the plant, as the seeds and the stems, have other applications as the production of oil and fibers, respectively. However, once the plant is threshed to collect the blossoms, which are then processed to extract cannabinoids, there is a remaining residue consisting mainly of the leaves and the plant’s stem. This residual fraction, denominated as “threshing residues”, should be used to optimize the integral valorization of the plant and decrease the production of residues.
Multiple technologies have been applied for the extraction of cannabinoids. Pressurized liquid extraction (PLE), supercritical carbon dioxide, and Soxhlet are some examples. Organic solvents such as methanol, ethanol, butane, chloroform, and n-hexane have been studied for cannabinoid extraction [19]. PLE stands out due to the ease of application and efficiency, utilizing elevated temperatures and moderate to high pressures (up to 200 bar/20 MPa) [20]. Compared to a conventional extraction performed at ambient pressure, the high pressure maintains the solvent in liquid-phase. This improves the mass transfer by increasing the solubility and decreasing hindering factors such as viscosity and surface tension [21]. Compared with supercritical extraction, the operating conditions (temperature and pressure) are lower, making PLE less energy-intensive [22]. The essential variables to be considered for PLE are temperature, pressure, and extraction time. Therefore, optimizing the combination of variables is a crucial task to identify the highest extraction yield, as this will play one of the most critical roles in a given process for cannabinoid production.
Based on the above, this work evaluates the influence of temperature, pressure, and extraction time on the PLE method to extract cannabinoids from hemp threshing residues using ethanol as solvent. The work focused on evaluating the influence of the different variables. Two varieties of hemp were used, namely KC Virtus and Finola. Three different extraction setups were used: 1 L Schott flasks, 40 mL speed extractor, and 1 L autoclave reactor. Four different variables were examined: residence time, pressure, temperature, and the number of extraction cycles.

2. Materials and Methods

2.1. Raw Materials and Reagents

The feedstock used in this work is hemp threshing residues. These correspond to the residue, mainly the leaves and stem, collected after the plant is threshed to collect the blossoms. Two different varieties of C. sativa were used—KC Virtus and Finola. Variety KC Virtus (genotype: monoecious, registered in the European variety list) was provided as a mixture of all parts of the plant (flowers, leaves, stems) by Samtech Extraktionstechnik GmbH (Tadten, Austria). The material obtained was crushed in a cutting mill equipped with a 2 mm sieve. The dry matter content of the sample was 91.3 wt%.
Variety Finola (genotype: dioecious, registered in the European variety list) was provided by Hanfland GmbH (Hanfthal, Austria). The sample consisted of the leaves and the stems remaining after the removal of the blossom. The motivation to include this second variety is that the threshing process allowed obtaining a residue from which the leaves could be separated from the stem and we could analyze the content of cannabinoids in the remaining leaves. Therefore, the obtained material was manually separated into leaves and stems, as the leaves are the part of the plant where cannabinoids are contained. The leaves were the part used for the extraction. The material of the leaves was crushed in a cutting mill equipped with a 2 mm sieve. The dry matter content of the sample was 92.4 wt%.
Ethanol, absolute 100% analytical reagent (>99.8% volume C2H5OH) was purchased from Chem-Lab NV (Zedelgem, Belgium). Standards for cannabidiol (CBD), cannabidiol acid (CBDA), and tetrahydrocannabinolic acid (THCA) were purchased from Sigma-Aldrich (Vienna, Austria). The other reference compounds, tetrahydrocannabinol (THC), cannabinol (CBN), cannabigerol acid (CBGA), and cannabigerol (CBG), were provided by the Medical Cannabinoids Research and Analysis GmBH (Brunn am Gebirge, Austria) in the course of joint research.

2.2. Study Design

Pressurized liquid extraction (PLE) of cannabinoids was investigated with varying conditions concerning extraction time, temperature, pressure, and the number of cycles. Three different extraction systems were used. After each extraction, the mixture was filtered to separate the remaining solids and the liquid extract. The density and dry matter content were determined. Table 1 summarizes the conditions and the primary information of the performed extractions.
The experiments were divided into three stages, which were proposed as a subsequent-stage evaluation. The determining variables of one stage represented fixed variables in the following stages. The used solvent in all the experiments was pure ethanol. The first stage (Section 2.3) focused on identifying the influence of the extraction time and was used as a control to evaluate if an ambient-pressure extraction would suffice. The extraction was carried out in 1 L flasks to reach longer extraction times without operation restrictions. The second stage (Section 2.4) evaluates the influence of temperature, pressure, and number of cycles. These extractions were carried out in a 40 mL speed extractor. The results of the previous two sections feed the variable selection for the third stage (Section 2.5), which evaluated the influence of temperature and extraction time in an autoclave reactor with a higher volume (1 L). Up until this point, all the extractions were performed with the same hemp variety (KC Virtus). Then, to test the identified conditions further, the best extraction conditions found until this point were again tested with a second variety of hemp (Finola). A more detailed description of each extraction stage carried out is found in the following sections.

2.3. PLE: Schott Flasks

The extraction was carried out in 1 L Schott flasks at 1 bar (ambient pressure). The initial wet mass of hemp was 40 g, and the extraction was carried out with a high excess of solvent (0.045–0.046 g of dry hemp per 1 g of solvent). This solid-to-liquid ratio was chosen in order not to run the risk of solvent saturation during the extraction. Then, 10 mL samples were taken at 10, 100, and 1000 min, and the cannabinoid concentration was determined. A magnetic stirrer was used for mixing, and the temperature was controlled with a water bath at 25 and 50 °C. The extractions were performed in duplicate.

2.4. PLE: Speed Extractor (40 mL)

The extractions in this stage were carried out in a Büchi Speed Extractor E-916. It consists of a 6-set reactor with 40 mL extraction vessels with a minimum operating pressure of 50 bar. The specific solvent volume was 22 mL. The equipment itself sets this solid/liquid ratio, as the apparatus allows defining the time, pressure, and temperature, but not the amount of solvent. Therefore, after the extraction, the solvent was backward calculated, and then the respective solid/liquid ratio. The extractions were performed in duplicate.
This stage’s purpose was to evaluate the influence of pressure and the number of extraction cycles at different temperatures. One extraction cycle consisted of 1 min heating, 15 min holding time at the chosen conditions, and 1 min cooling. Pressures were 50, 100, and 150 bar. The extract was collected, and then a second extraction cycle with new solvent was performed on the same solid sample. The initial wet mass of hemp was 7.5 g, and the temperatures were 50 and 75 °C. For identification purposes, C1 and C2 are the names for the first and second cycles, respectively. The extractions were carried out with a dry-hemp-mass-to-solvent-mass ratio of 0.2–0.3 g/g in the individual cycles.

2.5. PLE: Autoclave Reactor (1 L)

This stage’s purpose was to corroborate the previous stages’ results and evaluate the variables in a higher volume. In addition, the extraction time at different temperatures was studied. This stage’s extractions were carried out in a stainless-steel high pressurize autoclave (Zirbus, HAD 9/16, Bad Grund, Germany) with a capacity of 1 L and maximum temperature and pressure of 250 °C and 60 bar, respectively. The agitation was set at 200 rpm. In this equipment, the pressure cannot be controlled, hence the pressure value corresponds to the solvent’s vapor pressure at the given temperature conditions. Two different sets of tests were performed, which are described as follows.

2.5.1. Influence of Extraction Time

The purpose of this stage was to evaluate the influence of the extraction time at different temperatures. Temperatures were 50, 75, and 100 °C, and the extraction times were 10, 30, 60, and 100 min. The initial wet mass of hemp was 43.1 g. The extractions were carried out with a dry-hemp-mass-to-solvent-mass ratio of 0.1 g/g.

2.5.2. Corroboration of Extraction Conditions: Extraction of Hemp Finola

The final stage consisted of corroborating the best conditions found in the previous steps. Temperatures were 75 and 100 °C, and the extraction times were 10, 30, 60, and 100 min. The initial wet mass of hemp was 43.2 g. The extractions were carried out with a dry-hemp-mass-to-solvent-mass ratio of 0.1 g/g.

2.6. Determination of Cannabinoids

The determination of cannabinoids (CBD, CBDA, Δ9-THC, THCA, CBG, CBGA, and CBN) was performed with High Performance Liquid Chromatography (HPLC) in a Dionex UltiMate© RSLC System with DAD-3000RS Photodiode Array Detector (Thermo Scientific, Germering, Germany) using a method modified from Gul et al. [23]. The used column was a Dionex Acclaim™ RSLC 120 C18 (2.2 µm, 120 Å, 2.1 × 150 mm, Bonded Silica Products: no. 01425071). The flow was set to 0.2 mL/min, at 25 °C, the ultraviolet (UV) detector at a wavelength of 220 nm. Solvents were water with 0.1% formic acid (A) and acetonitrile with 0.1% formic acid (B). The gradient was 37.5 min plus 2 min of pre-equilibration at 70% B. The elution times were 6 min at 70% B, 6 min from 70% B to 77% B, 18 min at 77% B, 0.5 min from 77% B to 95% B, 1.5 min at 95% B, 0.5 min from 95% B to 70% B, and 5 min at 70% B.
The HPLC was calibrated with the reference compounds (Chapter 2.2) for the quantification of the cannabinoids. The measured CBD (free CBD) and CBD-A (bound CBD) are referred to as the total amount of CBD in this study. Respectively, the total amounts of THC and CBG are calculated with the same procedure.

2.6.1. Calculation of the Cannabinoid Extraction Yield

The extraction yield of each cannabinoid was calculated using Equation (1). The calculation considers the initial mass of hemp put into the reactor, the measured concentration of each cannabinoid, the total mass and density of the extract, divided by the total amount of dry hemp. The extract’s density was determined using a density meter (DE45 DeltaRange, Mettler Toledo, Columbus, OH, USA). C C a n n a b i n o i d ,   i is the sum of the concentrations of the acid and decarboxylated form of the cannabinoid i measured by HPLC in (µg/mL). M E x t r a c t and ρ E x t r a c t are the total mass and the density of the extract in (g) and (g/mL), respectively. M H e m p corresponds to the initial dry matter of hemp in [g]. Y C a n n a b i n o i d ,   i corresponds to the extraction yield (mg of cannabinoid i per g of dry hemp) of the cannabinoid i with respect to the added dry matter of hemp.
Y C a n n a b i n o i d ,   i = C C a n n a b i n o i d ,   i × M E x t r a c t ρ E x t r a c t × 10 3 × M H e m p

2.6.2. Determination of Total Extraction Yield of Cannabinoids in the Feedstocks

It was necessary to determine each cannabinoid’s total concentration to calculate the extraction efficiency from each studied condition and equipment. For this, a Soxhlet extraction was performed using both hemp varieties according to the method described by (Yang et al., 2017) [24]. Three grams of the samples were macerated with a mortar and pestle, reweighed, transferred into a cellulose extraction thimble, and placed in a Soxhlet extractor with 300 mL of ethanol. The extractions were performed in triplicate. The total extraction yield for each cannabinoid ( Y C a n n a b i n o i d ,   T o t a l ) and sample was calculated using Equation (1). Then, the extraction efficiency ( ε C a n n a b i n o i d ,   i ) was calculated using Equation (2). The calculation considers the extraction yield at each condition ( Y C a n n a b i n o i d ,   i ) with the total extraction yield.
ε C a n n a b i n o i d ,   i = Y C a n n a b i n o i d ,   i Y C a n n a b i n o i d ,   T o t a l × 100
For each set of conditions in each of the extraction stages, the extractions were performed in duplicate. Then, the extraction yield ( Y C a n n a b i n o i d ,   i ) was calculated for each of the repetitions, according to Equation (1). The figures show the respective average value, and the error bars correspond to the values of the two repetitions. A two-way analysis of variance (ANOVA) was performed to determine the significance of the extraction yields, the p-values are reported for each cannabinoid. The extraction efficiency ( ε C a n n a b i n o i d ,   i ) was also calculated for each of the duplicates, and the tables report the average value and the range correspondent to the efficiency of the duplicates.

3. Results

This research’s main objective was to establish the influence of the selected variables on the extraction of cannabinoids at different reaction volumes (from a 40 mL extractor up to a 1 L autoclave reactor). The influence of the studied variables on each of the stages is explained in the following sections.

3.1. Determination of Total Extraction Yield of Cannabinoids in the Feedstocks

Table 2 presents the total extraction yield obtained for each cannabinoid in both varieties of hemp studied. These values were used in the subsequent sections to calculate the respective extraction efficiency. Both CBN and CBG showed low contents in the used varieties of hemp. Even though these cannabinoids may also have applications, the analysis was carried out mainly for CBD and THC. However, for each stage of the tests, the information regarding the extraction yield and efficiency of all the cannabinoids (CBD, THC, CBN, and CBG) is available in the Supplementary Material S1.

3.2. PLE: Schott Flasks

The purpose of this stage was evaluating the influence of the extraction time. Figure 1 shows the extraction yield for CBD obtained in the PLE in Schott flasks (Figure 1a for CBD and Figure 1b for THC), and Table 3 shows the respective extraction efficiency obtained at each set of conditions. A two-way ANOVA was performed to evaluate the significance of the variables. For CBD, the extraction time showed a p-value of 0.05, whereas the temperature showed a p-value of 0.10. For THC both the extraction time and temperature showed a p-value above 0.25. These values indicate that in the studied time and temperature range, there is not a significant difference in the yields obtained for THC. Extraction times above 100 min did not significantly increase the extraction yield of CBD, which can also be observed in the small increase in the extraction efficiency of 3.4%. However, even with the long extraction times, it is not sufficient to reach a total extraction of the cannabinoids. These could be explained due to a low temperature and not sufficient mixing. Solvent saturation may be discarded as the proportion of solvent to solid is significantly high enough to avoid it, and as it will be observed in further sections (Section 3.4), higher yields are achieved at nearly the same temperature and pressure with much lower solid/solvent ratio.
Regarding the overall yield of cannabinoids, CBD has the highest extraction yield with values over ten times greater than the other cannabinoids. The low yield of THC is essential, as this concentration is a limiting factor regulated by law. The specific value of the maximum THC concentration varies between different countries, and in Austria, it is allowed to have extracts/plants with 0.3 wt% of THC (3 mg of THC per gram of extract) [25]. In this stage, the maximum THC value in the extract was below 0.01 mg/g of extract, far below the limit. Despite the other cannabinoids (CBG and CBN) have potential applications, the extraction yields were too low. For this reason, the following results will be presented only for CBD and THC. However, for each stage of tests, the information regarding the extraction yield and efficiency of all the cannabinoids (CBD, THC, CBN, and CBG) is available in the Supplementary Material S1.

3.3. PLE: Speed Extractor (40 mL)

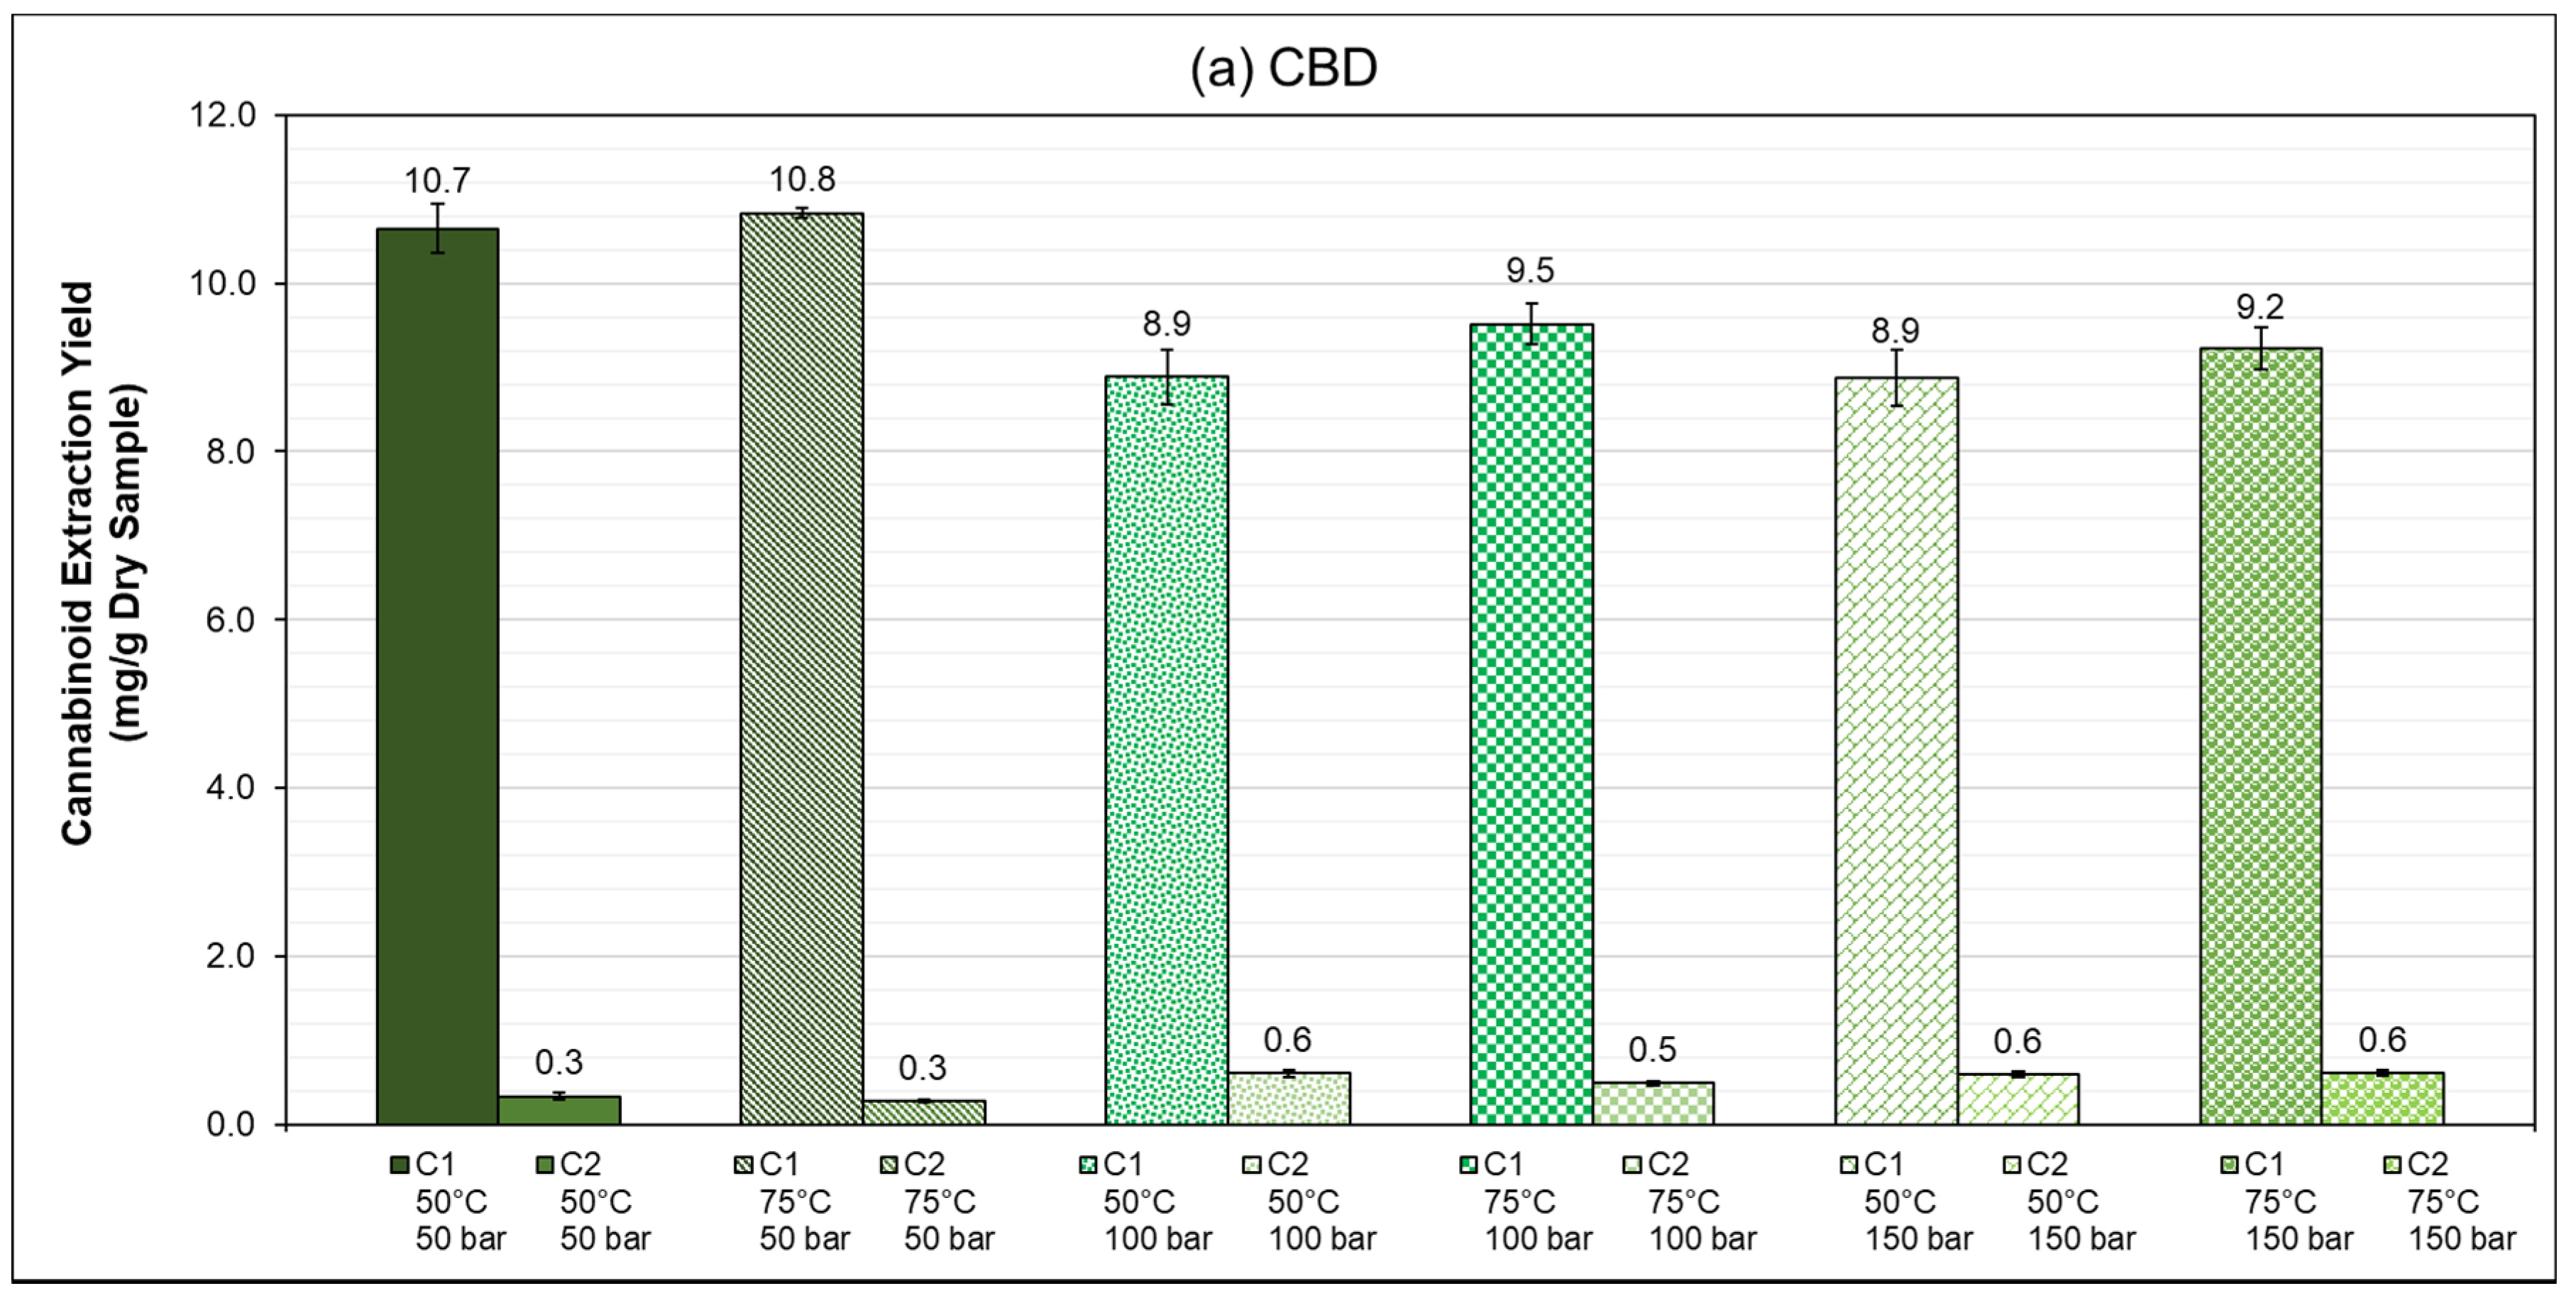
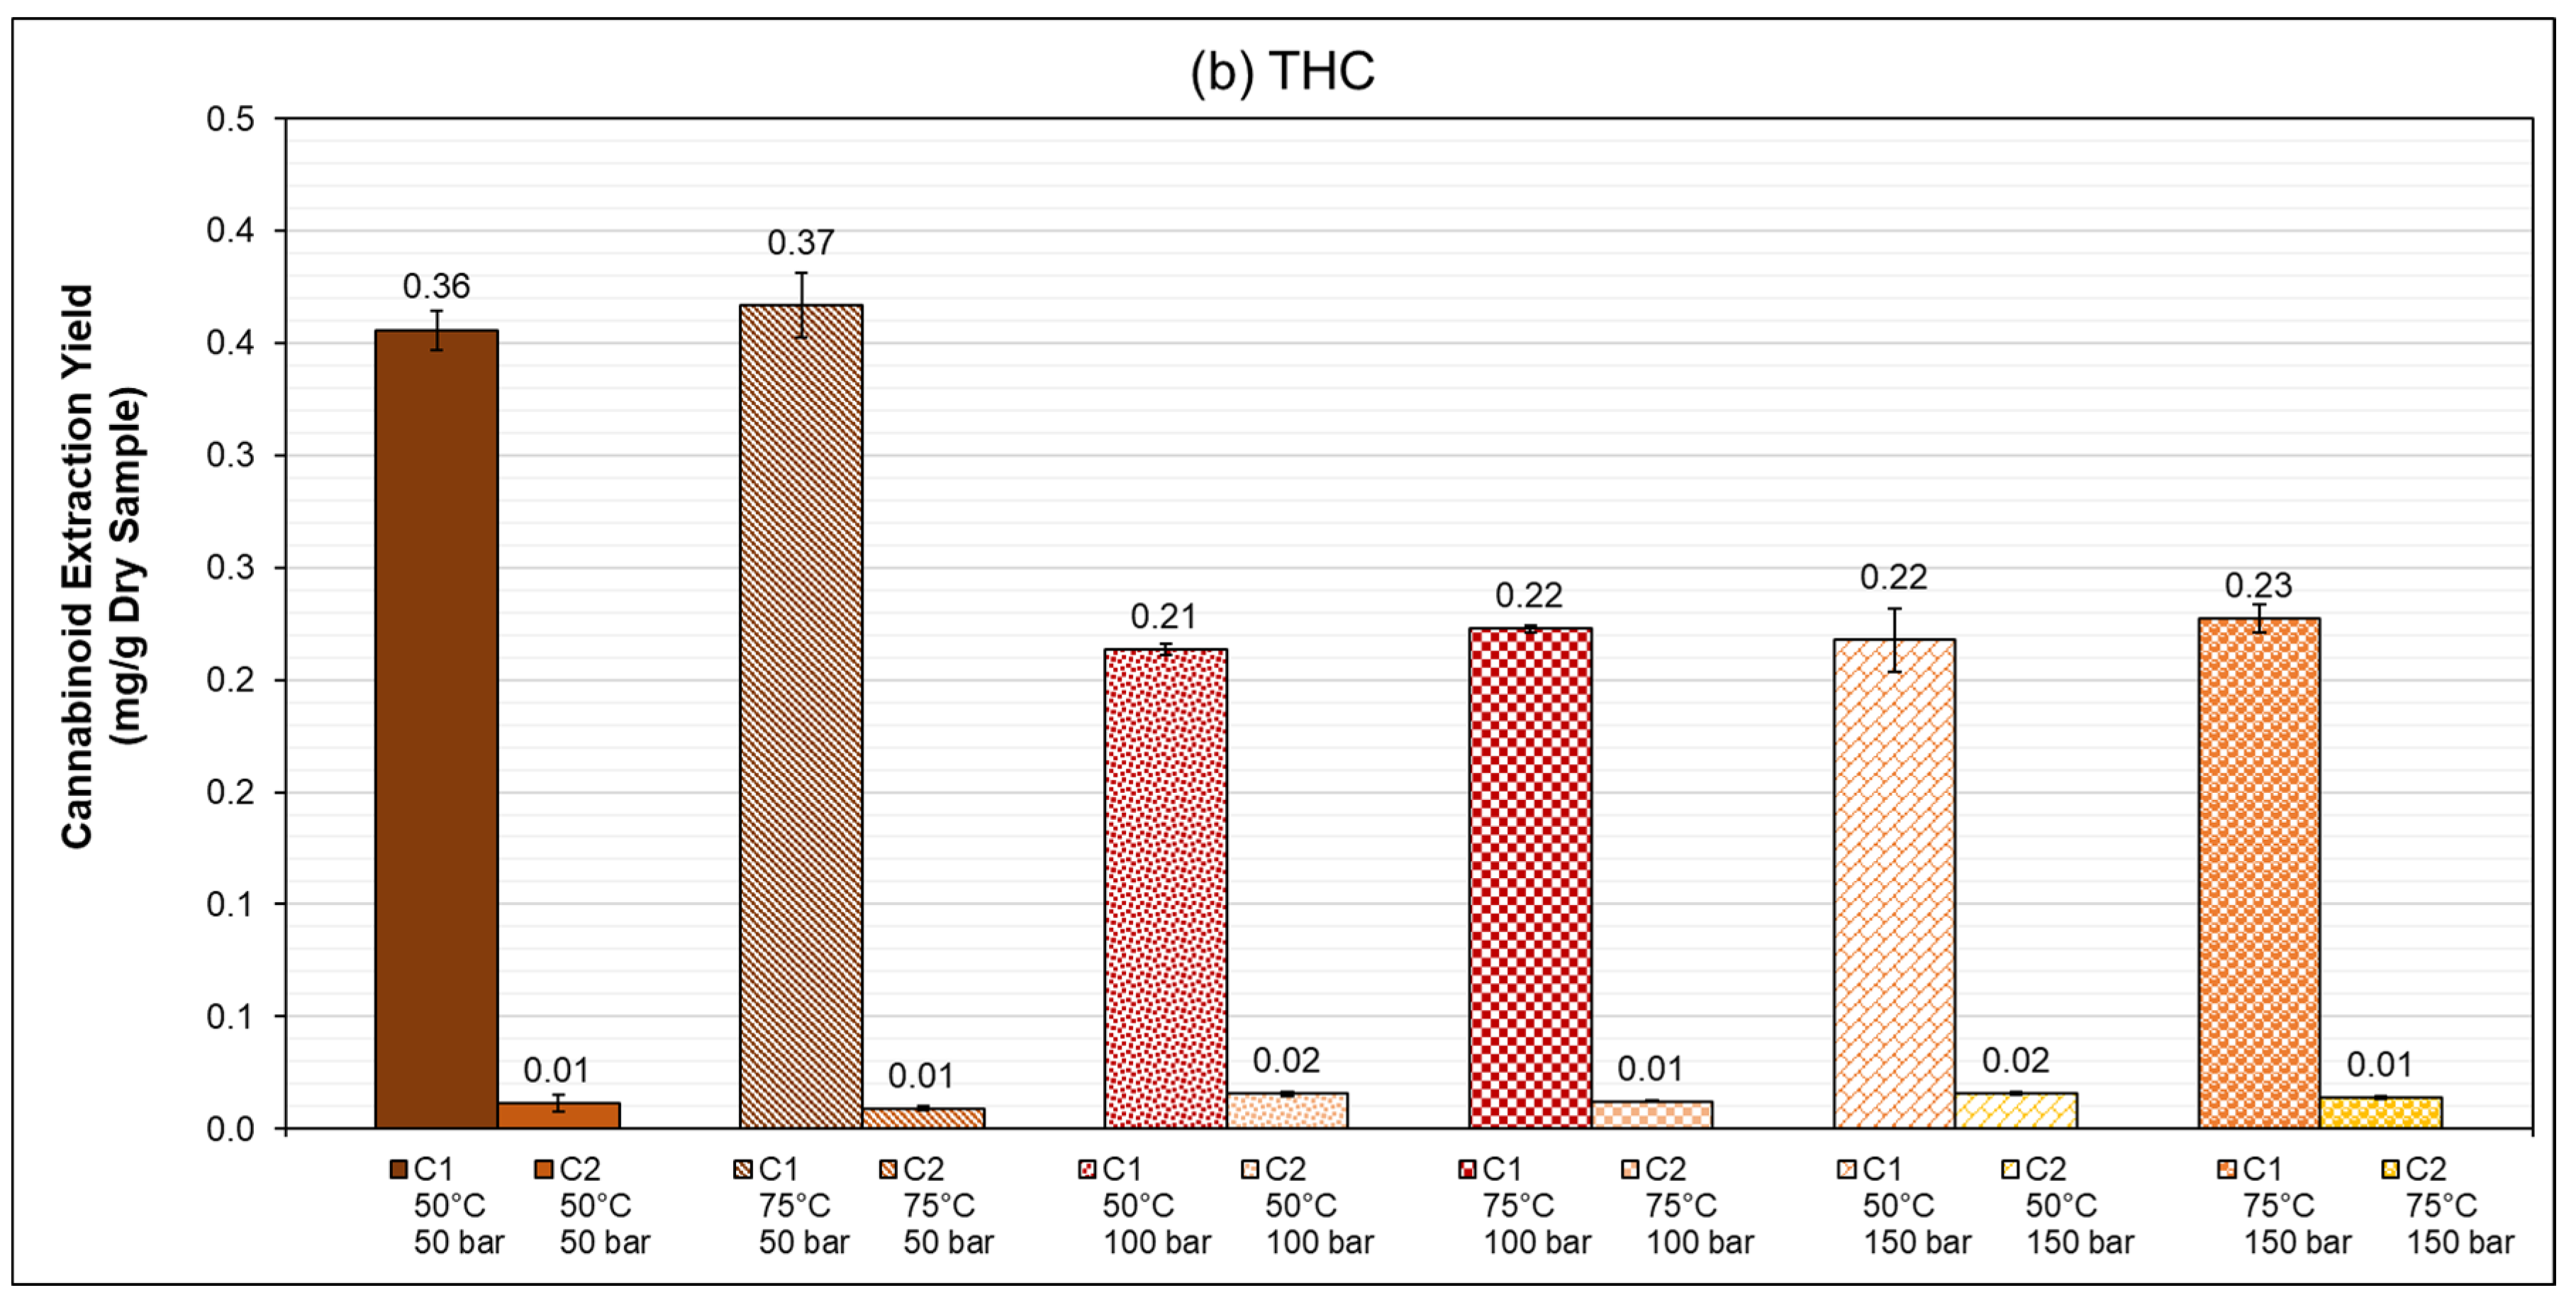
In this stage, the purpose was evaluating the influence of the pressure and the number of extraction cycles. Figure 2 shows the extraction yield of the chosen cannabinoids obtained in the PLE in the speed extractor (Figure 2a for CBD and Figure 2b for THC). Regarding the number of cycles, it was observed that a subsequent extraction of the same solid in the same conditions does not extract a significant additional amount of the cannabinoids. The second cycle of extraction only achieved 3–7% of the yield reached in the first cycle for both CBD and THC for all the extractions. This indicates that a second cycle is not necessary to further extract the CBD. Table 4 shows the extraction efficiencies reached in both extraction cycles for CBD and THC. The maximum extraction efficiency was achieved at 50 bar; however, there is no significant difference in the extractions carried out at 50 and 75 °C. A second extraction cycle only increases the efficiency by 2.4–2.9%, which corroborates the information observed from the extraction yields.
A two-way ANOVA was performed to evaluate the variable’s significance, with a p-value below 0.05 for CBD and THC. It can be observed initially that for CBD, the 50 bar extractions have higher yields (13–20%) than those at 100 and 150 bar. Furthermore, the yields at 100 and 150 bar did not show any significant differences. Based on this, it can be observed that the increase in pressure negatively affects the extraction of the cannabinoids. However, as the differences are minimal, we carried out an analysis of the variance concerning pressure and determined that there is not a significant difference between the values and that pressure had no significant influence in the studied range. This same trend was observed for THC (p < 0.05 for both CBD and THC). Although theoretically higher pressure should increase the solubility and mass transfer, as referred to in previous paragraphs, the maximum pressure value reached in this work (150 bar–15 MPa) remains under subcritical conditions and well below the pressures reached in other extraction techniques using liquid solvents. Other techniques for the extraction of bioactive compounds such as high-pressure extraction operate in the range of 1000–10,000 bar (100–1000 MPa) [26]. These results may implicate that this study’s pressures were not high enough to influence the extraction positively. Regarding THC concentration, the maximum concentration for this stage was 0.1 mg/g of extract, which remained well below the limit value of 3 mg/g in Austria. The complete information regarding the extraction yield and efficiency of all the cannabinoids (CBD, THC, CBN, and CBG) is available in the Supplementary Material S1.

Summary of Results

To summarize the findings obtained up until this point, it was observed that extraction times between 10–100 min favored the total CBD extraction (total CBD calculated as the sum of CBD + CBDA). The pressure did not significantly influence the extraction yield, and a second extraction cycle does not significantly increase efficiency. This set of results obtained in an analytical extractor was used to evaluate the operating conditions and perform the extractions in a 1 L autoclave reactor, providing further information on the studied variables. The next stage included more time points within the range of 10–100 min to identify an extraction time that provides the highest yield and efficiency within this range.

3.4. PLE: Autoclave Reactor (1 L)

3.4.1. Influence of Extraction Time

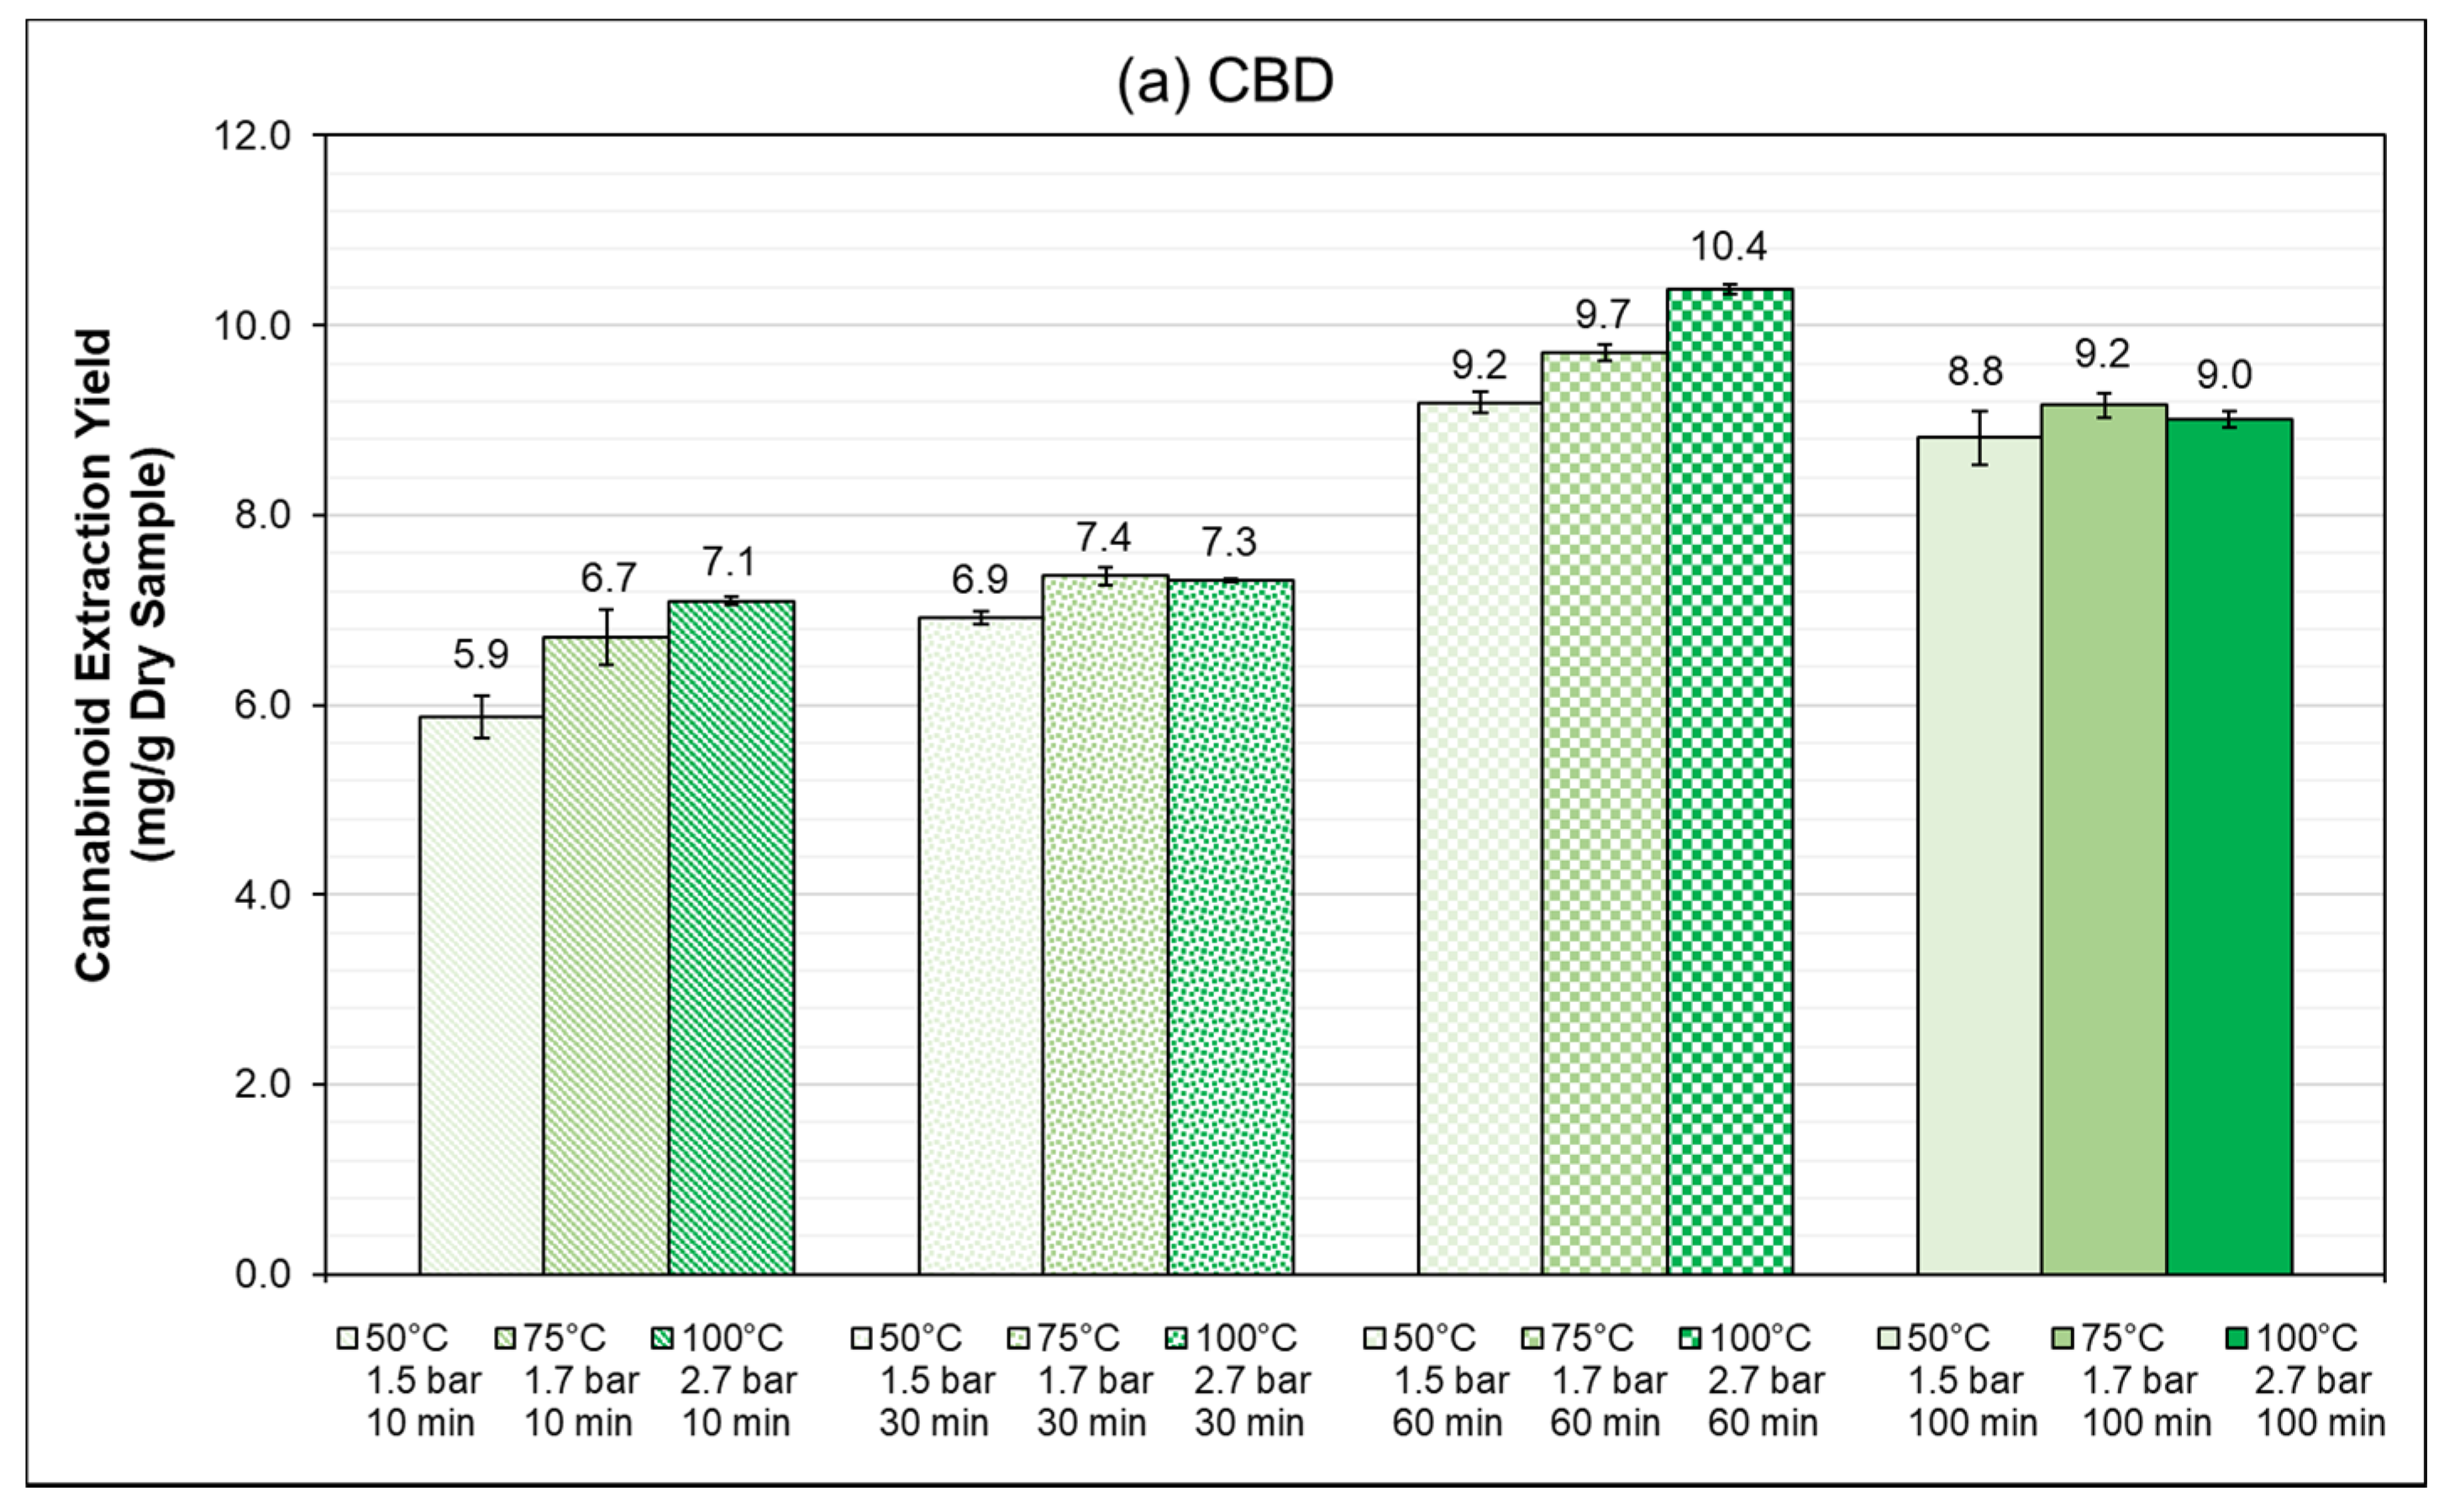
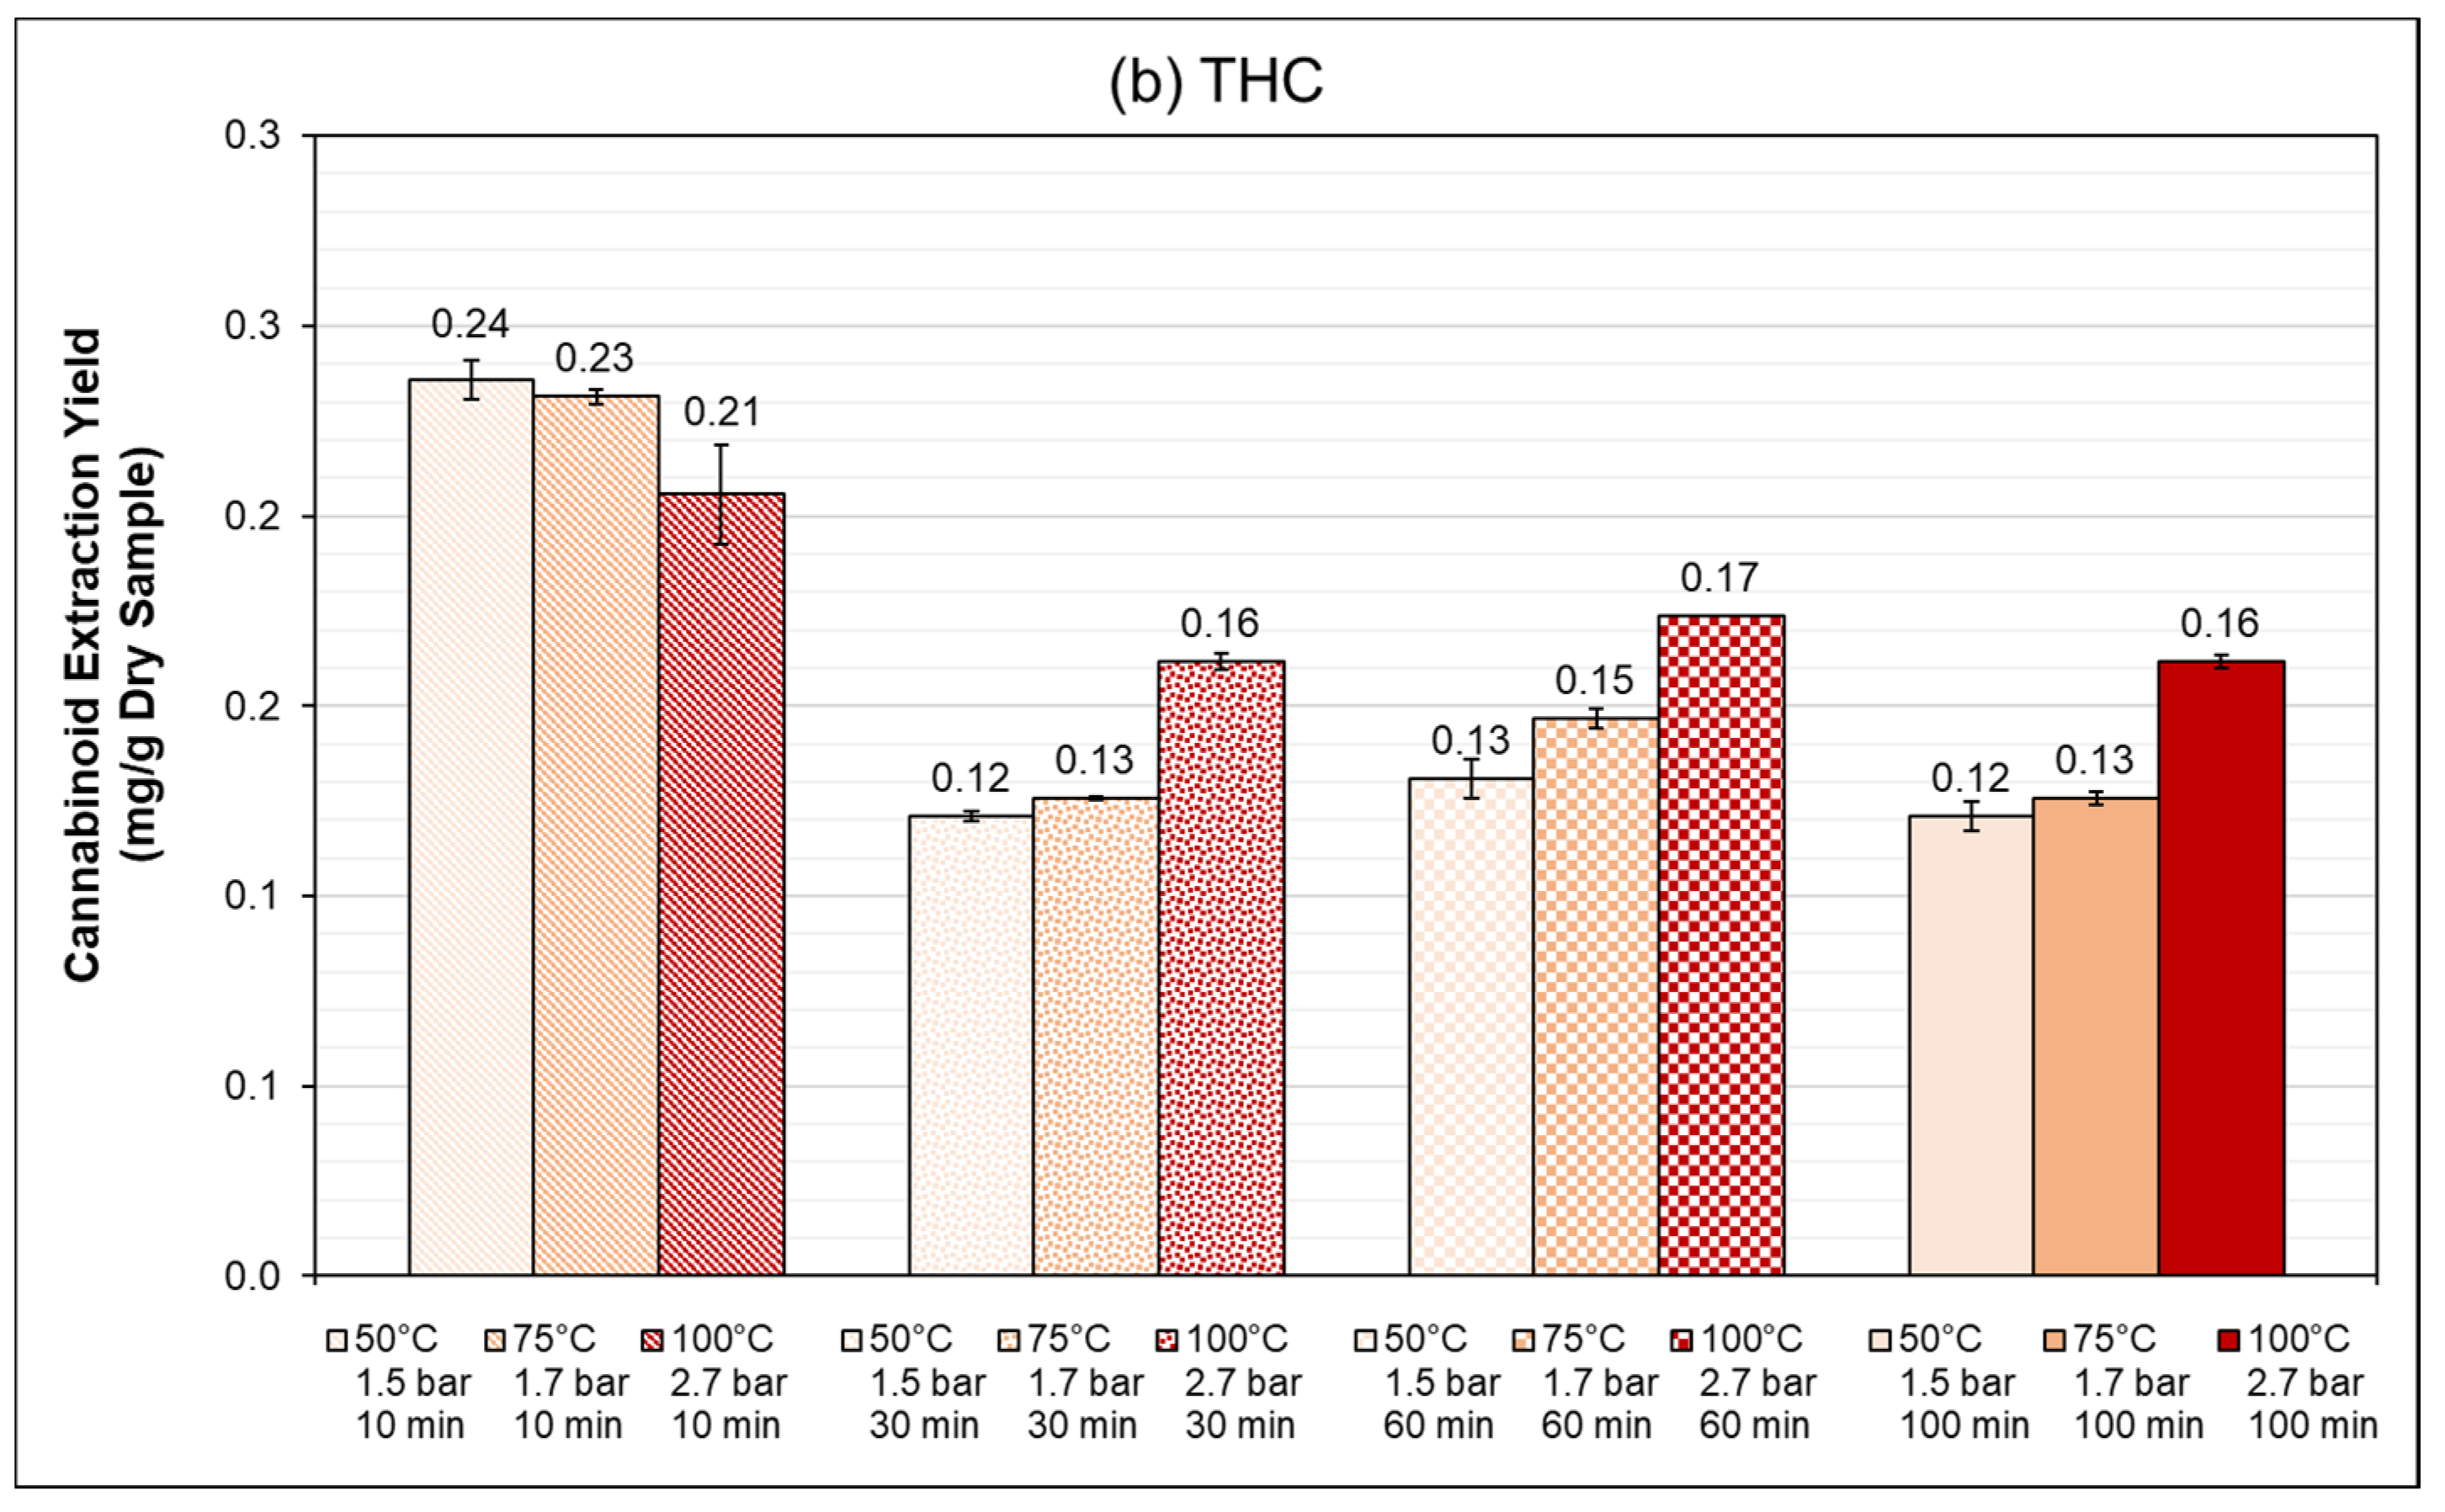
In this stage, the purpose was to evaluate the influence of the extraction time and temperature. Figure 3 shows the extraction yield of CBD and THC obtained in the PLE in the 1 L Autoclave (Figure 3a for CBD and Figure 3b for THC). A two-way ANOVA was performed to evaluate the significance of the variables. For CBD, the extraction time and pressure showed a p-value below 0.05, whereas THC showed a p-value of 0.89. These values indicate no significant difference in the yields obtained for THC in the studied time and temperature range. Regarding the extraction time, the extraction yield increased as the time increased and reached a maximum for CBD at 60 min. There is no conclusive trend regarding the influence of temperature, given that at 30 and 100 min, there is no significant difference in the yield at different temperatures. However, at 60 min, there is a difference between the extraction carried out at 50, 75, and 100 °C. When comparing the increase in the yield from 50 to 75 °C, and from 75 to 100 °C, at 10 min, the percentage increase was 14.3% and 5.7%, respectively. At 30 min, the percentage increase was 6.5% and −0.6%, respectively. At 60 min, the percentage increase was 5.7% and 7.0%, respectively. Finally, at 100 min, the increase was 3.9% and -1.7%, respectively. These results show that with higher temperatures, the extraction time loses relevance. This is corroborated by comparing the increase from 30 to 60 min, at 50 °C, 75 °C and 100 °C, with the percentage increase being 32.9%, 31.9%, and 42.0%, respectively.
The extraction time of 60 min at 100 °C reached the highest yield with a value of 10.4 mg/g, corroborating the temperature found in the previous stages and identifying the extraction time between the values studied in the previous section. The extractions performed at 100 °C reached pressure values of 2.7 bar, which is significantly lower than the pressure values observed previously at which CBD concentration decreased (Section 3.3). Table 5 shows the extraction efficiencies reached for CBD and THC. The maximum extraction efficiency was achieved at 100 °C for 60 min with 90.2%. Regarding the difference in the yield between the equipment, switching from the 40 mL speed extractor to a larger scale 1 L autoclave maintained the obtained yield of CBD, although there was a slight decrease in the efficiency of 4%. This is important because despite the change of the equipment, therefore certain factors such as the mass transfer, dimensions, and volume, among others, the extraction yields reach similar values. In terms of mass transfer, both setups have different agitation modes. The speed extractor has an extraction vessel where the solid sample is located, and the solvent is pumped in. After this, pressure and temperature rise to set values, and after the given time, the liquid is filtered and pumped into a collection vessel [27]. The autoclave has a rotor engine that mixes the batch of solid/liquid at approximately 200 rpm during the entire process (heating, holding, and cooling), enhancing the mass transfer between solid and solvent. This comparison also shows the agitation’s importance as a variable, which gains relevance as the process is scaled up. Finally, the maximum THC concentration in this stage was 0.02 mg/g of extract, which remained well below the limit value of 3 mg/g in Austria. The complete information regarding the extraction yield and efficiency of all the cannabinoids (CBD, THC, CBN, and CBG) is available in the Supplementary Material S1.

3.4.2. Corroboration: Extraction from Hemp Variety Finola

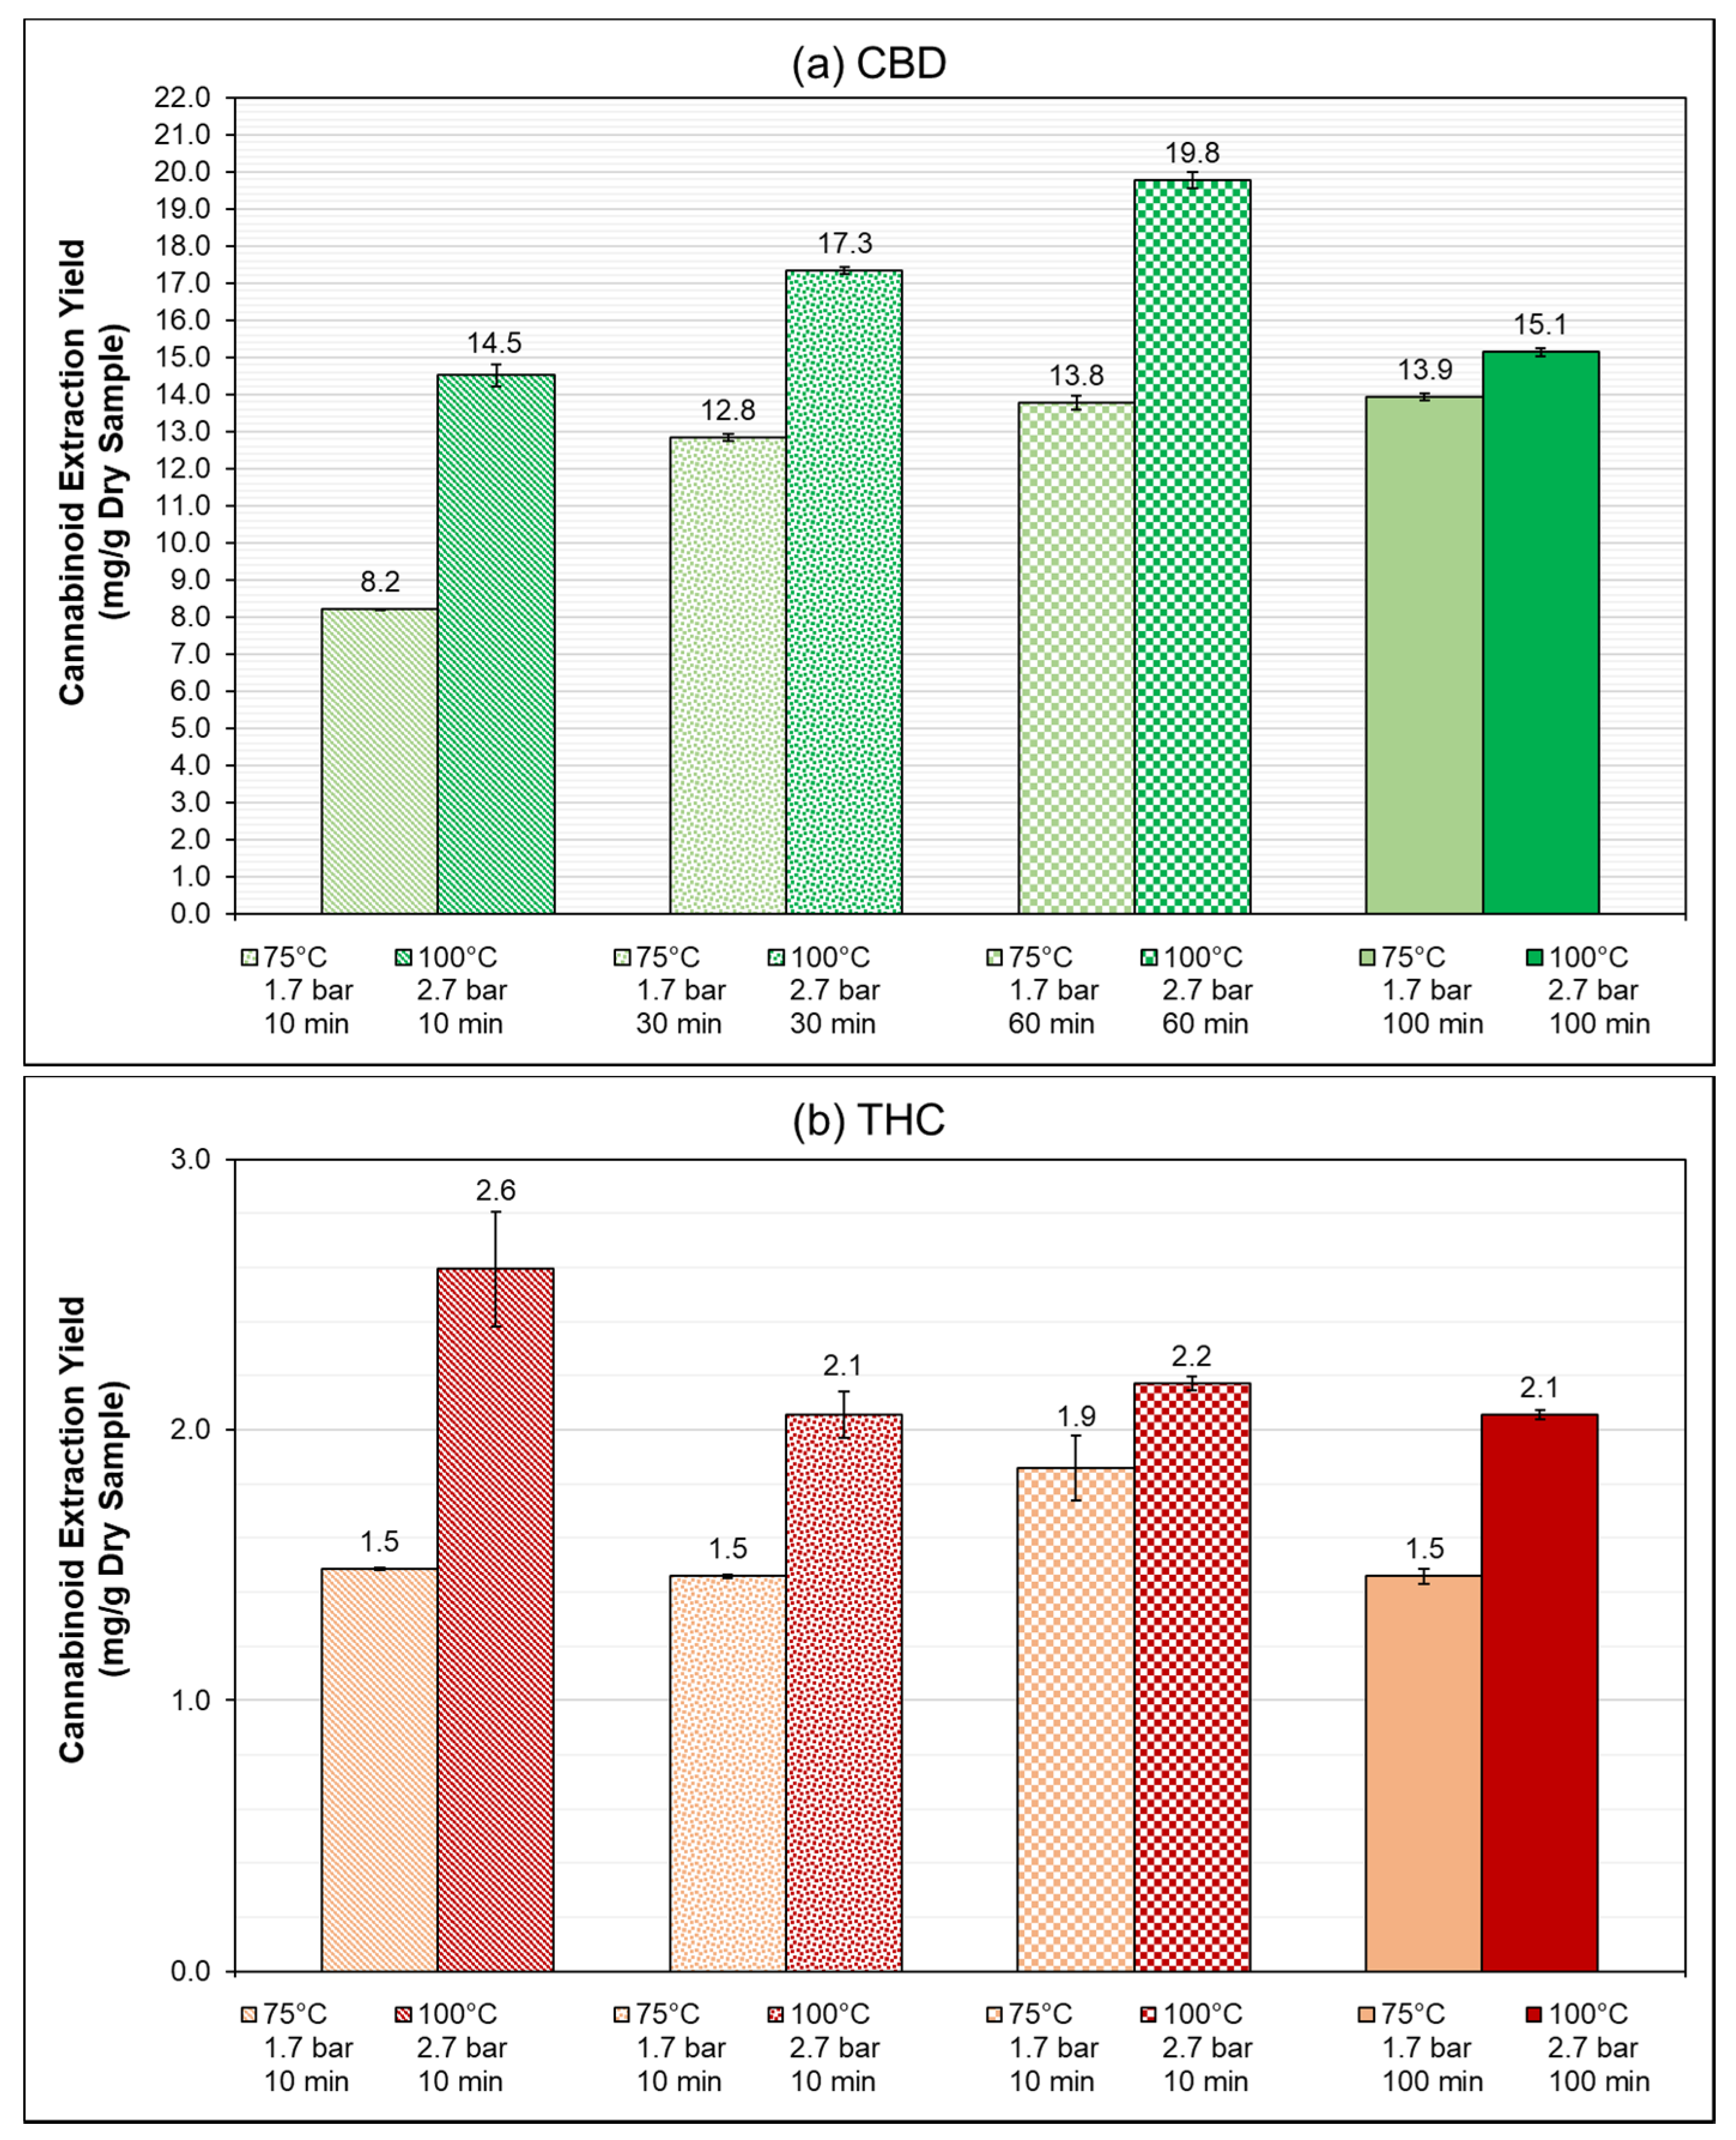
These extractions were done again in the 1 L autoclave but using hemp Finola instead of the previously used variety KC Virtus. Figure 4 shows the extraction yield of CBD and THC obtained in the PLE carried out to corroborate the identified extraction conditions in the previous stage (Figure 4a for CBD and Figure 4b for THC). A two-way ANOVA was performed to evaluate the significance of the variables. For CBD, the extraction time and pressure showed a p-value below 0.05, whereas THC showed a p-value of 0.24. The trends identified in the previous experiments were also exhibited in this case. The temperature increase favored the extraction performed at 100 °C, reaching approximately 8.7%, 43.6%, 35.2%, and 76.9% higher yields for CBD than at 75 °C for 100, 60, 30, and 10 min, respectively. The 60 min extractions also proved to be more effective, reaching CBD yields approximately 14–36% higher than the yields reached at other times. Initially, it can be said that the best conditions identified for the extraction were 100 °C and 60 min, reaching a CBD yield of 19.8 mg/g of dry sample. This can be corroborated with the extraction efficiencies shown in Table 6, where this set of conditions reached an extraction efficiency of 99.3%. This is the same trend found in the previous section with hemp KC Virtus. Finally, in this stage, the maximum THC concentration was 0.263 mg/g of extract, which remained well below the limit value of 3 mg/g in Austria. The complete information regarding the extraction yield and efficiency of all the cannabinoids (CBD, THC, CBN, and CBG) is available in the Supplementary Material S1.

4. Discussion

The conditions found in our study with the highest extraction yield were using one extraction cycle at 100 °C for 60 min of extraction time, which was tested and corroborated for two different hemp varieties. Performing a second extraction cycle did not significantly increase the yield, as the first cycle corresponded to more than 92% of the total yield achieved on the two cycles. Approximately, 19.8 mg of CBD per gram of dry hemp was successfully extracted from the leaves of variety Finola with 99.3% extraction efficiency.
Other authors obtained results and findings that were similar to those obtained in this work. Namdar et al., (2018) studied the variation in the composition of cannabinoids derived from inflorescence position along the stem using ethanol, hexane, and methanol as solvents. They found that cannabinoids are best extracted with polar solvents [28]. Wianowska et al., (2015) studied the extraction conditions of cannabinoids, mainly THC and CBN, in a pressurized liquid extraction, with temperatures ranging between 25–150 °C, and extraction times between 5–20 min. They had increasing extraction yields as the temperature increased until 100 °C, then the values decreased at 125 and 150 °C. The extraction time displayed an increasing trend until reaching the maximum time they studied. These trends are in accordance with the results found in this work. The specific yields reported in this study cannot be compared with this work, as their focus was on CBN, not on CBD, and the variety of hemp is not stated [29].
When comparing the results obtained with other technologies, Brighenti et al. (2017) performed dynamic maceration, ultrasound-assisted extraction, microwave-assisted extraction, and supercritical fluid extraction, using ethanol, methanol, acetone, and hexane as extraction solvents, 0.25 g of solid sample, and a solid/liquid ratio of 0.03 g/g. Among the different techniques, dynamic maceration and ethanol showed the best results. This corroborates pure ethanol as an extraction solvent. It is important to bear in mind that the differences in scale and technology make the results not directly comparable but provide an idea of where the results of this work fit with other technologies and studies. The achieved extraction yield was approximately 22 mg/g, which is in the same range as the value obtained in this work [30]. Grijó et al., (2019) studied the supercritical extraction using CO2 and ethanol to extract two hybrid varieties with different shares of C. sativa and Cannabis indica varieties. The studied temperatures were 50, 60, and 70 °C and pressures were approximately 160, 200, and 240 bar (16, 20, and 24 MPa). They used the blossoms for the extraction. The obtained extraction yields of CBD were in the range of 10–25 mg/g for the first variety and around 300 mg/g for the second [31]. The extraction yield of supercritical CO2 can achieve values even 10 times higher than those obtained with PLE; however, supercritical fluid extraction has a drawback, which is the high pressure to maintain the solvent supercritical state, resulting in higher capital and operating costs. Indeed, each technology has its advantages and disadvantages in terms of the extraction of cannabinoids, and the extraction yield is not a sufficient criterion for selecting one technology over another. A further comparison of different technologies to select one technology over others requires a more in-depth analysis of the technical, economic, and environmental performance. However, this was beyond this work’s scope and should be carried out in the next research stage.

5. Conclusions and Outlook

This work showed the evaluation of the different variables associated with the PLE of cannabinoids, mainly CBD, from C. sativa threshing residues, and the respective evaluation at different volumes (40 mL up to a 1 L extraction setup). These results provide an excellent outlook for further research focused on hemp-based biorefineries, as cannabinoids are contained mainly in the blossoms. However, other residues from the processing of the blossom, such as the threshing residues, can still have significant concentrations of the cannabinoids, which could be extracted.
The processing of the hemp blossoms played a significant role. On the one hand, the threshing residue from the variety KC Virtus was already a threshed mixture of leaves and stems, whereas the residue from the variety Finola still allowed the separation of the leaves from the stem. Even though the variety Finola showed higher concentrations of cannabinoids compared to variety KC Virtus, as the stem does not have significant CBD content, the mixture of both stem and leaves decreases the concentration of the cannabinoids. It is important to bear in mind that the optimization carried out in this work was performed based on the total concentration of each cannabinoid (e.g., CBD and CBDA). The next step in the research should be evaluating each cannabinoid profile at the respective conditions, which is an essential factor for the extract’s quality and application.
Regarding the overall valorization of the hemp plant, this work considered the valorization of one residue stream from the processing of the blossoms; after this stage, other fractions of the plant (e.g., the stem and the remaining solids after the extraction) remain available for the production of materials, or sugar as a substrate for fermentation-based processes, among others [32]. The results obtained in this work covered variables such as the extraction time, pressure, and temperature, which are the main variables associated with PLE. These results may be a basis to address other new topics, such as the influence of agitation and mass transfer for the specific design of autoclave reactors for the extraction of cannabinoids and bioactive compounds in general. These variables may be also the starting point for further scaling up of the process.

Supplementary Materials

The following are available online at https://www.mdpi.com/2227-9717/8/11/1334/s1, Table S1: Concentration of characterized cannabinoids in the different stages.

Author Contributions

S.S.-L.: Conceptualization, investigation (Section 2.4), writing—original draft. J.A.: investigation (Section 2.3), writing—review and editing. S.B.: investigation (Section 2.2), writing—review and editing. C.K.: investigation (Section 2.6), writing—review and editing. H.H.: writing—review and editing, supervision. A.F.: conceptualization, writing—review and editing, supervision. All authors have read and agree to the published version of the manuscript.

Funding

This research received no external funding.

Acknowledgments

The authors acknowledge TU Wien for funding the Doctoral College “Bioactive”, under which this research was performed and TU Wien Bibliothek for financial support through its Open Access Funding Programme. The authors also acknowledge Samtech Extraktionstechnik GmbH and Hanfland GmbH for kindly providing the samples of C. sativa used in this study. We are grateful to Renate Paltram for her technical assistance during the identification and quantification of cannabinoids and to Martin Miltner and Angela Miltner for proofreading the article.

Conflicts of Interest

The authors declare no conflict of interest.

References

  1. Cardona Alzate, C.A.; Serna-Loaiza, S.; Ortiz-Sanchez, M. Sustainable biorefineries: What was learned from the design, analysis and implementation. J. Sustain. Dev. Energy Water Environ. Syst. 2020, 8, 88–117. [Google Scholar] [CrossRef]
  2. Oreopoulou, V.; Tzia, C. Utilization of plant by-products for the recovery of proteins, dietary fibers, antioxidants, and colorants. In Utilization of By-Products and Treatment of Waste in the Food Industry; Springer: Berlin, Germany, 2007; pp. 209–232. [Google Scholar]
  3. Guaadaoui, A.; Benaicha, S.; Elmajdoub, N.; Bellaoui, M.; Hamal, A. What is a bioactive compound? A combined definition for a preliminary consensus. Int. J. Food Sci. Nutr. 2014, 3, 17–179. [Google Scholar] [CrossRef]
  4. Balasundram, N.; Sundram, K.; Samman, S. Phenolic compounds in plants and agri-industrial by-products: Antioxidant activity, occurrence, and potential uses. Food Chem. 2006, 99, 191–203. [Google Scholar] [CrossRef]
  5. Vieira, A.R.; Abar, L.; Vingeliene, S.; Chan, D.S.M.; Aune, D.; Navarro-Rosenblatt, D.; Stevens, C.; Greenwood, D.; Norat, T. Fruits, vegetables and lung cancer risk: A systematic review and meta-analysis. Ann. Oncol. 2015, 27, 81–96. [Google Scholar] [CrossRef] [PubMed]
  6. Tiyaboonchai, W.; Tungpradit, W.; Plianbangchang, P. Formulation and characterization of curcuminoids loaded solid lipid nanoparticles. Int. J. Pharm. 2007, 337, 299–306. [Google Scholar] [CrossRef] [PubMed]
  7. Kitrytė, V.; Bagdonaitė, D.; Rimantas Venskutonis, P. Biorefining of industrial hemp (Cannabis sativa L.) threshing residues into cannabinoid and antioxidant fractions by supercritical carbon dioxide, pressurized liquid and enzyme-assisted extractions. Food Chem. 2018, 267, 420–429. [Google Scholar] [CrossRef] [PubMed]
  8. Beisl, S.; Friedl, A.; Miltner, A. Lignin from micro- to nanosize: Applications. Int. J. Mol. Sci. 2017, 18, 2367. [Google Scholar] [CrossRef] [Green Version]
  9. Moreira, M.M.; Barroso, M.F.; Porto, J.V.; Ramalhosa, M.J.; Švarc-Gajić, J.; Estevinho, L.; Morais, S.; Delerue-Matos, C. Potential of Portuguese vine shoot wastes as natural resources of bioactive compounds. Sci. Total Environ. 2018, 634, 831–842. [Google Scholar] [CrossRef] [Green Version]
  10. Luque-Rodríguez, J.M.; Pérez-Juan, P.; Luque De Castro, M.D. Extraction of polyphenols from vine shoots of Vitis vinifera by superheated ethanol-water mixtures. J. Agric. Food Chem. 2006, 54, 8775–8781. [Google Scholar] [CrossRef]
  11. Mintz, C.S.; Nison, E.; Fabrizio, A.J. Cannabis-derived pharmaceuticals. J. Commer. Biotechnol. 2015, 21, 16–31. [Google Scholar] [CrossRef]
  12. de Ceballos, M.L. Cannabinoids for the treatment of neuroinflammation. In Cannabinoids in Neurologic and Mental Disease; Fattore, L., Ed.; Academic Press: Cambridge, MA, USA, 2015; pp. 3–14. ISBN 978-0-12-417041-4. [Google Scholar]
  13. Fagan, S.G.; Campbell, V.A. Endocannabinoids and Alzheimer’s disease. In Cannabinoids in Neurologic and Mental Disease; Fattore, L., Ed.; Academic Press: Cambridge, MA, USA, 2015; pp. 15–33. ISBN 978-0-12-417041-4. [Google Scholar]
  14. Concannon, R.; Finn, D.P.; Dowd, E. Cannabinoids in Parkinson’s disease. In Cannabinoids in Neurologic and Mental Disease; Fattore, L., Ed.; Academic Press: Cambridge, MA, USA, 2015; pp. 35–39. ISBN 978-0-12-417041-4. [Google Scholar]
  15. Luís, Â.; Marcelino, H.; Rosa, C.; Domingues, F.; Pereira, L.; Cascalheira, J.F. The effects of cannabinoids on glioblastoma growth: A systematic review with meta-analysis of animal model studies. Eur. J. Pharmacol. 2020, 876, 173055. [Google Scholar] [CrossRef] [PubMed]
  16. Amaducci, S.; Scordia, D.; Liu, F.H.; Zhang, Q.; Guo, H.; Testa, G.; Cosentino, S.L. Key cultivation techniques for hemp in Europe and China. Ind. Crops Prod. 2015, 68, 2–16. [Google Scholar] [CrossRef]
  17. Andre, C.M.; Hausman, J.-F.; Guerriero, G. Cannabis sativa: The plant of the thousand and one molecules. Front. Plant Sci. 2016, 7, 19. [Google Scholar] [CrossRef] [PubMed] [Green Version]
  18. Messina, F.; Rosati, O.; Curini, M.; Marcotullio, M.C. Cannabis and Bioactive Cannabinoids; Elsevier: Amsterdam, The Netherlands, 2015; Volume 45, ISBN 9780444634733. [Google Scholar]
  19. Fathordoobady, F.; Singh, A.; Kitts, D.D.; Singh, A.P. Hemp (Cannabis Sativa L.) extract: Anti-Microbial properties, methods of extraction, and potential oral delivery. Food Rev. Int. 2019, 35, 664–684. [Google Scholar] [CrossRef]
  20. Felipe Osorio-Tobón, J.; Angela, A.; Meireles, M. Recent applications of pressurized fluid extraction: Curcuminoids extraction with pressurized liquids. Food Public Health 2013, 3, 289–303. [Google Scholar] [CrossRef] [Green Version]
  21. Hendriks, A.T.W.M.T.W.M.; Zeeman, G. Pretreatments to enhance the digestibility of lignocellulosic biomass. Bioresour. Technol. 2009, 100, 10–18. [Google Scholar] [CrossRef]
  22. Solana, M.; Boschiero, I.; Dall’Acqua, S.; Bertucco, A. A comparison between supercritical fluid and pressurized liquid extraction methods for obtaining phenolic compounds from Asparagus officinalis L. J. Supercrit. Fluids 2015, 100, 201–208. [Google Scholar] [CrossRef]
  23. Gul, W.; Gul, S.W.; Radwan, M.M.; Wanas, A.S.; Mehmedic, Z.; Khan, I.I.; Sharaf, M.H.M.; ElSohly, M.A. Determination of 11 cannabinoids in biomass and extracts of different varieties of cannabis using high-performance liquid chromatography. J. AOAC Int. 2015, 98, 1523–1528. [Google Scholar] [CrossRef]
  24. Yang, Y.; Lewis, M.M.; Bello, A.M.; Wasilewski, E.; Clarke, H.A.; Kotra, L.P. Cannabis sativa (Hemp) seeds, Δ(9)-tetrahydrocannabinol, and potential overdose. Cannabis Cannabinoid Res. 2017, 2, 274–281. [Google Scholar] [CrossRef]
  25. Rechtsinformationssystem des Bundes. Bundesgesetz über Suchtgifte, Psychotrope Stoffe und Drogenausgangsstoffe (Suchtmittelgesetz–SMG); Federal Chancellery of Austria: Vienna, Austria, 2020. [Google Scholar]
  26. Khan, S.A.; Aslam, R.; Makroo, H.A. High pressure extraction and its application in the extraction of bioactive compounds: A review. J. Food Process Eng. 2019, 42, e12896. [Google Scholar] [CrossRef] [Green Version]
  27. Büchi. SpeedExtractor E-916/E-916XL/E-914 Technical Datasheet; Büchi: Flawil, Switzerland, 2019. [Google Scholar]
  28. Namdar, D.; Mazuz, M.; Ion, A.; Koltai, H. Variation in the compositions of cannabinoid and terpenoids in Cannabis sativa derived from inflorescence position along the stem and extraction methods. Ind. Crops Prod. 2018, 113, 376–382. [Google Scholar] [CrossRef]
  29. Wianowska, D.; Dawidowicz, A.L.; Kowalczyk, M. Transformations of tetrahydrocannabinol, tetrahydrocannabinolic acid and cannabinol during their extraction from Cannabis sativa L. J. Anal. Chem. 2015, 70, 920–925. [Google Scholar] [CrossRef]
  30. Brighenti, V.; Pellati, F.; Steinbach, M.; Maran, D.; Benvenuti, S. Development of a new extraction technique and HPLC method for the analysis of non-psychoactive cannabinoids in fibre-type Cannabis sativa L. (hemp). J. Pharm. Biomed. Anal. 2017, 143, 228–236. [Google Scholar] [CrossRef] [PubMed]
  31. Grijó, D.R.; Osorio, I.A.V.; Cardozo-Filho, L. Supercritical extraction strategies using CO2 and ethanol to obtain cannabinoid compounds from Cannabis hybrid flowers. J. CO2 Util. 2018, 28, 174–180. [Google Scholar] [CrossRef]
  32. Serna-Loaiza, S.; Miltner, A.; Miltner, M.; Friedl, A. A Review on the feedstocks for the sustainable production of bioactive compounds in Biorefineries. Sustainability 2019, 11, 6765. [Google Scholar] [CrossRef] [Green Version]
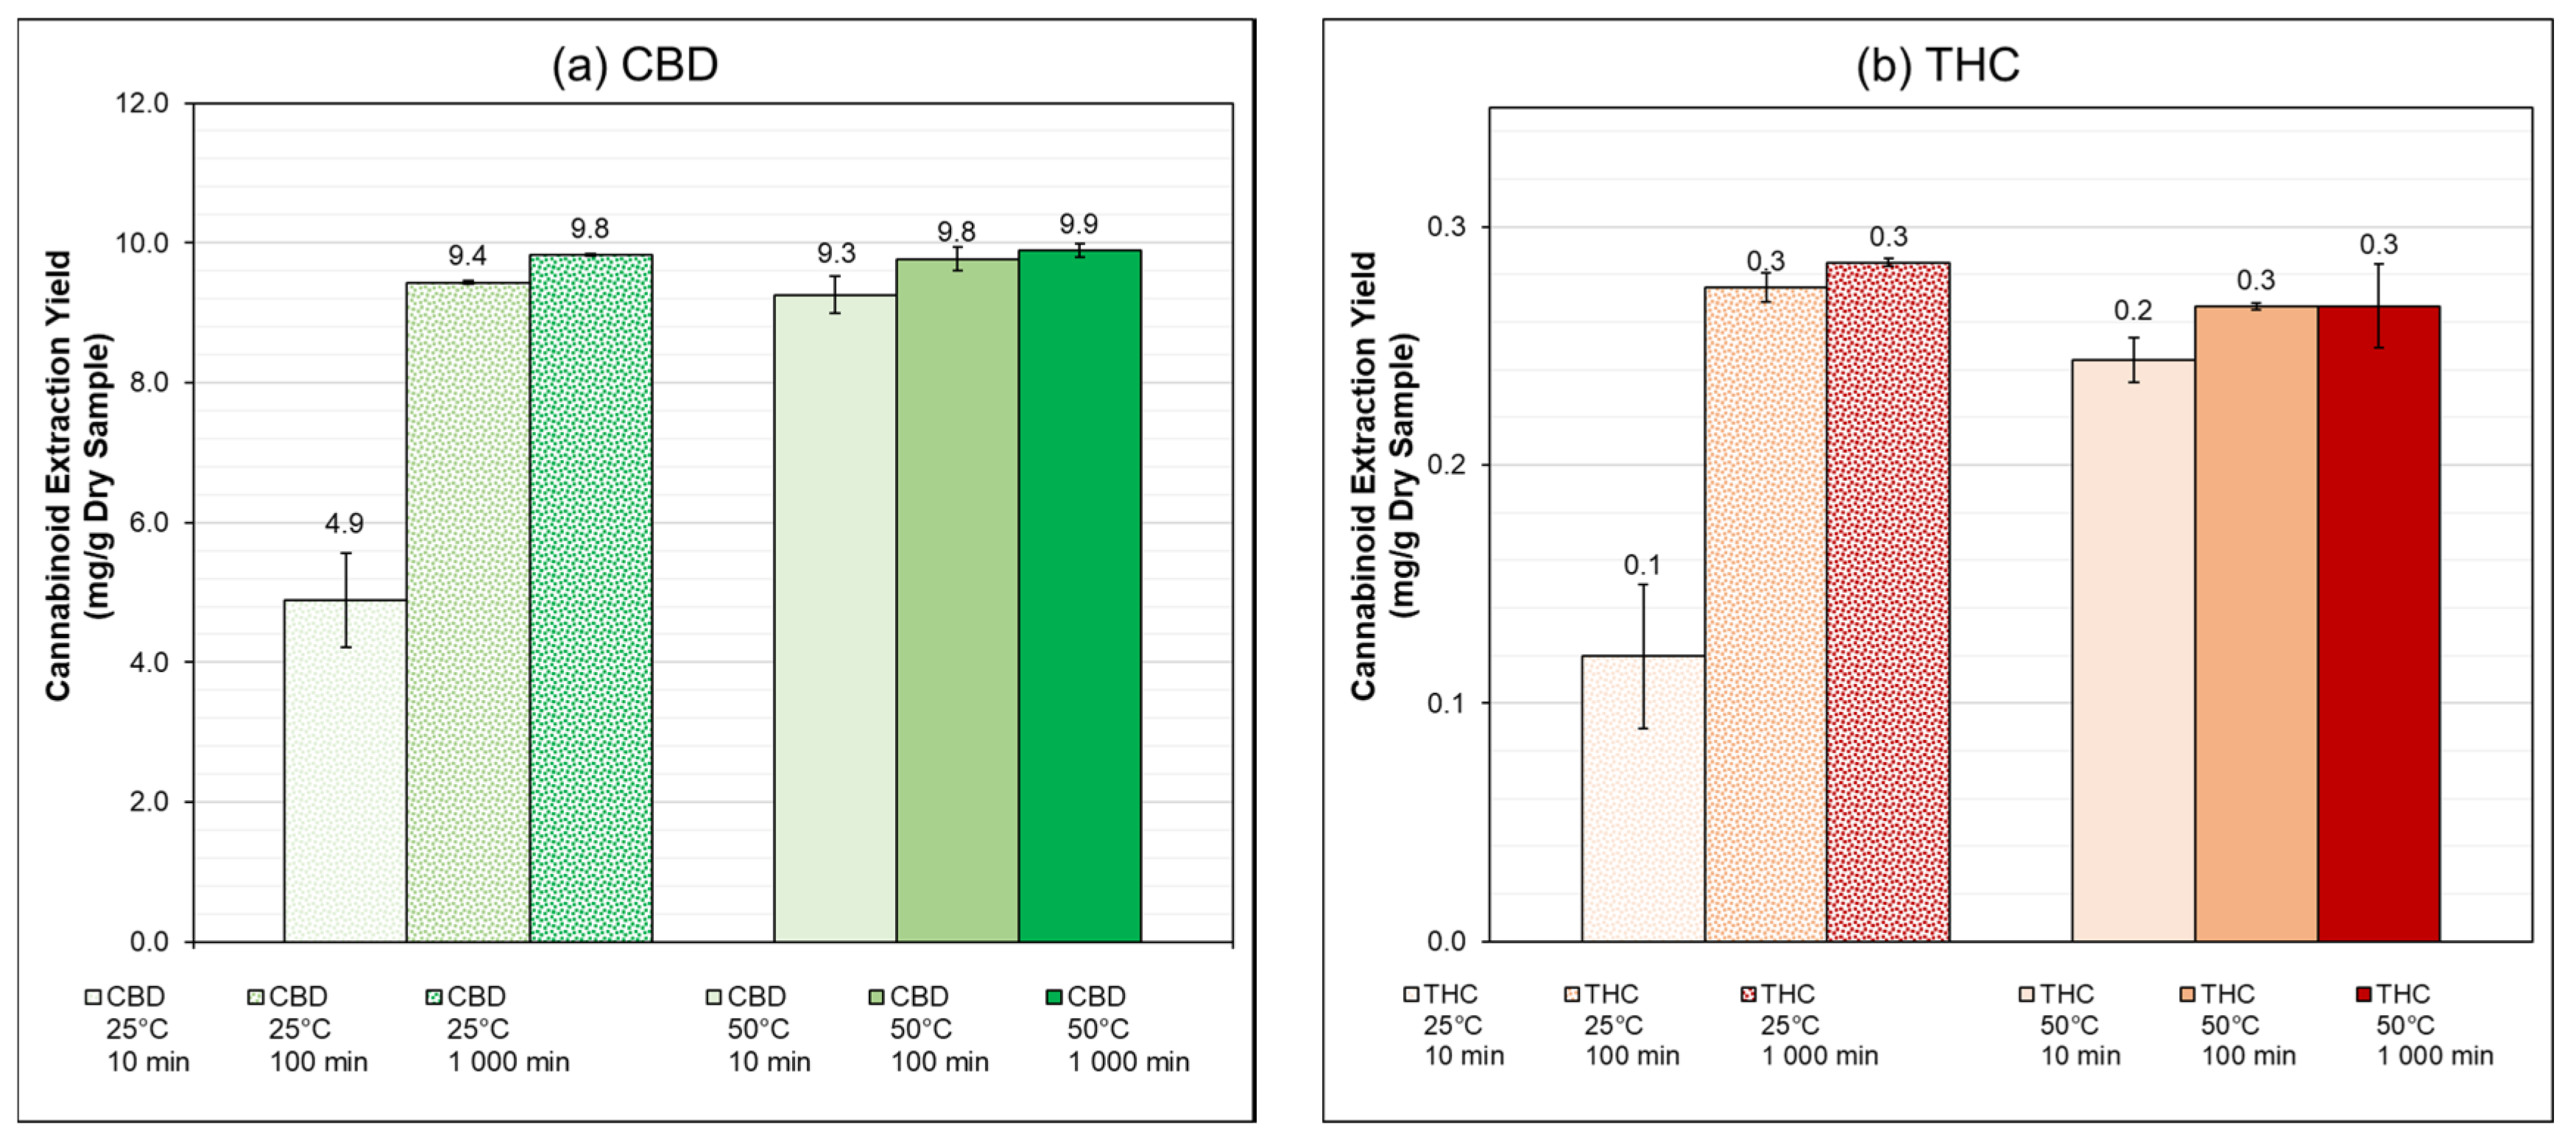
Figure 1. Cannabinoid extraction yield of the experiments performed in Schott flasks (Section 2.3, Table 1). (a) Cannabidiol (CBD), and (b) tetrahydrocannabinol (THC). Average value of the duplicates. Cannabigerol (CBG) and cannabinol (CBN) concentrations were detected, but calculated yields were below 0.5 mg/g; therefore, they are not shown in the figure. ANOVA analysis: p-values were 0.05 for CBD and above 0.25 for THC.
Processes 08 01334 g001
Figure 2. Cannabinoid extraction yield of the pressurized liquid extraction (PLE) experiments performed in the speed extractor (Section 2.4, Table 1). (a) CBD, and (b) THC. Average value of the duplicates. C1 corresponds to the first extraction and C2 to the subsequent extraction at a given temperature. ANOVA analysis: p-values were below 0.05 for CBD and THC.
Processes 08 01334 g002aProcesses 08 01334 g002b
Figure 3. Cannabinoid extraction yield of the PLE experiments performed in the 1 L autoclave with hemp variety KC Virtus (Section 2.5, Table 1). (a) CBD, and (b) THC. Average value of the duplicates. ANOVA analysis: p-values were 0.01 and 0.89 for CBD and THC, respectively.
Processes 08 01334 g003aProcesses 08 01334 g003b
Figure 4. Cannabinoid extraction yield of the PLE experiments performed in the 1 L autoclave with hemp variety Finola (Section 2.5, Table 1). (a) CBD, and (b) THC. Average value of the duplicates. ANOVA analysis: p-values were 0.01 and 0.24 for CBD and THC, respectively.
Processes 08 01334 g004
Table 1. Summary of the conditions, reaction volume, and variables of the performed extractions.
Extraction SetupSolid-to-Liquid Ratio *Solvent VolumeConstant ConditionsVariables
Section 2.3Schott Flasks0.045–0.04610 mLPressure:
1 bar
Temperature
{25, 50} °C
Extraction Time
{10, 100, 1000} min
Section 2.4Speed Extractor0.2–0.322 mLExtraction time:
15 min
Temperature
{50, 75, 100} °C
Pressure
{50, 100, 150} bar
No. Cycles
2
Section 2.5Autoclave0.1500 mLPressure:
Vapor pressure of the solvent
Temperature
{50, 75, 100} °C
Extraction Time
{10, 30, 60, 100} min
* Expressed as g of dry hemp per g of solvent.
Table 2. Total extraction yields obtained with Soxhlet extractions of hemp varieties.
Hemp VarietyTotal Extraction Yield
(mg/g of Dry Sample)
CBDTHCCBNCBG
KC Virtus11.51 ± 0.280.37 ± 0.0030.27 ± 0.0040.18 ± 0.01
Finola19.91 ± 0.232.62 ± 0.221.46 ± 0.170.14 ± 0.001
Table 3. Extraction efficiency of the experiments performed in Schott flasks (Section 2.3, Table 1).
Temperature (°C)Time (min)Extraction Efficiency ( ε ) *
CBDTHC
251042.4 ± 5.932.6 ± 8.3
10082.0 ± 0.274.8 ± 1.7
100085.4 ± 0.177.6 ± 0.4
501080.4 ± 2.366.5 ± 2.6
10084.9 ± 1.472.6 ± 0.5
100085.9 ± 0.872.6 ± 4.8
* The efficiencies are expressed as the average value ± the correspondent range from the duplicates.
Table 4. Extraction efficiency of the PLE experiments performed in the speed extractor (Section 2.4, Table 1).
Temperature
(°C)
Pressure
(bar)
Extraction Efficiency ( ε ) *
CBDTHC
Cycle 1Cycle 2Cycle 1Cycle 2
505092.6 ± 2.52.9 ± 0.496.8 ± 2.43.1 ± 1.0
10077.2 ± 2.95.3 ± 0.458.2 ± 0.74.2 ± 0.3
15077.1 ± 2.95.2 ± 0.359.3 ± 3.84.3 ± 0.2
755094.2 ± 0.62.4 ± 0.199.9 ± 3.92.5 ± 0.2
10082.7 ± 2.24.3 ± 0.260.6 ± 0.43.3 ± 0.1
15080.2 ± 2.15.3 ± 0.361.9 ± 1.73.8 ± 0.2
* The efficiencies are expressed as the average value ± the correspondent range from the duplicates.
Table 5. Extraction efficiency of the PLE experiments performed in the 1 L autoclave with hemp variety KC Virtus (Section 2.5, Table 1).
Extraction Time (min)103060100
Temperature (°C)5075100507510050751005075100
Extraction Efficiency ( ε ) *CBD51.0 ± 1.958.3 ± 2.661.7 ± 0.460.0 ± 1.063.9 ± 0.763.5 ± 2.079.8 ± 1.084.3 ± 0.290.2 ± 0.076.6 ± 2.579.6 ± 1.178.2 ± 0.8
THC64.2 ± 2.463.0 ± 0.656.0 ± 3.632.9 ± 0.434.2 ± 0.144.0 ± 0.635.6 ± 1.440.0 ± 0.747.3 ± 0.061.7 ± 1.861.3 ± 0.754.3 ± 0.7
* The efficiencies are expressed as the average value ± the correspondent range from the duplicates.
Table 6. Extraction efficiency of the PLE experiments performed in the 1 L autoclave with hemp variety Finola (Section 2.5, Table 1).
Extraction Time (min)103060100
Temperature (°C)75100751007510075100
Extraction Efficiency ( ε ) *CBD41.2 ± 0.072.9 ± 1.564.4 ± 0.587.1 ± 0.469.2 ± 1.099.3 ± 1.269.9 ± 0.576.0 ± 0.6
THC56.6 ± 0.198.9 ± 8.155.6 ± 0.278.3 ± 3.370.9 ± 4.682.8 ± 1.099.2 ± 1.186.8 ± 0.7
* The efficiencies are expressed as the average value ± the correspondent range from the duplicates.
Publisher’s Note: MDPI stays neutral with regard to jurisdictional claims in published maps and institutional affiliations.