1. Introduction
In the industrial era, the application of motors has been very extensive and versatile and they have become indispensable equipment on the production line. With the increasing dependence on motors, it is important to prevent motor damage or failure without warning caused by defective motor parts, improper installation of motors, harsh operating environments, and improper human operation, which will affect the operation of the factory. Therefore, if the type of fault can be identified before the failure event affects the operation of the factory seriously, and the failure point can be repaired or replaced, the economic loss caused by the factory shutdown can be reduced and accidents in the factory can be prevented.
According to [
1], most motor failures are caused by damage at the bearing, which accounts for 45% of motor failure cases, damage at the stator accounts for 35%, and damage at the rotor accounts for 10%. This paper used motor current signature analysis (MCSA) [
2] on the current signals from healthy motors and three types of motor faults, including: (1) bearing damage motor, (2) stator winding inter-turn short circuit motor, and (3) broken rotor bar motor. The advantages of MCSA are: (1) it is not easily affected by environmental factors such as noises, vibration, and temperature, (2) it can be used for online real-time monitoring, and (3) it can detect the motor status accurately without installing additional sensors. Therefore, this study used MCSA as the main signal analysis.
MCSA is used to observe the change of time or frequency of the motor failure current signal. Therefore, the accuracy of MCSA can be improved by processing signals to increase the frequency resolution. Moreover, fast Fourier transform (FFT) [
3] and wavelet transform (WT) [
4] are the common signal analysis methods. FFT is derived from discrete Fourier transform, the spectrum analyzer converts the time–domain signal to the frequency–domain signal to obtain the signal spectrum instantly, but the FFT signal spectrum will be limited by the lack of timely information and FFT is not enough to know the instantaneous change of the signal, so FFT cannot analyze the time–frequency relationship of the unsteady state and nonlinear signals. WT is extended from Fourier transform. WT uses the appropriate translation and expansion of the mother wavelet to match the signal and observe the local change of characteristics of the signal. Therefore, WT can improve the situation in which the unsteady state signal is difficult to analyze. For motor failure detection, the signal cannot be directly identified by signal analysis only, so it must be classified through a neural network as a classifier for automatic identification.
In recent years, artificial neural networks have been widely used in different fields, such as mechanical operation control, automatic fault detection, and image recognition [
5,
6,
7,
8,
9]. Since the first neural network was proposed in 1940, different types of networks have been developed one after another, such as feedforward neural networks [
10], back propagation (BP) neural networks [
11], and probabilistic neural networks [
12]. The use of different classifiers for various types of issues has different performance, architecture, and classification effects. A BP neural network is a supervised learning network and its recognition ability is higher than unsupervised learning networks. Therefore, this study used a BP neural network as the basic classifier for discussion.
The particle swarm algorithm was first proposed by James Kennedy and Russell Eberhart [
13]. It is a group-based optimization technique. It was originally designed to stylize the activities of birds or fish to simulate society behavior. Through observing the message transmission of foraging, they found that the group provides an evolutionary advantage to social sharing and it was used as a development basis to solve optimization problems. The particle swarm algorithm treats each individual as a volumeless particle in the search space. While the particles are moving, they can adjust the direction of movement according to their own experiences. Because multiple particles in the particle swarm algorithm move at the same time, a particle will not only be affected by itself but also is also affected by learning and memory for the evolution of the group. This feature can provide the experience of itself and other particles, and they are compared with each other to achieve the best solution [
14].
In the particle swarm algorithm originally proposed by Kennedy and Eberhart, the inertia weight was set to a constant, but Zeng through experiments found that dynamic inertia weight can obtain a better optimization result. Therefore, particle swarm optimization with linearly increasing inertia weight was proposed, which can greatly improve the accuracy and convergence speed of the global search [
15,
16].
Based on the above relevant literature, this study uses a three-phase AC power supply to drive a three-phase squirrel cage induction motor to capture the current signal of the input power of any one-phase motor. After the current signal is characterized and normalized, a BP neural network, PSO-BP neural network, and improved PSO-BP neural network are used as the classifier to identify healthy motors, bearing damage motors, stator winding inter-turn short circuit motors, and broken rotor bar motors. In addition, in order to simulate the actual operation of induction motors, white noise of 30 dB, 25 dB and 20 dB is added to the original signal to verify the effectiveness and anti-noise ability of the research method.
2. Signal Analysis Method—Wavelet Transform (WT)
The detection components installed in the motor, such as acceleration transducer, bearing resistance temperature detector (RTD), winding temperature sensor in the stator slot, partial discharge couplers, etc., can immediately control the running status of the unit and can immediately shut down for maintenance when the motor is abnormal.
In the past, when the motor fails, experienced equipment maintenance engineers must make preliminary judgments before repairing the motor. The motor is often affected by the harsh operating environment and the noise interference, which makes maintenance engineers misjudge. Therefore, in recent years, there have been many signal analysis studies on the fault detection of electrical machinery. Common methods include fast Fourier transform by frequency and energy, and wavelet transform by frequency, energy, and time, as a reference for maintenance engineers to determine the types of failure.
Wavelet transform (WT) uses a mother wavelet to do the proper translation and scaling to match the signal which will be decomposed. The theory is extended from Fourier transform and it has the capability of multiple resolution analysis [
17]. WT can be divided into continuous wavelet transform (CWT) and discrete wavelet transform (DWT).
2.1. Continuous Wavelet Transform
WT uses the oscillating waveform of a mother wavelet with finite length or fast attenuation to represent the signal. The mother wavelet has the following characteristics:
Compared to the Fourier transform, CWT can construct the time–frequency signal. CWT lets any function
expanded by mother wavelet
, which is composed of a scaling function and displacement function, shown in (3), and CWT is shown in (4) [
18].
where
is the scaling function,
is the displacement function, and
is the normalization factor.
2.2. Discrete Wavelet Transform
DWT is used to discretize the scaling function
and displacement function
of the mother wavelet, that is, it is limited to a regularly distributed discrete point, thereby reducing the complexity of CWT. Therefore, making (4) discretize, and letting
,
,
, where
,
, and
are all integers,
is defined as a time unit, and it will get the DWT, shown in (5). To consider the conversion efficiency,
and
are usually chosen, which is a dyadic orthonormal wavelet transform [
19].
2.3. Multiple Resolution Analysis
Multiple resolution analysis (MRA) was proposed by Mallat [
20]. The equation is shown in (6). MRA decomposes the original signal into detail coefficients and approximation coefficients with a scaling function
and wavelet function
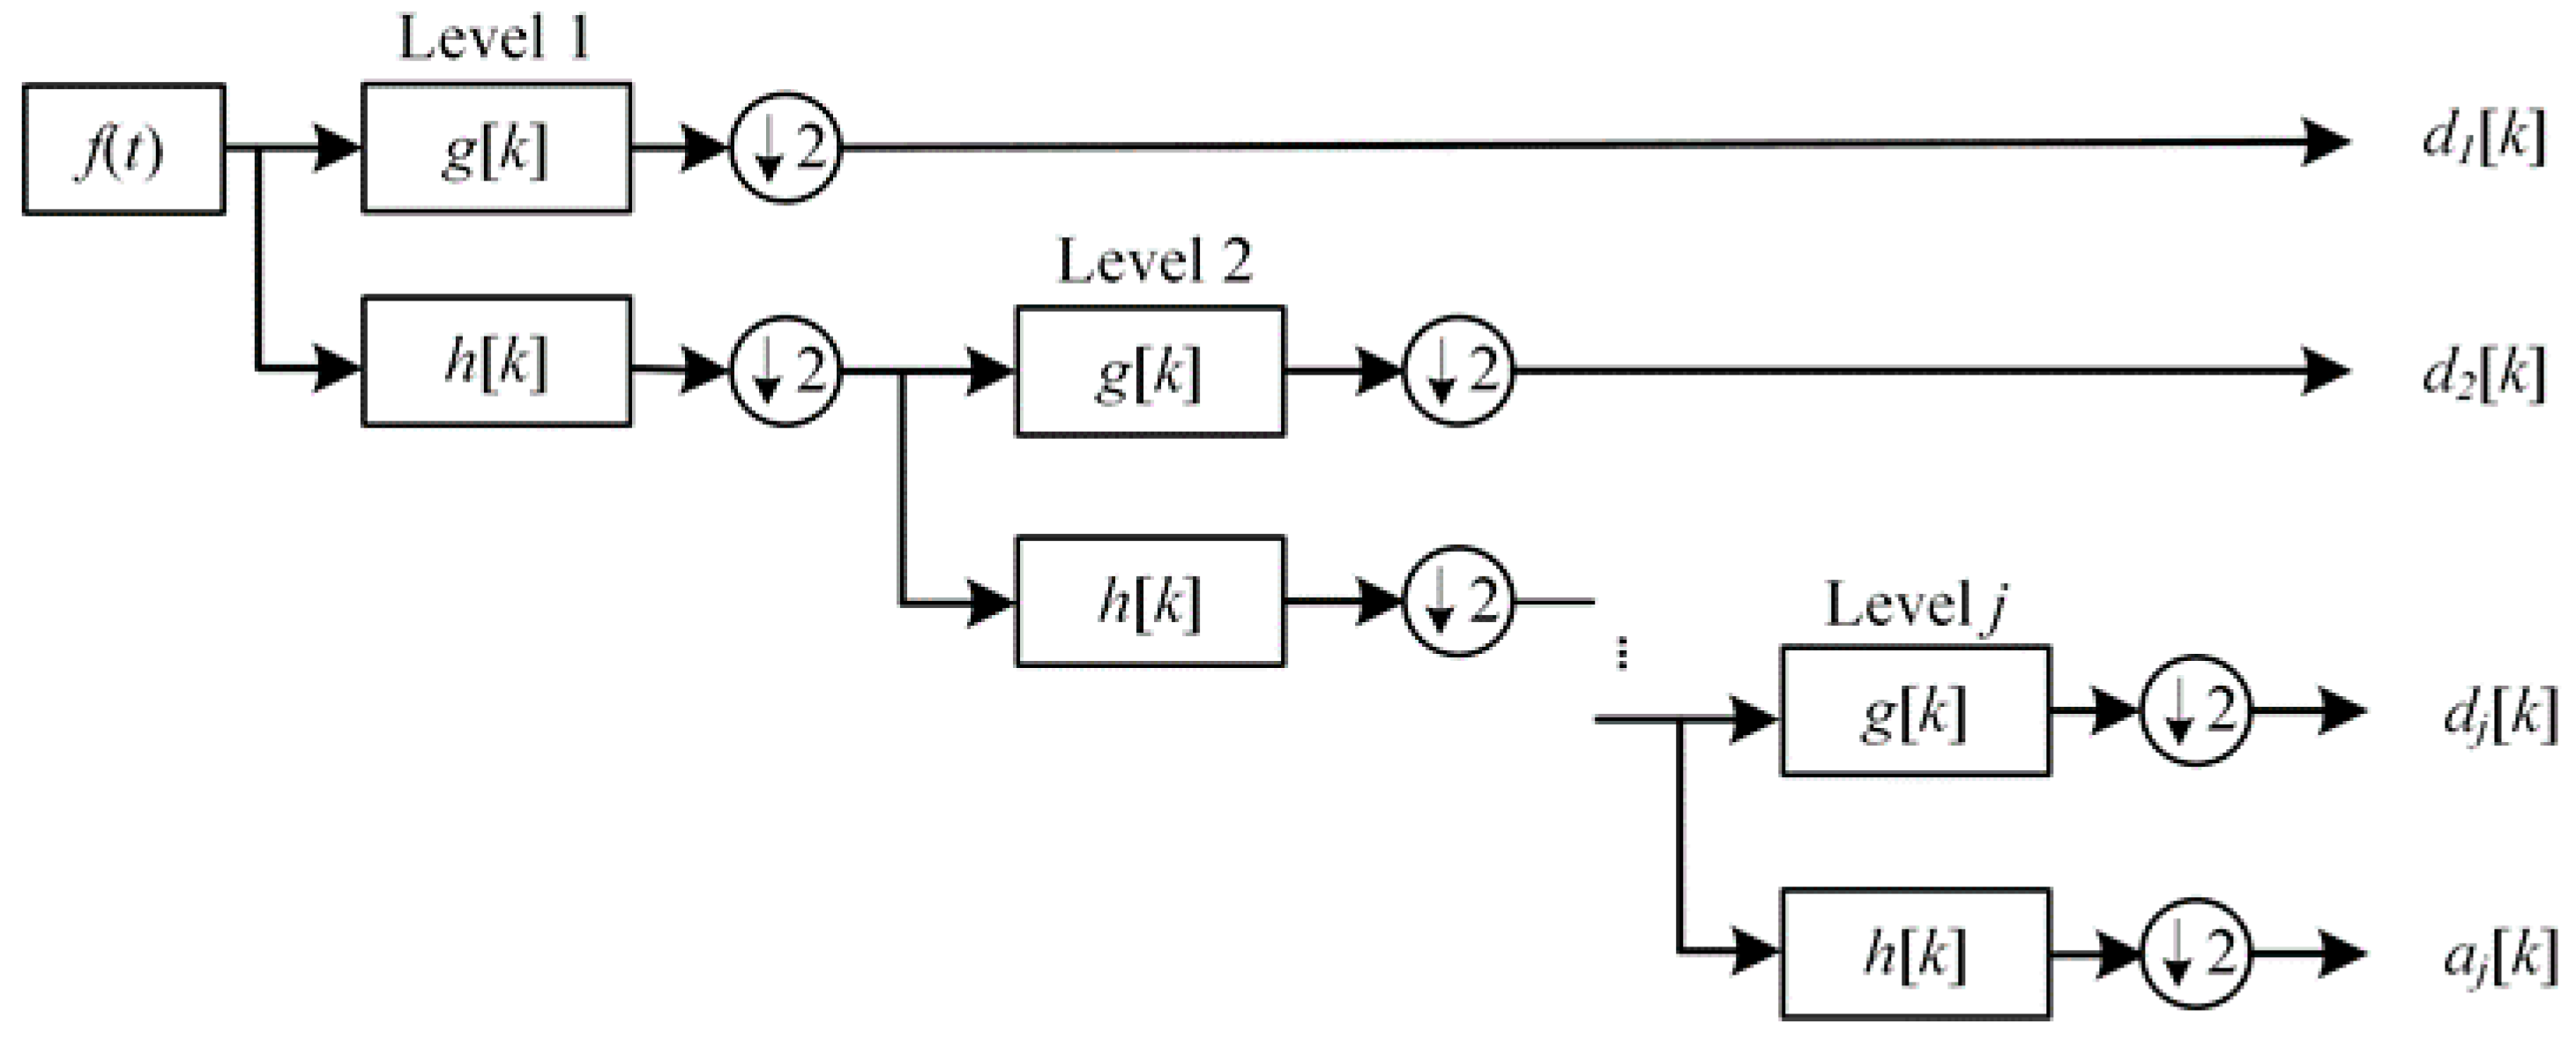
, shown in (7) and (8), and then reconstructed in different resolution layers, where the scaling function can be regarded as a low-pass filter, and the wavelet function can be regarded as a high-pass filter.
where
and
are low-pass and high-pass filter coefficients, respectively. The schematic diagram of MRA is shown in
Figure 1, where
and
are the detail coefficient and approximate coefficient, and↓2 means the bandwidth sampling rate is halved.
3. Optimized Classifier
3.1. PSO Algorithm
PSO is a random search algorithm which is based on observing bird flight and feeding behavior [
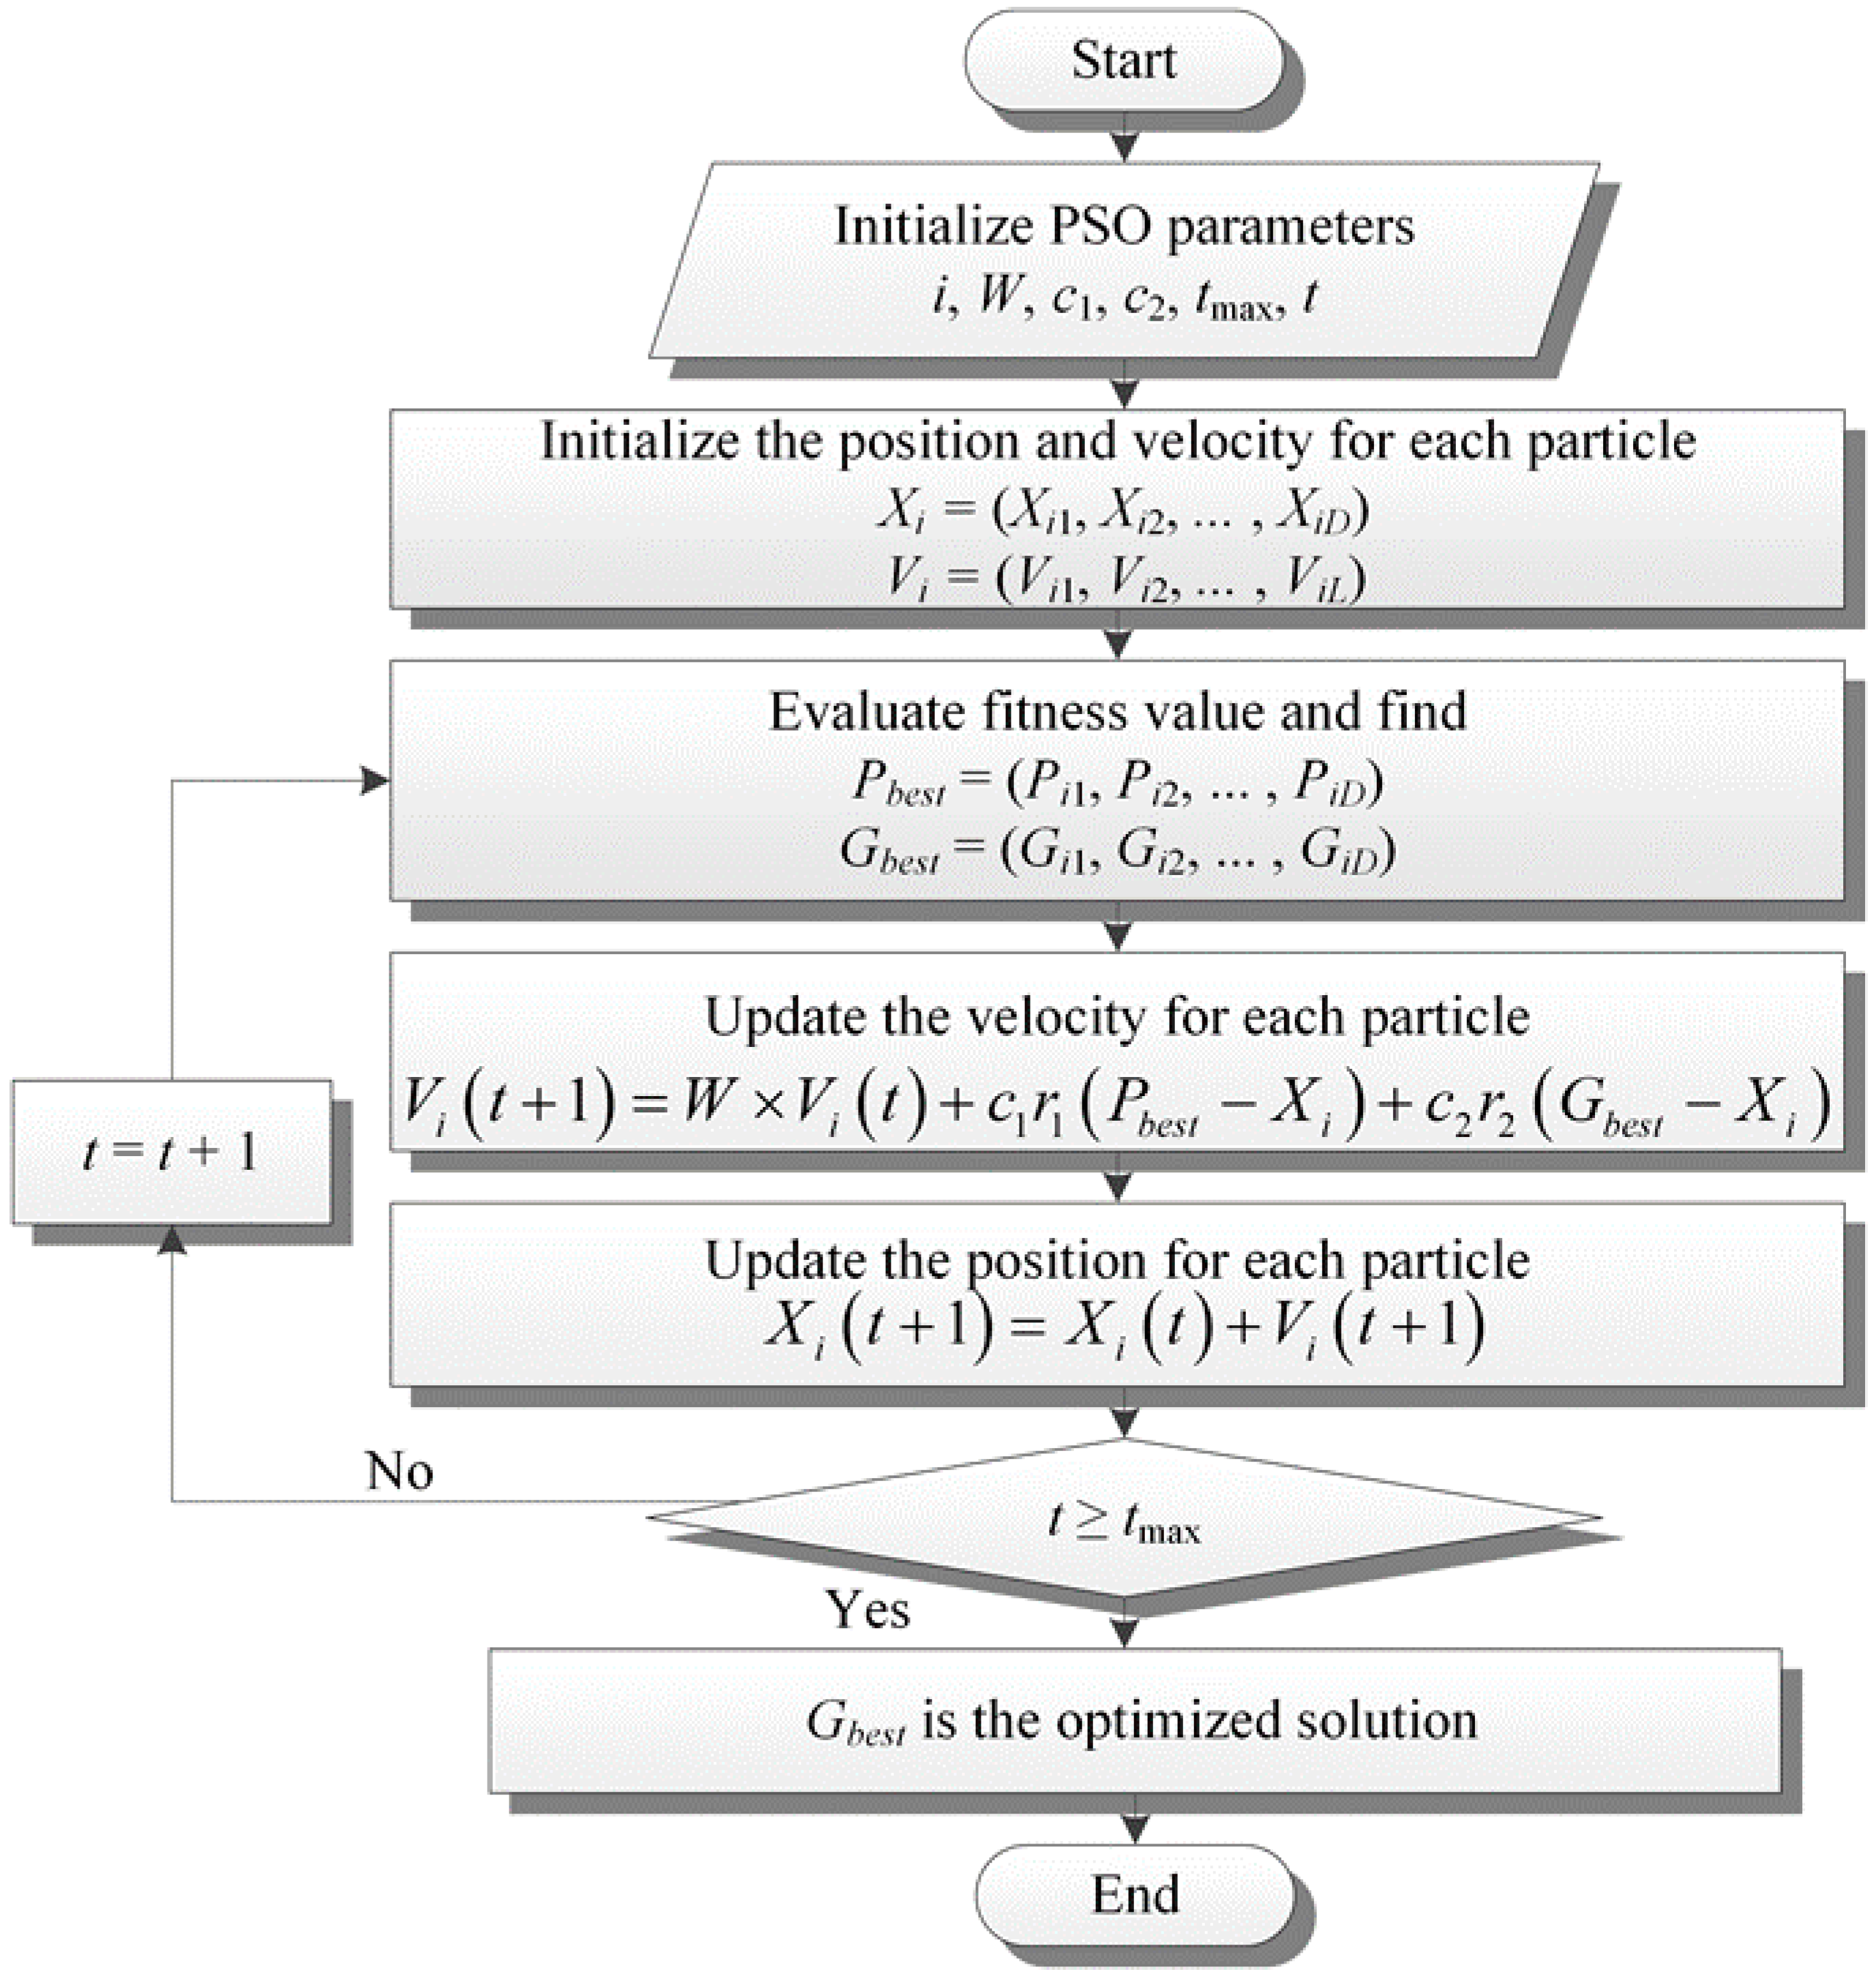
13]. The principle of PSO is to represent the particle in the bird population and assume that the location of each particle is the best potential solution in the optimization problems. Each particle corresponds to a fitness value and their position and velocity will be determined by referring to the best position of personal experience
and the best position of the group’s experience
. The fitness values are recalculated after each position is updated and the velocity and the position will be updated again, with repeated iterations until all particles converge to the optimum solution. The flow chart of the PSO algorithm is shown in
Figure 2.
- Step 1:
Initialize the number of particles , number of iterations , maximum number of iterations , inertia weight , and acceleration factor and .
- Step 2:
Assume the position of each particle and the velocity of each particle in space.
- Step 3:
Evaluate the fitness value of all particles and obtain the best personal solution and the best group solution .
- Step 4:
Use and to correct the velocity of each particle .
- Step 5:
Correct the position of each particle .
- Step 6:
Repeat Step 3 to Step 5 until .
- Step 7:
The optimized position can be obtained.
3.2. Improved PSO Algorithm
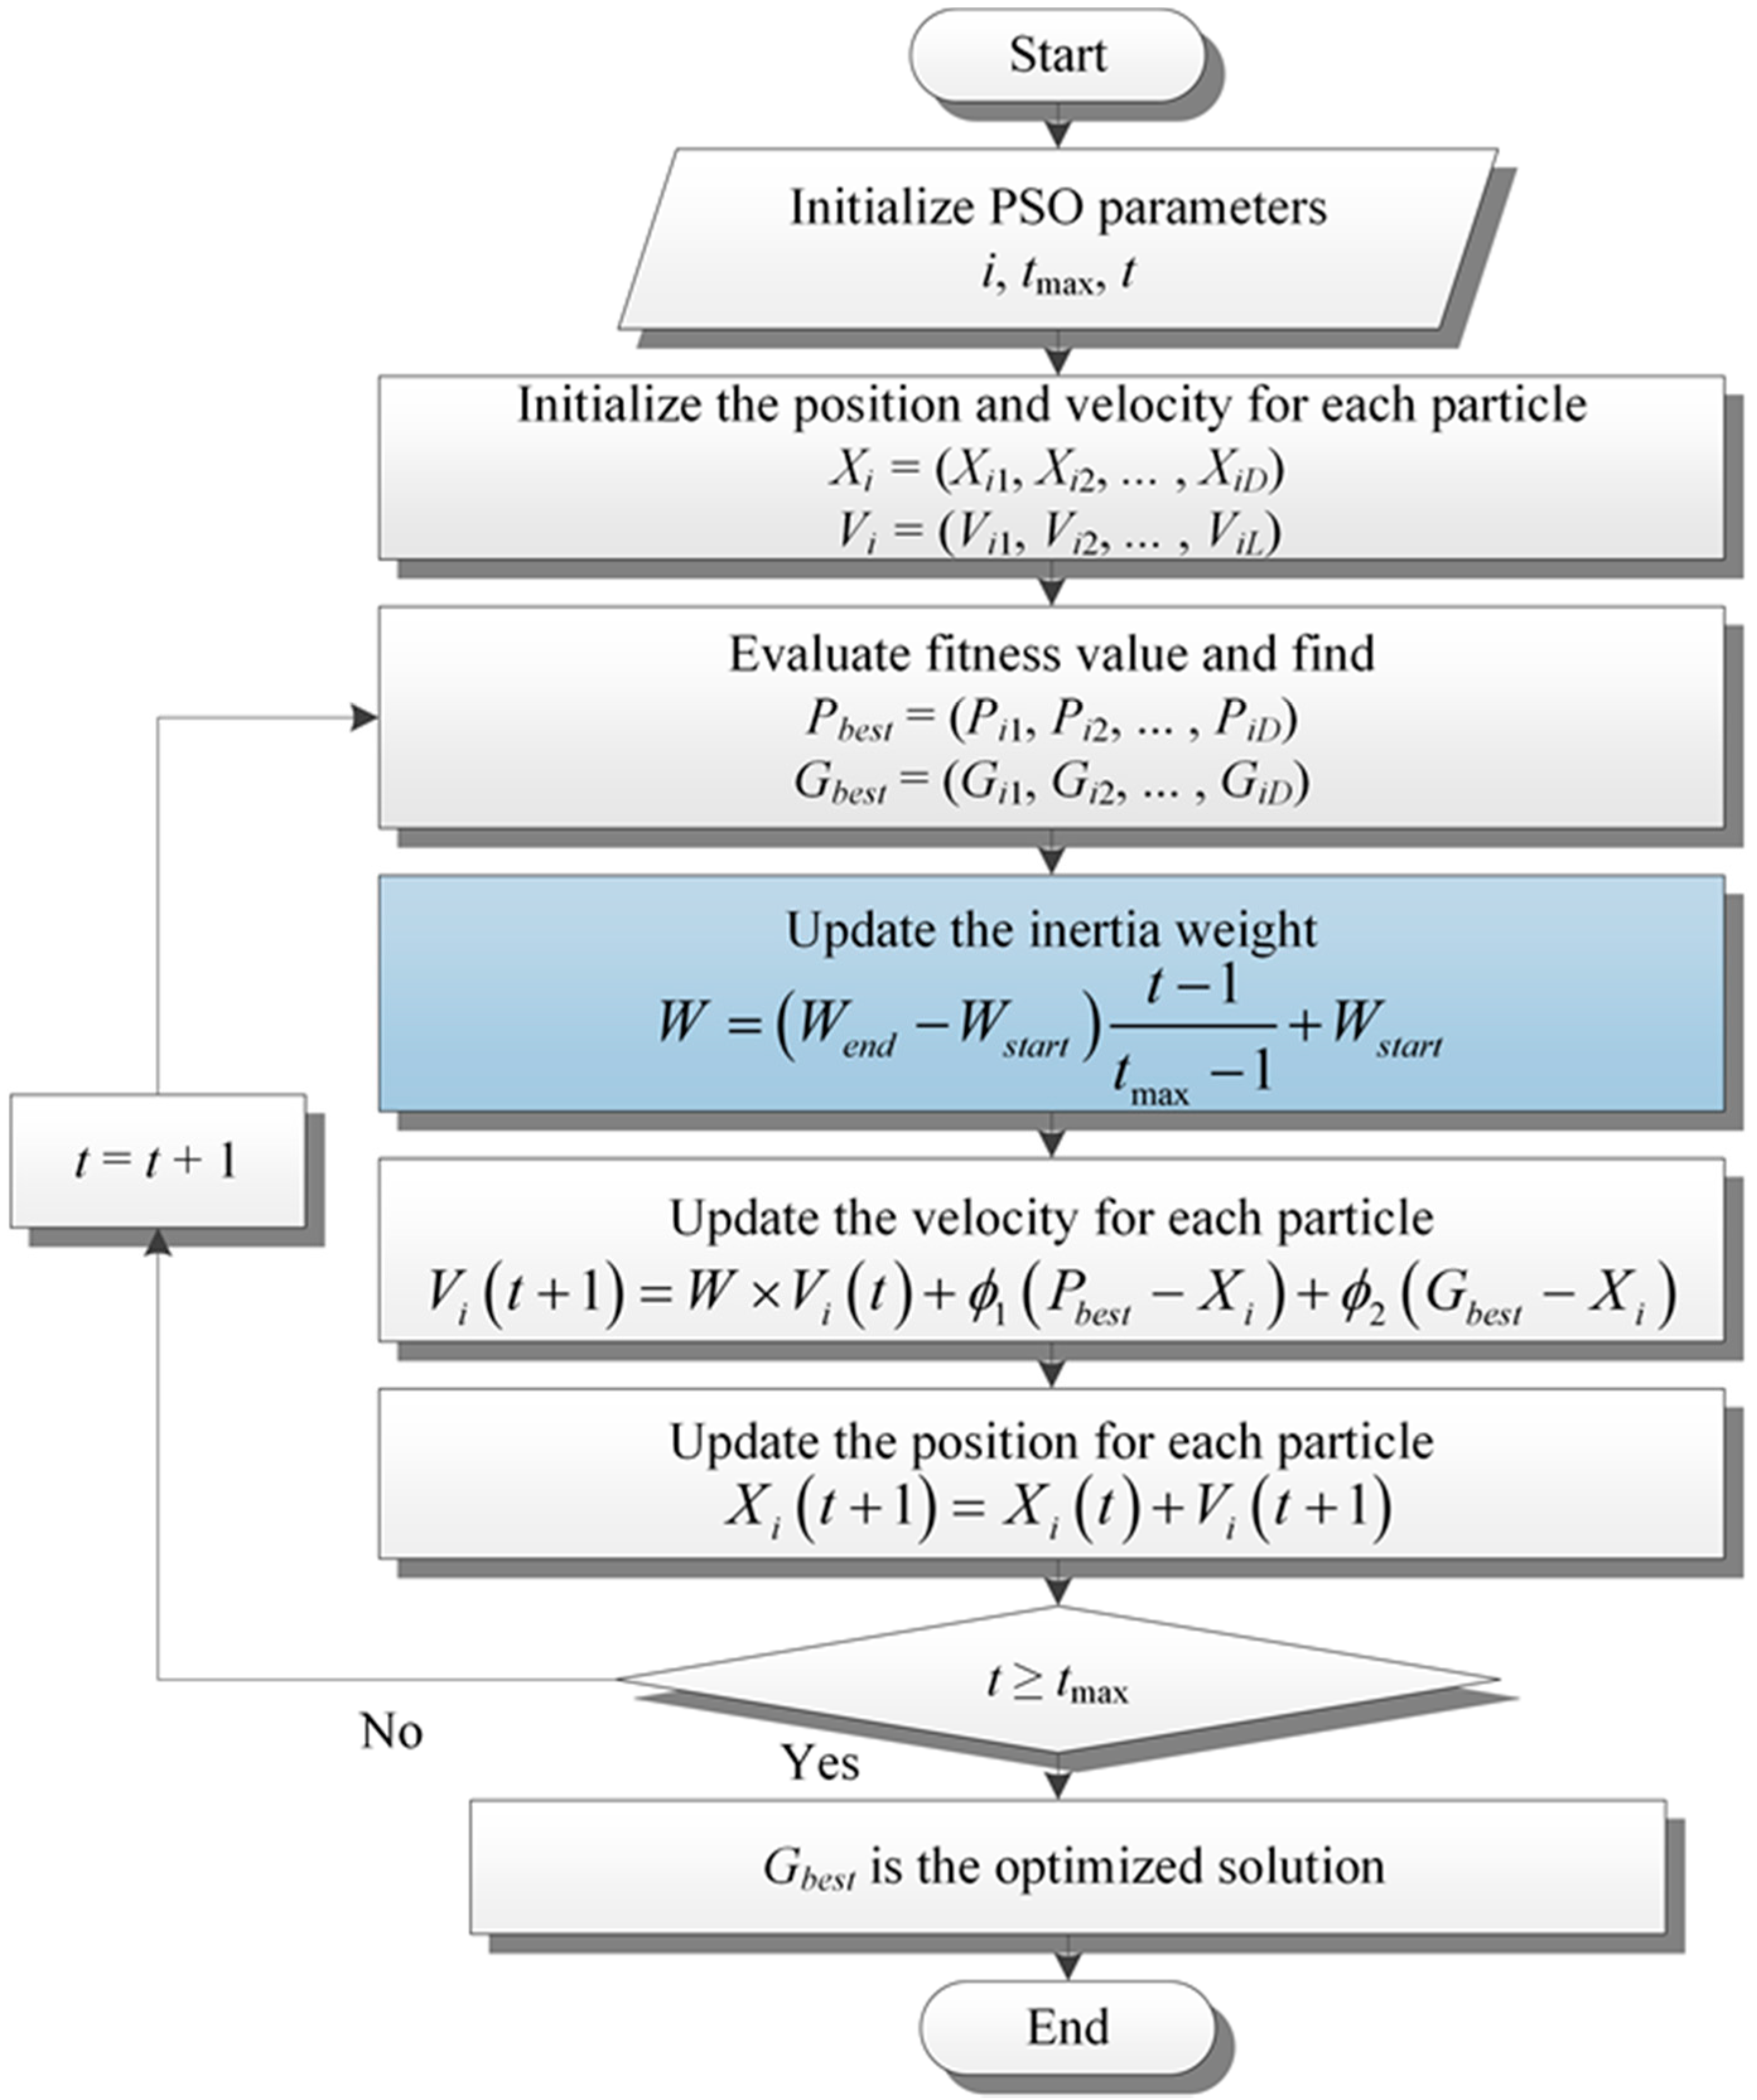
Improved particle swarm optimization which has the linearly increasing inertia weight was proposed in 2003 by Zheng et al. They believed that setting the inertia weight as a constant would limit the diversity of the algorithm. Therefore, it was proposed to change the dynamic factor of the inertia weight by the number of iterations. The velocity and the position of particles using a linearly increasing inertia weight are shown in Equations (9) and (10). The inertia weight
w is set to linearly increase from 0.4 to 0.9, shown in (11). Acceleration factors
and
are between (0.5, 2),
and
are the constant value 1.5, while
and
are the random numbers evenly distributed at (0, 1),
and
are 0.5, shown in (12). The flow chart of the improved PSO algorithm is shown in
Figure 3.
- Step 1:
Initialize the number of particles , number of iterations , maximum number of iterations .
- Step 2:
Assume the position of each particle and the velocity of each particle in space.
- Step 3:
Evaluate the fitness value of all particles and obtain the best personal solution and the best group solution .
- Step 4:
Update the inertia weight W.
- Step 5:
Use and to correct the velocity of each particle .
- Step 6:
Correct the position of each particle .
- Step 7:
Repeat Step 3 to Step 6 until .
- Step 8:
The optimized position can be obtained.
3.3. Improved PSO-BP Neural Network
The BP neural network is constructed as multilayer feedforward neural network, which contains input layers, hidden layers, and output layers. Each layer is connected by weight, bias, and activation function, and is not connected by neurons in the same layers, as shown in
Figure 4. BP neural network computing can be divided into the feedforward propagation and the back propagation. In the feedforward propagation, the input signal of features is transferred from the input layer to the output layer. In the back propagation, the weight and the bias of the network are adjusted by the error between the output and expected values. After iteration, the output value can be close to the expected value and thus have the capability of self-learning. The fast self-learning and high accuracy in the BP neural network are suitable for fault classification and image recognition, so this study uses BP neural network (BPNN) as the basic classifier.
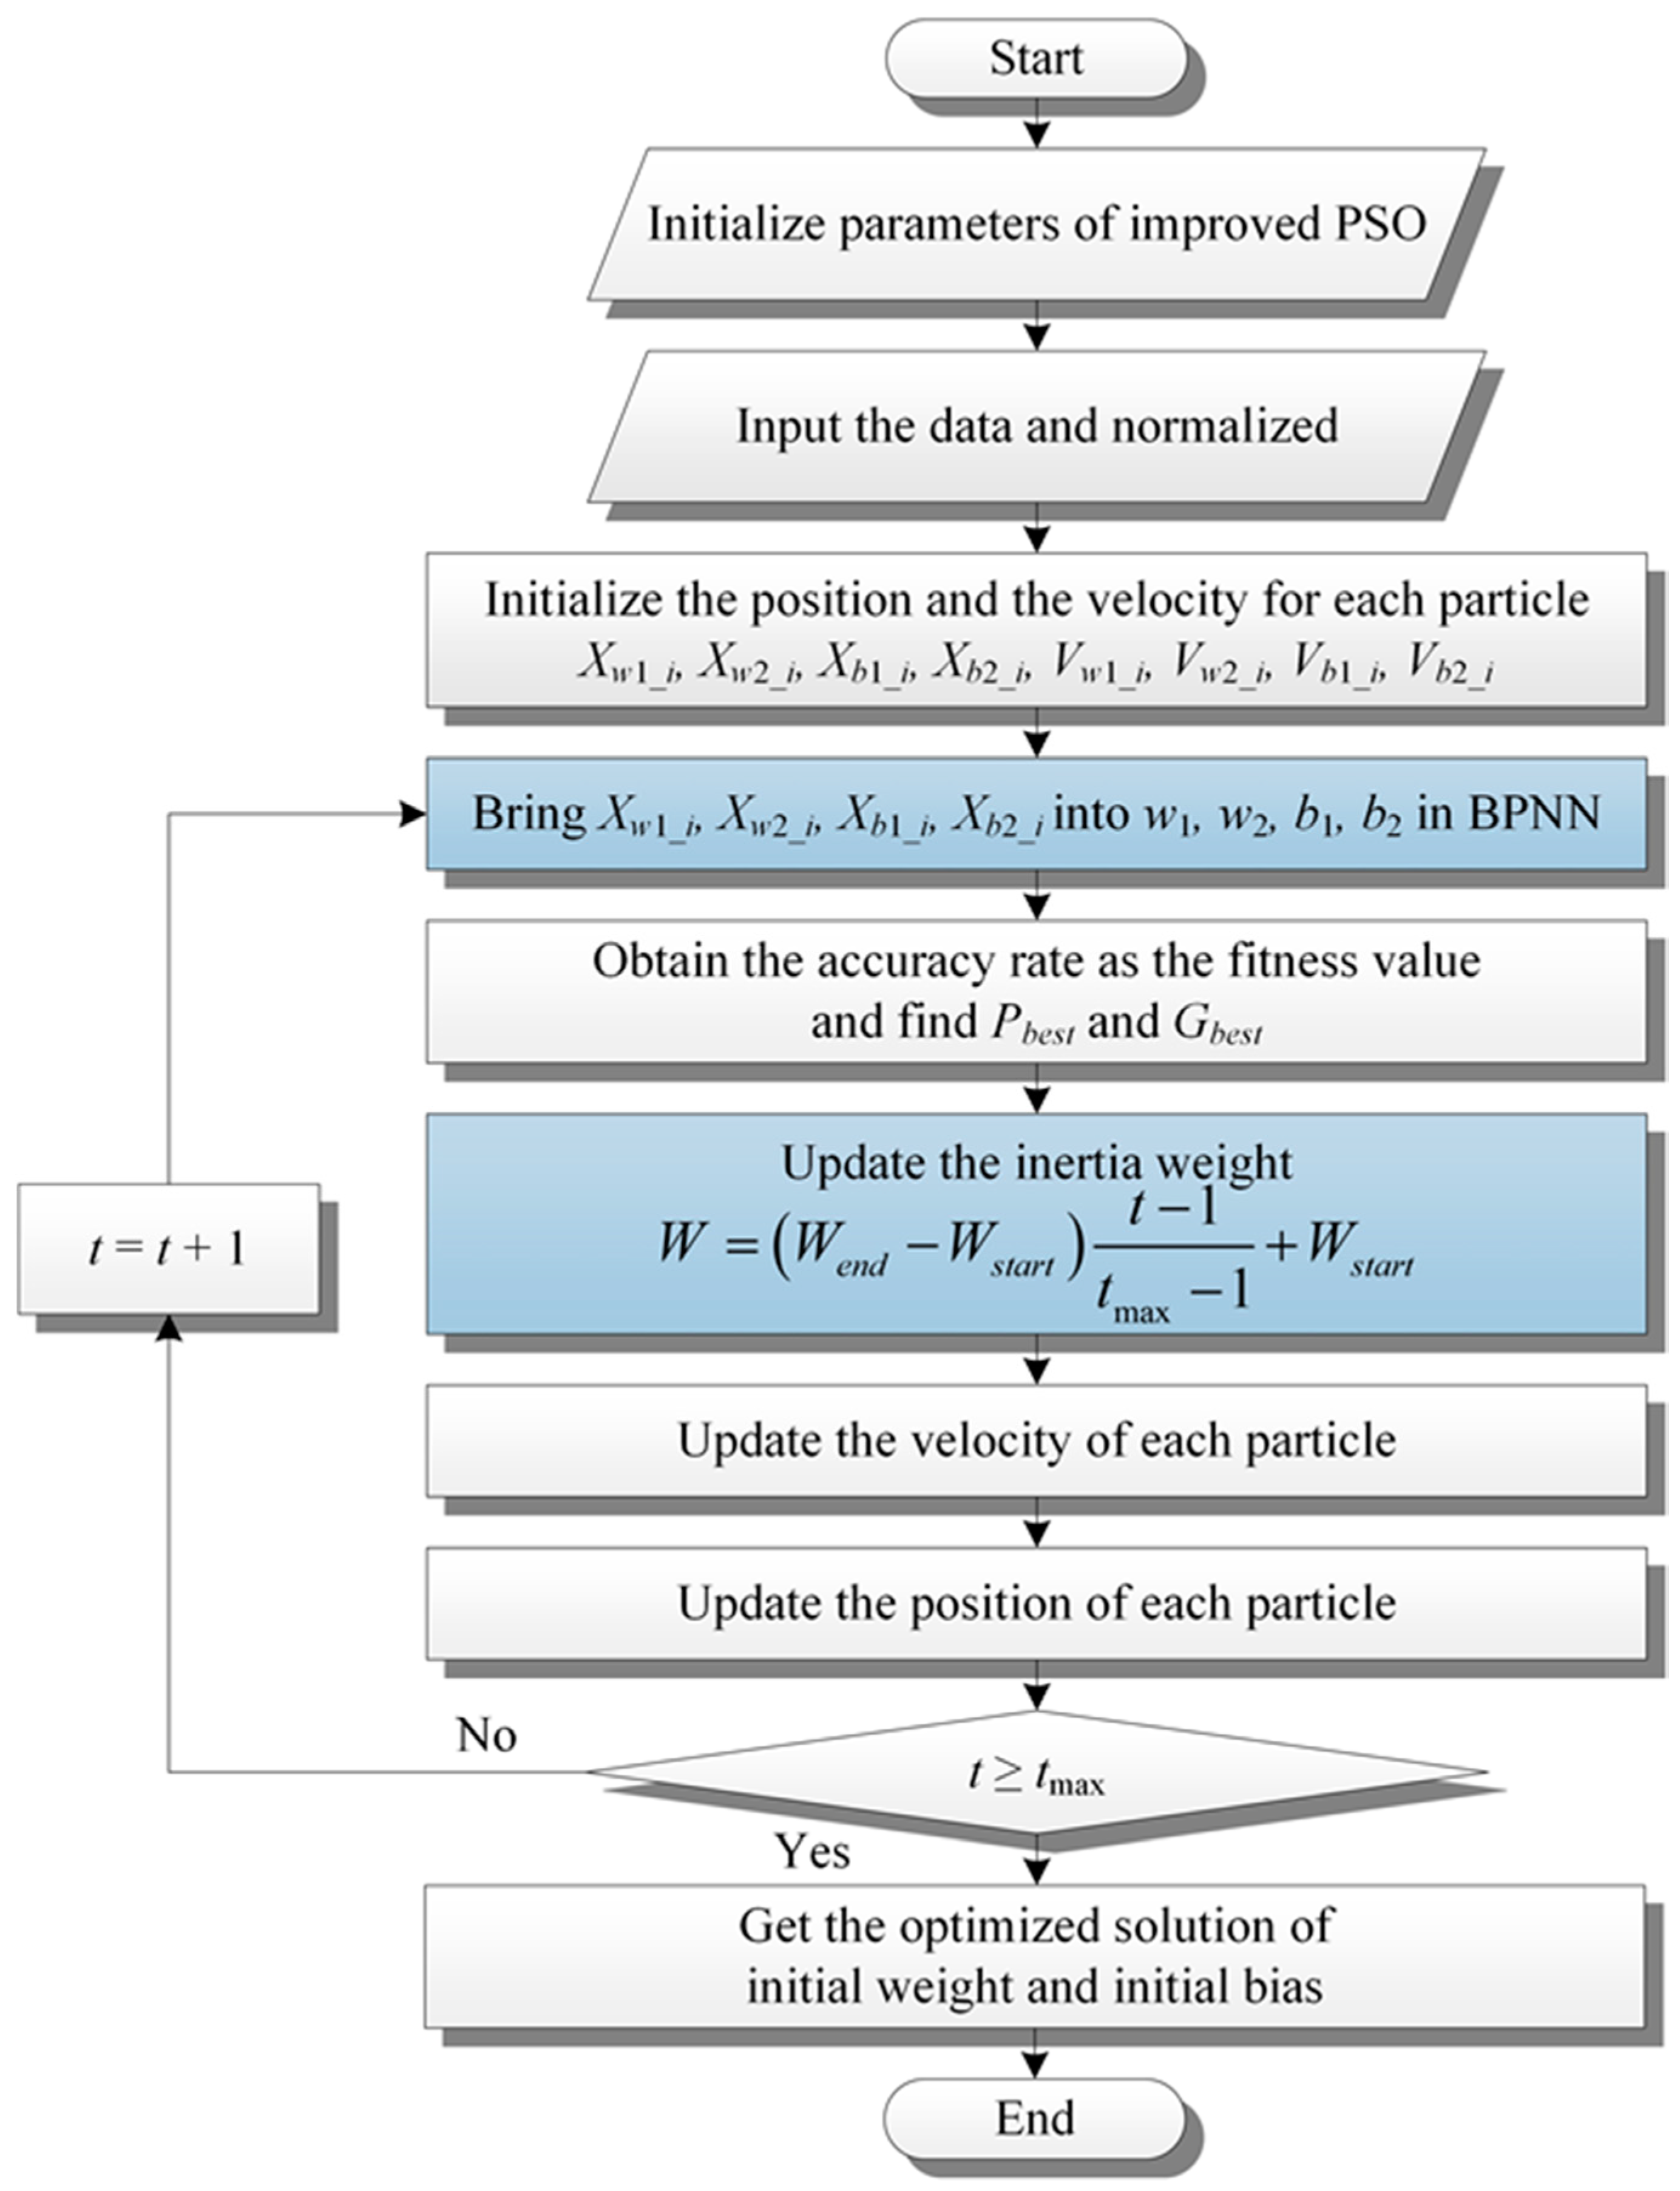
However, traditional a BP neural network is not adequate enough for classification. Thus, in order to increase the classification, two optimization algorithms were used to optimize the classification result. The proposed improved PSO-BP neural network is combined with an improved PSO algorithm and BP neural network. Four parameters,
,
,
,
, in the BP neural network are optimized using an improved PSO algorithm and better accuracy will be obtained after classification. The flow chart of the improved PSO-BP neural network is shown in
Figure 5.
- Step 1:
Initialize the number of particles , number of iterations , maximum of iterations .
- Step 2:
The features are input and normalized.
- Step 3:
Assume the position of each particle , , , and the velocity of each particle , , , in space.
- Step 4:
Put the position , , , into the parameter of the BP neural network , , , .
- Step 5:
Evaluate the fitness value of all particles and obtain the best personal solution , , , and the best group solution , , , .
- Step 6:
Update the inertia weight .
- Step 7:
Use , , and to correct the velocity of each particle.
- Step 8:
Correct the position of each particle.
- Step 9:
Repeat Step 3 to Step 8 until .
- Step 10:
The optimized position and the best accuracy can be obtained.
4. Experiment and Analysis
The three-phase induction motors can convert electrical energy into mechanical energy and then produce kinetic energy. Therefore, motors are widely used in industry, replacing traditional engine systems and are becoming important equipment for driving production lines. The state of the motor is one of the keys to the normal operation of the production line. Whether it is a defect in the production process or a loss in operation, it may cause noise or overheating problems in the motor during operation. Three common defects, namely bearing damage, stator winding inter-turn short circuit, and broken rotor bars, are studied in this paper and manual failure points are processed using new induction motors.
4.1. Experimental Equipment and Architecture
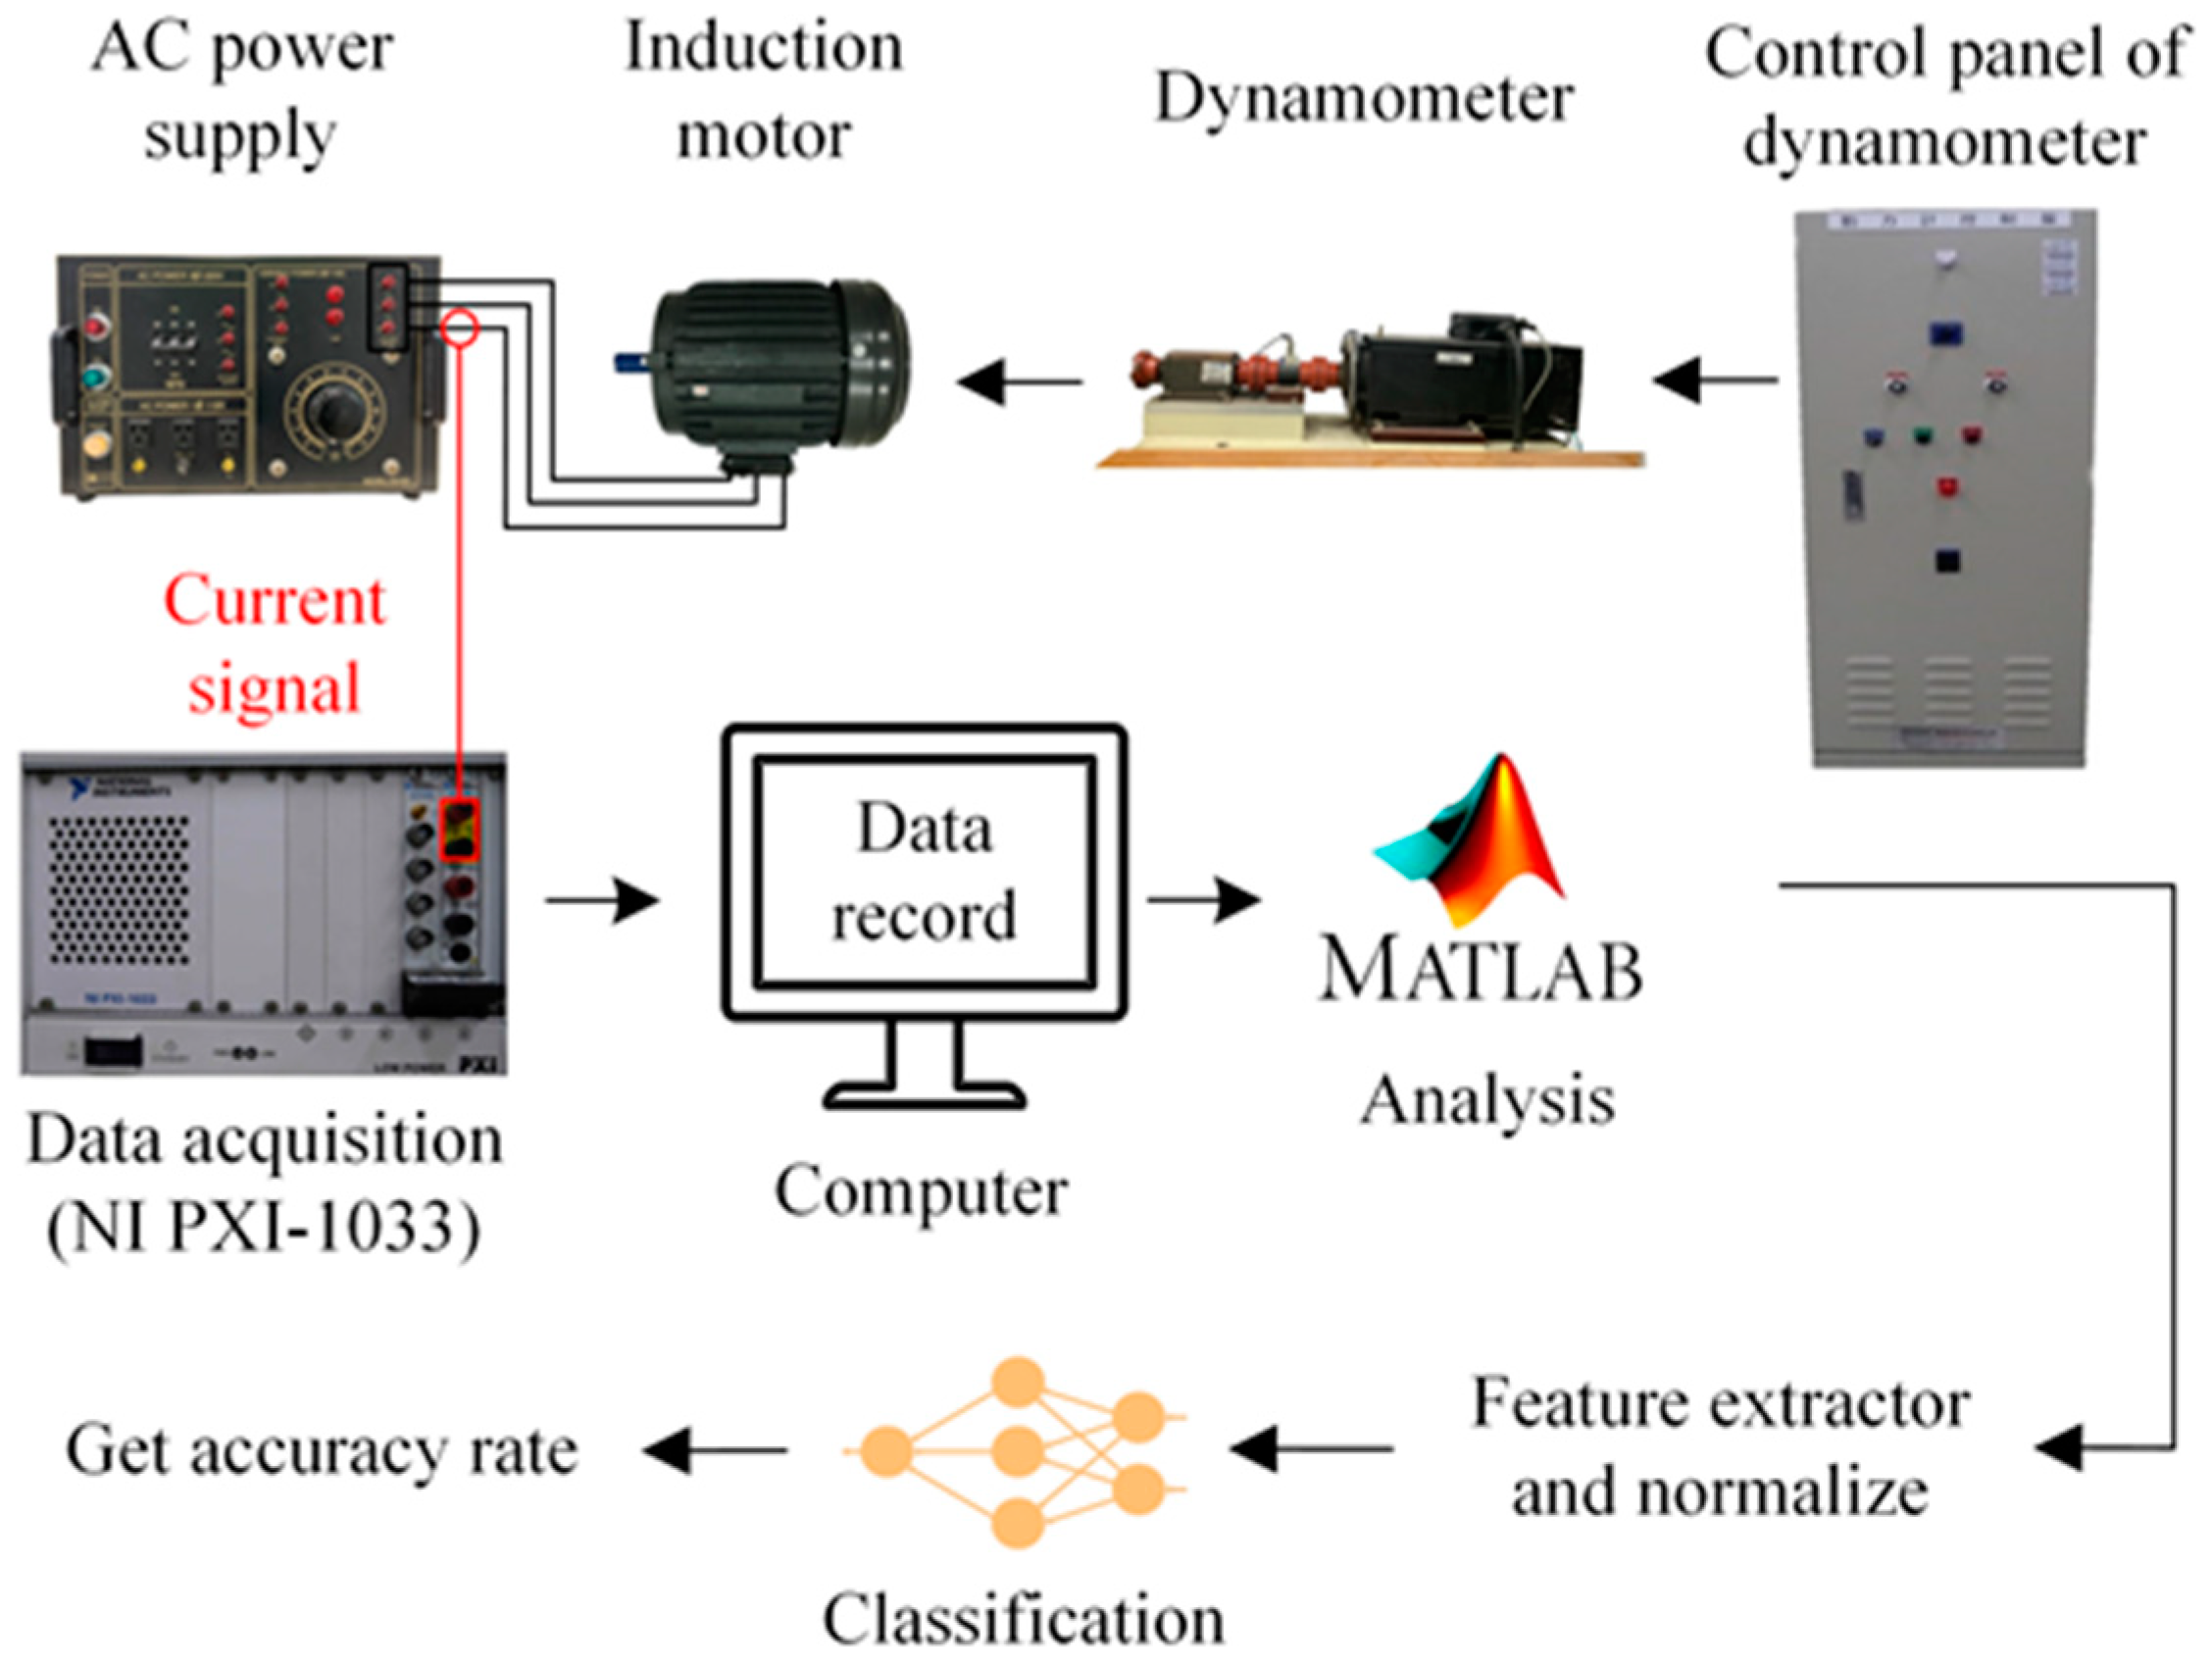
This research used the three-phase squirrel cage induction motor (60 Hz/1.5 kW/1764 rpm) which is driven by an AC power supply. The dynamometer generates torque which is opposite to the motor steering as a load. The analog acquisition card (ExpressCard-8360) of the signal extractor (NI PXI-1033) is used to extract the current signal of any phase of the input power of the induction motor and the data are stored in a computer.
The frequency of signal capture is 1000 Hz and the measurement length of the current signals separately for healthy motors, bearing damage, stator winding inter-turn short circuit, and broken rotor bars is 2000 milliseconds for each motor measurement, and then features are extracted after wavelet transform. PSO and improved PSO are used to optimize parameters of the BPNN and the accuracy rate is obtained by the BPNN. The schematic diagram of the experimental structure is shown in
Figure 6.
4.2. Sample of Induction Motor Failure
The three-phase squirrel cage induction motor is used in this experiment. The specification of induction motor is shown in
Table 1. The fault samples are healthy, bearing damage, stator winding inter-turn short circuit, and broken rotor bar. The details of the failure point of each sample are described below.
4.2.1. Bearing Damage
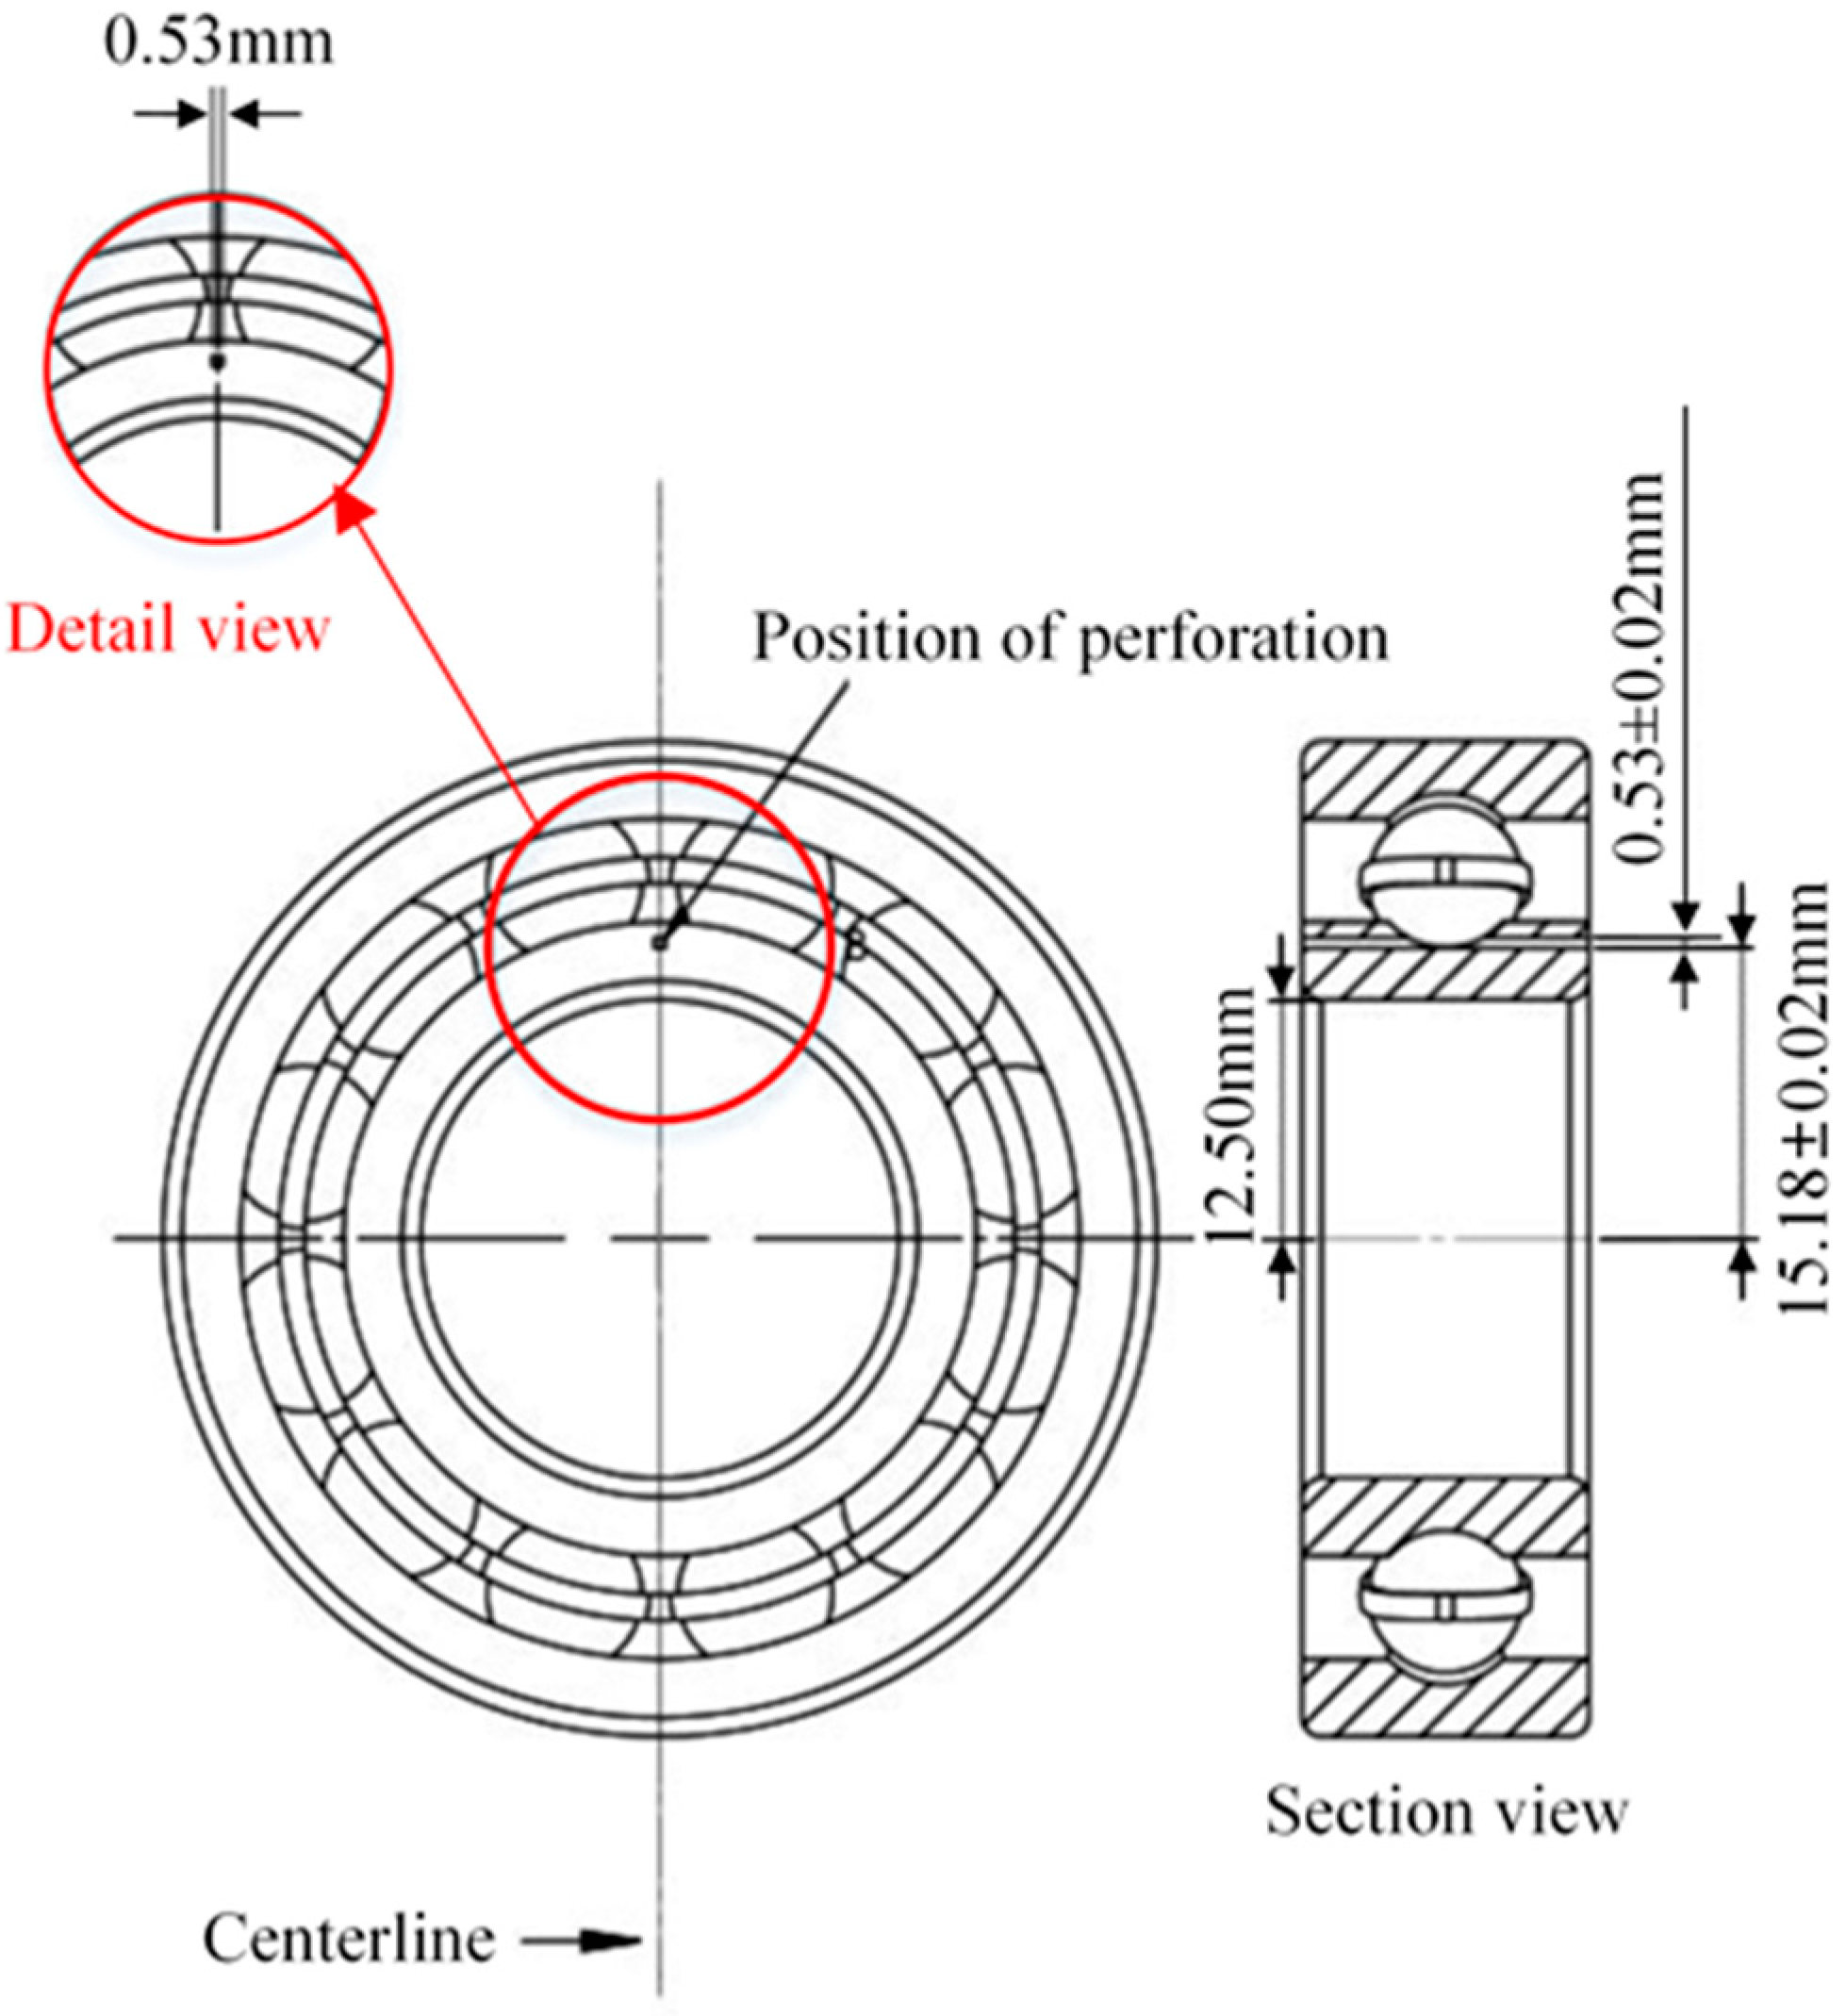
According to [
1], failures caused by damage to bearings accounts for 45% of motor failure cases. The common failure types are inner ring displacement, raceway depression and bearing deformation. Inner ring displacement is caused by the loss or deterioration of lubricating fluid due to uneven force or prolonged use. Raceway depression is caused by foreign matter intrusion on the raceway due to poor sealing of the casing. Bearing deformation is caused by excessive connection load. In this study, the bearing inner ring of the motor shaft is subjected to discharge machining, with a 0.53 mm perforation to simulate the failure of the raceway of the inner ring due to foreign matter, as shown in
Figure 7.
4.2.2. Stator Winding Inter-Turn Short Circuit
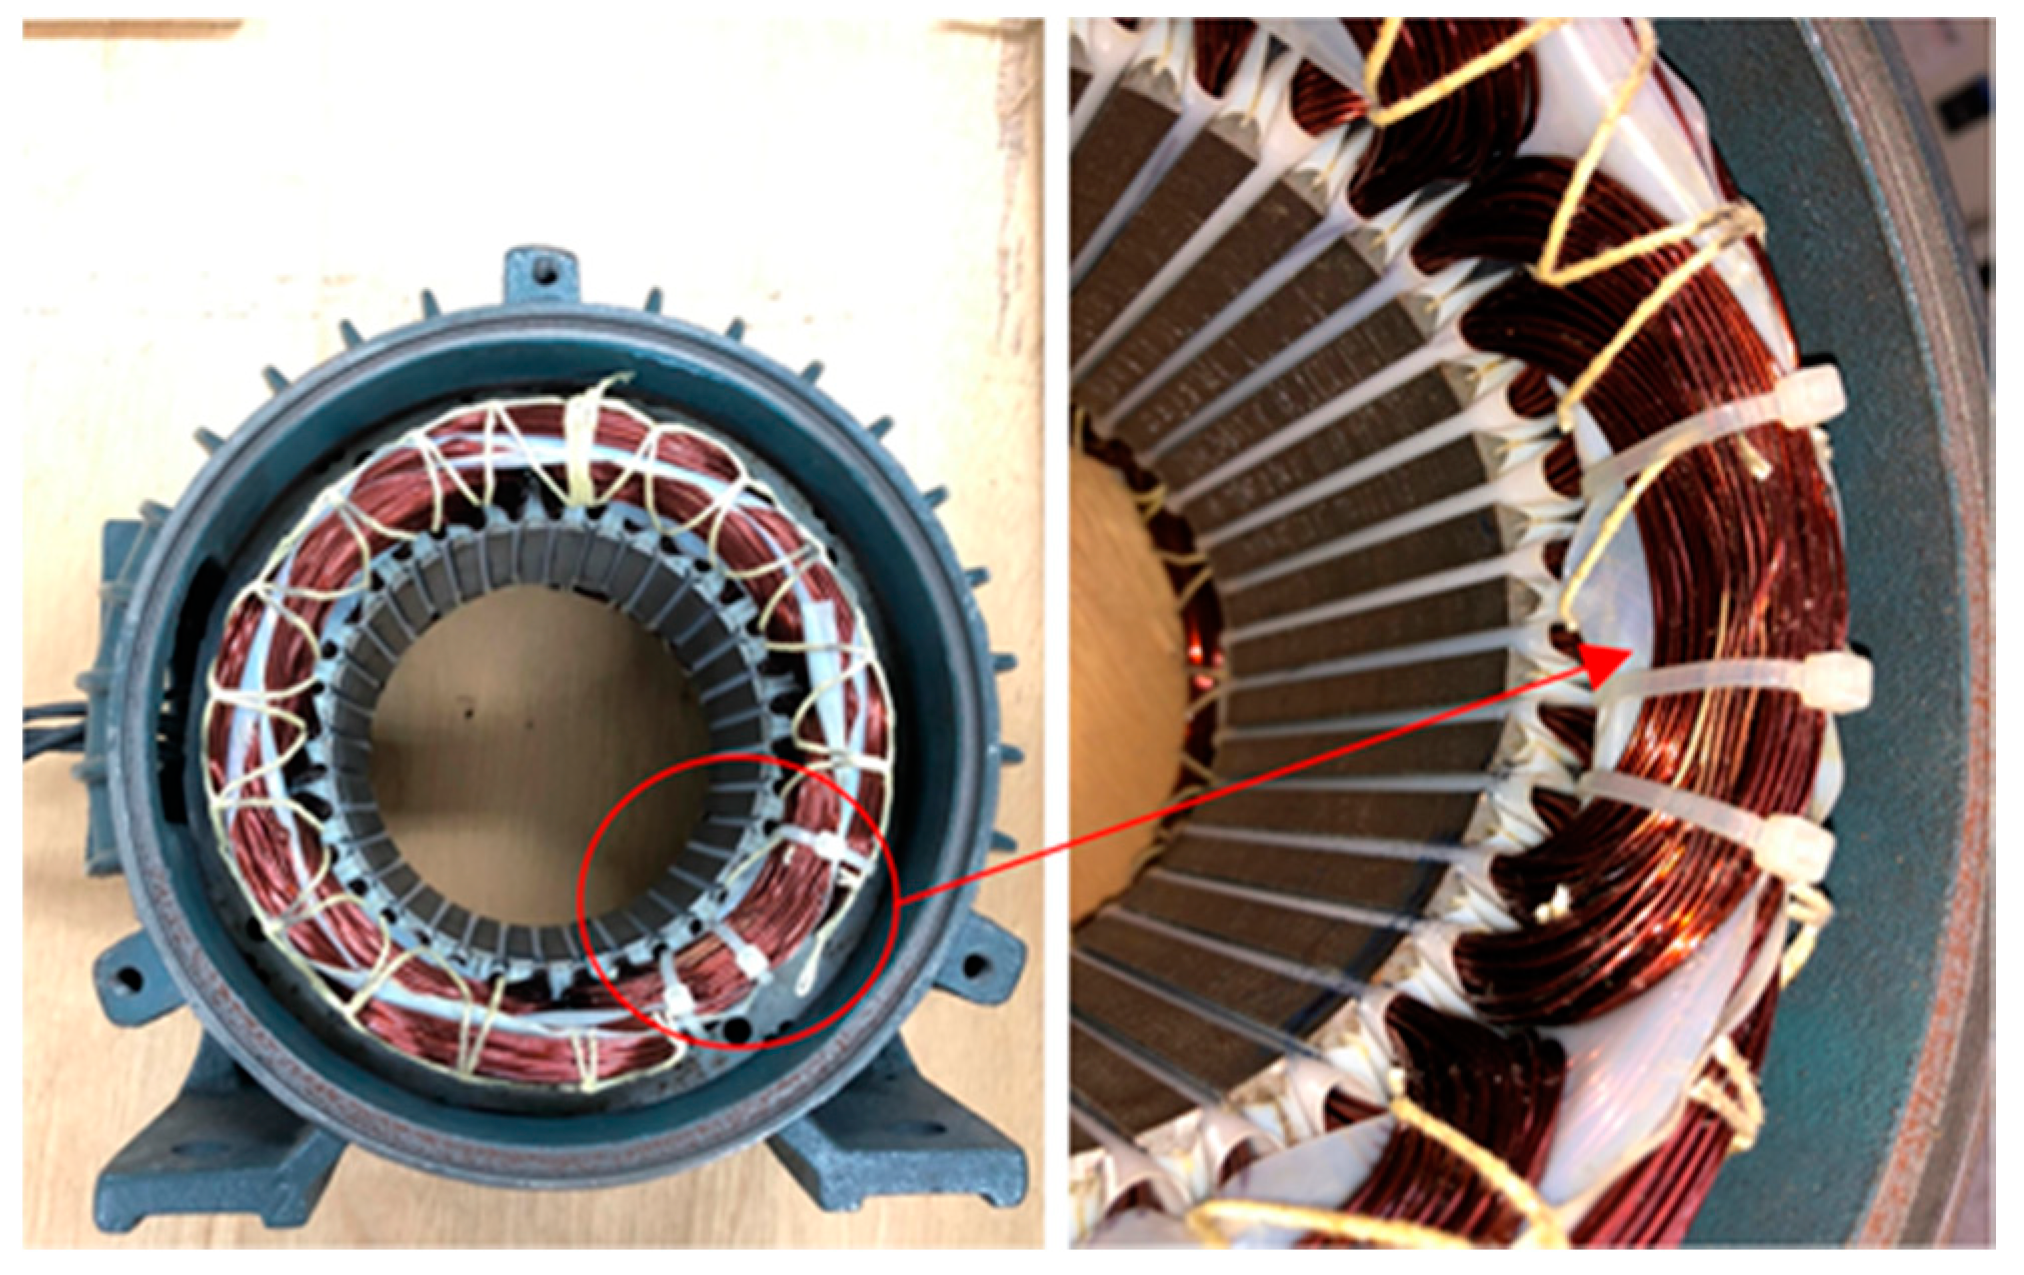
The failure is caused by damage to the stator accounts for 35% of motor failure cases. The main failure type is stator coil insulation failure. The insulation damage of the stator coil is caused by: (1) uneven coating of insulating paint in the production process; (2) accelerated aging of insulating paint due to prolonged operation; (3) poor insulation performance due to rotor or foreign matter abrasion; (4) excessive punching of the input voltage case insulation protection of the coil, causing stator winding inter-turn short circuit. In this study, two sets of insulated coils were damaged to simulate the stator winding inter-turn short circuit, shown in
Figure 8.
4.2.3. Broken Rotor Bar
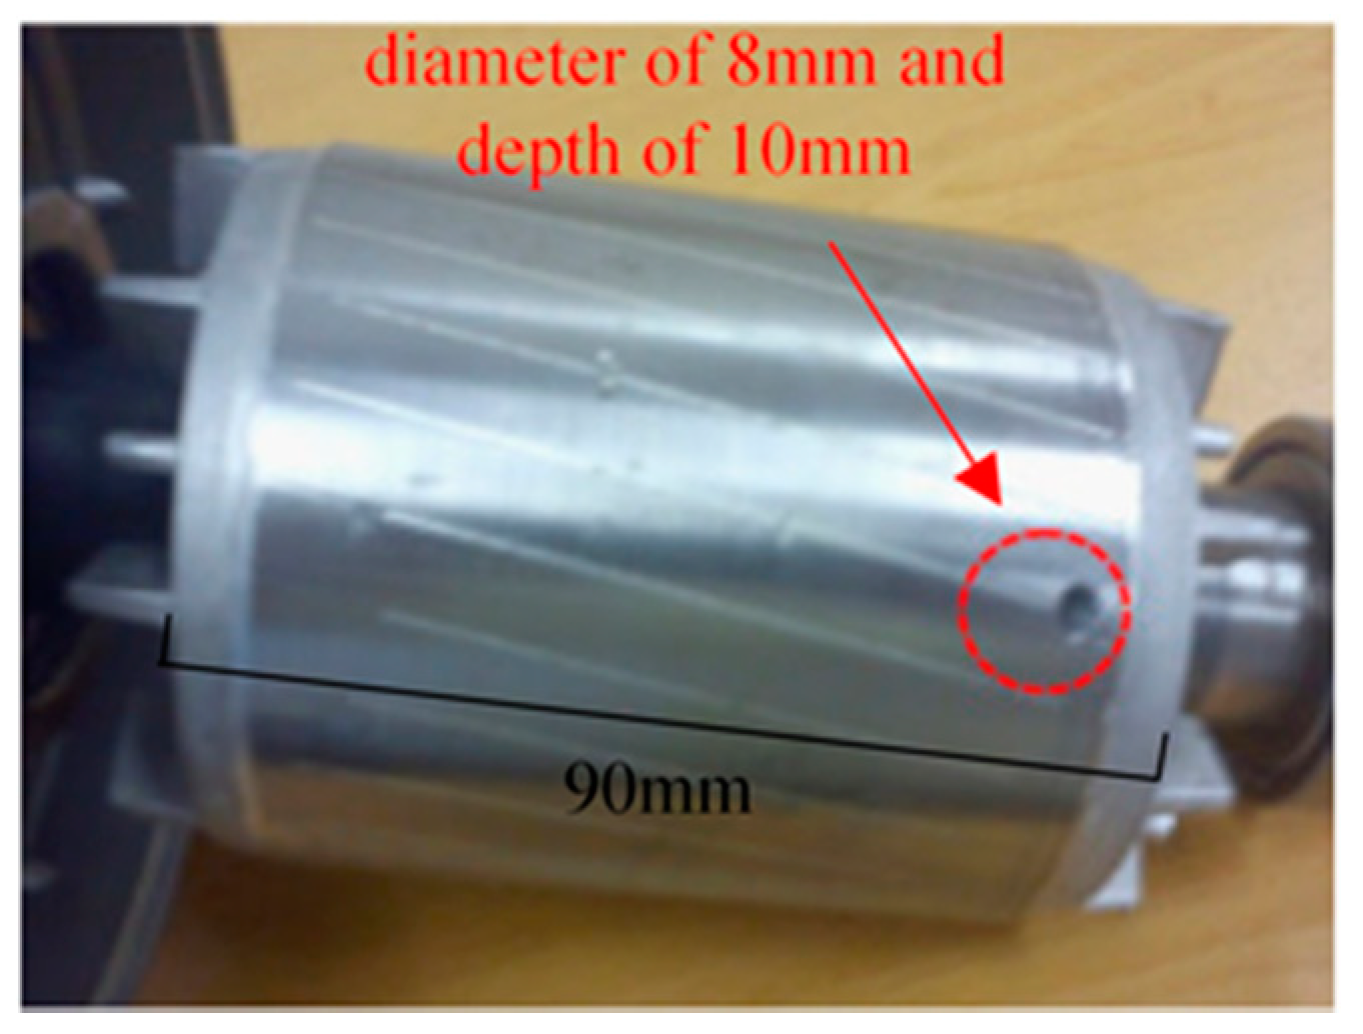
Failure is caused by damage to the rotor accounts for 10% of motor failure cases. The common failure types are broken rotor bar and rotor shaft deviation. The broken rotor bar is caused by external forces or high temperature expansion. The rotor shaft deviation is caused by an improper assembly process or poor bearings which cause rotor drift. In this study, the broken rotor bar of a squirrel cage motor was identified and analyzed. After disassembling the squirrel cage induction motor, the rotor was taken out and a perforation with a diameter of 8 mm and a depth of 10 mm was drilled to simulate the broken rotor bar due to external force or high temperature, as shown in the red circle in
Figure 9.
4.3. Signal Measurement and Result Analysis
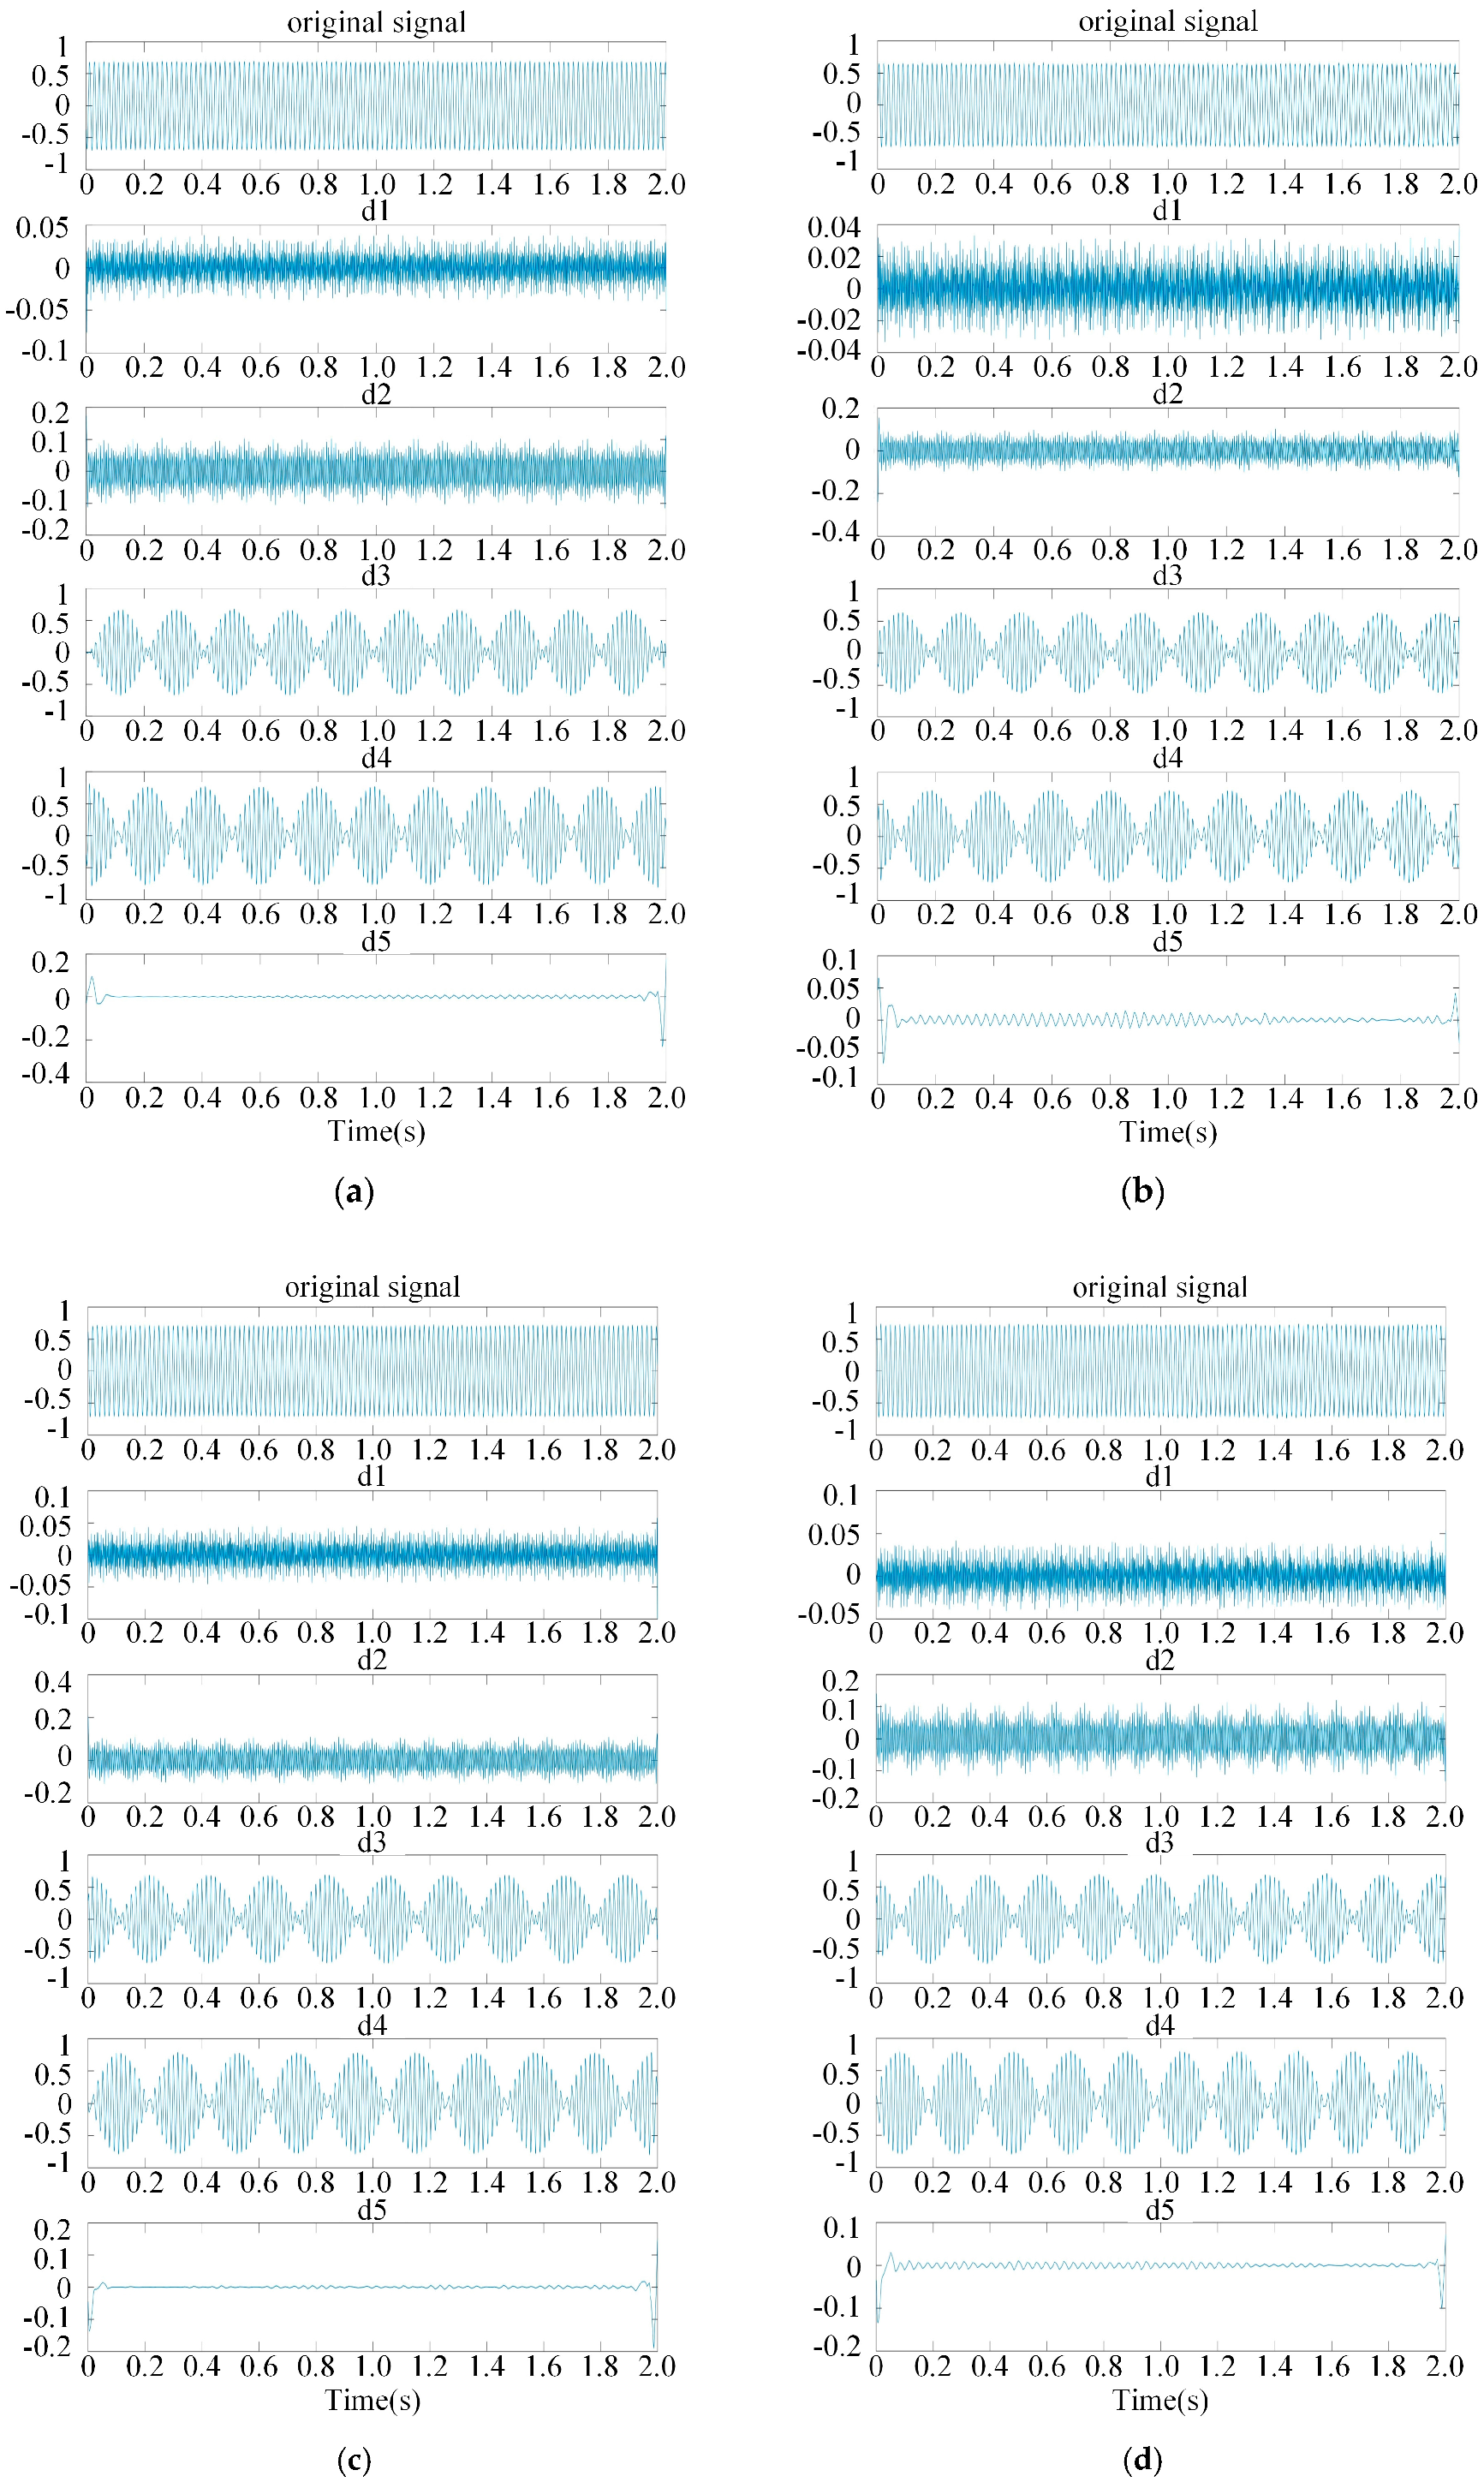
The current signals of induction motors are analyzed using wavelet MRA. Signal measurements and results for the healthy motor, bearing damage, stator winding inter-turn short circuit, and broken rotor bar are shown as
Figure 10. After repeating MRA five times, the induction motor stator current signal can obtain six decomposition signals, a5, d5, d4, d3, d2, and d1. The waveform, vibration, and frequency of each sample current signal are similar. Therefore, the fault type cannot be identified directly.
5. Feature Extraction and Classification Result
5.1. Features of the Induction Motor Signals
First, the current signals of three-phase squirrel cage induction motors were recorded by the signal extractor (NI PXI-1033) and 100 data points were measured for each motor. Secondly, this paper uses MATLAB to do wavelet MRA and the features of the analyzed signal are extracted, and the feature values are maximum, minimum, average, mean square error, and standard deviation. Finally, 200 feature values are brought to the classifier for training. The other 200 feature values are used as test data and then calculate the accuracy rate.
5.1.1. Feature Extraction
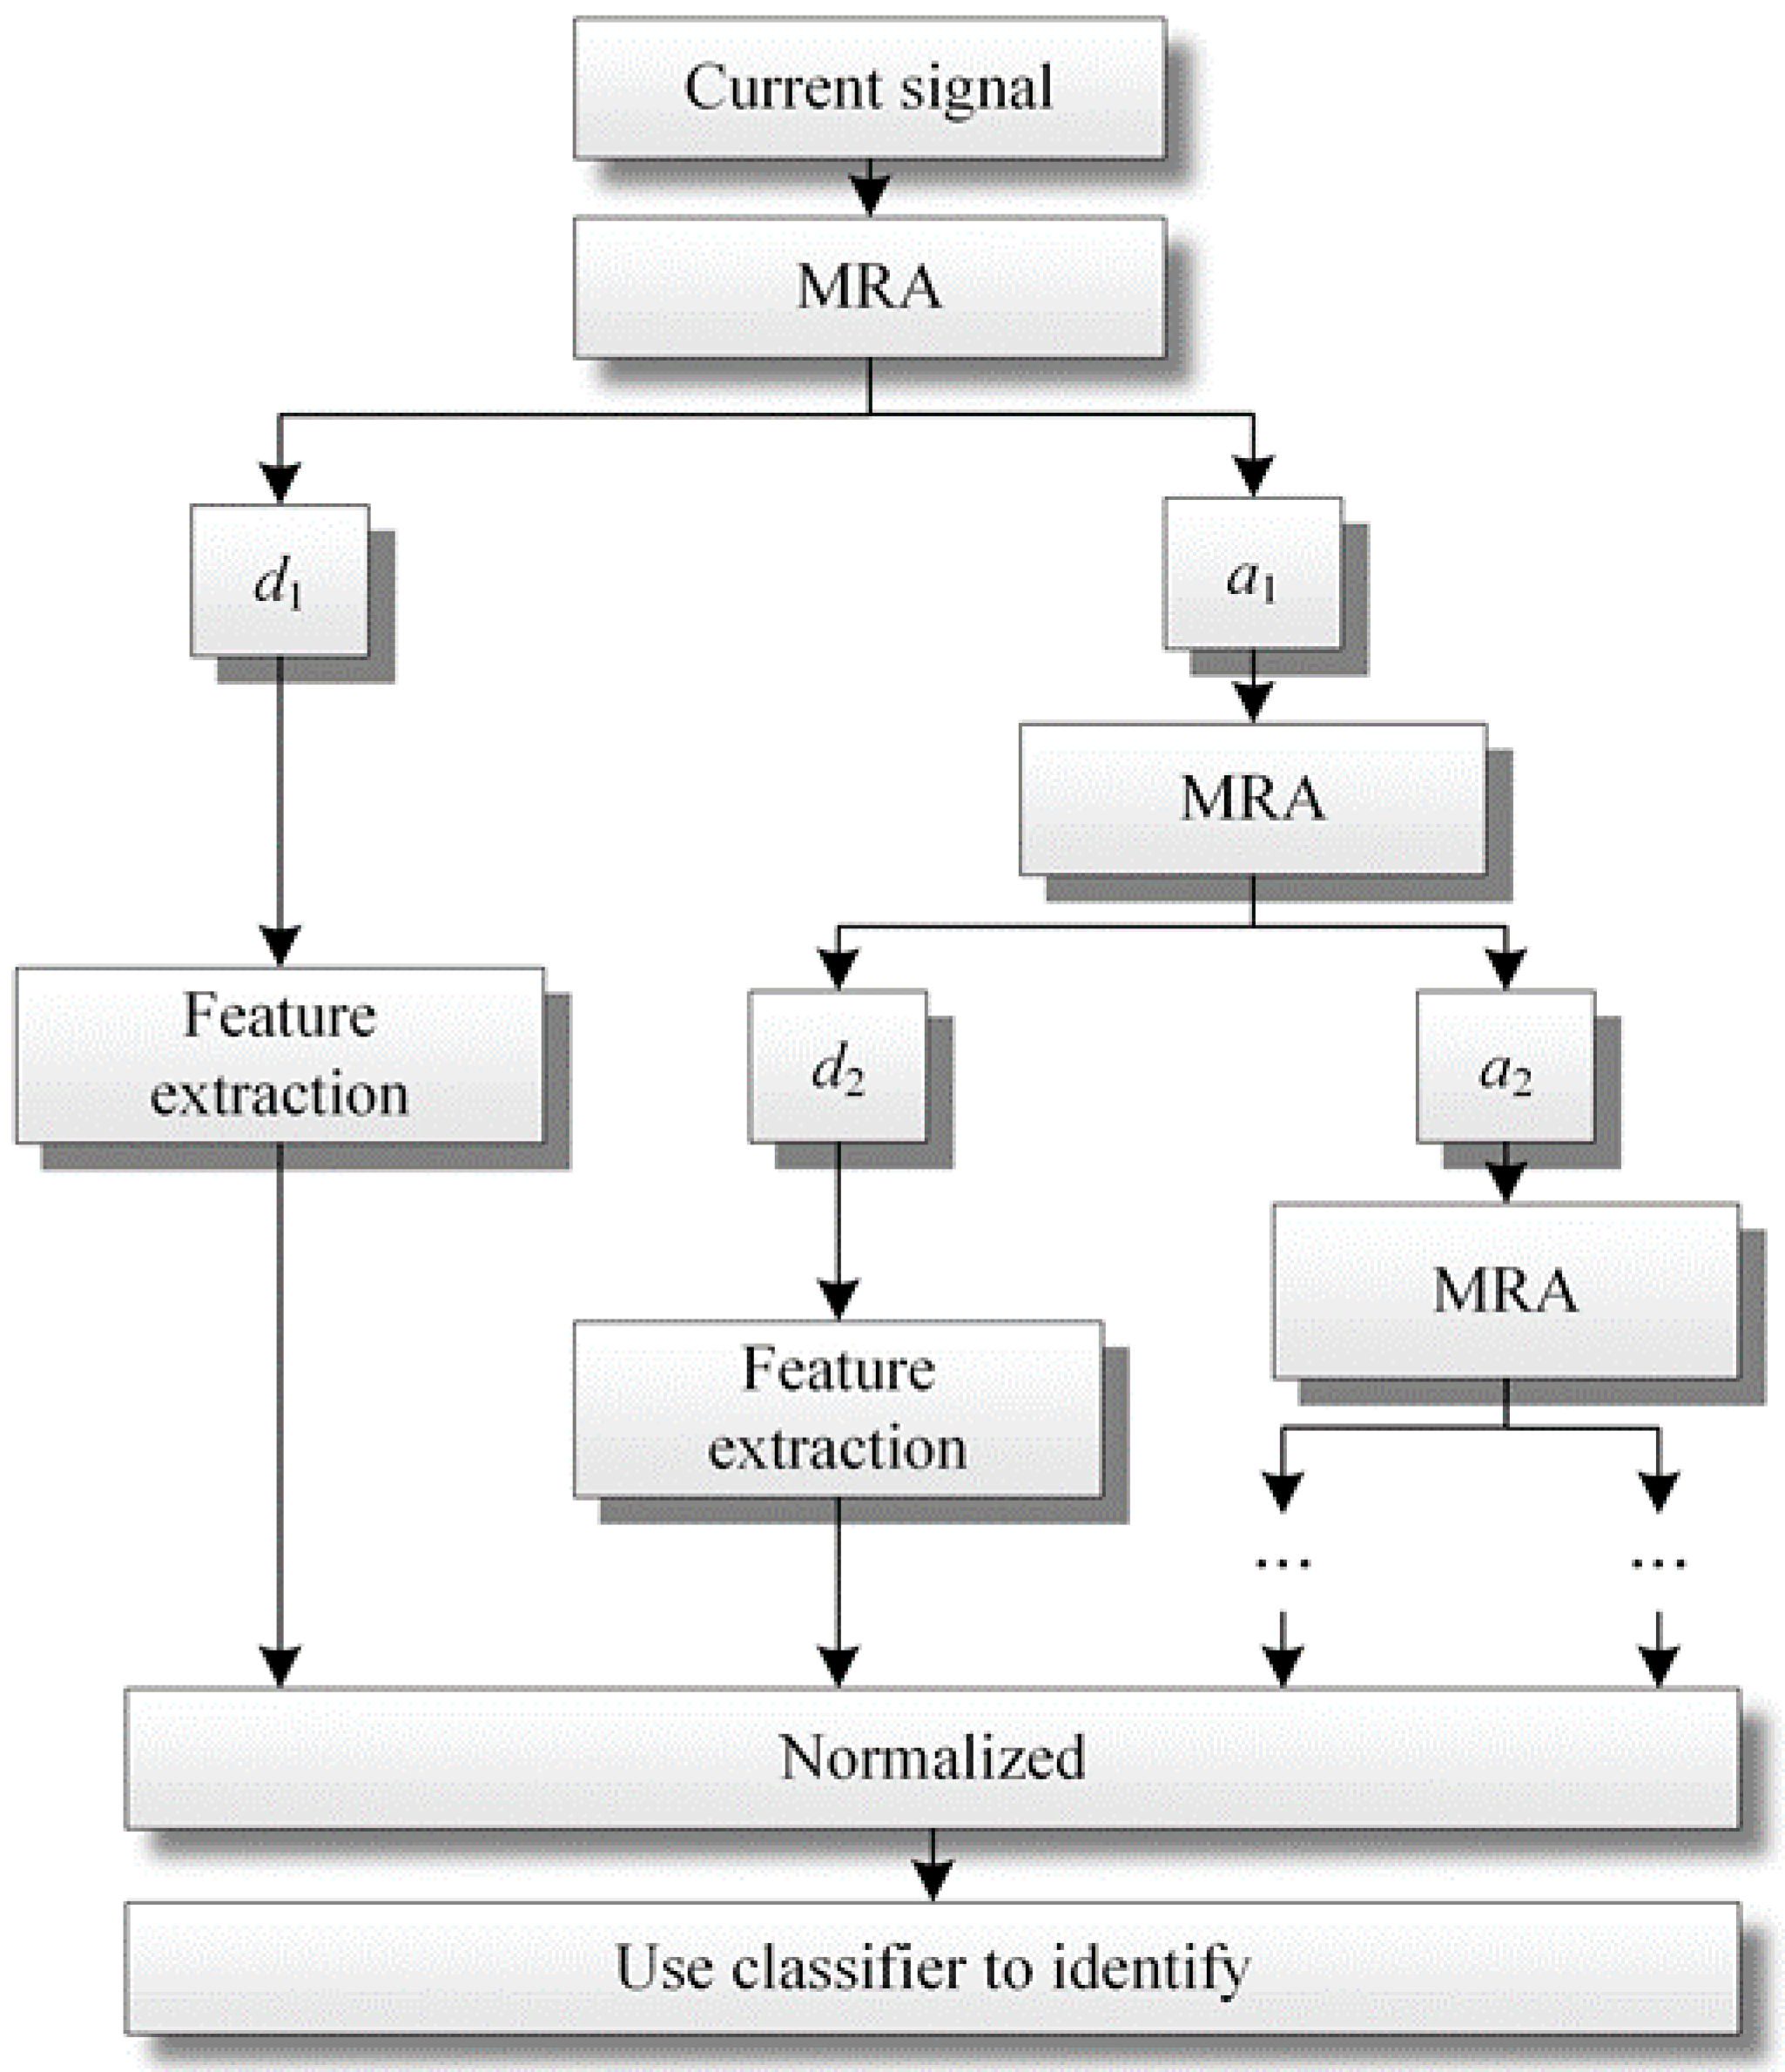
After multiple resolution analysis for current signals of the healthy motor, bearing damage, stator winding inter-turn short circuit, and broken rotor bar, the high frequency signals from layer1 to layer5 are taken, and the maximum, minimum, average, mean square error, and standard deviation of each layer of the high frequency signal are extracted. After normalization, 30 feature values between 0 and 1 can be obtained. The feature extraction process of MRA is shown in
Figure 11.
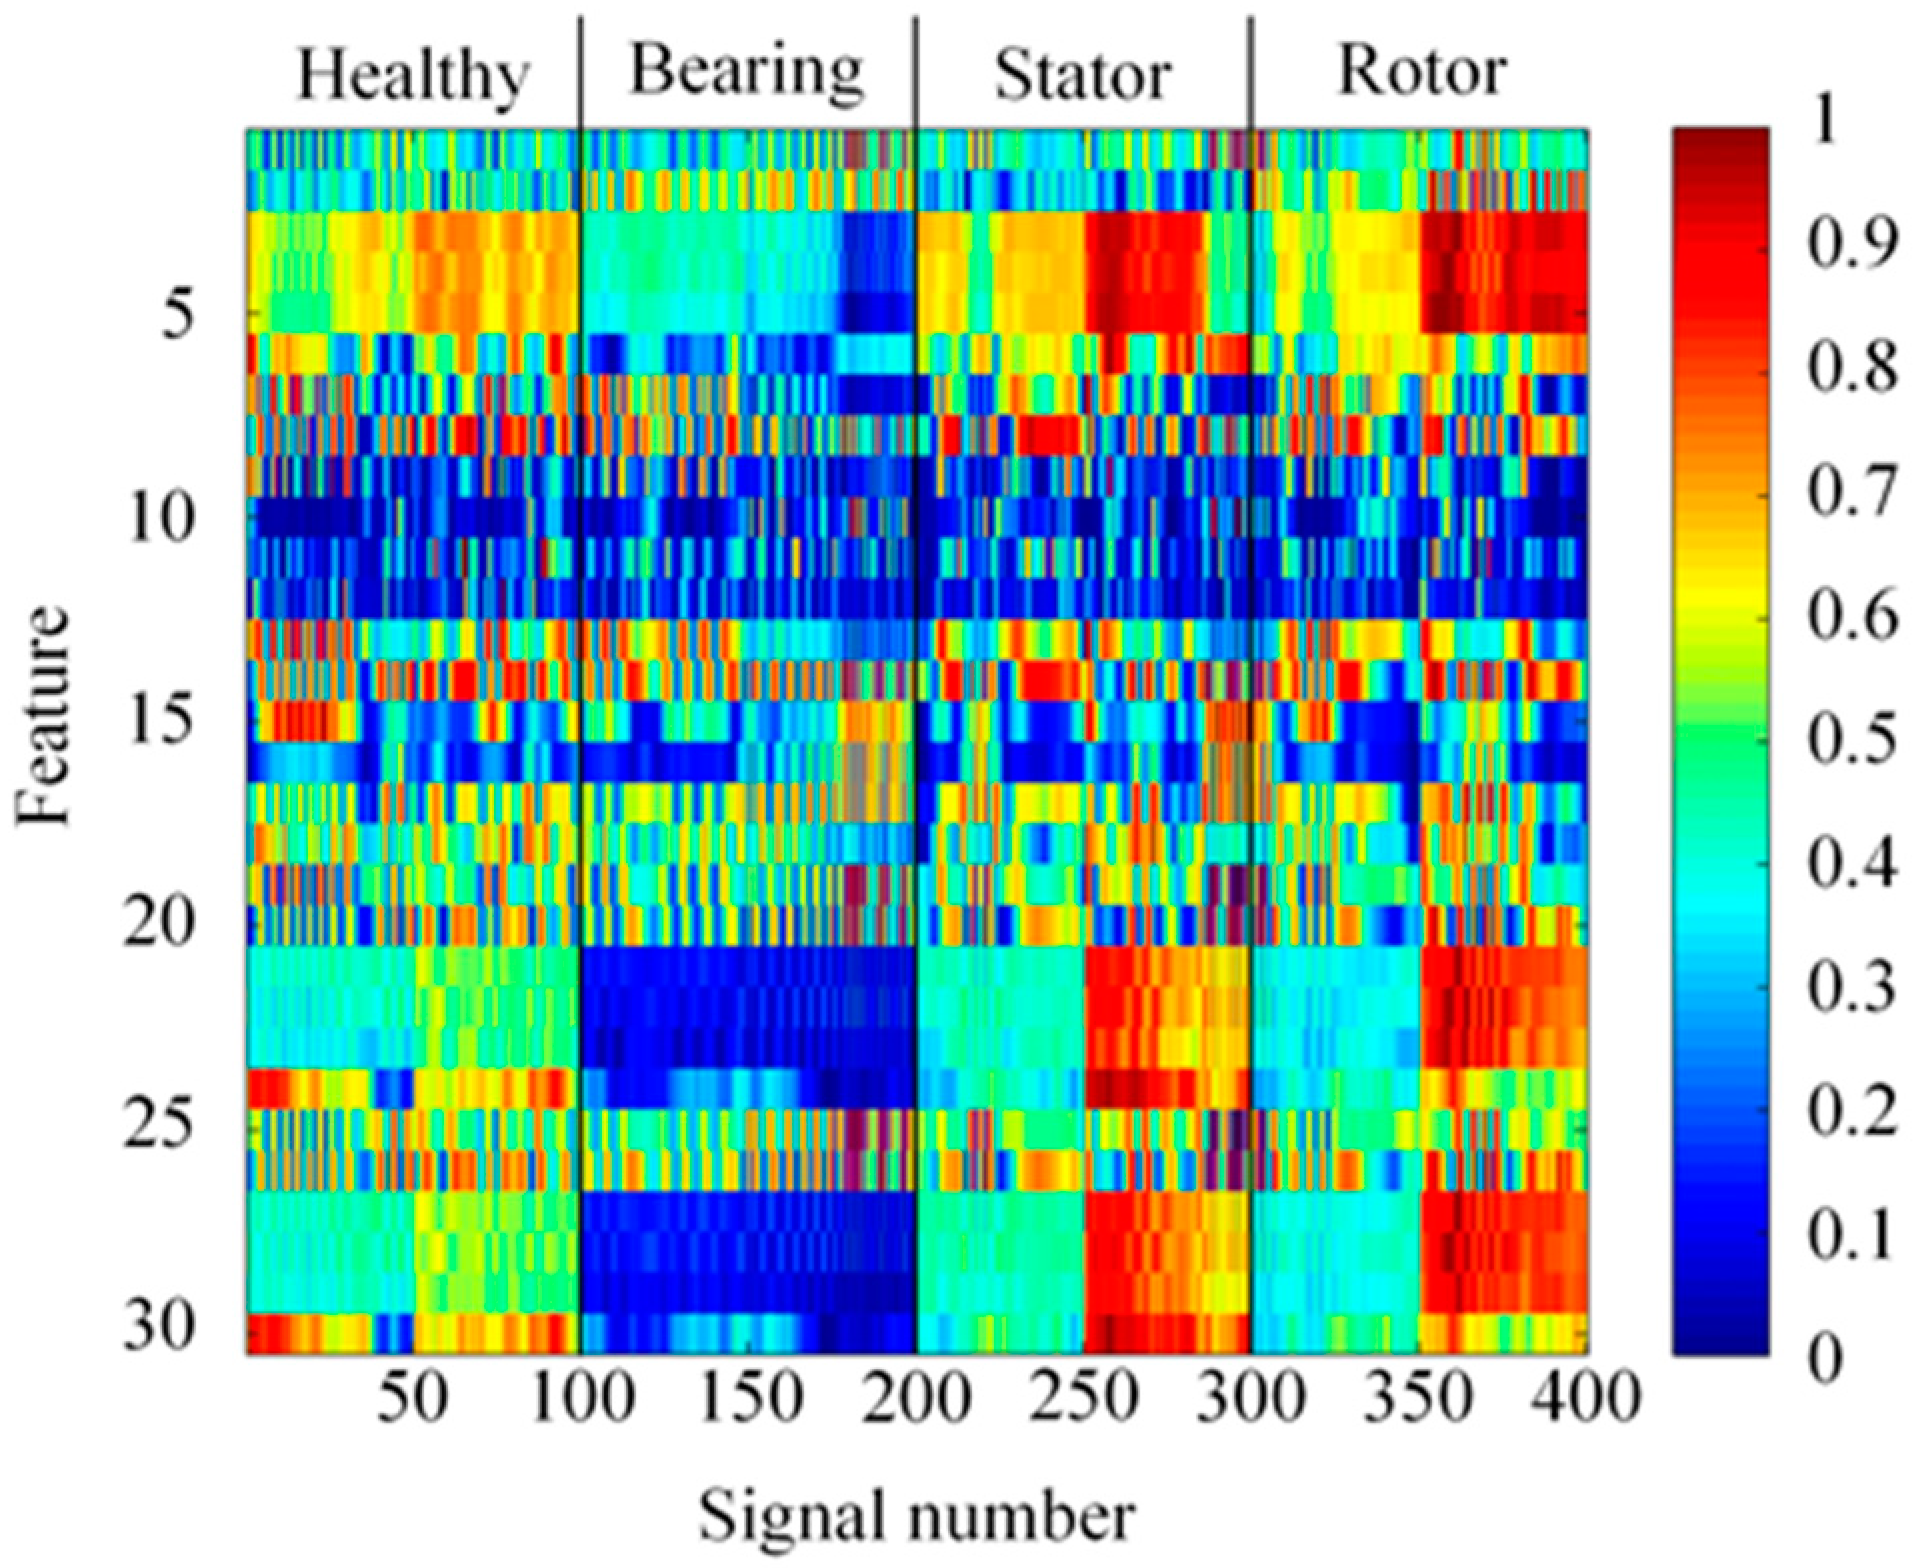
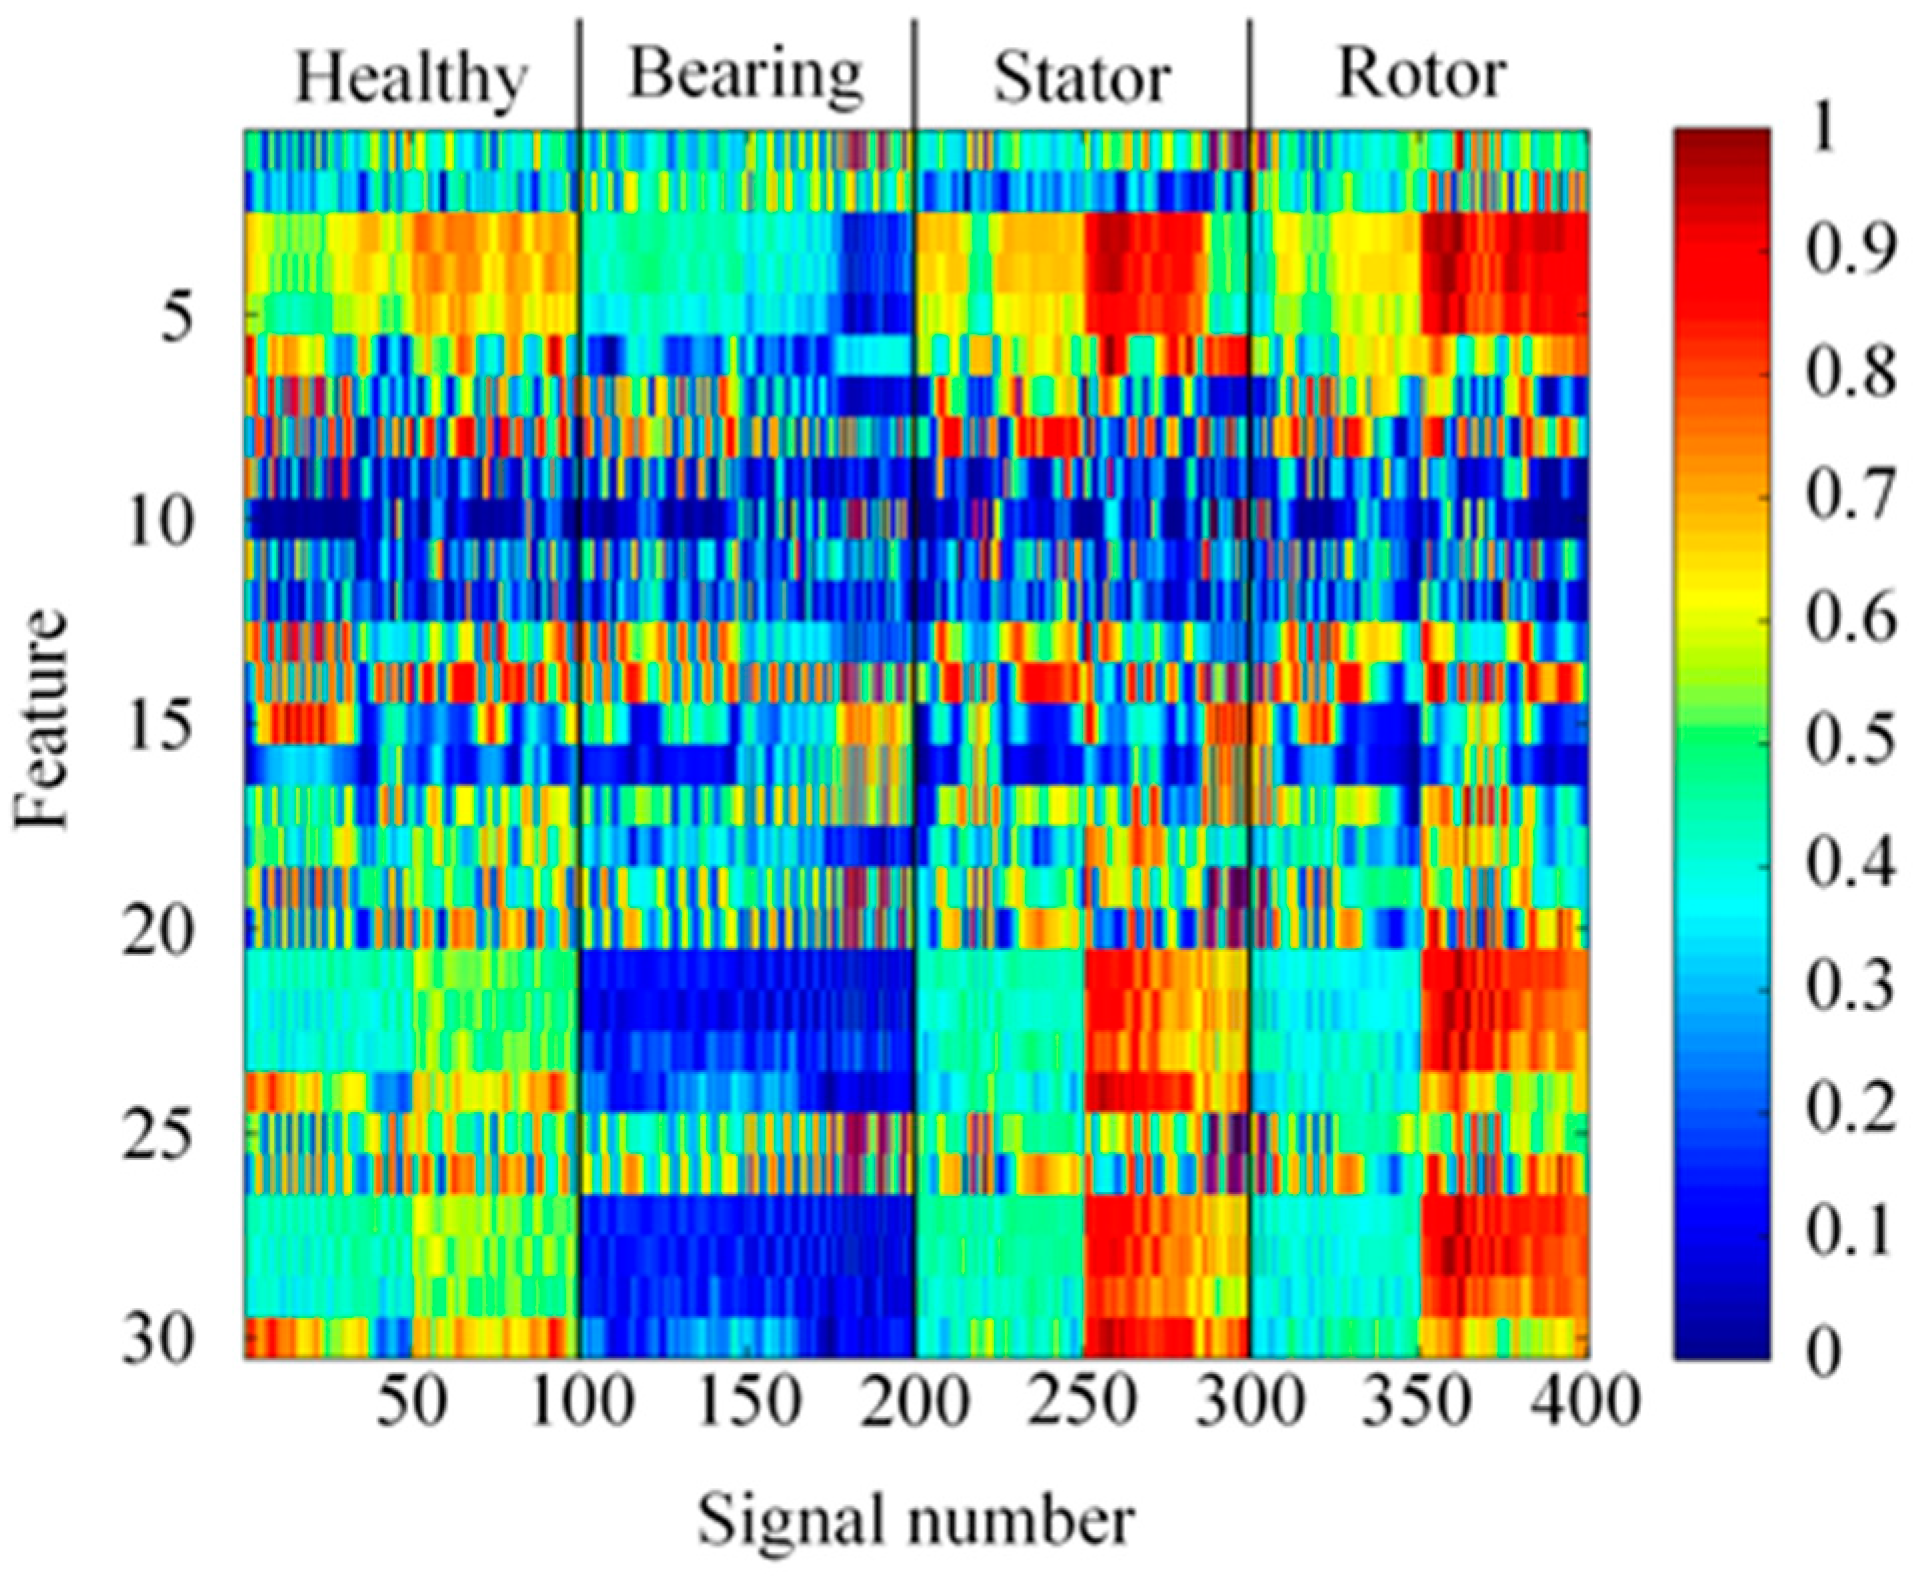
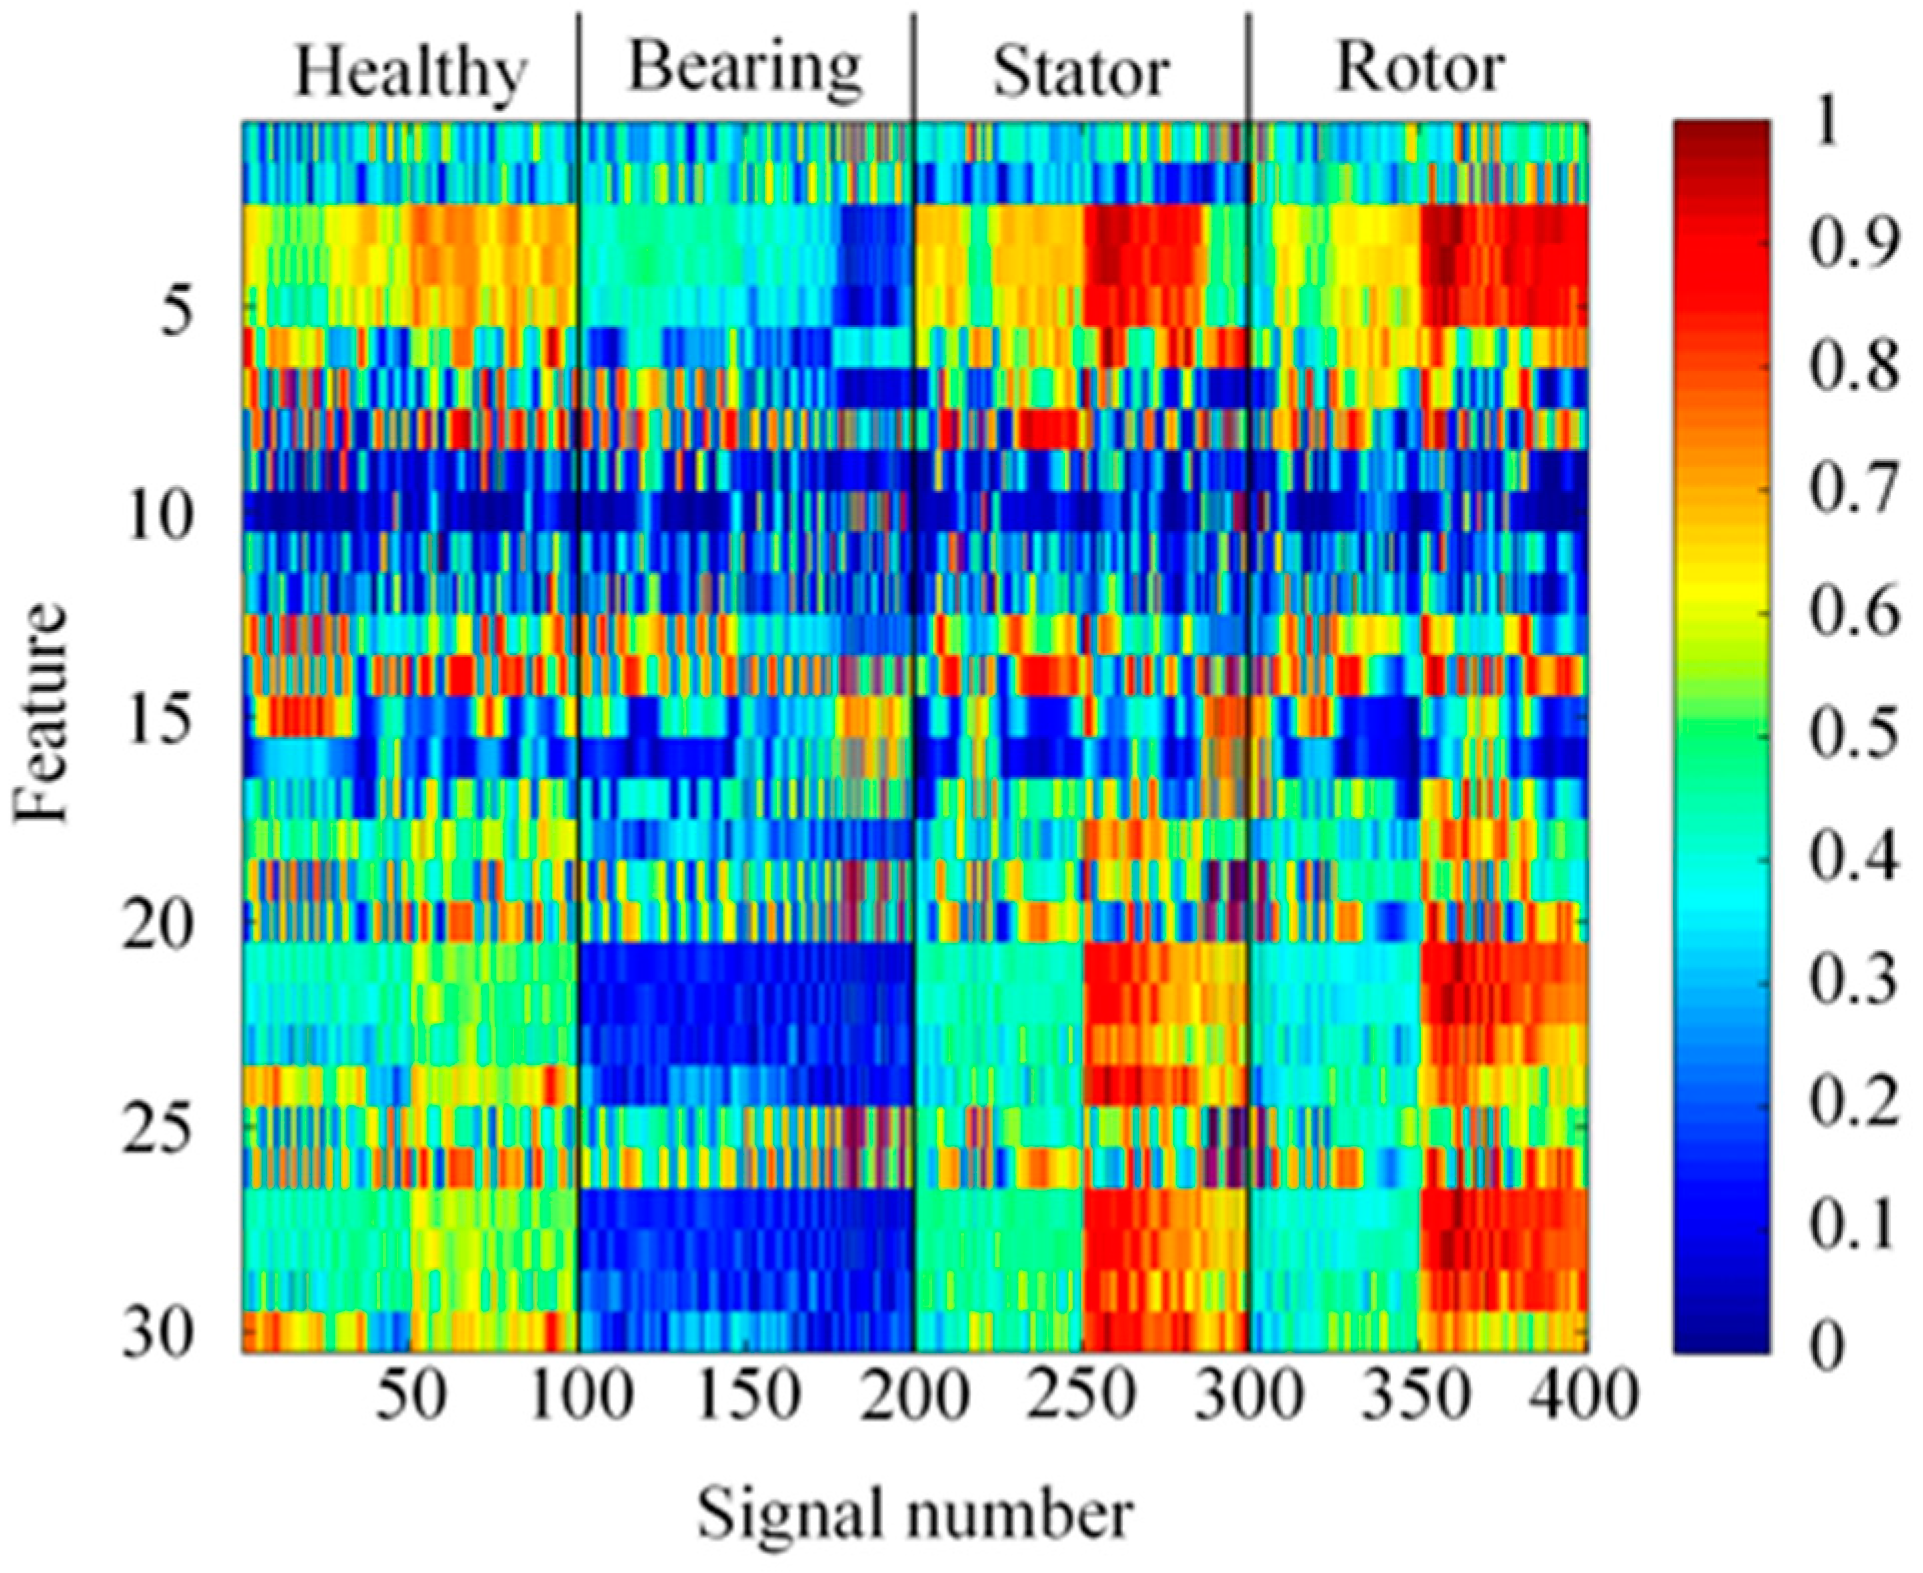
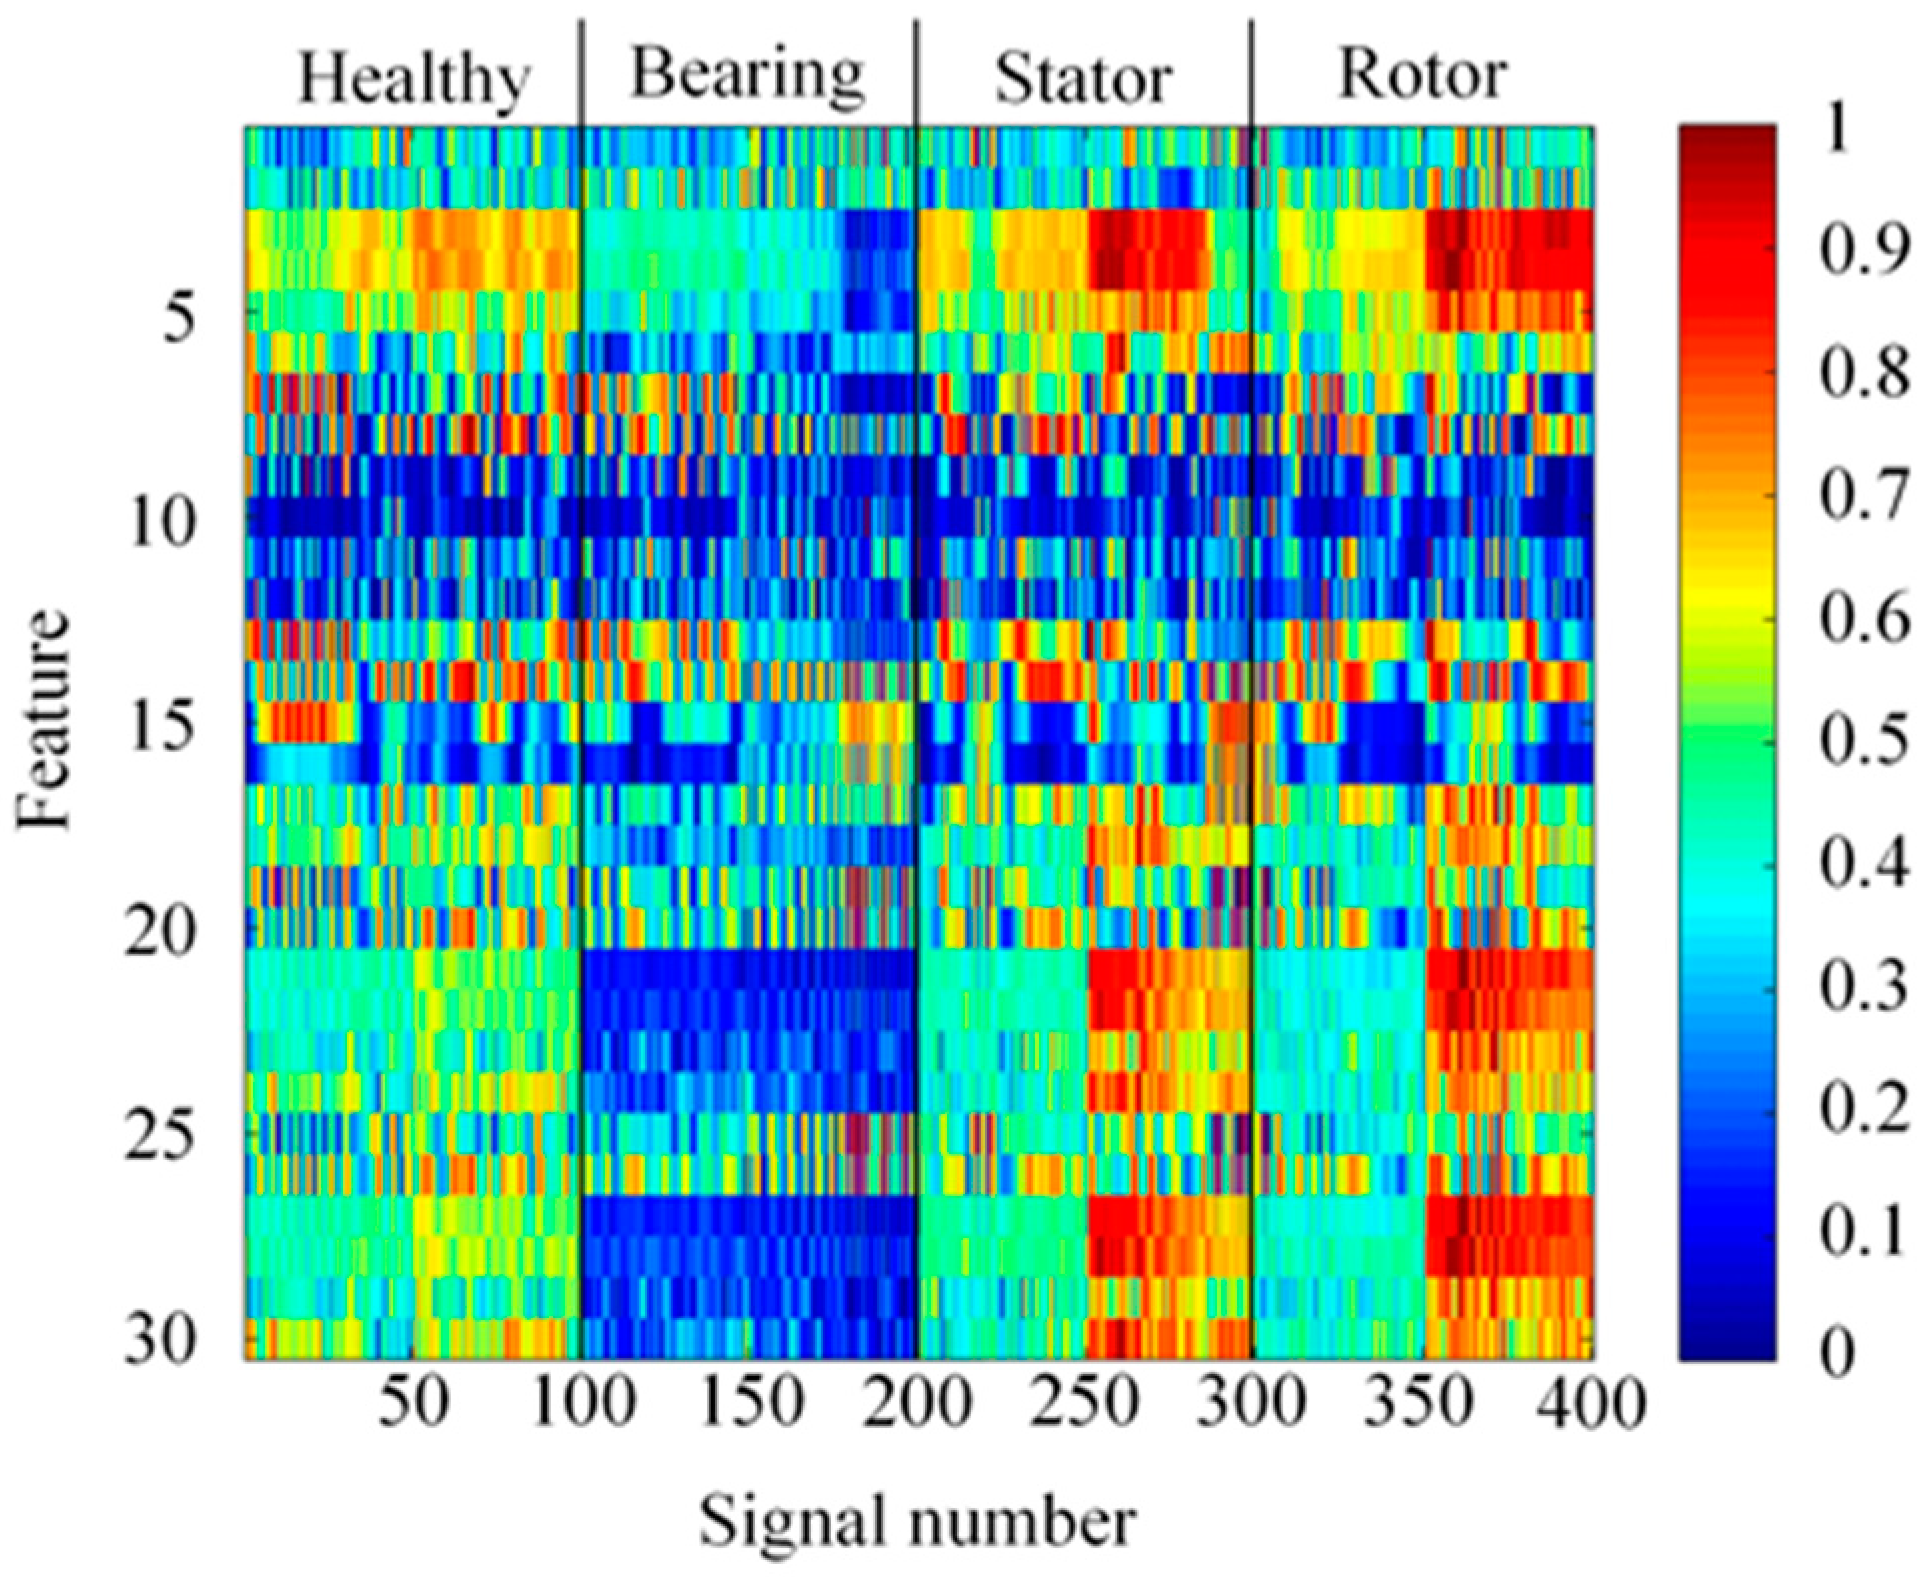
5.1.2. Feature Distribution
According to the method in
Figure 11, 30 features of the MRA spectrum can be obtained and the white noises of signal noise ratio (SNR) = ∞ dB, SNR=30 dB, SNR = 25 dB, and SNR = 20 dB were added to the origin signal to simulate the actual operation condition of the induction motor. The features’ energy diagrams are shown in
Figure 12,
Figure 13,
Figure 14 and
Figure 15. From these figures, it can be seen that the feature distribution is different in the case of different axis deviations. As the noise increases, the difference between different signals gradually becomes similar. Therefore, it is more difficult to identify.
5.2. Result of Classification
In this paper, the failure types of the three-phase squirrel cage induction motor are healthy, bearing damage, stator winding inter-turn short circuit, and broken rotor bar. The wavelet multiple resolution analysis is used to analyze the signal and capture signal features. The BP neural network, PSO-BP neural network, and improved PSO-BP neural network are used to calculate the accuracy rate. Finally, the white noises SNR = ∞ dB, SNR = 30 dB, SNR = 5 dB, and SNR = 20 dB are added to simulate the effectiveness of this classification system in the actual operation of the induction motor.
In the case of white noises SNR = ∞ dB, SNR = 30 dB, SNR = 25 dB, and SNR = 20 dB, the results of motor fault classification are shown in
Table 2. When SNR = ∞ dB, the accuracy rates using the PSO-BP neural network and improved PSO-BP neural network were 98.6% and 98.8%, and the accuracy rate of the BP neural network was 97.2%. However, when severe white noise, SNR = 20 dB, was used, the accuracy rate using the improved PSO-BP neural network decreased to 84.1%, the accuracy rate using the PSO-BP neural network was 81.4%, and the accuracy rate using the BP neural network was 79.2%. It can be observed that using the improved PSO-BP neural network provides better anti-noise ability and can maintain the accuracy rate in severe noise.
6. Conclusions
This paper analyzed the current signal of a healthy motor, bearing damage motor, stator winding inter-turn short circuit motor, and broken rotor bar motor. The measured current signal was analyzed using MRA, and extracting features like maximum, minimum, mean, mean square error, and standard deviation. The accuracy using the BP neural network was 97.2%. In order to improve the accuracy, two algorithm models were used to optimize the initial weight and initial bias of the BP neural network, and the accuracy using the PSO-BP neural network was 98.6%, and the accuracy using improved PSO-BP neural network was 98.8%. In order to simulate the operating environment, the white noises of SNR = 30 dB, SNR = 25 dB, and SNR = 20 dB were added to the original signal. The results showed that the improved PSO-BP neural network is the best model even with noise interferences. Therefore, the superiority and anti-noise capability of the proposed improved PSO-BP neural network can be validated in induction motor fault detection.
This research focused on a healthy motor, bearing damage motor, stator winding inter-turn short circuit motor, and broken rotor bar motor. The signals are all single types of failure for research. However, actual motor faults are often accompanied by chain effects of other parts. Therefore, we can research the compound motor faults of different pieces of equipment and different fault types using the process of the proposed method to construct a database with a wider scope of application.
This research used MATLAB as the program compiler. During the experiment, the current signal extractor and computer are needed, and the motor should be taken out from the system for analysis, so there is a problem of insufficient convenience for maintenance personnel and factories to detect faults. Thus, in the practical applications in the future, the Hall sensor can be used to capture the current signal, and the current signals can be sent to a program which is programmed in the microchip for fault signal analysis. Finally, there is a comparison with the completed database to achieve the function of real-time fault detection. Therefore, as long as the factory conducts regular motor inspections using the proposed motor fault detection method, the economic loss caused by a factory shutdown can be reduced, and accidents in factories can be prevented.


