Article

Optimisation of the Autothermal NH3 Production Process for Power-to-Ammonia

by
Izzat Iqbal Cheema
1,2 and
Ulrike Krewer
1,*
1
Institute of Energy and Process Systems Engineering, Technische Universität Braunschweig, 38106 Braunschweig, Germany
2
Department of Chemical, Polymer and Composite Materials Engineering, University of Engineering and Technology, Lahore (New Campus) 39021, Pakistan
*
Author to whom correspondence should be addressed.
Processes 2020, 8(1), 38; https://doi.org/10.3390/pr8010038
Submission received: 11 November 2019 / Revised: 15 December 2019 / Accepted: 23 December 2019 / Published: 30 December 2019
(This article belongs to the Special Issue Advanced Methods in Process and Systems Engineering)

Abstract

:
The power-to-ammonia process requires flexible operation due to intermittent renewable energy supply. In this work, we analyse three-bed autothermal reactor systems for design and off-design performance for power-to-ammonia application. The five reactor systems differ in terms of inter-stage cooling methods, i.e., direct cooling by quenching (2Q), combination of indirect and direct cooling (HQ and QH) and indirect cooling (2H) with variations. At optimum nominal operation conditions, the inter-stage indirect cooling (2H) reactor systems result in the highest NH3 production. For off-design performance analysis, NH3 production is minimised or maximised by varying one of the following process variables at a time: inert gas, feed flow rate or H2-to-N2 ratio. For each variation, the effect on H2 intake, recycle stream load and recycle-to-feed ratio is also analysed. Among the three process variables, the H2-to-N2 ratio provided ca. 70% lower NH3 production and 70% lower H2 intake than at nominal operation for all five reactor systems. Operation of autothermal reactor systems at significantly lower H2 intake makes them reliable for power-to-ammonia application; as during energy outage period, shutdown can be delayed.

Graphical Abstract

1. Introduction

In the 21st century, along with a rise in global warming awareness, the zero-emission processes have gained more attention. Therefore, instead of fossil or nuclear energy fueled power plants, the world is shifting toward renewable energy generation parks. However, a problem with renewable energy is that it is seasonal, intermittent and harvested decentralised. Thus, backup energy storage is required for uninterrupted and regulated power supply. Chemicals-based storage is capable of high power and high capacity storage at low cost for longer seasonal time duration. Ammonia seems a promising chemical energy storage due to significantly higher energy densities than hydrogen, high round trip efficiency, scalability, availability of transport grid, a maintained safety record, and its production and consumption may be done CO2 emission free [1,2]. Fuhrmann et al. [2] compared electro- and thermo-chemical production and consumption pathways for ammonia. Among these processes, the combination of a Haber–Bosch NH3 synthesis loop with H2 supply from water electrolysis and N2 supply from air separation via pressure swing adsorption displayed in Figure 1 seems promising with respect to production capacities and efficiencies. Sustainable NH3 based energy concepts have been developed by Proton Ventures BV, Schiedam, the Netherlands [3]. The pilot plant, based on wind power for NH3 production for fertiliser usage, is in operation by West Central Research and Outreach Center, Morris, MN, USA [4] and, since June 2018, a second plant is operational at Science & Technology Facilities Council’s, Rutherford Appleton Laboratory, Oxfordshire [5], UK.
For a zero-emission and sustainable power-to-ammonia process, fresh feed coming from the electrolysis and air separation section mainly consists of H2 and N2 with a little amount of Ar. Additionally, it may contain traces of O2 and H2O. The gases are fed into a Haber–Bosch synthesis process, as shown in Figure 1. For a fresh feed, two possibilities exist: pure and dry or impure and wet. A pure and dry fresh feed is mixed with recycle stream and is directly sent to the synthesis reactor system (solid line, Figure 1), whereas an impure and wet fresh feed containing O2 and H2O, which are both catalyst poisons, passes through the NH3 separator prior to entering the reactor system to remove the impurities by dissolution in liquid NH3 (dashed line, Figure 1). Ammonia synthesis is an exothermic reaction and due to thermodynamic equilibrium, only partial conversion of reactant feed takes place in the synthesis reactor system. Therefore, process gas leaving the reactor system is cooled by passing through a trail of heat exchangers and coolers, where NH3 is condensed, separated and stored, and reactants are recycled back. A low inert gas (Ar) concentration within the synthesis loop is maintained by purging gas from the recycle loop [6]. In this work, the synthesis loop configuration based on a pure and dry fresh feed is considered. As it allows for higher NH3 product purity and lower energy consumption, as fresh feed does not need to be cooled and heated before entering the reactor.
Simulation contributes to a better evaluation of power-to-ammonia systems. Cinti et al. [7] analysed a system consisting of low and high temperature electrolyser, pressure swing adsorption and the Haber–Bosch, and Sánchez & Martín [8] analysed a system consisting of electrolyser, cryogenic separation and the Haber–Bosch. The former analysed energy performances along with electricity consumption for every individual section. However, thermodynamic equilibrium was considered instead of a kinetic approach in the Haber–Bosch loop, which is not suitable for off-design-based analysis. In contrast, Sánchez & Martín performed a complete process simulation and optimisation, where they included a kinetic approach for the Haber–Bosch synthesis reactor. However, they did not consider autothermic operation of the synthesis reactor, which is of high interest for realising an energy efficient process and stand-alone power-to-ammonia plants. Alternative ammonia-based process concepts for power-to-power system design of high round trip efficiency of ca. 72 % and a power-to-ammonia process concept for a low pressure reaction-adsorption are suggested by Wang et al. [9] and Malmali et al. [10], respectively. Wang et al. combined a Haber–Bosch ammonia synthesis reactor with a H2 powered cell and divided their concept into two operational modes: charging and discharging. During charging, heat is released from the synthesis reactor and utilised in the heating feed of a reversible solid oxide electrolyser that produces the H2 during discharging; waste heat from the reversible solid oxide fuel cell is utilized in H2 reforming [9]. Like the Haber–Bosch NH3 synthesis loop presented in Figure 1, Malmali et al. also divided the synthesis loop into three steps, but they preferred absorption over condensation for NH3 separation. This change permits synthesis loop operation at stable and ten times lower pressure than the conventional process, but at the expense of increase in recycle load. In addition, work on absorbent regeneration still needs to be carried out [10]. All stated process concepts use the NH3 synthesis reactor system. During operation of the power-to-ammonia pilot plant at Morris, MN, USA, it was figured out that the NH3 production rate in the Haber–Bosch synthesis loop is mainly influenced by the reactor system, NH3 separation by condensation and the recycle loop. The reactor system is a bottleneck of the synthesis loop, as the reactor system has the strongest influence on the NH3 production rate, at least three times higher than the other two [4]. Therefore, knowing the suitable reactor system configuration for power-to-ammonia application will be of great usage.

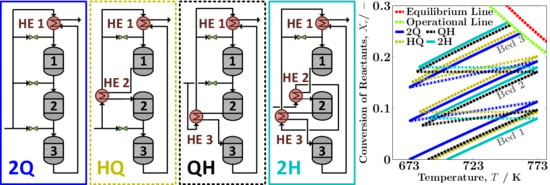
Ammonia Synthesis Reactor Systems

Ammonia synthesis reactor systems are mainly classified into two main types: tube cooled and multi-bed systems. For tube cooled reactor systems, two configurations are possible, i.e., cooling medium inside and catalyst outside or vice versa. For multi-bed reactor systems, the catalyst is spread over various beds at which the reaction is carried out adiabatically: direct or indirect cooling is realised between the catalyst beds. Preferably, the process streams are used for heat management, i.e., cooling or heating certain compartments. A design and configuration comparison of ammonia synthesis reactor systems used in industry is given by Strelzoff [11]. In addition, in a very recent work, tube cooled and multi-bed reactor systems are compared [12,13]. Khademi & Sabbaghi [12] simulated and optimised tube cooled and multi-bed reactor systems. In multi-bed reactor systems, they considered: quench and indirect cooling, with combinations of two, three and four catalyst beds. Among these three types of reactor systems, the optimisation results for maximum N2 conversion are compared at the same conditions: catalyst volume, reactor pressure and feed mass flow rate. Among these reactor systems, the three-bed reactor system was found to be the most efficient in terms of NH3 production, energy savings, capital, and maintenance cost. The indirect cooling reactor system results in higher N2 conversion than the quench type. At optimum conditions, tube cooled and indirect cooling N2 conversion profiles are mostly identical and resulted in the same overall conversion, but temperature profiles are distant [12]. Overall, the tube cooled reactor system was found to be more efficient in recovering heat of reaction. However, the capital cost of the tube cooled reactor system along with the catalyst is three times greater than the cost of the quench-based cooling reactor system [13]. Therefore, three-bed autothermal reactor systems are considered in this work.
A large amount of optimisation work on multi-bed reactor systems can also be found [14,15,16,17,18]. A four-bed direct cooling reactor system for optimal operational temperature was presented by Gaines [14], whereas an indirect cooling reactor system for maximum N2 conversion by a one-dimensional homogeneous model was analysed by Aka and Rapheel [15]. Gaines optimisation results show that, with good temperature control, NH3 production can be increased by 1% forthe constant feed rate. In addition, the impact of quench fractions alone or with one process variable at a time on reactor efficiency was studied [14]. Aka and Rapheel considered each bed inlet temperature as a decision variable for maximising N2 conversion from 0.19 to 0.26 [15]. Elnashaie et al. [16], Elnashaie and Alhabdan [17], and Azarhoosh et al. [18] optimised three-bed indirect cooling reactor systems for maximum NH3 production by using a one-dimensional heterogeneous model. Elnashaie et al. determined the optimal temperature profile and increased NH3 production by 6 to 7% for reactor operation at optimal temperature profile. Furthermore, their model satisfied various adiabatic and non-adiabatic industrial reactor systems [16]. Elnashaie & Alhabdan developed a computer software to determine the optimal behaviour of an ammonia reactor, whence three internal collocation points were required for achieving satisfactory results [17]. Azarhoosh et al. used a genetic algorithm for optimisation of inter-cooled and directly cooled horizontal reactors for maximum ammonia production. They considered an inter-cooled reactor with only one heat exchanger between beds 1 and 2, exchanging heat with the reactor feed. Furthermore, the effects of parameters such as inlet temperature, total feed flow rate, and operation pressure on NH3 production were studied. Satisfactory matching of the results between simulation and industrial data was achieved [18]. In a most recent optimisation work for maximising N2 conversion by differential evolution algorithm, Khadmi & Sabbaghi also compared adiabatic direct and indirect cooling reactor systems [12]. They considered a one-dimensional pseudo-homogeneous model along with an empirical relation for diffusion resistance. The indirect cooling reactor system results in higher N2 conversion with only the inlet temperature of each bed as the decision variable. Parallel to the optimisation of conventional multi-bed NH3 synthesis reactor system configurations, work on various hybrid configurations of reactor systems has been carried out by Farivar & Ebrahim [19]. Similar to Azarhoosh et al. [18], Farivar & Ebrahim studied inter-cooled and directly cooled horizontal ammonia synthesis reactor systems. However, instead of optimisation, they proposed a new configuration consisting of direct and indirect cooling reactor systems combination, which results in an increase of N2 conversion from direct cooling reactor. In their proposed configuration, they introduced direct cooling between beds 1 and 2, and indirect cooling with the help of a feed between beds 2 and 3 [19].
In addition to optimum design, as well as efficient and autothermal operation of an ammonia synthesis reactor system, there is renewable energy outage and an abundance of electricity demands to establish operation of the power-to-ammonia process flexibly. Therefore, for these two scenarios, knowing the load range limit of NH3 production for a synthesis reactor system will be of great interest. During a renewable energy outage period, it is of great interest to be able to switch the synthesis reactor system to minimum production load, i.e., minimum fresh feed intake. On the other hand, very low electricity prices may make it attractive to operate at maximum ammonia production. In our previous work, Cheema and Krewer [20], we performed flexibility analyses and also determined the operating envelope of a three-bed autothermal reactor system via a one-dimensional pseudo-homogeneous model and steady-state stability analysis for six variables, such as reactor pressure, feed temperature, inert gas fraction in the synthesis loop, NH3 concentration, H2-to-N2 ratio, and total feed flow rate. Among six process variables, inert gas fraction, H2-to-N2 ratio and total feed flow rate provided significantly higher operational flexibilities from nominal value. Operation of the reactor system with variables other than nominal H2-to-N2 ratio or total feed flow rate resulted in lower ammonia production.
It can be seen that numerous studies on optimisation of reactor system configurations, maximising N2 conversion and NH3 production have been carried out. However, no significant work for off-design performance analysis, i.e., minimisation and maximisation of NH3 production, has been done. Raw materials are abundantly available for conventional ammonia production; therefore, minimisation of NH3 production was not of interest, whereas, for power-to-ammonia, besides design performance, off-design performance is of equal importance, as reactants supply is strongly dependent on a supply of renewable energy. For example, H2 production via electrolysers consumes more than 90% of the energy [21]. Therefore, during energy shortage periods, H2 production needs to be stopped or slowed down. Thus, the focus of this work is to investigate the ammonia production flexibilities, along with H2 intake, change in recycle load and recycle-to-feed ratio by manipulating the suitable process variables (inert gas fraction, H2-to-N2 ratio and total feed flow rate) for three-bed additional autothermal reactor system configurations. Therefore, first, the reactor system configurations and the synthesis loop are defined. Afterwards, problems are formulated for optimisation case scenarios: design performance and off-design performance (minimum and maximum NH3 production) for flexibility analysis. Finally, results are compared and discussed.

2. Methodology

In addition to efficient and autothermal operation, power-to-ammonia requires operational and production flexibilities. Therefore, special emphasis should be given to the selection of a reactor system that is capable of maintaining autothermal operation over a wide range of NH3 production rates. In this section, first, the three-bed autothermal reactor system configuration is discussed, as besidess efficient operation, it also allows various combinations of interstage cooling methods for optimal heat management as shown in Figure 2. The configurations, shown in Figure 2a,d,e, represent standard quench type cooling (2Q) and inter-stage cooler based cooling (2H-2 and 2H-3) synthesis reactor systems, respectively. The configurations shown in Figure 2b,c are tailor made synthesis reactor systems, with a combination of quench-type and inter-stage cooler based cooling before (HQ) and afterwards (QH), respectively. Determination of the most suitable autothermal reactor systems among the design variants for power-to-ammonia would be of great interest.
To compare the performance of the synthesis reactor systems 2Q, HQ, QH, 2H-2 and 2H-3, and their interaction with the synthesis loop, the Haber–Bosch ammonia synthesis loop is divided into two boundaries: see Figure 3. The system boundary I is applied around a synthesis reactor system and the system boundary II is applied around the overall synthesis loop. However, to keep the model generic and focused on the complex reactor systems (boundary I) and their minimum and maximum NH3 production limitations, the limitations which may occur by the unit operations in the system boundary II are neglected, similar to Cheema & Krewer [20]. In making comparison among the design variants, two performance scenarios are considered: design and off-design. Design performance analysis is made at stable process conditions for a normal NH3 production load, and off-design performance analysis is made by varying one process variable at a time for minimum and maximum NH3 production load. For design and off-design performance comparison among the design variants, it is necessary that it is made on equal grounds, i.e., at similar operational conditions: process feed composition and flow rate. In this section, first, the mathematical models required by the system boundaries I and II are presented along with optimum design conditions for normal NH3 production load. Afterwards, off-design operation scenarios are discussed with a variation of one process variable at a time.

2.1. Mathematical Model

For the comparison of the design and off-design performance among the design variants (Figure 2), the models are kept compact, with as little detail as necessary. As the detailed design and construction specifications of the reactor systems are not within the scope of this work. Therefore, a pseudo-homogeneous model is adapted and heat losses are neglected. With these assumptions, behaviour of the reactor system remains comparable to an actual ammonia synthesis plant [15,18,22,23]. The assumptions and mathematical models applied within the system boundaries I and II are given as follows.

2.1.1. System Boundary I

To analyse the synthesis reactor systems, a given synthesis reactor system is divided into three individual sub-systems: catalyst bed, mixer and heat exchanger. By combining models of each individual subsystem, the behaviour of a given overall synthesis reactor system is obtained.

Catalyst Bed

For the catalyst bed, adiabatic and isobaric conditions are considered along with assumptions of negligible pressure drop [24]. Furthermore, fine reduced magnetite Fe3O4 catalyst particles of size 1.5 to 3 mm with high thermal conductivity [25] and high efficiency [26] are considered. Therefore, the rate of ammonia formation is calculated without correction factor and temperature gradient within a catalyst particle, with convective driving forces for material and heat transport between flowing gases and catalyst [26]. The catalyst bed is described by steady state one-dimensional pseudo-homogeneous species and energy balance Equations (1) and (2):
d X r , b d V b = ν r R NH 3 , b 2 n ˙ r , b i n ,
d T b d V b = ( Δ H b ) R NH 3 , b m ˙ b i n C p b ,
where X r , b is the fractional conversion of the reactant components r { N 2 , H 2 } in catalyst beds b { 1 , 2 , 3 } of reactor systems R S {2Q, HQ, QH, 2H}, n ˙ r , b in is the inlet molar flow rate of reactant components into a catalyst bed of a reactor system, ν r is the stoichiometric coefficient of a reactant component, R NH 3 , b is the reaction rate in a catalyst bed of respective reactor system, V b is the volume of the reactor system’s catalyst bed, m ˙ b in is the mass feed flow rate at reactor system’s catalyst bed, Δ H b is the heat of reaction at catalyst bed of reactor system, T b is the temperature in catalyst bed of reactor system and C p b is the specific heat of reacting mixture in reactor system’s catalyst bed. From the ammonia synthesis reaction, mentioned in Figure 1, it can be seen that, for 1 mol of N2 and 3 mol of H2, 2 mol of NH3 are generated. Therefore, the reaction rate for the reactants at stoichiometry in Equation (1) is stated as follows: R N 2 = R H 2 / 3 = R N H 3 / 2 and ν r { 1 | 3 } . The supporting equations of heat of reaction, specific heat, rate of reaction along with constants and parameters for the model are summarised in Tables S1 to S3 of supplementary materials.

Mixer

For the mixer, isobaric conditions along with ideal and instantaneous mixing assumptions are considered due to negligible interaction of mixing components [27]. The mixer model is described by steady state species and energy balance Equations (3) and (4):
X r , m out = b = 1 m 1 ( n ˙ r , b in · b = 1 m 1 X r , b out ) b = 1 m 1 ( n ˙ r , b in · b = 1 m 1 X r , b out ) + ( n ˙ r , b out + n ˙ r , q ) ,
T m out = m ˙ b out C p b out T b out + m ˙ q C p q T q ( m ˙ b out + m ˙ q ) C p m out ,
where X r , m out is the fractional conversion of the reactant components and T m out is the temperature at outlet of a mixer of reactor system. The mixers m { 2 , 3 } between catalyst beds are considered operational only; therefore, b { 1 , 2 } refers to beds and q { 2 , 3 } refers to quench streams of respective reactor system. n ˙ r , b out , m ˙ b out , n ˙ r , q and m ˙ q are the molar flows of a reactant component and the mass flow rates entering a mixer of reactor system from a respective catalyst bed and a quench stream. C p b out , C p q , and C p m out are the specific heats at outlet of catalyst bed b, quench stream q and outlet of mixture m. The supporting equations of specific heat along with constants are summarised in Tables S1 and S2 of supplementary materials.

Heat Exchanger

For the heat exchanger, adiabatic shell and tube heat exchanger with cold process gas passing through the shell side and hot process gas passing through the tube side is considered [28]. Heat exchange between hot and cold process gas takes place with a combination of cross flow and counter current flow [29], without involvement of chemical reaction, mass transfer and condensation. For the given assumptions, the heat exchanger energy balance can be described by an ε -NTU model [30], Equations (5) and (6):
ε H E = { For ( m ˙ C p ) hot < ( m ˙ C p ) cold : (5) ( m ˙ C p ) hot , H E ( T hot , in T hot , out ) H E ( m ˙ C p ) MIN , H E ( T hot , in T cold , in ) H E , For ( m ˙ C p ) cold < ( m ˙ C p ) hot : (6) ( m ˙ C p ) cold , H E ( T cold , out T cold , in ) H E ( m ˙ C p ) MIN , H E ( T hot , in T cold , in ) H E ,
where ε H E is the effectiveness of heat exchanger H E {1, 2, 3} of the respective reactor system R S {2Q, HQ, QH, 2H-2, 2H-3} and defined as the ratio between actual heat transfer rate and maximum heat transfer rate ( Q H E / Q MAX , H E ). T hot , H E is the temperature at tube side, T cold , H E is the temperature at shell side, m ˙ is the mass flow rate and C p is the specific heat of process gas at respective side (hot and/or cold) of the heat exchanger. In Equation (5), ( m ˙ C p ) MIN = ( m ˙ C p ) hot and in Equation (6), ( m ˙ C p ) MIN = ( m ˙ C p ) cold . The additional equations for calculating NTU and the area of a shell and tube heat exchanger are mentioned in Table S4 of supplementary materials. The ε -NTU model has a preference over the conventional model, as it does not require detailed design and mean temperature difference calculations. Furthermore, the ε -NTU model is also suitable for off-design condition calculations [31].

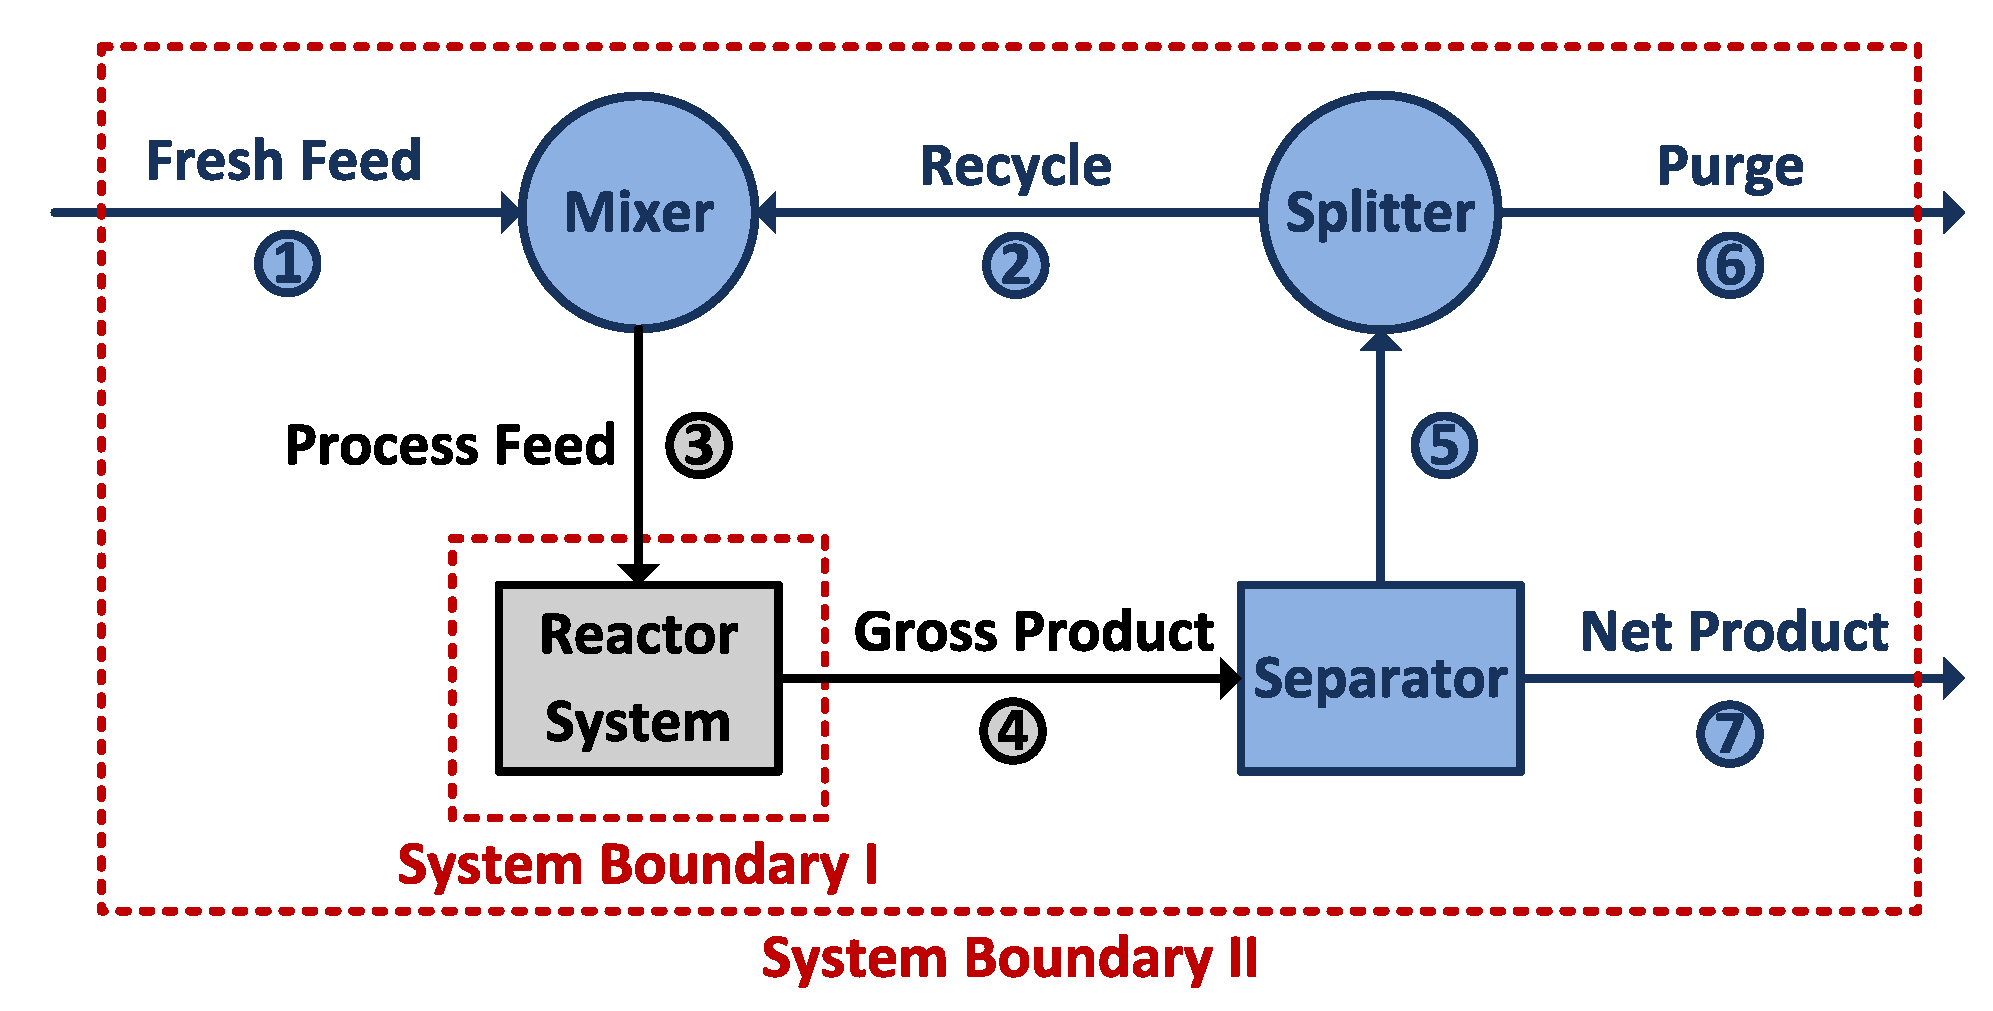
2.1.2. System Boundary II

For acquiring design and off-design performance among the design variants, it is necessary to extend the model of the reactor systems to the overall synthesis loop, as the recycle stream influences process feed composition; see Figure 3. However, to keep the model generic and focused on the reactors and their minimum and maximum NH3 production limitations, the limitations which may occur by the unit operations in the synthesis loop are ignored. For example, in the synthesis loop, the design and thermodynamic operational limits of the NH3 separation unit, due to insufficient cooling and/or compression are neglected, and only material balance is considered. With consideration of a 100% pure net NH3 product, a simple split type model for a separator is considered, i.e., a partial amount of NH3 from the product stream is recycled to maintain concentration in process feed ③. The overall material balance Equation (7) of the components c {N2, H2, Ar} for synthesis loop and amount of NH3 recycled back by separator (Equation (8)) are taken from Cheema and Krewer [20]:
m ˙ c , m ˙ c , + p m ˙ c , x c , m ˙ = 0 ,
m ˙ N H 3 = ( 1 p ) m ˙ N H 3 ,
where m ˙ c is the mass flow rate of the components c {N2, H2, Ar} in the streams ③ and ④, m ˙ is the total fresh feed mass flow rate, x c , is the fresh feed composition, m ˙ NH3 is the ammonia mass flow rate in the streams ③ and ⑤ and p is defined as purge fraction, i.e., ratio between m ˙ and m ˙ of respective design variant.

2.2. Problem Formulation

For the design variants’ performance analysis, the optimisation problem is developed for design and off-design scenarios with consideration of 2Q as a reference system.

2.2.1. Design Performance

To compare the design variants 2Q, HQ, QH, 2H-2, and 2H-3 at their nominal operation point, parameters and process variables are kept constant for each system boundary. They are discussed as follows:

System Boundary I

The reactor system 2Q is designed for a NH3 capacity of 120 kg/h which is sufficient to generate 50 MWh/day of energy via internal combustion engine of 29 % efficiency [3,20]. Cheema and Krewer tailored the volume of the catalyst beds along with intermediate flow rates with regard to maximum reactants’ conversion fed at stoichiometric ratio (3 mol of H2 to 1 mol of N2) and operational temperature span, 673 to 773 K or 90% of the equilibrium temperature, see Figure 4. The reactor systems are preferably designed for operation up to 90% of the equilibrium composition that is mainly to avoid the infinite amount of reactor space requirement for accomplishing equilibrium conversion [32]. For comparison among performance of the reactor systems, the volume of catalyst beds, the initial conditions, the total process feed composition, and flow rate are kept constant for all the reactor systems and are taken from Cheema and Krewer [20]; see Table 1.
To determine the maximum gross NH3 production of the respective reactor system, equality (Equations (1)–(4)) and inequality constraints (Equations (9) and (10)) are implemented to assure that all catalyst beds operate at maximum temperatures. This yields the following optimisation problem:
MAX z R S μ ˙ NH 3 = m ˙ NH 3 , m ˙ NH 3 , , subject to Equations ( 1 ) ( 4 ) ( reactor system ) ,
673 K T b in < T b out = { (9) 773 K ; for { 1,2 } , (10) 0.90 for T EQ ; for b = 3 ,
where μ ˙ NH 3 is the gross NH3 production for the reactor systems R S {HQ, QH, 2H-2, 2H-3}. For reactor systems HQ, QH, and 2H, inlet temperatures of the catalyst beds are manipulated by means of direct mixing and/or inter-stage heat exchangers; see Figure 2. For the reactor systems having an interstage mixer, heat exchanger or a combination of both, the process variables are quench flow rate, catalyst bed inlet temperature or both; thus, z R S of respective reactor systems are z H Q { T b 1 in , T b 2 in , m ˙ q 3 in } , z Q H { T b 1 in , m ˙ q 2 in , T b 3 in } and z 2 H { T b 1 in , T b 2 in , T b 3 in } . For the catalyst beds of each reactor system, T b out is the outlet temperature limited by the constraint. For bed b { 1 , 2 } , T b out is maintained to 773 K and for bed 3, exit temperature is maintained to 90 % of the equilibrium temperature T EQ to limit the catalyst bed size [32]. The effectiveness ε H E of heat exchangers H E { 1 , 2 , 3 } of the respective reactor system are calculated by Equations (5) and/or (6) at optimum design conditions, and are later used in the off-design performance analysis for identifying the unknown stream temperatures.

System Boundary II

The initial composition of the fresh feed stream ① is taken from Cheema & Krewer [20], so performance of the ammonia synthesis loop shown in Figure 3 can be compared with regarding to design variants shown in Figure 2. A fresh feed is considered free of impurities, such as O2 and H2O; however, fresh supply of N2 with 2 mol % ( 2.85 wt %) of Ar (inert gas) is considered. Ratio of Ar-to-N2 in the fresh feed ① remains fixed for design and off-design performance analysis. Thus, x A r , = 0.0285 x N 2 , and x H 2 , = 1 x N 2 , x A r , , which can be placed in Equation (7) of a respective component. This transforms Equation (7) for c {N2, H2, Ar} as follows:
m ˙ N 2 , m ˙ N 2 , + p m ˙ N 2 , x N 2 , m ˙ = 0 ,
m ˙ H 2 , m ˙ H 2 , + p m ˙ H 2 , ( 1 1.0285 x N 2 , ) m ˙ = 0 ,
m ˙ m ˙ + p m ˙ 0.0285 x N 2 , m ˙ = 0 ,
where the stream ③ and ④ components’ flow rates are taken from system boundary I and by solving Equations (11)–(13) simultaneously, p, x N 2 , and m ˙ will become known.

2.2.2. Off-Design Performance

It is pertinent to mention that the design variants shown in Figure 2 are designed in consideration of autothermal operation; therefore, it is also necessary that, for off-design performance analysis, the energy balance between heat of production and heat of consumption should be retained. For this purpose, the van Heerden [33] steady state stability approach has been adapted. For maintaining the energy balance between inlet and outlet streams of synthesis reactor systems, van Heerden divided a reactor system into two parts: heat of generation and heat of removal. For reaction, an S-shaped heat generation curve is yielded and for heat removal a straight line is yielded between temperature of the reactor system bed 1 inlet, T in and bed 3 outlet, T out (e.g., see Figure 5a, Figure 6 and Figure 7). The temperature rise between the catalyst beds is observed due to exothermic reaction. For autothermal operation, the intersection between two lines is necessary. Under several given operating conditions, one or multiple intersection points between two lines exist. For example, for the reactor system consisting of single heat exchanger, i.e., 2Q, a heat removal line remains constant and therefore can intersect heat generation curve at three different steady state points, see Figure 5a. The lower and upper steady state points are stable, due to higher temperature operation upper point results in maximum reactants’ conversion and therefore is desired. The middle steady state point is unstable, as with a small decrease in temperature, the heat of generation will decline until the new intersection point between heat generation curve and heat removal line, whereas, for a small increase in temperature, the heat of generation rises until the new intersection point between heat generation and removal lines. On the other hand, for reactor systems with multiple heat exchangers, e.g., HQ, QH, 2H-2 and 2H-3 only one intersection point between heat removal and generation lines exist. As lines of the heat exchangers other than primary heat exchangers in reactor systems HQ, QH, 2H-2 and 2H-3 do not remain fixed, e.g., HE 1 of reactor systems HQ and QH (see Figure 6), HE 1 and HE 3 of reactor system 2H-2, and HE 1 and HE 2 of reactor 2H-3 (see Figure 7) changes with the inlet temperature. Therefore, heat removal line (HE 1) intersects the heat generation curve at one point only.

System Boundary I

For identifying the reactor systems’ minimum and maximum gross ammonia production, in addition to Equations (1)–(4) for catalyst bed and mixer, we implemented equality and inequality constraint Equations (5), (6), (14) and (15) for heat exchanger and temperature range (see discussion below). This yields the following optimisation problem:
MIN | MAX z , R S μ ˙ NH 3 = m ˙ NH 3 , m ˙ NH 3 , , subject to Equations ( 1 ) ( 4 ) ( reactor system ) , Equations ( s ) and / or ( 6 ) ( heat exchanger ) ,
623 K T b in < T b out 803 K | T EQ
T b 1 in + Δ T MIN T b 3 out
where μ ˙ N H 3 is the gross NH3 production for reactor systems R S {2Q, HQ, QH, 2H}. All reactor systems have the following process variables: inert gas concentration in process feed, process feed mass flow rate, and reactants ratio in process feed z , R S { y Ar | m ˙ | y H 2 : y N 2 } , R S . For comparing their single impact on ammonia production flexibility, only one process variable is manipulated at a time and the others are fixed. Furthermore, T b 1 in is set free for all the reactor systems (and in addition T cold out for reactor system 2H-3 only), and the value is selected by the optimiser itself with respect to constraints. In comparison to the design performance analysis, for off-design performance analysis, the operational temperature range of catalyst beds can be increased by up to 80 K; see Equation (14). For example, for an iron-based catalyst, the upper temperature limit is 803 K and the lowest temperature is 623 K below which the reaction rate is too low [6]. In all the heat exchangers of the reactor systems, a minimum temperature difference is necessary to guarantee sufficient heat transfer between two streams. Usually, the practical minimum temperature difference is between 10 and 20 K [28]; here, for H E R S { 1 , 2 , 3 } R S , a Δ T MIN = 20 K limitation is implemented.

System Boundary II

Similar to design performance, Equations (11)–(13) are used for calculating material balance of the process streams of ammonia synthesis loop for off-design performance. However, for maximisation of NH3 by zero Ar gas in a synthesis loop, the fresh feed gas is also considered free of Ar gas. Despite the higher operational cost, pure N2 is achievable by pressure swing adsorption or cryogenic distillation [34]. Flexibility for NH3 production m ˙ , H2 intake m ˙ H 2 , , process variables, recycle m ˙ and recycle to feed ratio ( m ˙ / m ˙ ) is defined as the relative change from the normal values:
Flexibility = Actual Normal Normal × 100 .

2.3. Problem Implementation

The simulations and optimisation problems are performed in MATLAB (2017b, The MathWorks Inc., Natick, MA, USA), where the system of equations is solved by the optimiser fmincon for system boundary I, and for the implementation of differential equations related to catalyst beds, the ODE solver (ode45) is used. For initialising the optimisation problem, initial guesses of design parameters and/or process variables are provided. Afterwards, the optimisation routine continues iteratively until the constraint conditions are met. As fmincon is a local optimiser, to check the credibility of the optimum solution the optimisation problem was repeatedly performed for multiple initial guesses of design parameters and process variables. The optimiser solves the problem for the system boundary I and afterwards transfers the optimised values to system boundary II for evaluating the overall material balances. In addition to previously mentioned equality and inequality constraints for design and off-design performances, total mass balance for system boundary I and II were implemented along with the condition that the sum of fractions of all components in all the streams of boundary I and II is equal to 1. Furthermore, autothermal operation is validated by assuring reactor systems operation at intersection point of heat generation and removal lines.

3. Results and Discussion

The results obtained for all design variants are presented and discussed in this section. First, reactor systems and synthesis loop design performance analysis are performed for maximum NH3 production; afterwards, off-design performance analysis are performed for minimum and maximum NH3 production by varying one process variable at a time. In off-design performance analysis, in addition to minimising and maximising NH3 production, stability analysis also needs to be performed for the variation of the three process variables: inert gas concentration, process feed flow rate and reactants ratio in fresh feed stream. Furthermore, flexibilities of NH3 production, H2 intake, process variable operation, recycle load and recycle to feed stream ratio for off-design performance of all design variants are analysed.

3.1. Design Performance

In this section, results obtained for the maximum NH3 production from the various reactor systems (system boundary I) and the synthesis loop (system boundary II) for the same initial conditions are presented and discussed. First, the optima for the three variables for the reactor systems R S {2Q, HQ, QH, 2H-2, 2H-3} are presented and discussed, followed by temperature-reactants conversion T X ¯ trajectories. Afterwards, the effectiveness of heat exchangers in reactor systems and the flow distribution within the synthesis loop are analysed at the operational point of maximum NH3 production.

3.1.1. System Boundary I

The maximum gross NH3 production resulting from the optimisation of the process variables inlet temperature of catalyst beds and/or quench stream flow rates are given in Table 2. It can be observed that reactor systems 2H-2 and 2H-3 result in the highest gross NH3 production. The primary reason for NH3 production difference among the reactor systems is their different residence time distribution: the higher the residence time distribution, the higher the reactants conversion. For example, reactor systems 2H-2 and 2H-3 are the systems where the whole process feed passes through all three catalyst beds, therefore resulting in the highest reactants’ conversion.
Temperature progression and reactants conversion at a stoichiometric ratio along with the equilibrium line and operational (OP) line, i.e., for optimum operation of the reactor systems at 90% of equilibrium, see Figure 4. During design performance, reactor systems 2H-2 and 2H-3 resulted in the same optimum values, and therefore are displayed as one system i.e., 2H. As the stoichiometric ratio of H2-to-N2 is fixed, their conversion profiles overlap each other and therefore are represented by one line only. Due to the exothermic reaction, temperature increases along with the reactants conversion in the catalyst beds. All the reactor systems are operated at the maximum possible temperature or reactants conversion, which is evident from Figure 4, as for beds 1 and 2 maximum temperature and for bed three maximum conversion is reached. Overall, reactor systems 2H-2 and 2H-3 (2H) result in the highest reactants conversions of 26.77%, whereas the reactor systems QH, HQ and 2Q achieve 0.47%, 1.56% and 2.09% less conversion, respectively.
It can be observed from Figure 4 that, for heat exchanger and quench-based cooling, the temperature-reactants conversion T X ¯ trajectory shifts away from the equilibrium. Furthermore, the impact of the interstage heat exchangers and mixers (dash dotted lines) can also be differentiated, whereas, for the heat exchanger-based cooling, only temperature decreases and, for the quench-based cooling, reactants’ conversion also decreases.
The effectiveness of the heat exchangers for optimum NH3 production of reactor systems 2Q, HQ, QH, 2H-2 and 2H-3 is presented in Table S5. Later, for off-design performance analysis, the above-mentioned effectivenesses of the heat exchangers are kept constant and used for calculating the unknown temperature of a required stream by using Equation (5) or (6)

3.1.2. System Boundary II

The identified optimal temperatures and feed distributions for the various reactor systems are integrated in the synthesis loop, and the flow distribution for the overall synthesis loop is calculated. The overall ammonia synthesis loop material balance is performed by Equations (11)–(13) and results are presented in Table 3. It can be observed that, with an increase in the ammonia production ⑦ fresh feed intake ① also increases along with purge percentage and recycle stream ② load decreases. The reactor systems 2H and QH are able to produce ca. 10 and 8 kg/h more NH3 than the reactor system 2Q. However, this higher NH3 production requires ca. 11 and 9 kg/h more fresh feed intake than reactor system 2Q. Furthermore, an increase in fresh feed ① also increases the amount of inert gas in the synthesis loop; as a consequence, purge ⑥ also increases by 8%. Furthermore, it is observed that, with increase in NH3 production, a more efficient separator is also required, to maintain a constant process feed ③ composition. For a fair design performance comparison among all the design variants, equilibrium (EQ) and operational (OP) lines (see Figure 4) are maintained by keeping the process feed ③ composition constant by using a simple split type model for the NH3 separator.
All in all, all five reactor systems show relatively similar performance with less than 10% deviation from each other. They are thus in principle all suitable for operation at their nominal point.

3.2. Off-Design Performance

In the following section, analysis is performed to determine whether all five design variants are also operable under off-design operation, which would be important for power-to-ammonia operation. Therefore, the load range i.e., minimum and maximum NH3 production capacities of the design variants (system boundary I) and synthesis loop (system boundary II) are investigated by varying one process variable at a time in the process feed stream: z , R S { y Ar | m ˙ | y H 2 : y N 2 } , R S .

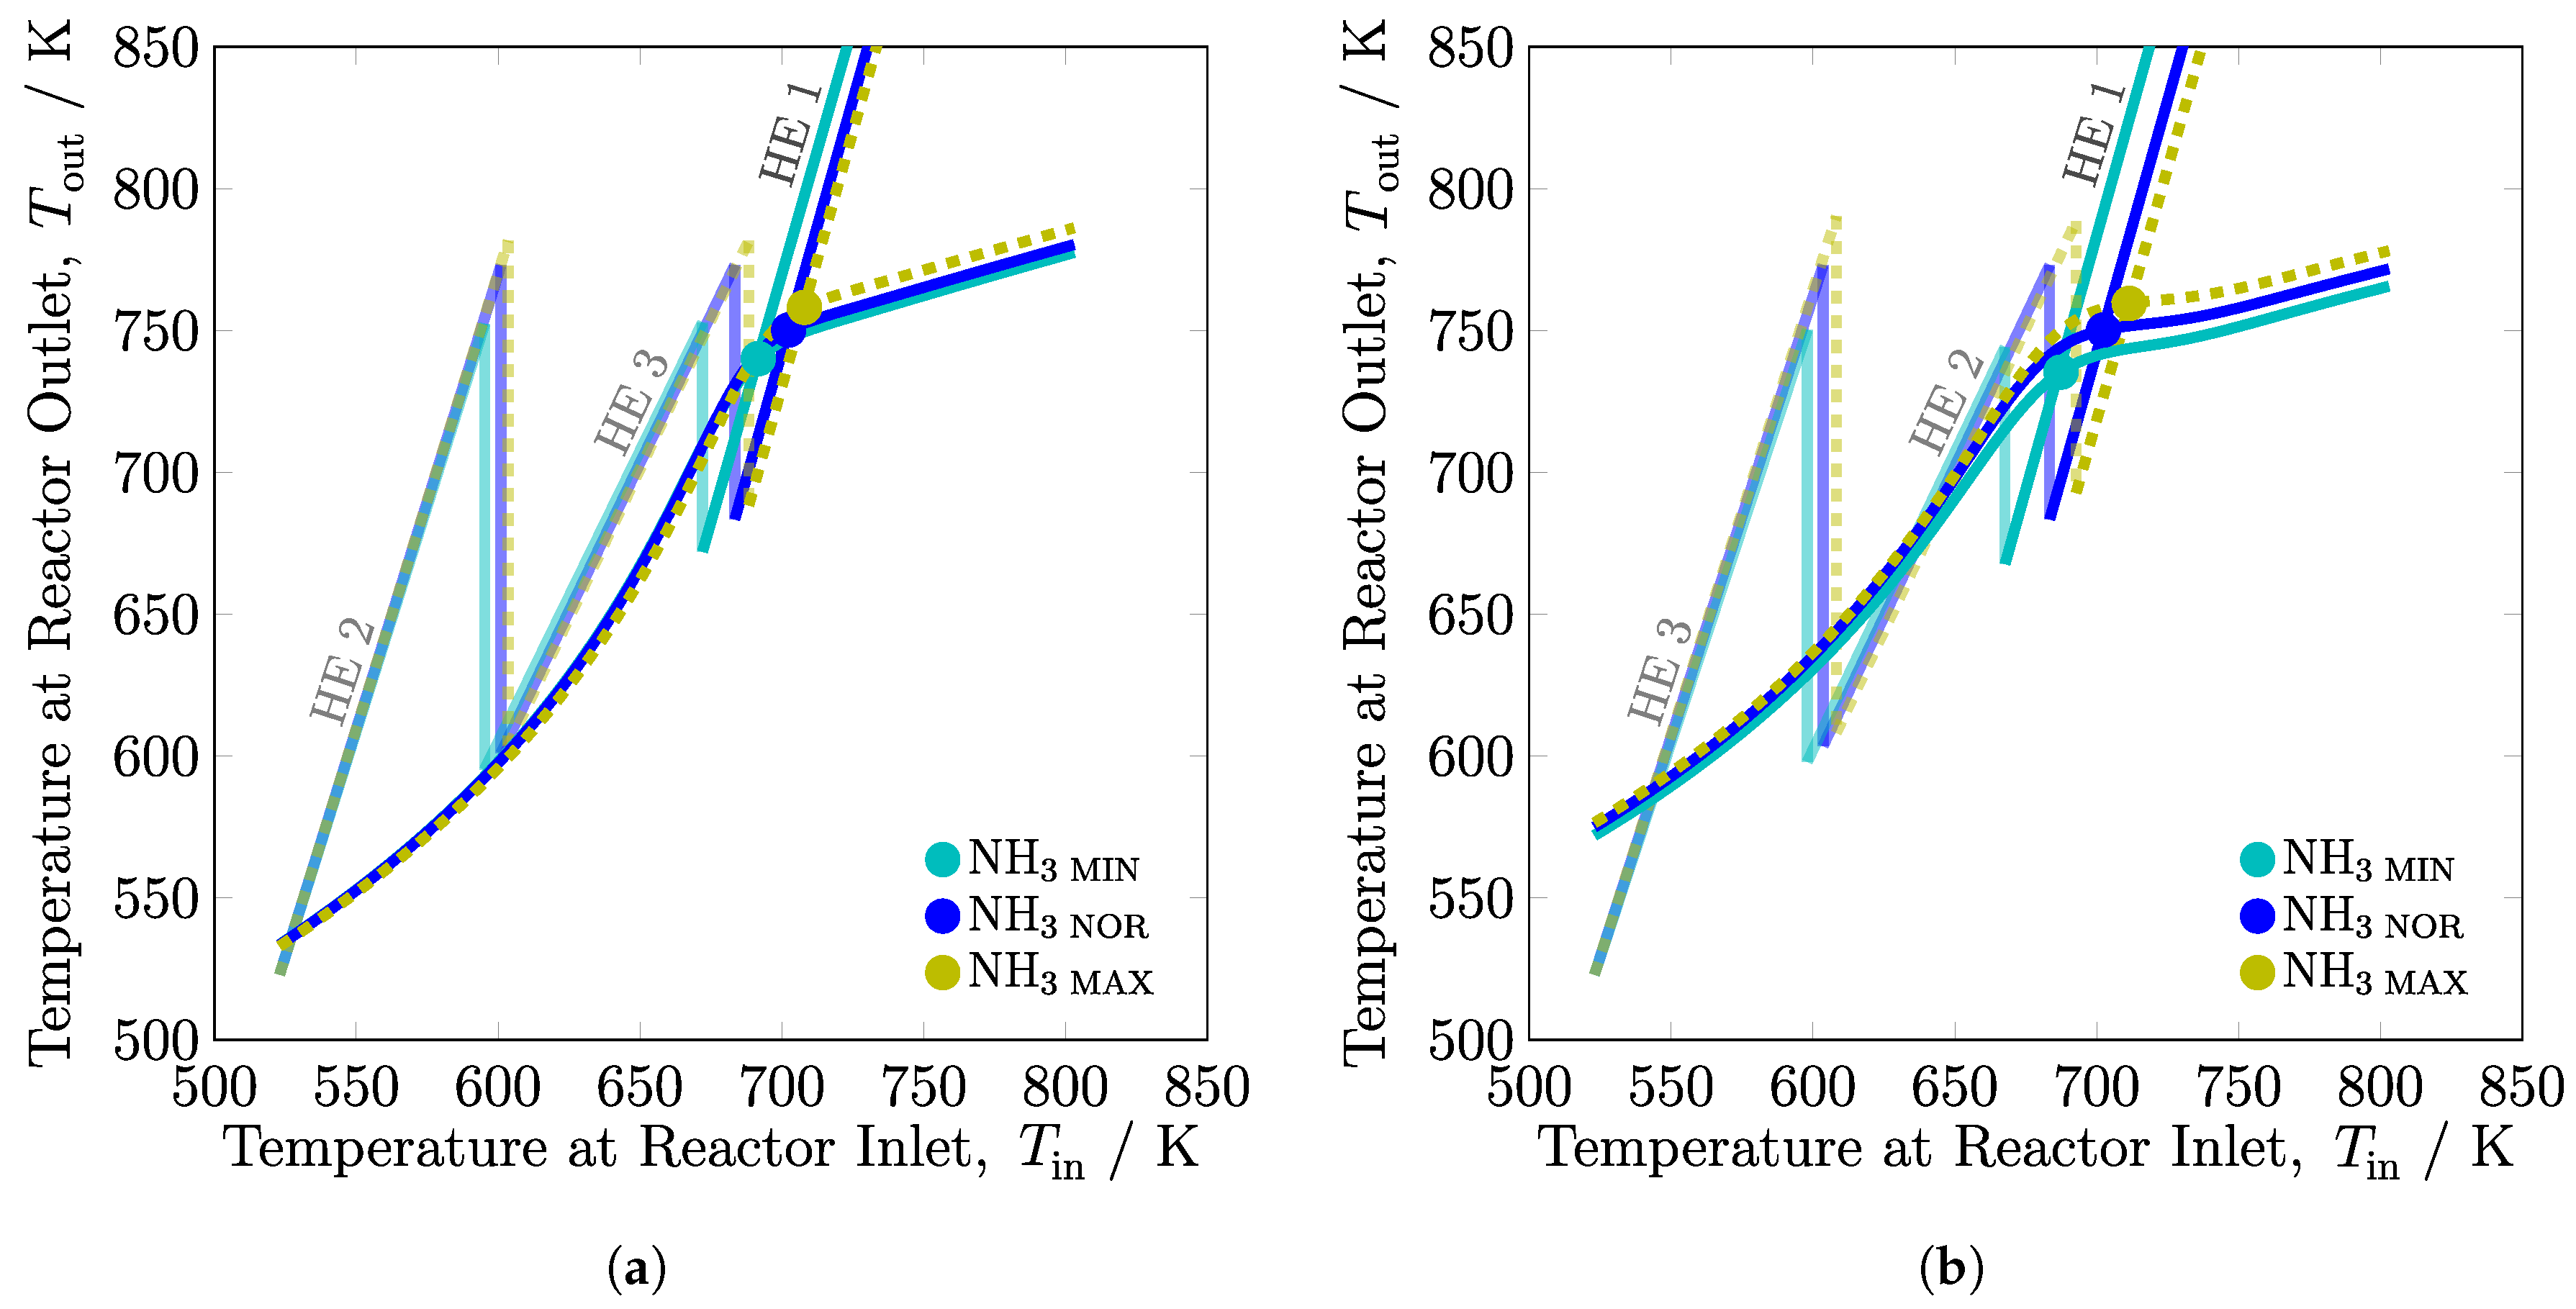
3.2.1. System Boundary I

The minimum and maximum NH3 production resulting from optimising the process variables inert gas concentration, feed flow rate and reactants ratio for reactor systems are given in Table 4. It can be observed for all the reactor systems that maximum NH3 production is achieved for zero inert gas and that the reactants ratio for maximum NH3 production varies only slightly from the stoichiometric ratio. With an increase in feed flow rate, NH3 production increases, but conversion of the reactants decreases (see Figures S3 to S7 in supplementary materials) due to less residence time distribution. On the other hand, at ratios other than stoichiometric ratios of reactants, NH3 production must decrease; however, for NH3 production maximisation by varying ratio of reactants, for reactor systems QH, 2H-2 and 2H-3 minor increase in inlet temperatures is observed; therefore, NH3 production also increases slightly; see Figures S10 to S12 in supplementary materials and Table 4. For minimising NH3 production in all the reactor systems, among the three process variables, H2-to-N2 ratio in process feed has the highest impact, followed by Ar concentration and mass feed flow rate. However, for maximising NH3 production, the trend isn’t clear, Ar concentration in process feed has the highest impact in all five reactor systems, followed by mass feed rate and H2-to-N2 ratio in the reactor systems 2Q, HQ and 2H-3, and in the reactor systems QH and 2H-2 H2-to-N2 ratio has higher impact than mass feed flow rate. Decrease in H2-to-N2 ratio allows one to obtain significantly lower NH3 production, independent of the system design, during renewable energy shortages, decreasing the H2 intake is beneficial, as it consumes more than 90 % of the energy of the power-to-ammonia process [21]. In all, five design variants, minimum H2-to-N2 ratio is restricted by the minimum catalyst bed temperature, i.e., 623 K (enforced by Equation (14)), which is evident from Figures S8b, S9b, S10b, S11b and S12b in supplementary materials. For reactor systems 2Q and HQ, the minimum temperature is approached at an inlet of bed 2, and for reactor systems QH, 2H-2 and 2H-3, minimum temperature is achieved at inlet of bed 3. An increase in Ar concentration in the process feed also results in significantly lower NH3 production, which also means lower H2 intake. Practically, in real plants of ammonia synthesis, Ar concentration lies within the 0 to 30 mol % range [6]. However, in this work for minimum ammonia production, maximum Ar concentration remains below 13 mol % (see Table 4) that is preliminarily due to single parametric based optimisation and autothermal reactor system operation.
Furthermore, from the results of the minimum and maximum NH3 production from variations of process variables, Table 4, among three process variables, it is observed that only inert gas (Ar) provides operational possibility at both sides of the nominal value. Therefore, to understand the effect of a change in a process variable on overall steady-state characteristics of the reactor systems, Ar is considered for analysing the results. It is pertinent to mention that while varying Ar concentration in process feed, design-based H2-to-N2 ratio and NH3 concentration are maintained, i.e., stoichiometric ratio (3 mol of H2 to N2) and 4.17 mol %, respectively. First, the steady-state characteristics for the reactor system 2Q are presented and discussed, and afterwards for the other reactor systems.
The load range evaluation of the reactor system 2Q by varying the inert gas concentration in process feed is carried out by stability analysis and presented in Figure 5. For minimum, normal and maximum NH3 production, the heat generation curves intersect with the heat removal line (HE 1) at three points; see Figure 5a. For normal and maximum NH3 production, the optimum is located at the stable higher intersection point. Whereas, for the minimum NH3 production, the middle intersection is identified as an operational point. The argon free process feed for maximum NH3 production is satisfied with Cheema and Krewer [20] findings. However, the argon concentration in the process feed for minimum NH3 production is 11.62 mol %, which is 1.11 mol % lower than of Cheema & Krewer maximum argon concentration ( 12.73 mol %), as reactor system preferred to operate at lower inlet temperature and therefore resulted in much lower NH3 production. The reason for the difference between the two higher argon gas concentration lies in the different objective functions, as Cheema and Krewer work’s primary objective was to determine the operating envelope of process variables, whereas the objective of this work is to determine load range of the reactor systems by varying process variables. For argon gas concentration between 11.62 and 12.73 mol %, the reactor system will result in a slightly higher intersection point between the heat generation and heat removal lines. Inert gas concentrations higher than 12.73 mol % will result in less generation of heat than removal of heat, which is not suitable for autothermal operation of the reactor system. The reactor system would need additional heating.
Figure 5b,c, Figures S1 and S2 reveal the reactants conversion and temperature profiles along the catalyst beds of all design variants for variable argon concentration. In Figure 5b, Figures S1 and S2, it can be seen that, at a stoichiometric ratio, the conversion of the reactants H2 and N2 overlap each other. This correlates with temperature: for minimum NH3 production, the reactor system prefers to operate at lower temperatures in all three catalyst beds, whereas, for maximum NH3 production, it operates at only slightly higher temperatures than under normal operation in all catalyst beds; see Figure 5c, Figures S1 and S2. The reactants conversions for maximum NH3 production therefore remain quite similar to nominal conversions. However, the ammonia production rate increased significantly as the reactor systems were capable of intaking more reactants’ mass.
The load range results for the reactor systems HQ and QH are also analysed in-depth in Figure 6a,b, Figures S4, S5, S9 and S10. The behaviour of the heat generation curves is similar to the reactor system 2Q; however, the heat removal lines consist of two elements due to the presence of two heat exchangers: HE 1 and 2 for reactor system HQ, and HE 1 and 3 for the reactor system QH. In the reactor system HQ, the heat removal line related to HE 2 does not connect directly with reactor inlet and outlet streams, but it determines inlet temperature of HE 1. Likewise, in reactor system QH, the heat removal line related to HE 3 does not connect with reactor inlet and outlet streams, it determines inlet temperature of HE 1; see Figure 2. Furthermore, in Figure 6a,b, Figures S4a, S5a, S9a, and S10a, it can be seen that the heat removal lines of HE 2 and HE 3 for minimum, normal and maximum NH3 production overlap, as process feed inlet temperature and heat exchanger effectiveness are constant. In contrast, heat removal lines for HE 1 of the reactor systems HQ and QH are moved in parallel when varying ammonia production, due to variable cold side inlet temperature and constant effectiveness [20]. In comparison to reactor system QH, reactor system HQ is capable of significantly lowering NH3 production by using almost two times higher argon concentration in process feed; see Table 4. The possible reason behind this is design; due to quench-based cooling between catalyst beds 2 and 3, reactor system HQ is able to operate at a much lower temperature; see Figure 6 and Figure S1. On the other hand, for normal and maximum NH3 production, for all three variables: inert gas concentration, flow rate and reactants ratio, reactor system QH is capable of producing more NH3 than reactor system HQ. The obvious reason behind it is that reactor system QH has overall longer residence time distribution than reactor system HQ, as, for quench based cooling, the fresh feed enters between bed 1 and 2, instead of between bed 2 and 3; see Figure 2.
Finally, the reactor systems with heat exchangers, 2H-2 and 2H-3 are compared to see if omission of quenching and the sequence of the heat exchangers have an impact; see Figure 7, Figures S2, S6, S7, S11 and S12. It can be observed that the two reactor systems 2H-2 and 2H-3 differ in terms of heat exchangers arrangement. In the reactor system 2H-2, the process feed enters first in HE 2 at 523 K and afterwards enter HE 3 and 1 at the desired operational temperatures (Figure 7a), whereas in the reactor system 2H-3 the process feed first enters in HE 3 at 523 K and afterwards passes through HE 2 and 1 at desired operational temperatures (Figure 7b). The behaviour of the heat generation curves is quite similar to the other three reactor systems. In Figure 7a, for reactor system 2H-2, it can be seen that all three operational points are quite close to each other, whereas, for reactor system 2H-3 (see Figure 7b), the minimum NH3 production operational point is a a bit more distant, due to feasible for less temperature intake and therefore it should provide more provisions for operation at lower NH3 production and likewise more argon concentration in the process feed, which is also evident from Table 4. This characteristic makes the reactor system 2H-3 more feasible than the reactor system 2H-2 for power-to-ammonia application.
From the results of the minimum and maximum NH3 production from variations of process variables, Table 4 and from the steady-state characteristics of the reactor systems, i.e., Figure 5, Figure 6 and Figure 7 and Figures S1–S12 in supplementary materials, it is evident that, among three process variables for all five reactor systems, variation in Ar content provides operation possibility at both sides of the nominal value. Furthermore, Ar removal in process feed provides maximum NH3 production, whereas lower H2-to-N2 ratio provides minimum NH3 production.

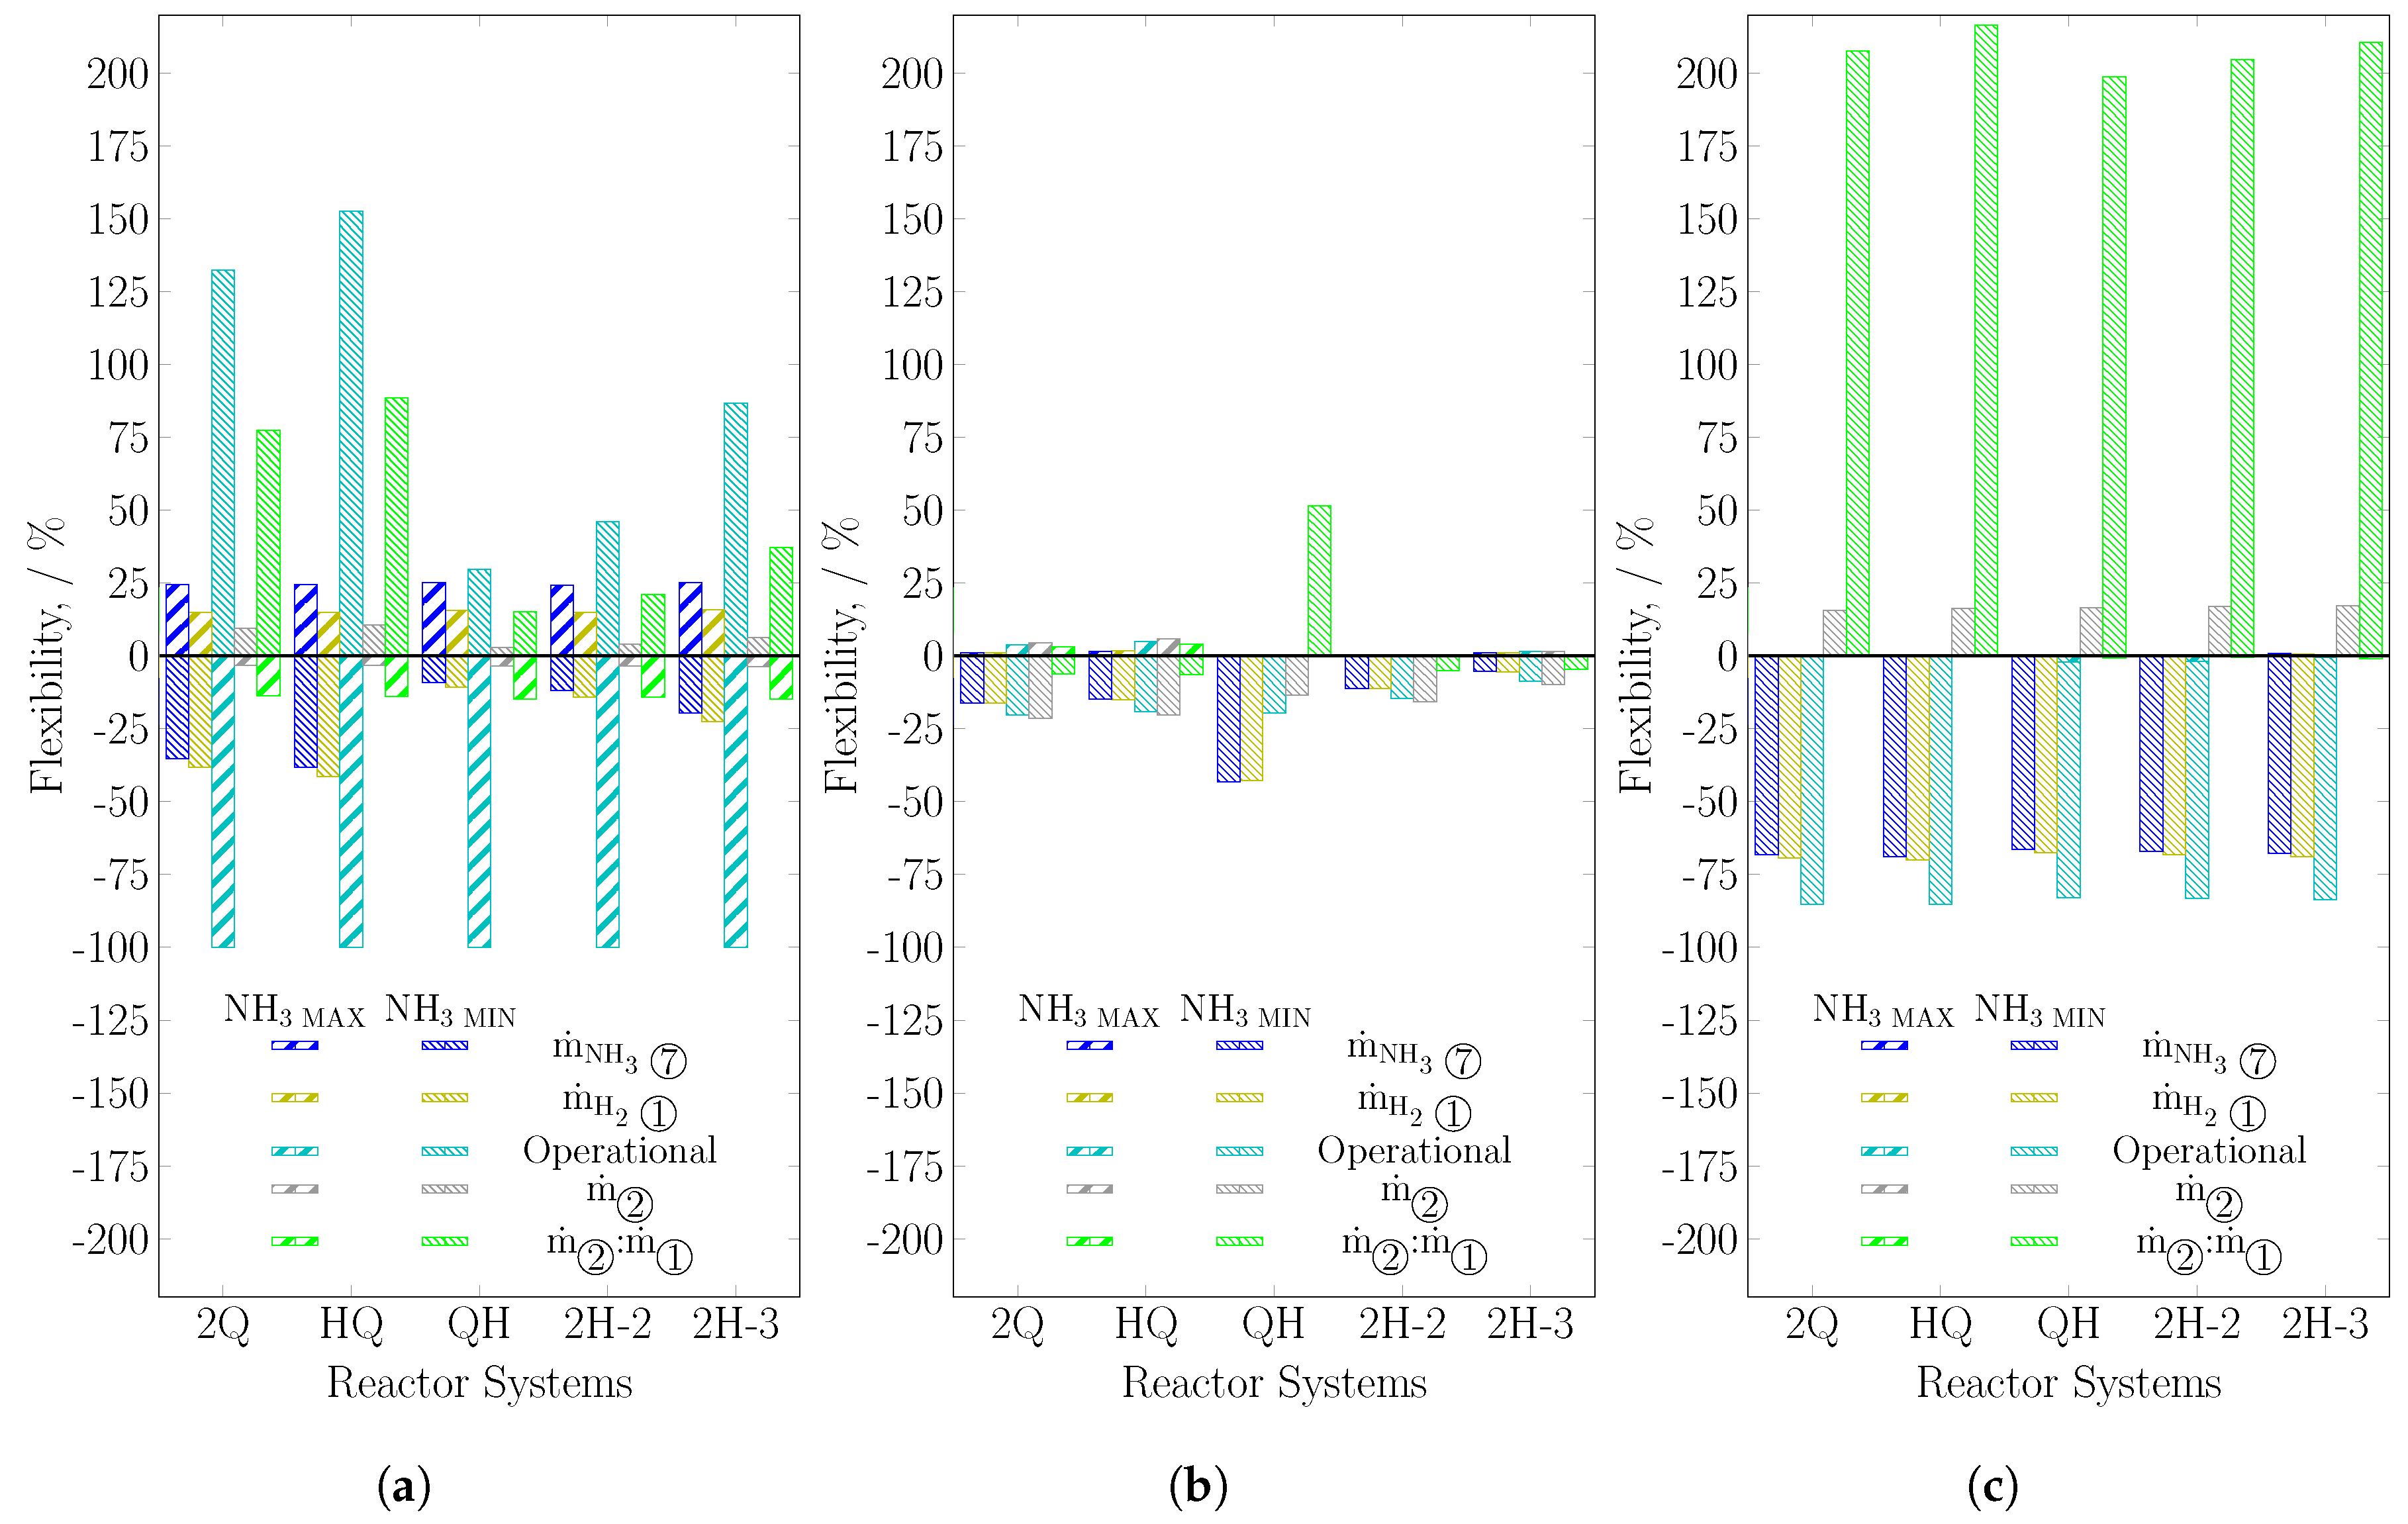
3.2.2. System Boundary II

For obtaining first-hand learning from this work for power-to-ammonia, it is important to have the visual comparison of the flexibility analysis of NH3 production, H2 intake, process variable operation, recycle load and recycle-to-feed ratio within the synthesis loop performed for all design variants with regards to the process variables; see Figure 8. It can be seen that in all variations NH3 production strongly correlates with H2 intake, i.e., with increase in NH3 production, H2 intake also increases. Recycle load and recycle-to-feed ratio are inversely proportional to NH3 production for variations in inert gas concentration and reactants ratio. In addition, NH3 production is inversely proportional to inert gas concentration, see Figure 8a. Furthermore, it can be seen that NH3 production does not significantly increase with varying feed flow rate (see Figure 8b) and reactants ratio (see Figure 8c), but it may be reduced. Only with inert gas concentration variation, NH3 production load can significantly increased and decreased. Among the reactor design variants, QH provides the strongest decrease in ammonia production when decreasing feed flow rate; however, it increases recycle-to-feed ratio, as with lower feed flow rate it also reduces inlet temperature and thus it reduces reactants conversion and enhances recycle load; see Figure S5a and S5b in supplementary materials.
After comparing results of optimisation for minimum and maximum NH3 production for three process variables from Figure 8a–c, it is concluded that changing the H2-to-N2 ratio has the most potential to reduce NH3 production by up to 70 %. The variations in Ar concentration and feed flow rate allow reduction by up to 40 % only and depend strongly on the reactor design. The reduction of NH3 through reactants ratio also reduces H2 intake significantly by 70%, and the reduction in H2 intake is quite useful for a renewable energy outage period. However, the inert gas (Ar) free synthesis loop can increase NH3 production by 25% in all design variants at the expense of 15% higher H2 intake from nominal value, which makes it feasible during excessive renewable energy availability. Additionally, Ar free fresh feed results in zero purging, which means 100 % recycling of unconverted reactants.

4. Conclusions and Outlook

This work presented a systematic analysis of five different autothermal ammonia synthesis reactor systems with regard to NH3 production minimisation and maximisation. From the results, it can be concluded that all five autothermic reactor systems are viable for power-to-ammonia process, as they can be operated for a wide range of ammonia production flexibilities. Among the five design variants, for minimum NH3 production by increasing Ar gas concentration in the synthesis loop, 2Q and HQ seem more significant. For mass feed flow rate, among all the design variants, QH provides significantly minimum NH3 production. Whereas for reactants ratio variation, all design variants behave quite similarly and the same is the case with a decrease in the inert gas concentration in the synthesis loop. This study showed that all the five reactor systems independent of design limitations are capable of operating over a wide load range by manipulating process variables.
In this work, minimisation and maximisation of NH3 production are considered by varying one process variable at a time for three-bed reactor systems. The variation in NH3 production can be further enhanced with consideration of multi-variable optimisation and by varying the number of catalyst beds involved in reactor systems. Furthermore, extending the thermodynamic model from reactor system to an overall synthesis loop can also find the effect of other bottlenecks, i.e., NH3 separator and recycle loop on NH3 production.

Supplementary Materials

The following are available at https://www.mdpi.com/2227-9717/8/1/38/s1, Table S1: Supporting equations for catalyst bed model; Table S2: Coefficients of C p c polynomial for Equation (S2); Table S3: Catalyst properties; Table S4: Supporting equations for shell and tube heat exchanger; Table S5: Data of heat exchangers used in reactor systems; Figure S1: Reactants conversion and temperature profiles for normal (NOR), minimum (MIN) and maximum (MAX) NH3 production by varying argon gas composition in (a) reactor system HQ and (b) reactor system QH; Figure S2: Reactants conversion and temperature profiles for normal (NOR), minimum (MIN) and maximum (MAX) NH3 production by varying argon gas composition in (a) reactor system 2H-2 and (b) reactor system 2H-3; Figure S3: Direct cooling by quenching reactor system (2Q) for normal (NOR), minimum (MIN) and maximum (MAX) NH3 production by varying process feed flow rate: (a) steady-state characteristics and (b) reactants conversion and temperature profiles; Figure S4: Combination of indirect and direct cooling reactor system (HQ) for normal (NOR), minimum (MIN) and maximum (MAX) NH3 production by varying process feed flow rate: (a) steady-state characteristics and (b) reactants conversion and temperature profiles; Figure S5: Combination of direct and indirect cooling reactor system (QH) for normal (NOR), minimum (MIN) and maximum (MAX) NH3 production by varying process feed flow rate: (a) steady-state characteristics and (b) reactants conversion and temperature profiles; Figure S6: Indirect cooling by inter-stage heat exchangers (with process feed exchanging heat first in HE 2) reactor system (2H-2) for normal (NOR), minimum (MIN) and maximum (MAX) NH3 production by varying process feed flow rate: (a) steady-state characteristics and (b) reactants conversion and temperature profiles; Figure S7: Indirect cooling by inter-stage heat exchangers (with process feed exchanging heat first in HE 3) reactor system (2H-3) for normal (NOR), minimum (MIN) and maximum (MAX) NH3 production by varying process feed flow rate: (a) steady-state characteristics and (b) reactants conversion and temperature profiles; Figure S8: Direct cooling by quenching reactor system (2Q) for normal(NOR), minimum (MIN) and maximum (MAX) NH3 production by varying reactants’ ratio: (a) steady-state characteristics and (b) reactants conversion and temperature profiles; Figure S9: Combination of indirect and direct cooling reactor system (HQ) for normal (NOR), minimum (MIN) and maximum (MAX) NH3 production by varying reactants’ ratio (a) steady-state characteristics and (b) reactants conversion and temperature profiles; Figure S10: Combination of direct and indirect cooling reactor system (QH) for normal (NOR), minimum (MIN) and maximum (MAX) NH3 production by varying reactants’ ratio: (a) steady-state characteristics and (b) reactants conversion and temperature profiles; Figure S11: Indirect cooling by inter-stage heat exchangers (with process feed exchanging heat first in HE 2) reactor system (2H-2) for normal (NOR), minimum (MIN) and maximum (MAX) NH3 production by varying reactants’ ratio: (a) steady-state characteristics and (b) reactants conversion and temperature profiles; and Figure S12: Indirect cooling by inter-stage heat exchangers (with process feed exchanging heat first in HE 3) reactor system (2H-3) for normal (NOR), minimum (MIN) and maximum (MAX) NH3 production by varying reactants’ ratio: (a) steady-state characteristics and (b) reactants conversion and temperature profiles.

Author Contributions

Conceptualization, I.I.C. and U.K.; methodology, I.I.C.; software, I.I.C.; formal analysis, I.I.C.; investigation, I.I.C.; resources, U.K.; data curation, I.I.C.; writing–original draft preparation, I.I.C.; writing–review and editing, I.I.C. and U.K.; visualization, I.I.C.; supervision, U.K.; project administration, I.I.C.; funding acquisition, I.I.C. All authors have read and agreed to the published version of the manuscript.

Funding

This research was funded by the German Academic Exchange Service (DAAD) and Higher Education Commission (HEC), Pakistan under the faculty development programme for the Universities of Engineering, Science and Technology (UESTP)—Germany under Grant No. 57076459. In addition, we also acknowledge support by the German Research Foundation and the Open Access Publication Funds of the Technische Universität Braunschweig.

Acknowledgments

In addition, Izzat Iqbal Cheema is also affiliated with the International Max Planck Research School for Advanced Methods in Process and Systems Engineering, Magdeburg, Germany.

Conflicts of Interest

The authors declare no conflict of interest.

Nomenclature

List of Symbols
C p Specific heat capacity / kJ kg−1 K−1
Δ H Heat of reaction / kJ kmol−1
m ˙ Mass flow rate / kg h−1
n ˙ Molecular flow rate / kmol h−1
PPressure / bar
pPurge fraction
R N H 3 Rate of reaction / kmol m−3 h−1
TTemperature / K
μ ˙ NH 3 Gross NH3 production / kg h−1
VVolume of catalyst bed / m3
XConversion of reactant / -
xMass fraction / -
YMole percentage / mol %
zAdjustable parameters
Greek Symbols
η Efficiency / %
ν Stoichiometric coefficient / -
ε Heat exchanger effectiveness / -
Subscripts
bCatalyst bed
H E Heat exchanger
mMixer
qQuench stream
rReactant
R S Reactor system
EQEquilibrium
inInlet
MAXMaximum
MINMinimum
NORNormal
outOutlet

References

  1. Morgan, E.; Manwell, J.; McGowan, J. Wind-powered ammonia fuel production for remote islands: A case study. Renew. Energy 2014, 72, 51–61. [Google Scholar] [CrossRef]
  2. Fuhrmann, J.; Hülsebrock, M.; Krewer, U. Energy storage based on electrochemical conversion of ammonia. In Transition to Renewable Energy Systems; Stolten, D., Scherer, V., Eds.; Wiley-VCH Verlag GmbH & Co. KGaA: Weinheim, Germany, 2013; Chapter 33; pp. 691–706. [Google Scholar] [CrossRef]
  3. Patil, A.; Laumans, L.; Vrijenhoef, H. Solar to ammonia—via Proton’s NFuel units. Procedia Eng. 2014, 83, 322–327. [Google Scholar] [CrossRef] [Green Version]
  4. Reese, M.; Marquart, C.; Malmali, M.; Wagner, K.; Buchanan, E.; McCormick, A.; Cussler, E.L. Performance of a small-scale Haber process. Ind. Eng. Chem. Res. 2016, 55, 3742–3750. [Google Scholar] [CrossRef]
  5. Science & Technology Facilities Council. Available online: https://stfc.ukri.org/news/uk-team-develop-worlds-first-green-energy-storage-demonstrator/ (accessed on 28 May 2019).
  6. Appl, M. Ammonia. In Ullmann’s Encyclopedia of Industrial Chemistry; Wiley-VCH Verlag GmbH & Co. KGaA: Weinheim, Germany, 2006. [Google Scholar] [CrossRef]
  7. Cinti, G.; Frattini, D.; Jannelli, E.; Desideri, U.; Bidini, G. Coupling Solid Oxide Electrolyser (SOE) and ammonia production plant. Appl. Energy 2017, 192, 466–476. [Google Scholar] [CrossRef] [Green Version]
  8. Sánchez, A.; Martín, M. Optimal renewable production of ammonia from water and air. J. Clean. Prod. 2018, 178, 325–342. [Google Scholar] [CrossRef]
  9. Wang, G.; Mitsos, A.; Marquardt, W. Conceptual design of ammonia-based energy storage system: System design and time-invariant performance. AIChE J. 2017, 63, 1620–1637. [Google Scholar] [CrossRef]
  10. Malmali, M.; Reese, M.; McCormick, A.V.; Cussler, E.L. Converting Wind Energy to Ammonia at Lower Pressure. ACS Sustain. Chem. Eng. 2018, 6, 827–834. [Google Scholar] [CrossRef]
  11. Strelzoff, S. Technology and Manufacture of Ammonia; John Wiley & Sons Inc: New York, NY, USA, 1981. [Google Scholar]
  12. Khademi, M.H.; Sabbaghi, R.S. Comparison between three types of ammonia synthesis reactor configurations in terms of cooling methods. Chem. Eng. Res. Des. 2017, 128, 306–317. [Google Scholar] [CrossRef]
  13. Luyben, W.L. Design and Control of a Cooled Ammonia Reactor. In Plantwide Control; John Wiley & Sons, Ltd: Hoboken, NJ, USA, 2012; pp. 273–292. [Google Scholar] [CrossRef]
  14. Gaines, L.D. Optimal Temperatures for Ammonia Synthesis Converters. Ind. Eng. Chem. Process Des. Dev. 1977, 16, 381–389. [Google Scholar] [CrossRef]
  15. Akpa, J.G.; Raphael, N.R. Optimization of an Ammonia Synthesis Converter. World J. Eng. Technol. 2014, 2, 305–313. [Google Scholar] [CrossRef] [Green Version]
  16. Elnashaie, S.S.; Abashar, M.E.; Al-Ubaid, A.S. Simulation and optimization of an industrial ammonia reactor. Ind. Eng. Chem. Res. 1988, 27, 2015–2022. [Google Scholar] [CrossRef]
  17. Elnashaie, S.; Alhabdan, F. A computer software package for the simulation and optimization of an industrial ammonia converter based on a rigorous heterogeneous model. Math. Comput. Model. 1989, 12, 1589–1600. [Google Scholar] [CrossRef]
  18. Azarhoosh, M.J.; Farivar, F.; Ale Ebrahim, H. Simulation and optimization of a horizontal ammonia synthesis reactor using genetic algorithm. RSC Adv. 2014, 4, 13419–13429. [Google Scholar] [CrossRef]
  19. Farivar, F.; Ebrahim, A. Modeling, Simulation, and Configuration Improvement of Horizontal Ammonia Synthesis Reactor. Chem. Prod. Process Model. 2014, 9, 89–95. [Google Scholar] [CrossRef]
  20. Cheema, I.I.; Krewer, U. Operating Envelope of Haber-Bosch Process Design for Power-to-Ammonia. RSC Adv. 2018, 8, 34926–34936. [Google Scholar] [CrossRef] [Green Version]
  21. Bañares-Alcãntara, R.; Dericks, G., III; Fiaschetti, M.; Grünewald, P.; Lopez, J.M.; Tsang, E.; Yang, A.; Ye, L.; Zhao, S. Analysis of Islanded NH3-Based Energy Storage Systems; Technical Report; University of Oxford: Oxford, UK, 2015. [Google Scholar]
  22. Faraoni, V.; Mancusi, E.; Russo, L.; Continillo, G. Bifurcation analysis of periodically forced systems via continuation of a discrete map. In European Symposium on Computer Aided Process Engineering-11; Gani, R., Jørgensen, S.B., Eds.; Elsevier: Amsterdam, The Netherlands, 2001; Volume 9, pp. 135–140. [Google Scholar] [CrossRef]
  23. Mancusi, E.; Maffettone, P.L.; Gioia, F.; Crescitelli, S. Nonlinear analysis of heterogeneous model for an industrial ammonia reactor. Chem. Prod. Process Model. 2009, 4, 1–23. [Google Scholar] [CrossRef]
  24. Rovaglio, M.; Manca, D.; Cortese, F.; Mussone, P. Multistability and robust control of the ammonia synthesis loop. In European Symposium on Computer Aided Process Engineering-11; Gani, R., Jørgensen, S.B., Eds.; Elsevier: Amsterdam, The Netherlands, 2001; Volume 9, pp. 723–730. [Google Scholar] [CrossRef]
  25. Elnashaie, S.S.E.H.; Elshishini, S.S. Modelling, Simulation and Optimization of Industrial Fixed Bed Catalytic Reactors; Gordon and Breach Science Publishers: Yverdon, Switzerland, 1993; Volume 7. [Google Scholar]
  26. Dyson, D.C.; Simon, J.M. Kinetic expression with diffusion correction for ammonia synthesis on industrial catalyst. Ind. Eng. Chem. Fundam. 1968, 7, 605–610. [Google Scholar] [CrossRef]
  27. Skogestad, S. Chemical and Energy Process Engineering; Taylor & Francis: Boca Raton, FL, USA, 2008. [Google Scholar]
  28. Sinnott, R.; Towler, G. Chemical Engineering Design: SI Edition; Chemical Engineering Series; Elsevier Science: Amsterdam, The Netherlands, 2009. [Google Scholar]
  29. Kakaç, S.; Liu, H.; Pramuanjaroenkij, A. Heat Exchangers: Selection, Rating, and Thermal Design, 3rd ed.; CRC Press: Boca Raton, FL, USA, 2012. [Google Scholar]
  30. Morud, J.C.; Skogestad, S. Analysis of instability in an industrial ammonia reactor. AIChE J. 1998, 44, 888–895. [Google Scholar] [CrossRef]
  31. Thirumaleshwar, M. Fundamentals of Heat and Mass Transfer; Always Learning; Pearson Education: London, UK, 2009. [Google Scholar]
  32. Nicol, W.; Hildebrandt, D.; Glasser, D. Crossing reaction equilibrium in an adiabatic reactor system. Dev. Chem. Eng. Miner. Process. 1998, 6, 41–54. [Google Scholar] [CrossRef]
  33. Van Heerden, C. Autothermic processes. Ind. Eng. Chem. 1953, 45, 1242–1247. [Google Scholar] [CrossRef]
  34. Schulte-Schulze-Berndt, A.; Krabiell, K. Nitrogen generation by pressure swing adsorption based on carbon molecular sieves. Gas Sep. Purif. 1993, 7, 253–257. [Google Scholar] [CrossRef]
Figure 1. Block diagram of the power-to-ammonia process with two options for the ammonia synthesis loop: for pure and dry feed (solid line), and for wet and impure feed (dashed line).
Processes 08 00038 g001
Figure 2. Three-bed autothermal ammonia synthesis reactor systems: (a) direct cooling by quenching (2Q); (b) combination of indirect & direct cooling (HQ); (c) combination of direct and indirect cooling (QH); (d) indirect cooling by heat exchange between process streams with feed entering first HE 2 (2H-2); (e) indirect cooling by heat exchange between process streams with feed entering first HE 3 (2H-3).
Processes 08 00038 g002
Figure 3. Haber–Bosch ammonia synthesis loop along with system boundaries I and II.
Processes 08 00038 g003
Figure 4. Temperature-reactants conversion T X ¯ trajectories for reactor systems 2Q, HQ, QH and 2H (2H-2 and 2H-3) along with equilibrium (EQ) and operational (OP) lines.
Processes 08 00038 g004
Figure 5. The reactor system 2Q (a) steady-state characteristics, (b) reactants conversion profiles and (c) temperature profiles for normal (NOR), minimum (MIN) and maximum (MAX) NH3 production by varying argon concentration.
Processes 08 00038 g005
Figure 6. Steady-state characteristics of the reactor systems (a) HQ and (b) QH for normal (NOR), minimum (MIN) and maximum (MAX) NH3 production by varying argon concentration.
Processes 08 00038 g006
Figure 7. Steady-state characteristics of the reactor systems (a) 2H-2 and (b) 2H-3 for normal (NOR), minimum (MIN) and maximum (MAX) NH3 production by varying argon concentration.
Processes 08 00038 g007
Figure 8. Overall NH3 production, H2 intake, operational (process variable), recycle load and recycle-to-feed ratio flexibilities for manipulable process variables: (a) Ar concentration, (b) feed flow rate and (c) H2-to-N2 ratio in the process feed of a synthesis loop for the design variants.
Processes 08 00038 g008
Table 1. Initial conditions and catalyst bed volumes [20].
Reactor Feed ③ Composition
YH2,③ /mol %YN2,③ /mol %YNH3,③ /mol %YAr,③ /mol %
68.1222.714.175.00
Reactor inlet ③ & normal operational conditions
m ˙ /kg h−1P/barT/K X r , /-
662.54200.00523.000.00
Volumes of catalyst beds
V b 1 /m3 V b 2 /m3 V b 3 /m3 V b Total /m3
0.00750.02210.04640.0760
Table 2. Optimal process variables (highlighted in grey colour) for the reactor systems and resulting maximum ammonia production rate (enclosed in rectangles).
m ˙ b1Tb1in m ˙ q2Tb2in m ˙ q3Tb3in μ ˙ NH3
RS/kg h−1/K/kg h−1/K/kg h−1/K/kg h−1
2Q [20]321.70673.00163.83673.00177.01673.00121.11
HQ495.80691.14-681.01166.74675.07123.70
QH454.65687.63207.89683.06-678.87129.08
2H-2662.54702.39-688.16-680.30131.38
2H-3662.54702.39-688.16-680.30131.38
Table 3. Flow distribution in synthesis loop for maximum NH3 production by varying temperatures and feed distributions in the catalyst beds of the reactor systems.
ReactorFresh FeedPurge PercentagePurge 1Recycle 1Product 1Separator Efficiency
Systems m ˙ p = m ˙ m ˙ × 100 m ˙ m ˙ m ˙ η NH 3 = m ˙ m ˙ NH 3 , × 100
/kg h−1/%/kg h−1/kg h−1/kg h−1/%
2Q [20]133.052.4113.05529.48120.0072.21
HQ135.822.4613.26526.70122.5672.63
QH141.582.5613.69520.95127.9073.44
2H144.042.6013.87518.49130.1773.78
1 For supportive equations, see Cheema and Krewer [20] supplementary information.
Table 4. Minimum and maximum NH3 production for variation of the process feed: inert gas concentration, flow rate and reactants ratio along with normal NH3 production.
Inert Gas ConcentrationFlow RateReactants Ratio
RSDesign andYAr,③ μ ˙ NH3 m ˙ μ ˙ NH3H2,③:N2,③ μ ˙ NH3
Off-Design/mol %/kg h−1/kg h−1/kg h−1/ mol of H 2 mol of N 2 /kg h−1
2QMIN 11.62 77.95 527.78 101.53 1.18 : 2.82 38.71
NOR [20] 5.00 121.11 662.54 121.11 3.00 : 1.00 121.11
MAX 0.00 149.50 687.70 122.44 2.998 : 1.002 121.11
HQMIN 12.63 75.88 535.26 105.34 1.23 : 2.77 38.63
NOR 5.00 123.70 662.54 123.70 3.00 : 1.00 123.70
MAX 0.00 152.58 696.56 125.67 3.003 : 0.997 123.70
QHMIN 6.48 117.16 532.30 73.22 1.36 : 2.64 43.35
NOR 5.00 129.08 662.54 129.08 3.00 : 1.00 129.08
MAX 0.00 160.11 661.02 129.09 2.98 : 1.02 129.64
2H-2MIN 7.30 115.30 565.20 116.84 1.34 : 2.66 43.39
NOR 5.00 131.38 662.54 131.38 3.00 : 1.00 131.38
MAX 0.00 161.87 662.68 131.38 2.99 : 1.01 131.76
2H-3MIN 9.33 105.25 604.34 124.36 1.31 : 2.69 42.49
NOR 5.00 131.38 662.54 131.38 3.00 : 1.00 131.38
MAX 0.00 163.00 672.42 132.83 2.996 : 1.004 132.40

