1. Introduction
The study of hydrogen peroxide attracts the interest of many researchers because this important substance finds many interesting applications. Hydrogen peroxide is a strong oxidant that can be easily handled because it is soluble in water. Besides its well-known pharmaceutical applications, it has been studied as an oxidant in the water cleaning processes, either alone or in the presence of Fe ions in Fenton processes [
1,
2,
3]. Hydrogen peroxide is also studied as a fuel for fuel cells [
4,
5,
6]. Consumption of H
2O
2 in a fuel cell is benign for the environment because it only releases oxygen and water. In addition to hydrogen peroxide fuel cells themselves, H
2O
2 can also be employed exclusively as an oxidant in combination with other fuels, for example, in direct methanol fuel cells [
7]. In view then of these interesting applications of hydrogen peroxide, it is also of interest to find ways to produce it in a sustainable manner. In the present work, production of H
2O
2 was studied by the photoelectrochemical route and by simultaneous consumption of materials derived from biomass. Solar energy can be then used as a source of energy, thus fulfilling the prerequisite of sustainable production. This idea of hydrogen peroxide production using organic sacrificial agents is quite new, and for this reason it is worth investigating.
Photoelectrochemical production of hydrogen peroxide is obtained in a photoelectrochemical cell by reduction of atmospheric oxygen. A standard photoelectrochemical cell is composed of a photoanode carrying a photocatalyst, where oxidation reactions take place, and a cathode electrode carrying an electrocatalyst, where reduction reactions take place. Absorption of light by the photoanode leads to generation of electrons and holes. Holes participate in oxidation reactions. In a standard photoelectrochemical operation, electrons are driven through an external circuit to the cathode, where they assist in reduction reactions. In the absence of any other sacrificial agent, water may be oxidized at the photoanode according to the following oxidation reactions [
8,
9,
10]:
In principle, the best known photocatalysts such as the presently used WO
3, produce holes with sufficient oxidative power to carry out both these reactions. However, Reaction (1) is a four electron process with lower probability, necessitating the presence of oxygen evolution co-catalysts [
11,
12]. Also, the electrochemical potential of Reaction (2) may be too high to be reached when the photocatalyst functions with high losses. For this reason, as will be shown, the functionality of the photoanode is facilitated in the presence of added sacrificial agents. Organic sacrificial agents are oxidized at lower potentials and, usually, by 2-electron processes. For example, oxidation of ethanol to acetaldehyde is obtained through the following reaction [
13,
14]:
Organic sacrificial agents may be byproducts of biomass or even biomass wastes; therefore, they may be employed as fuel supporting a sustainable operation. Indeed, photoelectrochemical operation in the present case was ensured in the presence of two characteristic biomass derivatives, ethanol and glycerol. Use of organic sacrificial agents to operate photoelectrochemical cells has been very popular, particularly in the sense that organic wastes and pollutants may be employed as fuel to produce electrical or chemical energy [
15,
16,
17].
Oxidation reactions at the photoanode consume holes, thus decreasing the possibility of electron–hole recombination. Meanwhile, electrons arriving at the cathode electrode assist, as already said, in reduction reactions. The purpose of the present work is to produce hydrogen peroxide. H
2O
2 is mainly produced in the presence of oxygen by reduction of the latter, according to the following reaction [
9,
10,
18]:
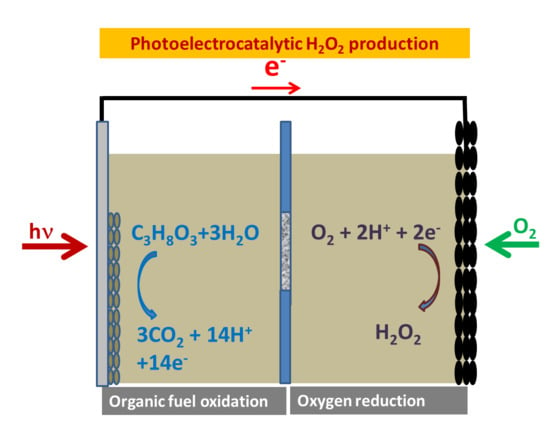
Reaction (2) suggests that hydrogen peroxide may also be produced at the photoanode; however, such a case is of very low probability, particularly in the presence of an added sacrificial agent, as this agent will preferably consume holes. Therefore, Reaction (4) defines the route for photoelectrochemical hydrogen peroxide production. A standard reactor for this purpose is schematically represented by the design of
Figure 1. The illustration at the photoanode oxidation reaction represents the case of ethanol. A corresponding reaction may be written also for glycerol, as described by the following schemes [
19,
20]:
These are overall reactions including several steps. For example, Reaction (3) is the first step of Reaction (5). The overall cell reactions can be obtained by combining (half-cell) Reaction (4) with each of the (half-cell) Reactions (5) or (6):
The differentiation between different fuels affects only the photoanode half-cell reaction, whereas the cathode half reaction is always the same, as expressed by Reaction (4). This is true as long as the anode and cathode compartments are separated by an ion transfer membrane, as illustrated in
Figure 1. In the present work, a Nafion membrane was used as separator of the two cell compartments.
Nanoparticulate WO
3 was presently used as a photocatalyst. WO
3 is a well-known material, frequently used in the past, with substantial absorption in the visible, thus producing a descent photocurrent. It is stable, has satisfactory charge carrier mobility, and functions in the presence of organic sacrificial agents, resulting in an increase of photocurrent [
21,
22]. Subsequently, it was considered appropriate for the present application. A carbon cloth loaded with carbon black (CB/CC) was used as a cathode electrode without any additives. Such an electrode provides a gas diffusion layer, allowing air-breathing and continuous supply of oxygen. As it will be seen below, such an electrode gave a satisfactory Faradaic efficiency and it did not necessitate additional noble electrocatalysts. Photoelectrocatalytic processes are rather slow and mainly depend on the capacity of the photoanode to produce charge carriers. As a result, CB/CC electrodes suffice to respond to the currents provided by a WO
3 photoanode.
2. Materials and Methods
Materials and electrode construction followed protocols established in previous publications [
18,
21,
22]. For this reason, details are given in the
Supplementary Information section. Briefly, the WO
3 film was deposited on an FTO (fluorine-doped tin oxide) transparent electrode (8 ohm/square, Pilkington, Doral, FL, USA) by first treating high purity tungsten powder (99.9%, Alpha Aesar GmbH, Karlsruhe, Germany, particle sizes up to 5 microns) with aqueous hydrogen peroxide, then mixing it with a surfactant, depositing the solution by spin coating, and finally calcining the film at 500 °C. Several layers were necessary to obtain a compact transparent film of about 300 nm thick. Thickness was roughly measured by the SEM image of a cross-sectional profile.
The apparatus used for photoelectrochemical measurements and hydrogen peroxide production is schematically represented by
Figure 1. It was made of Plexiglas and was divided into two compartments by a Nafion membrane (N117, Ion Power, Inc., Newcastle, DE, USA). The capacity of each compartment was 10 mL. Activation of the nafion membrane obeyed the following protocol: (1) heating for 1 h at 80 °C in 0.1 M H
2O
2, (2) heating for 1 h at 80 °C in double-distilled water, (3) treatment for 1 h at 80 °C in 0.1 M H
2SO
4, and cleaning again for 1 h at 80 °C in double-distilled water. The activated Nafion membrane was stored in double-distilled water. Both compartments of the cell had a window that was sealed by either the anode or the cathode electrode. The dimensions of each window was 1 cm
2 (1 cm × 1 cm) and this defined the active area of the electrodes. The photoanode was made of WO
3 nanoparticles deposited on an FTO transparent electrode (8 ohm/square, Pilkington, USA). Light passed through the FTO glass and fell on semiconductor nanoparticles from the electrode side. The cathode compartment window was sealed with the carbon cloth (Fuel Cell Earth, Wobum, MA, USA) electrode. The side of the electrode in contact with the electrolyte was covered with a hydrophobic layer made of carbon black (Vulcan XC72, Cabot Corp. Billerica, MA, USA). This layer acted as an electrocatalyst and prevented electrolyte leak thanks to its hydrophobicity. Both compartments were filled with 0.5 M aqueous NaClO
4 electrolyte. The fuel was added only in the anode compartment and was in all cases 5% w/w. Both anode and cathode compartments were exposed to the ambient atmosphere. The anode compartment could also accommodate, when necessary, an Ag/AgCl reference electrode.
Application of electric bias and current-voltage curves were traced with the help of an Autolab potentiostat PGSTAT128N. Hydrogen peroxide evolution was roughly monitored by test strips and accurately determined spectroscopically by a combination of permanganate and potassium titanium (IV) oxalate titration, a method described in detail in the
Supplementary Information section. Reflection–absorption spectra were recorded with a Shimadzu UV-2600 absorption spectrophotometer equipped with an integration sphere, Field-Emission Scanning Electron Microscope (FESEM) images with a Zeiss SUPRA 35 VP microscope and XRD patterns with a Siemens D-500 diffractometer, operating in Bragg–Brentano geometry with Cu-Kα
1 (λ = 1.5406 Å) and Cu-Kα
2 (λ = 1.5444 Å) radiation. Data were collected over the angular range 5° ≤ 2θ ≤ 80°, counting for 3 s at each step of 0.02° in detector position.
3. Results and Discussion
The photoanode electrode was made by deposition of a WO
3 film on FTO glass. This film was studied by scanning electron microscopy to register its nanostructure and by X-ray diffraction to appreciate its crystallinity. The results are shown in
Figure 2. The WO
3 film attained a mesoporous structure with size-polydisperse nanoparticles. The largest particle sizes mounted up to about 100 nm. The film was thus transparent. Despite its transparency, its light absorption characteristics were obtained by means of an integration sphere and its reflection–absorption spectrum is shown in
Figure 3, which reveals a light absorption capacity up to 450 nm. Such absorbance range indicates that the maximum photocurrent expected by such a photoanode is no more than 5 mA/cm
2 for irradiance equal to 1 sun, as can be seen in published charts [
19,
23]. The crystallization of the WO
3 was most probably in the monoclinic phase, the same as in previous studies where WO
3 films were deposited under similar conditions [
21,
22], even though XRD patterns were obtained by diffraction on a thin film with a lot of interference by the FTO background.
The counter electrode was made of carbon cloth with deposited carbon black. As already stated, this electrode was sufficiently performant for the present application. Such electrodes have been repeatedly characterized and used in the past [
18] for other purposes and were not modified for the present application.
The photoelectrochemical behavior of the above electrodes was studied in the reactor described above, functioning in the presence of 0.5 M aqueous NaClO
4 electrolyte. The choice of this electrolyte was only dictated by the fact that it was previously used [
21,
22] and functioned very well with WO
3 photocatalyst. Current density voltage curves were drawn in a three electrode configuration using Ag/AgCl as reference electrode. The reference electrode was in the anode compartment. The related data are presented in
Figure 4. The first interesting feature of
Figure 4 is the large increase of current when the organic fuel (ethanol or glycerol) was added to the reactor. The current was approximately doubled. This phenomenon, which demonstrated itself especially with WO
3, is known as the Current Doubling effect [
24]. It occurs due to two reasons. First, the presence of the fuel results in a more efficient (photogenerated) hole consumption, and therefore better electron–hole separation, hence the higher current. Indeed, in the absence of fuel, the current density at its maximum was around 3 mA cm
−2. Therefore, it fell short of the expected current density maximum corresponding to the WO
3 light absorption range (5 mA cm
−2, see above). In other words, there is room for increase of current by better electron–hole separation. The second reason is that (mainly) alcohols and polyols interact with holes and form transient radicals that inject electrons into the semiconductor conduction band, adding to the recorded current. Hence, a current increase beyond the expected maximum, that is, with more than 100% quantum efficiency, is then observed. Indeed the current reached 6 mA cm
−2 in that case. The maximum current in the diagram of
Figure 4 corresponds to about 1.7 V versus Ag/AgCl, that is, at the point just before electrolysis starts, as indicated by the dark current curve. The current doubling effect then resulted in a substantial photocurrent density in the presence of glycerol or ethanol. For this reason, production of hydrogen peroxide was studied in their presence. Other important features of
Figure 4 are the following: The small peak of current between about −0.3 to +0.3 V versus Ag/AgCl was due to a capacitance current originating in the adsorption of electrolyte cations into WO
3 porous structure. It was always observed with WO
3 photoanodes and it was found also in the dark (cf. [
18,
21,
22]). This property had no effect on photoanode behavior. Above +1.7 V versus Ag/AgCl, water electrolysis took place. The pure photocurrent region was then located between +0.3 and 1.7 V versus Ag/AgCl. Production of hydrogen peroxide was then effectuated by applying a bias of 1.5 V versus Ag/AgCl, where the system offered the highest possible current density and the current was pure photocurrent.
Use of three electrodes facilitated a photoelectrochemical study because it provided higher stability and better system control. However, practical applications of a photoelectrochemical device can be only envisaged in a two-electrode configuration comprising only a photoanode and a cathode electrode. For this reason, a current density–voltage curve was also traced by two electrodes (without a reference electrode).
Figure 5 presents such a plot, which was recorded in the presence of glycerol. This curve was traced in a light-chopping mode to specify the range of pure photocurrent, which extended between 0.25 and 2.0 V. Maximum photocurrent was again approximately 6 mA cm
−2. In rough terms, the two-electrode curve is similar to the curves of
Figure 4, but displaced to higher voltages. It is then safe to work with a three-electrode system, as long as the applied bias is within the photocurrent range. An important feature of
Figure 5 is the fact that no photocurrent can be produced without bias. Thus, the photocurrent was zero at 0 V and started, as already stated, above 0.25 V. This is a main disadvantage of the present system. A photoelectrochemical cell functioning with a WO
3 photoanode and a carbon black/carbon cloth (CB/CC) electrode functioned only under forward bias.
The above system performed very well under bias and efficiently produced hydrogen peroxide, thus verifying the model presented in the Introduction. It must be underlined at this point that production of hydrogen peroxide was only monitored under conditions of photocurrent generation. Thus, no measurements were made with forward bias larger than 2 V, where water was split and the situation became more complicated. Below 2 V in the dark, the current was 0. No H
2O
2 was detected in that case. The obtained data are presented in
Table 1 and
Figure 6. The concentration of hydrogen peroxide, which was detected in the electrolyte of the cathode compartment, continuously increased with time. By calculating the corresponding mass of hydrogen peroxide in the solution (solution volume equal to 10 mL), it was possible to calculate the average rate of H
2O
2 production, listed in the third column of
Table 1. It can be seen that the rate decreased with time. One main reason for this decrease is the consumption of the fuel, which also resulted in a decrease of the current, as seen in the fourth column of
Table 1. It must be underlined at this point that the quantity of produced hydrogen peroxide depended on the current flowing in the external circuit of the cell, according to Reaction (4). In the present case, the active area of the photoanode was 1 cm
2. A larger photoanode would have produced a higher current and, correspondingly, a larger quantity of hydrogen peroxide, thus a larger rate of H
2O
2 production (cf. data in [
18]). The theoretical value of current, which corresponded to a given quantity of hydrogen peroxide produced according to Reaction (4), can be calculated by the following relation:
1 µmole min−1 of a substance which is formed by 2 electrons per molecule, corresponds to 10−6 mole × 6.023 × 10²³ molecules mole−1 × 2 × 1.602 × 10−19 C molecule−1 × (60 s)−1 = 3.21 mA. By multiplying the values of column 3 by 3.21 and then dividing by the actual average current flowing in the device (column 4), the Faradaic efficiency for the electrochemical production of H
2O
2 was calculated, and it is listed in the fifth column of
Table 1. The Faradaic efficiency reached 74%, but suffered a decrease at the end of the measuring period. The decrease of the Faradaic efficiency should be exclusively related with the operational conditions in the cathode compartment and the stability of the counter electrode. This matter is under further investigation. When glycerol was substituted by ethanol, similar data were obtained, and because ethanol was isolated in the anode compartment by the nafion membrane, the Faradaic efficiency remained the same. It is noteworthy to make a comparison of the present data with previously published similar data [
18]. The Faradaic efficiency was practically the same, further justifying the choice of the inexpensive, noble-metal-free counter electrode in the present sample. In the previous work, the concentration of the electrochemically produced H
2O
2 appeared much lower. This was because the reactor was much larger and the quantity of hydrogen peroxide was then extensively diluted. For this reason it is preferable to list the rate of production rather than the concentration, which was affected by dilution. Indeed, the hydrogen peroxide electrochemical production rate obtained in the present work is listed in column 3 of
Table 1 and plotted in the diagram of
Figure 6, together with the corresponding average current. In this respect, it must be underlined that although the quantity of the current was mainly related to the capacity of the photoanode, the rate of hydrogen peroxide production mainly depended on the electrocatalytic capacity of the counter electrode. Thus, when no fuel was added in the anode compartment, the current was smaller and, as expected, hydrogen peroxide quantity was smaller, but it was produced by the same Faradaic efficiency.
Reproduction of the above data requires fresh electrodes and electrolytes. Some leaching of WO
3 from FTO electrodes was detected, whereas some salt deposit on carbon cloth electrodes could also be detected. It is possible that combination of WO
3 with other oxide semiconductors might improve photoanode stability [
25,
26], but this is a matter of future work.


